seizures of substances in tables i and ii of the 1988 ... · pdf filesafrole 0.912 sulphuric...
TRANSCRIPT

ANNEXES
65
Annex VIII
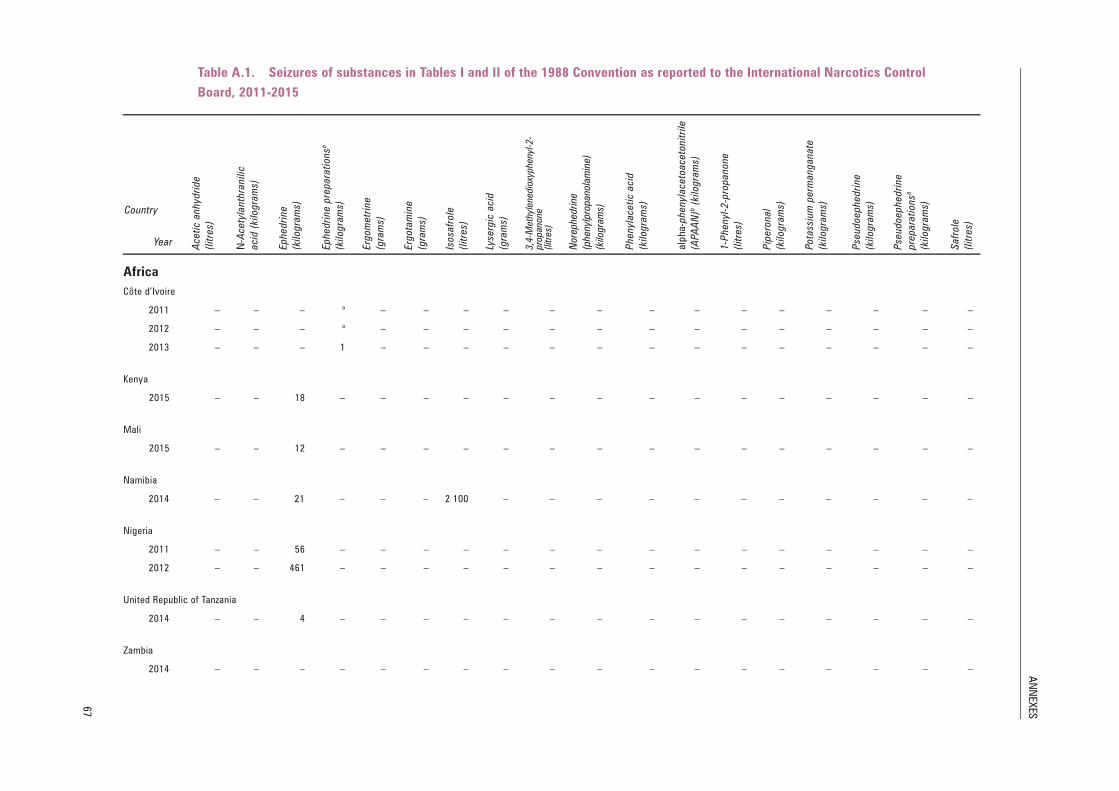
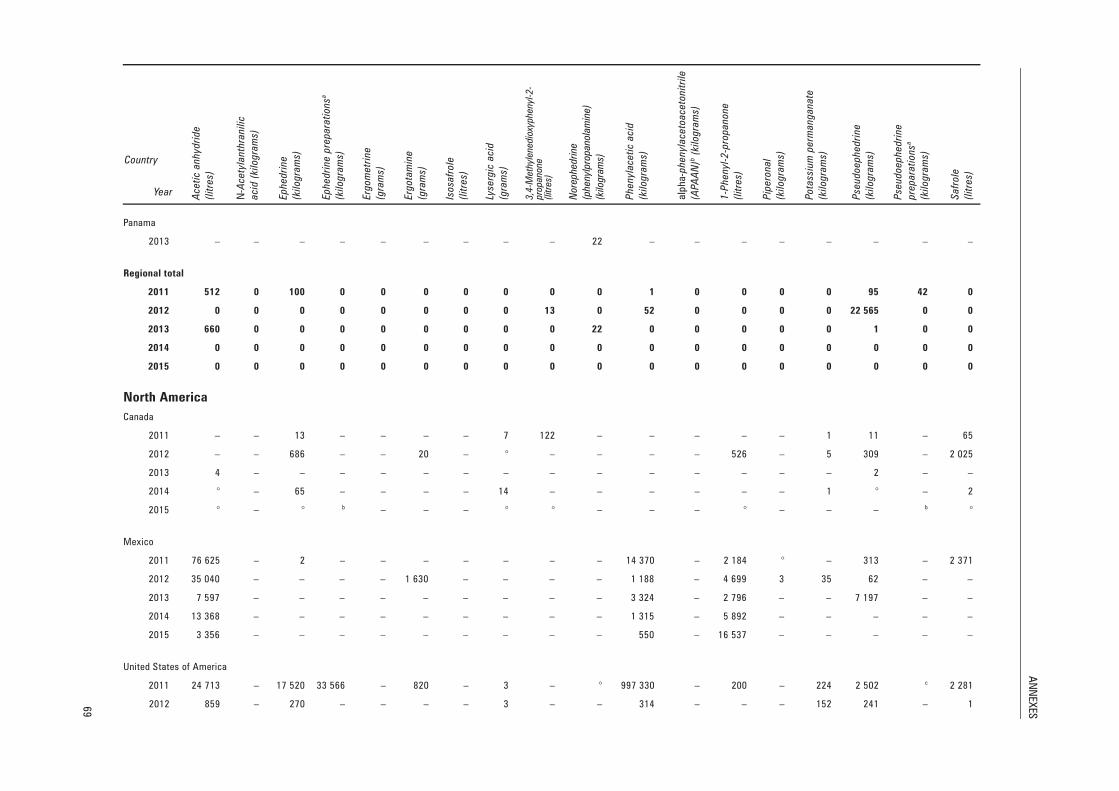
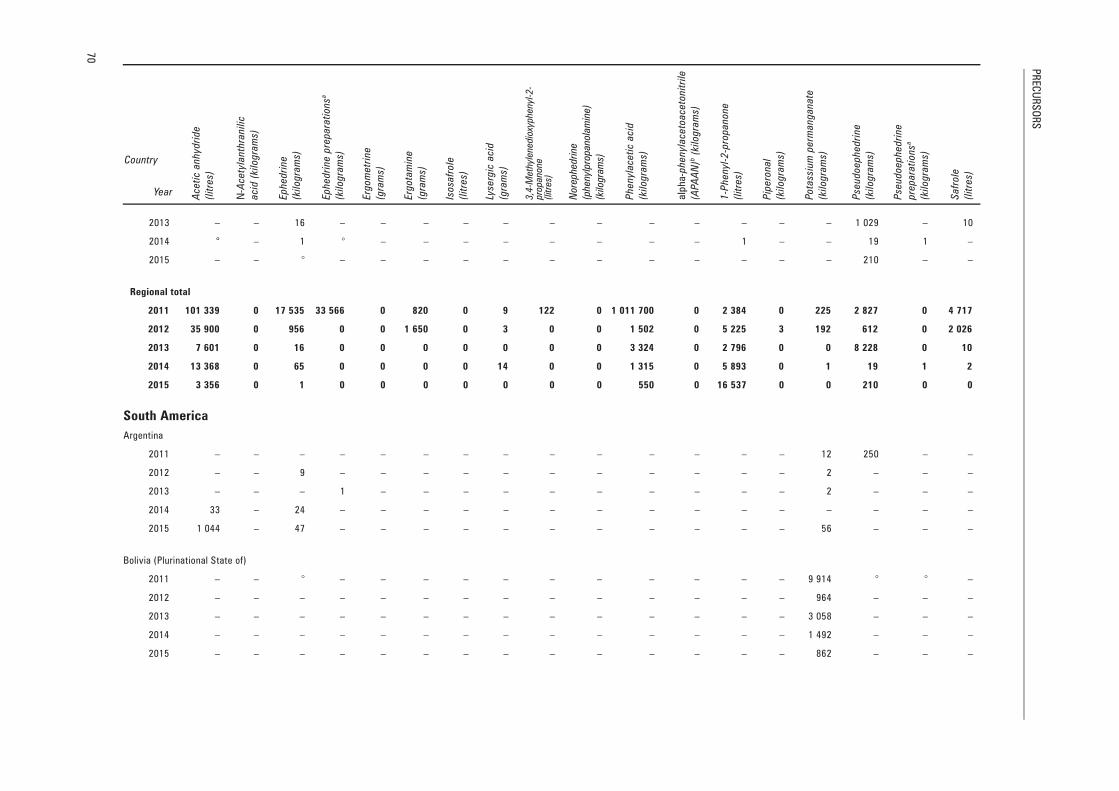
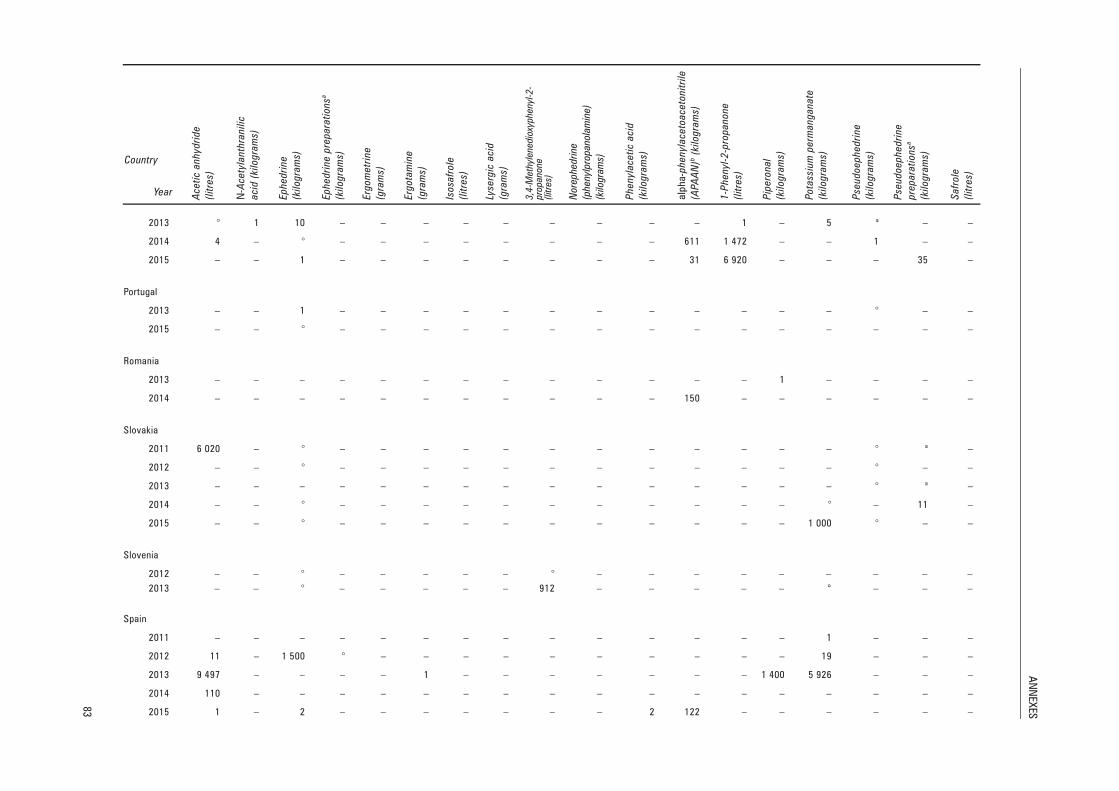
Seizures of substances in Tables I and II of the 1988 Convention, as reported to the International Narcotics Control Board, 2011-2015
1. Tables A.1 and A.2 below show information on seizures of the substances
included in Tables I and II of the United Nations Convention against Illicit Traffic
in Narcotic Drugs and Psychotropic Substances of 1988, furnished to the
International Narcotics Control Board by Governments in accordance with
article 12, paragraph 12, of the Convention.
2. The tables include data on domestic seizures and on seizures effected at points
of entry or exit. They do not include reported seizures of substances where it is
known that the substances were not intended for the illicit manufacture of drugs
(for example, seizures effected on administrative grounds or seizures of
ephedrine/pseudoephedrine preparations to be used as stimulants). Stopped
shipments are also not included. The information may include data submitted by
Governments through means other than form D; in such cases, the sources are duly
noted.
Units of measure and conversion factors
3. Units of measure are indicated for every substance. As fractions of full units
are not listed in the tables, figures are rounded as necessary.
4. For a variety of reasons, individual quantities of some substances seized are
reported to the Board using different units; for instance, one country may report
seizures of acetic anhydride in litres, another in kilograms.
5. To enable a proper comparison of collected information, it is important that
all data be collated in a standard format. To simplify the necessary standardization
process, figures are given in grams or kilograms where the substance is a solid and
in litres where the substance (or its most common form) is a liquid.
6. Seizures of solids reported to the Board in litres have not been converted into
kilograms and are not included in the tables, as the actual quantity of substance in
solution is not known.
7. For seizures of liquids, quantities reported in kilograms have been converted
into litres using the following factors:
Substance Conversion factor
(kilograms to litres)a
Acetic anhydride 0.926
Acetone 1.269
Ethyl ether 1.408
Hydrochloric acid (39.1% solution) 0.833
Isosafrole 0.892
3,4-Methylenedioxyphenyl-2-propanone 0.833
Methyl ethyl ketone 1.242
__________________
a Derived from density (The Merck Index (Rahway, New Jersey, Merck, 1989)).
PRECURSORS
66
1-Phenyl-2-propanone 0.985
Piperidine 1.160
Safrole 0.912
Sulphuric acid (concentrated solution) 0.543
Toluene 1.155
8. As an example, to convert 1,000 kilograms of methyl ethyl ketone into litres,
multiply by 1.242, i.e. 1,000 × 1.242 = 1,242 litres.
9. For the conversion of gallons to litres, it has been assumed that in Colombia
the United States gallon is used, with 3.785 litres to the gallon, and in Myanmar the
imperial gallon is used, with 4.546 litres to the gallon.
10. If reported quantities have been converted, the converted figures are listed in
the tables in italics.
11. The names of territories appear in italics.
12. A dash (–) signifies that the report did not include data on seizures of the
particular substance in the reporting year.
13. A degree symbol (°) signifies less than the smallest unit of measurement
shown for that substance (for example, less than 1 kilogram).
14. Discrepancies may exist between the regional total seizure figures and the
world total figures because the actual quantities seized were rounded to whole
numbers.
AN
NEX
ES
67
Table A.1. Seizures of substances in Tables I and II of the 1988 Convention as reported to the International Narcotics Control
Board, 2011-2015
Country
Year Ace
tic a
nh
ydri
de
(lit
res)
N-A
ce
tyla
nth
ran
ilic
acid
(ki
log
ram
s)
Ep
he
dri
ne
(kilo
gra
ms)
Ep
he
dri
ne
pre
pa
rati
on
sa
(kilo
gra
ms)
Erg
om
etr
ine
(gra
ms)
Erg
ota
min
e
(gra
ms)
Iso
safr
ole
(lit
res)
Lyse
rgic
acid
(gra
ms)
3,4
-Meth
ylenedio
xyphenyl
-2-
pro
panone
(litre
s)
Nore
phed
rine
(phenyl
pro
panola
min
e)
(kilo
gra
ms)
Ph
en
yla
ce
tic a
cid
(kilo
gra
ms)
alp
ha
-ph
en
yla
ce
toa
ce
ton
itri
le
(AP
AA
N)b
(ki
log
ram
s)
1-P
he
nyl
-2-p
rop
an
on
e
(lit
res)
Pip
ero
na
l
(kilo
gra
ms)
Po
tass
ium
pe
rma
ng
an
ate
(kilo
gra
ms)
Pse
ud
oe
ph
ed
rin
e
(kilo
gra
ms)
Pse
ud
oe
ph
ed
rin
e
pre
pa
rati
on
sa
(kilo
gra
ms)
Sa
fro
le
(lit
res)
Africa
Côte d’Ivoire
2011 – – – a – – – – – – – – – – – – – –
2012 – – – a – – – – – – – – – – – – – –
2013 – – – 1 – – – – – – – – – – – – – –
Kenya
2015 – – 18 – – – – – – – – – – – – – – –
Mali
2015 – – 12 – – – – – – – – – – – – – – –
Namibia
2014 – – 21 – – – 2 100 – – – – – – – – – – –
Nigeria
2011 – – 56 – – – – – – – – – – – – – – –
2012 – – 461 – – – – – – – – – – – – – – –
United Republic of Tanzania
2014 – – 4 – – – – – – – – – – – – – – –
Zambia
2014 – – – – – – – – – – – – – – – – – –

PR
ECU
RS
OR
S
68
Country
Year Ace
tic a
nh
ydri
de
(lit
res)
N-A
ce
tyla
nth
ran
ilic
acid
(ki
log
ram
s)
Ep
he
dri
ne
(kilo
gra
ms)
Ep
he
dri
ne
pre
pa
rati
on
sa
(kilo
gra
ms)
Erg
om
etr
ine
(gra
ms)
Erg
ota
min
e
(gra
ms)
Iso
safr
ole
(lit
res)
Lyse
rgic
acid
(gra
ms)
3,4
-Meth
ylenedio
xyphenyl
-2-
pro
panone
(litre
s)
Nore
phed
rine
(phenyl
pro
panola
min
e)
(kilo
gra
ms)
Ph
en
yla
ce
tic a
cid
(kilo
gra
ms)
alp
ha
-ph
en
yla
ce
toa
ce
ton
itri
le
(AP
AA
N)b
(ki
log
ram
s)
1-P
he
nyl
-2-p
rop
an
on
e
(lit
res)
Pip
ero
na
l
(kilo
gra
ms)
Po
tass
ium
pe
rma
ng
an
ate
(kilo
gra
ms)
Pse
ud
oe
ph
ed
rin
e
(kilo
gra
ms)
Pse
ud
oe
ph
ed
rin
e
pre
pa
rati
on
sa
(kilo
gra
ms)
Sa
fro
le
(lit
res)
Zimbabwe
2013 – – – 113 – – – – – – – – – – – – – –
2014 – – 70 – – – – – – – – – – – – – – –
Regional total
2011 0 0 56 0 0 0 0 0 0 0 0 0 0 0 0 0 0 0
2012 0 0 461 0 0 0 0 0 0 0 0 0 0 0 0 0 0 0
2013 0 0 0 114 0 0 0 0 0 0 0 0 0 0 0 0 0 0
2014 0 0 95 0 0 0 2 100 0 0 0 0 0 0 0 0 0 0 0
2015 0 0 31 0 0 0 0 0 0 0 0 0 0 0 0 0 0 0
Americas
Central America and the Caribbean
Belize
2013 660 – – – – – – – – – – – – – – – – –
El Salvador
2011 – – – – – – – – – – – – – – – – ° –
Guatemala
2011 512 – 100 – – – – – – – 1 – – – – 95 – –
Honduras
2011 – – – – – – – – – – – – – – – – 41 –
2012 – – – – – – – – – – – – – – – 22 565 – –
2013 – – – – – – – – – – – – – – – 1 – –
Nicaragua
2012 – – – – – – – – 13 – 52 – – – – – – –
AN
NEX
ES
69
Country
Year Ace
tic a
nh
ydri
de
(lit
res)
N-A
ce
tyla
nth
ran
ilic
acid
(ki
log
ram
s)
Ep
he
dri
ne
(kilo
gra
ms)
Ep
he
dri
ne
pre
pa
rati
on
sa
(kilo
gra
ms)
Erg
om
etr
ine
(gra
ms)
Erg
ota
min
e
(gra
ms)
Iso
safr
ole
(lit
res)
Lyse
rgic
acid
(gra
ms)
3,4
-Meth
ylenedio
xyphenyl
-2-
pro
panone
(litre
s)
Nore
phed
rine
(phenyl
pro
panola
min
e)
(kilo
gra
ms)
Ph
en
yla
ce
tic a
cid
(kilo
gra
ms)
alp
ha
-ph
en
yla
ce
toa
ce
ton
itri
le
(AP
AA
N)b
(ki
log
ram
s)
1-P
he
nyl
-2-p
rop
an
on
e
(lit
res)
Pip
ero
na
l
(kilo
gra
ms)
Po
tass
ium
pe
rma
ng
an
ate
(kilo
gra
ms)
Pse
ud
oe
ph
ed
rin
e
(kilo
gra
ms)
Pse
ud
oe
ph
ed
rin
e
pre
pa
rati
on
sa
(kilo
gra
ms)
Sa
fro
le
(lit
res)
Panama
2013 – – – – – – – – – 22 – – – – – – – –
Regional total
2011 512 0 100 0 0 0 0 0 0 0 1 0 0 0 0 95 42 0
2012 0 0 0 0 0 0 0 0 13 0 52 0 0 0 0 22 565 0 0
2013 660 0 0 0 0 0 0 0 0 22 0 0 0 0 0 1 0 0
2014 0 0 0 0 0 0 0 0 0 0 0 0 0 0 0 0 0 0
2015 0 0 0 0 0 0 0 0 0 0 0 0 0 0 0 0 0 0
North America
Canada
2011 – – 13 – – – – 7 122 – – – – – 1 11 – 65
2012 – – 686 – – 20 – ° – – – – 526 – 5 309 – 2 025
2013 4 – – – – – – – – – – – – – – 2 – –
2014 ° – 65 – – – – 14 – – – – – – 1 ° – 2
2015 ° – ° b – – – ° ° – – – ° – – – b °
Mexico
2011 76 625 – 2 – – – – – – – 14 370 – 2 184 ° – 313 – 2 371
2012 35 040 – – – – 1 630 – – – – 1 188 – 4 699 3 35 62 – –
2013 7 597 – – – – – – – – – 3 324 – 2 796 – – 7 197 – –
2014 13 368 – – – – – – – – – 1 315 – 5 892 – – – – –
2015 3 356 – – – – – – – – – 550 – 16 537 – – – – –
United States of America
2011 24 713 – 17 520 33 566 – 820 – 3 – ° 997 330 – 200 – 224 2 502 c 2 281
2012 859 – 270 – – – – 3 – – 314 – – – 152 241 – 1
PR
ECU
RS
OR
S
70
Country
Year Ace
tic a
nh
ydri
de
(lit
res)
N-A
ce
tyla
nth
ran
ilic
acid
(ki
log
ram
s)
Ep
he
dri
ne
(kilo
gra
ms)
Ep
he
dri
ne
pre
pa
rati
on
sa
(kilo
gra
ms)
Erg
om
etr
ine
(gra
ms)
Erg
ota
min
e
(gra
ms)
Iso
safr
ole
(lit
res)
Lyse
rgic
acid
(gra
ms)
3,4
-Meth
ylenedio
xyphenyl
-2-
pro
panone
(litre
s)
Nore
phed
rine
(phenyl
pro
panola
min
e)
(kilo
gra
ms)
Ph
en
yla
ce
tic a
cid
(kilo
gra
ms)
alp
ha
-ph
en
yla
ce
toa
ce
ton
itri
le
(AP
AA
N)b
(ki
log
ram
s)
1-P
he
nyl
-2-p
rop
an
on
e
(lit
res)
Pip
ero
na
l
(kilo
gra
ms)
Po
tass
ium
pe
rma
ng
an
ate
(kilo
gra
ms)
Pse
ud
oe
ph
ed
rin
e
(kilo
gra
ms)
Pse
ud
oe
ph
ed
rin
e
pre
pa
rati
on
sa
(kilo
gra
ms)
Sa
fro
le
(lit
res)
2013 – – 16 – – – – – – – – – – – – 1 029 – 10
2014 ° – 1 ° – – – – – – – – 1 – – 19 1 –
2015 – – ° – – – – – – – – – – – – 210 – –
Regional total
2011 101 339 0 17 535 33 566 0 820 0 9 122 0 1 011 700 0 2 384 0 225 2 827 0 4 717
2012 35 900 0 956 0 0 1 650 0 3 0 0 1 502 0 5 225 3 192 612 0 2 026
2013 7 601 0 16 0 0 0 0 0 0 0 3 324 0 2 796 0 0 8 228 0 10
2014 13 368 0 65 0 0 0 0 14 0 0 1 315 0 5 893 0 1 19 1 2
2015 3 356 0 1 0 0 0 0 0 0 0 550 0 16 537 0 0 210 0 0
South America
Argentina
2011 – – – – – – – – – – – – – – 12 250 – –
2012 – – 9 – – – – – – – – – – – 2 – – –
2013 – – – 1 – – – – – – – – – – 2 – – –
2014 33 – 24 – – – – – – – – – – – – – – –
2015 1 044 – 47 – – – – – – – – – – – 56 – – –
Bolivia (Plurinational State of)
2011 – – ° – – – – – – – – – – – 9 914 ° ° –
2012 – – – – – – – – – – – – – – 964 – – –
2013 – – – – – – – – – – – – – – 3 058 – – –
2014 – – – – – – – – – – – – – – 1 492 – – –
2015 – – – – – – – – – – – – – – 862 – – –

AN
NEX
ES
71
Country
Year Ace
tic a
nh
ydri
de
(lit
res)
N-A
ce
tyla
nth
ran
ilic
acid
(ki
log
ram
s)
Ep
he
dri
ne
(kilo
gra
ms)
Ep
he
dri
ne
pre
pa
rati
on
sa
(kilo
gra
ms)
Erg
om
etr
ine
(gra
ms)
Erg
ota
min
e
(gra
ms)
Iso
safr
ole
(lit
res)
Lyse
rgic
acid
(gra
ms)
3,4
-Meth
ylenedio
xyphenyl
-2-
pro
panone
(litre
s)
Nore
phed
rine
(phenyl
pro
panola
min
e)
(kilo
gra
ms)
Ph
en
yla
ce
tic a
cid
(kilo
gra
ms)
alp
ha
-ph
en
yla
ce
toa
ce
ton
itri
le
(AP
AA
N)b
(ki
log
ram
s)
1-P
he
nyl
-2-p
rop
an
on
e
(lit
res)
Pip
ero
na
l
(kilo
gra
ms)
Po
tass
ium
pe
rma
ng
an
ate
(kilo
gra
ms)
Pse
ud
oe
ph
ed
rin
e
(kilo
gra
ms)
Pse
ud
oe
ph
ed
rin
e
pre
pa
rati
on
sa
(kilo
gra
ms)
Sa
fro
le
(lit
res)
Brazil
2011 53 – – – – – – – – – – – – – 232 – 41 –
2012 1 878 – – – – – – – – – – – – – 278 – – –
2013 249 – – – – – – – – – – – – – 14 621 – – –
2014 – – – – – – – – – – – – – – 1 – – –
Chile
2015 – – – ° – – – – – – – – – – – – – –
Colombia
2011 – – – – – – – – – – – – – – 24 044 – – –
2012 11 – – – – – – – – – – – – – 55 677 – – –
2013 – – – – – – – – – – – – – – 21 873 – – –
2014 – – – – – – – – – – – – – – 166 291 – – –
2015 8 – – – – – – – – – – – – – 57 639 – – –
Ecuador
2011 – – – – – – – – – – – – 220 – 233 – – –
2014 – – – – – – – – – – – – – – 10 – – –
2015 – – – – – – – – – – – – – – 2 – – –
Paraguay
2013 – – – – – – – – – – – – – – 3 705 – – –
Peru
2011 – – – – – – – – – – – – – – 1 997 – – –
2012 – – – – – – – – – – – – – – 3 093 – – –

PR
ECU
RS
OR
S
72
Country
Year Ace
tic a
nh
ydri
de
(lit
res)
N-A
ce
tyla
nth
ran
ilic
acid
(ki
log
ram
s)
Ep
he
dri
ne
(kilo
gra
ms)
Ep
he
dri
ne
pre
pa
rati
on
sa
(kilo
gra
ms)
Erg
om
etr
ine
(gra
ms)
Erg
ota
min
e
(gra
ms)
Iso
safr
ole
(lit
res)
Lyse
rgic
acid
(gra
ms)
3,4
-Meth
ylenedio
xyphenyl
-2-
pro
panone
(litre
s)
Nore
phed
rine
(phenyl
pro
panola
min
e)
(kilo
gra
ms)
Ph
en
yla
ce
tic a
cid
(kilo
gra
ms)
alp
ha
-ph
en
yla
ce
toa
ce
ton
itri
le
(AP
AA
N)b
(ki
log
ram
s)
1-P
he
nyl
-2-p
rop
an
on
e
(lit
res)
Pip
ero
na
l
(kilo
gra
ms)
Po
tass
ium
pe
rma
ng
an
ate
(kilo
gra
ms)
Pse
ud
oe
ph
ed
rin
e
(kilo
gra
ms)
Pse
ud
oe
ph
ed
rin
e
pre
pa
rati
on
sa
(kilo
gra
ms)
Sa
fro
le
(lit
res)
2013 1 – – – – – – – – – – – – – 2 787 – – –
2014 15 – – – – – – – – – – – – – 2 735 – – –
2015 – – – – – – – – – – – – – – 53 – – –
Venezuela (Bolivarian Republic of)
2011 – – – 16 – – – – – – – – – – 100 – 3 –
2012 – – – – – – – – – – – – – – 2 447 – – –
2014 – – – – – – – – – – – – – – 1 120 – – –
2015 – – – – – – – – – – – – – – 1 554 – – –
Regional total
2011 53 0 0 16 0 0 0 0 0 0 0 0 220 0 36 532 250 44 0
2012 1 890 0 9 0 0 0 0 0 0 0 0 0 0 0 62 462 0 0 0
2013 250 0 0 1 0 0 0 0 0 0 0 0 0 0 46 046 0 0 0
2014 48 0 24 0 0 0 0 0 0 0 0 0 0 0 171 649 0 0 0
2015 1 052 0 47 0 0 0 0 0 0 0 0 0 0 0 60 166 0 0 0
Asia
East and South-East Asia
Cambodia
2011 – – 3 – – – – – – – – – – – – 6 – 2 058
Chinad
2011 16 946 – 4 210 – – – – – – – 4 520 – – – – 1 170 – –
2012 17 131 – 3 210 2 428 – – – – – – 30 – 259 – 29 927 – 902 –
2013 94 948 – 11 103 5 718 – 449 – – 18 – 6 552 – 5 434 – 3 521 908 – –
2014 22 635 – 31 576 3 222 – – – – 33 ° 49 651 – 3 241 – 2 120 – – –
2015 11 070 ° 23 480 221 – – – – ° 6 3 – 5 407 – 31 550 13 – –

AN
NEX
ES
73
Country
Year Ace
tic a
nh
ydri
de
(lit
res)
N-A
ce
tyla
nth
ran
ilic
acid
(ki
log
ram
s)
Ep
he
dri
ne
(kilo
gra
ms)
Ep
he
dri
ne
pre
pa
rati
on
sa
(kilo
gra
ms)
Erg
om
etr
ine
(gra
ms)
Erg
ota
min
e
(gra
ms)
Iso
safr
ole
(lit
res)
Lyse
rgic
acid
(gra
ms)
3,4
-Meth
ylenedio
xyphenyl
-2-
pro
panone
(litre
s)
Nore
phed
rine
(phenyl
pro
panola
min
e)
(kilo
gra
ms)
Ph
en
yla
ce
tic a
cid
(kilo
gra
ms)
alp
ha
-ph
en
yla
ce
toa
ce
ton
itri
le
(AP
AA
N)b
(ki
log
ram
s)
1-P
he
nyl
-2-p
rop
an
on
e
(lit
res)
Pip
ero
na
l
(kilo
gra
ms)
Po
tass
ium
pe
rma
ng
an
ate
(kilo
gra
ms)
Pse
ud
oe
ph
ed
rin
e
(kilo
gra
ms)
Pse
ud
oe
ph
ed
rin
e
pre
pa
rati
on
sa
(kilo
gra
ms)
Sa
fro
le
(lit
res)
China, Hong Kong SAR
2012 – – – – – – – – – – – – – – – 33 – –
2013 – – 41 – – – – – – – – – – – – 34 27a –
China, Macao SAR
2012 – – – 167 – – – – – – – – – – – – – –
2014 – – – ° – – – – – – – – – – – – – –
Indonesia
2011 – – – a – – – – – – – – – – – – 40 –
2012 – – 4 a – – – – – 4 – – – – – – – –
2013 – – ° – – – – – – – – – – – – – – 257
2014 – – ° a – – – – – – – – – – – – – –
2015 – – – ° – – – – – – – – – – – – a –
Japan
2013 – – – 1 – – – – – – – – – – – – – –
2014 – – 5 – – – – – – – – – – – – – – –
2015 – – – – – – – – – – – – – – – 6 – –
Lao People’s Democratic Republic
2013 – – – 3 – – – – – – – – – – – – – –
Malaysia
2011 – – 109 – – – – – – – – – – – – 903 – 7 675
2012 – – – 91 – – – – – – – – – – – 5 – –
2013 – – 66 90 – – – – – – – – – – – – 63 –
2014 – – – 33 – – – – – – – – – – 1 287 112 –
2015 – – 75 – – – – – – – – – – – – 56 – –

PR
ECU
RS
OR
S
74
Country
Year Ace
tic a
nh
ydri
de
(lit
res)
N-A
ce
tyla
nth
ran
ilic
acid
(ki
log
ram
s)
Ep
he
dri
ne
(kilo
gra
ms)
Ep
he
dri
ne
pre
pa
rati
on
sa
(kilo
gra
ms)
Erg
om
etr
ine
(gra
ms)
Erg
ota
min
e
(gra
ms)
Iso
safr
ole
(lit
res)
Lyse
rgic
acid
(gra
ms)
3,4
-Meth
ylenedio
xyphenyl
-2-
pro
panone
(litre
s)
Nore
phed
rine
(phenyl
pro
panola
min
e)
(kilo
gra
ms)
Ph
en
yla
ce
tic a
cid
(kilo
gra
ms)
alp
ha
-ph
en
yla
ce
toa
ce
ton
itri
le
(AP
AA
N)b
(ki
log
ram
s)
1-P
he
nyl
-2-p
rop
an
on
e
(lit
res)
Pip
ero
na
l
(kilo
gra
ms)
Po
tass
ium
pe
rma
ng
an
ate
(kilo
gra
ms)
Pse
ud
oe
ph
ed
rin
e
(kilo
gra
ms)
Pse
ud
oe
ph
ed
rin
e
pre
pa
rati
on
sa
(kilo
gra
ms)
Sa
fro
le
(lit
res)
Myanmar
2013 – – – 133 – – – – – – 95 – – – – – 3 581 –
2014 – – – – – – – – – – – – 4 800 – – – – –
2015 60 – ° – – – – – – – – – – – – – – –
Philippines
2011 – – 106 – – – – – – – – – – – – ° – –
2012 – – 378 – – – – – 212 273 – – – 1 – 3 – –
2013 – – 1 – – – – – – – – – – – – 609 – –
2014 – – 510 – – – – – – ° – – – ° – – – –
2015 – – 50 – – – – – – ° – – – – – 2 – –
Singapore
2011 – – – – – – – – – – – – – – – – 155 –
Thailand
2011 – – 3 ° – – – – – – – – – – – – 1a –
2012 – – 17 – – – – – – – – – – – – – a –
2013 – – – – – – – – – – – – – – – – a –
2014 – – – – – – – – – – – – – – – – 6 –
2015 – – – – – – – – – – – – – – – – 3 –
Viet Nam
2013 – – – 5 – – – – – – – – – – – – 47 –
2014 – – 4 – – – – – – – – – – – – – 22 –
Regional total
2011 16 946 0 4 431 0 0 0 0 0 0 0 4 520 0 0 0 0 2 079 196 9 734
2012 17 131 0 3 608 2 686 0 0 0 0 212 276 30 0 259 1 29 927 40 902 0
AN
NEX
ES
75
Country
Year Ace
tic a
nh
ydri
de
(lit
res)
N-A
ce
tyla
nth
ran
ilic
acid
(ki
log
ram
s)
Ep
he
dri
ne
(kilo
gra
ms)
Ep
he
dri
ne
pre
pa
rati
on
sa
(kilo
gra
ms)
Erg
om
etr
ine
(gra
ms)
Erg
ota
min
e
(gra
ms)
Iso
safr
ole
(lit
res)
Lyse
rgic
acid
(gra
ms)
3,4
-Meth
ylenedio
xyphenyl
-2-
pro
panone
(litre
s)
Nore
phed
rine
(phenyl
pro
panola
min
e)
(kilo
gra
ms)
Ph
en
yla
ce
tic a
cid
(kilo
gra
ms)
alp
ha
-ph
en
yla
ce
toa
ce
ton
itri
le
(AP
AA
N)b
(ki
log
ram
s)
1-P
he
nyl
-2-p
rop
an
on
e
(lit
res)
Pip
ero
na
l
(kilo
gra
ms)
Po
tass
ium
pe
rma
ng
an
ate
(kilo
gra
ms)
Pse
ud
oe
ph
ed
rin
e
(kilo
gra
ms)
Pse
ud
oe
ph
ed
rin
e
pre
pa
rati
on
sa
(kilo
gra
ms)
Sa
fro
le
(lit
res)
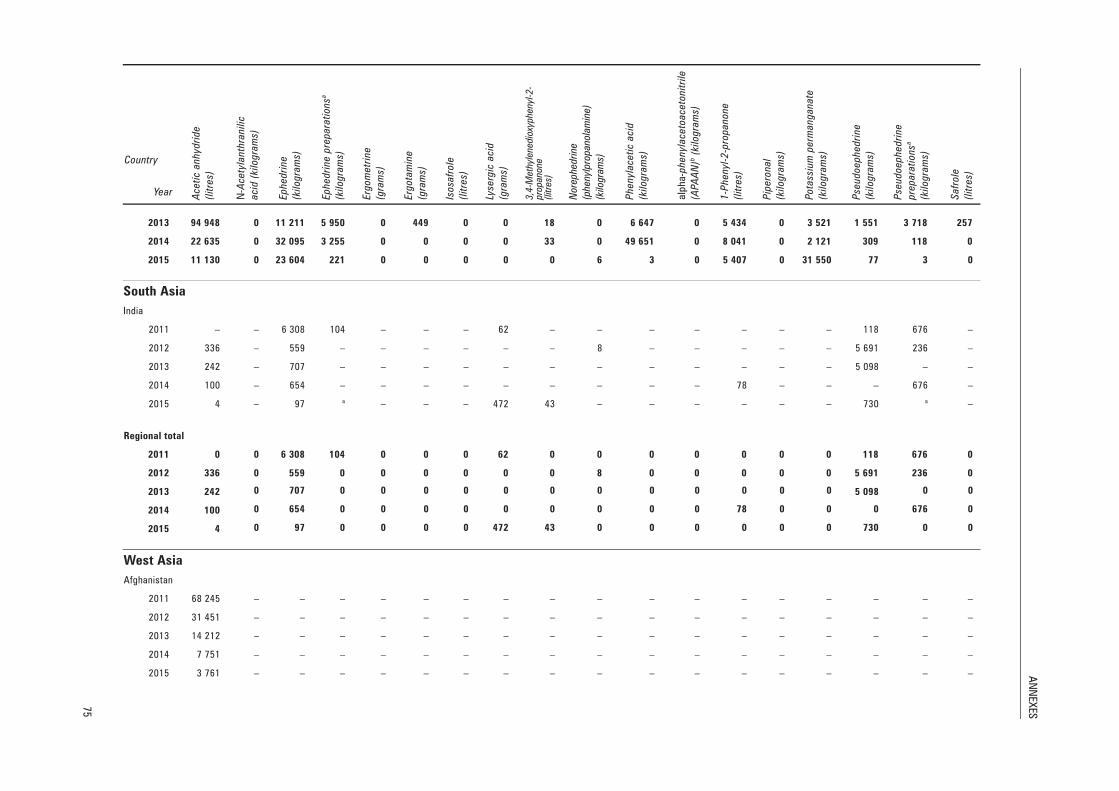
2013 94 948 0 11 211 5 950 0 449 0 0 18 0 6 647 0 5 434 0 3 521 1 551 3 718 257
2014 22 635 0 32 095 3 255 0 0 0 0 33 0 49 651 0 8 041 0 2 121 309 118 0
2015 11 130 0 23 604 221 0 0 0 0 0 6 3 0 5 407 0 31 550 77 3 0
South Asia
India
2011 – – 6 308 104 – – – 62 – – – – – – – 118 676 –
2012 336 – 559 – – – – – – 8 – – – – – 5 691 236 –
2013 242 – 707 – – – – – – – – – – – – 5 098 – –
2014 100 – 654 – – – – – – – – – 78 – – – 676 –
2015 4 – 97 a – – – 472 43 – – – – – – 730 a –
Regional total
2011 0 0 6 308 104 0 0 0 62 0 0 0 0 0 0 0 118 676 0
2012 336 0 559 0 0 0 0 0 0 8 0 0 0 0 0 5 691 236 0
2013 242 0 707 0 0 0 0 0 0 0 0 0 0 0 0 5 098 0 0
2014 100 0 654 0 0 0 0 0 0 0 0 0 78 0 0 0 676 0
2015 4 0 97 0 0 0 0 472 43 0 0 0 0 0 0 730 0 0
West Asia
Afghanistan
2011 68 245 – – – – – – – – – – – – – – – – –
2012 31 451 – – – – – – – – – – – – – – – – –
2013 14 212 – – – – – – – – – – – – – – – – –
2014 7 751 – – – – – – – – – – – – – – – – –
2015 3 761 – – – – – – – – – – – – – – – – –
PR
ECU
RS
OR
S
76
Country
Year Ace
tic a
nh
ydri
de
(lit
res)
N-A
ce
tyla
nth
ran
ilic
acid
(ki
log
ram
s)
Ep
he
dri
ne
(kilo
gra
ms)
Ep
he
dri
ne
pre
pa
rati
on
sa
(kilo
gra
ms)
Erg
om
etr
ine
(gra
ms)
Erg
ota
min
e
(gra
ms)
Iso
safr
ole
(lit
res)
Lyse
rgic
acid
(gra
ms)
3,4
-Meth
ylenedio
xyphenyl
-2-
pro
panone
(litre
s)
Nore
phed
rine
(phenyl
pro
panola
min
e)
(kilo
gra
ms)
Ph
en
yla
ce
tic a
cid
(kilo
gra
ms)
alp
ha
-ph
en
yla
ce
toa
ce
ton
itri
le
(AP
AA
N)b
(ki
log
ram
s)
1-P
he
nyl
-2-p
rop
an
on
e
(lit
res)
Pip
ero
na
l
(kilo
gra
ms)
Po
tass
ium
pe
rma
ng
an
ate
(kilo
gra
ms)
Pse
ud
oe
ph
ed
rin
e
(kilo
gra
ms)
Pse
ud
oe
ph
ed
rin
e
pre
pa
rati
on
sa
(kilo
gra
ms)
Sa
fro
le
(lit
res)
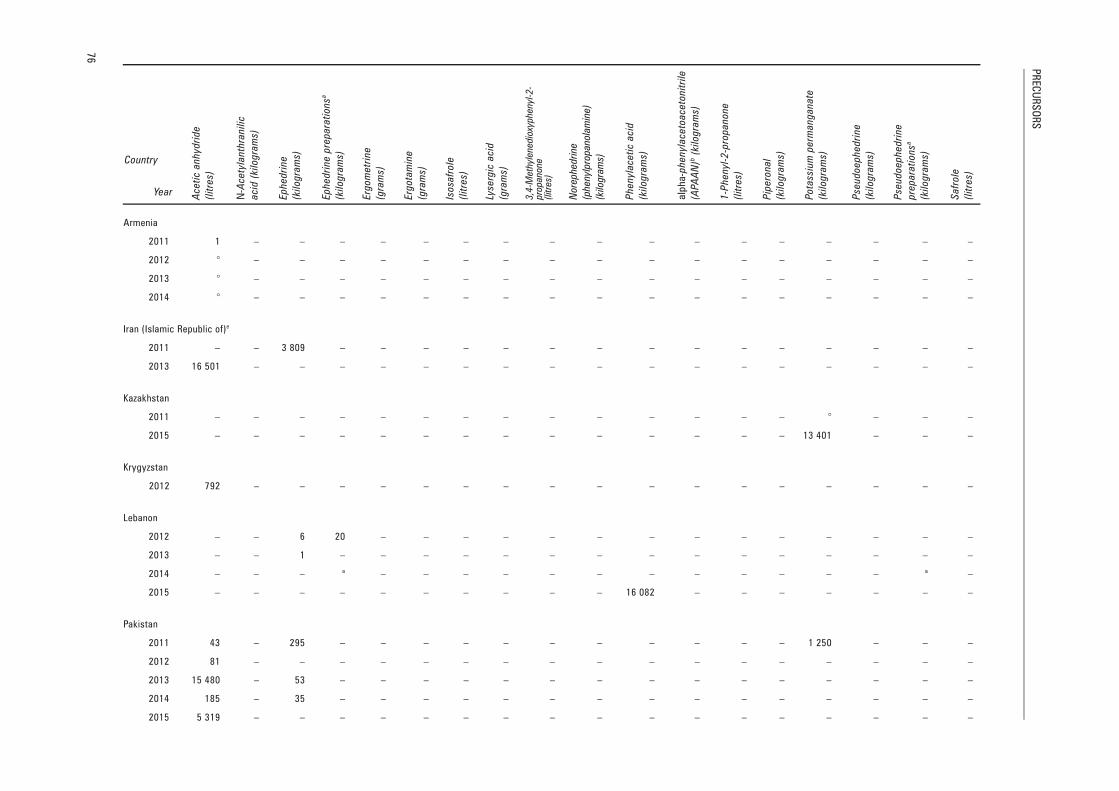
Armenia
2011 1 – – – – – – – – – – – – – – – – –
2012 ° – – – – – – – – – – – – – – – – –
2013 ° – – – – – – – – – – – – – – – – –
2014 ° – – – – – – – – – – – – – – – – –
Iran (Islamic Republic of)e
2011 – – 3 809 – – – – – – – – – – – – – – –
2013 16 501 – – – – – – – – – – – – – – – – –
Kazakhstan
2011 – – – – – – – – – – – – – – ° – – –
2015 – – – – – – – – – – – – – – 13 401 – – –
Krygyzstan
2012 792 – – – – – – – – – – – – – – – – –
Lebanon
2012 – – 6 20 – – – – – – – – – – – – – –
2013 – – 1 – – – – – – – – – – – – – – –
2014 – – – a – – – – – – – – – – – – a –
2015 – – – – – – – – – – 16 082 – – – – – – –
Pakistan
2011 43 – 295 – – – – – – – – – – – 1 250 – – –
2012 81 – – – – – – – – – – – – – – – – –
2013 15 480 – 53 – – – – – – – – – – – – – – –
2014 185 – 35 – – – – – – – – – – – – – – –
2015 5 319 – – – – – – – – – – – – – – – – –

AN
NEX
ES
77
Country
Year Ace
tic a
nh
ydri
de
(lit
res)
N-A
ce
tyla
nth
ran
ilic
acid
(ki
log
ram
s)
Ep
he
dri
ne
(kilo
gra
ms)
Ep
he
dri
ne
pre
pa
rati
on
sa
(kilo
gra
ms)
Erg
om
etr
ine
(gra
ms)
Erg
ota
min
e
(gra
ms)
Iso
safr
ole
(lit
res)
Lyse
rgic
acid
(gra
ms)
3,4
-Meth
ylenedio
xyphenyl
-2-
pro
panone
(litre
s)
Nore
phed
rine
(phenyl
pro
panola
min
e)
(kilo
gra
ms)
Ph
en
yla
ce
tic a
cid
(kilo
gra
ms)
alp
ha
-ph
en
yla
ce
toa
ce
ton
itri
le
(AP
AA
N)b
(ki
log
ram
s)
1-P
he
nyl
-2-p
rop
an
on
e
(lit
res)
Pip
ero
na
l
(kilo
gra
ms)
Po
tass
ium
pe
rma
ng
an
ate
(kilo
gra
ms)
Pse
ud
oe
ph
ed
rin
e
(kilo
gra
ms)
Pse
ud
oe
ph
ed
rin
e
pre
pa
rati
on
sa
(kilo
gra
ms)
Sa
fro
le
(lit
res)
Qatar
2013 – – – – – – – – – – – – – – 1 600 – – –
Syrian Arab Republic
2012 – – – – – – – – – – – – 498 – – – – –
Turkey
2011 3 706f – – – – – – – – – – – – – – – – –
2012 177 – – ° – – – – – – – – – – – – – –
2013 14 672 – – – – – – – – – – – – – – – – –
2014 854 – 33 – – – – – – – – – – – – – – –
2015 4 402 – – – – – – – – – – – – – – – – –
Uzbekistan
2011 – – – – – – – – – – – – – – 3 – – –
2013 – – – – – – – – – – – – – – 160 – – –
2014 – – – – – – – – – – – – – – 52 – – –
2015 – – – – – – – – – – – – – – 32 684 – – –
Regional total
2011 71 994 0 4 104 0 0 0 0 0 0 0 0 0 0 0 1 253 0 0 0
2012 32 501 0 6 20 0 0 0 0 0 0 0 0 498 0 0 0 0 0
2013 60 866 0 54 0 0 0 0 0 0 0 0 0 0 0 1 760 0 0 0
2014 8 790 0 68 0 0 0 0 0 0 0 0 0 0 0 52 0 0 0
2015 13 481 0 0 0 0 0 0 0 0 0 16 082 0 0 0 46 085 0 0 0

PR
ECU
RS
OR
S
78
Country
Year Ace
tic a
nh
ydri
de
(lit
res)
N-A
ce
tyla
nth
ran
ilic
acid
(ki
log
ram
s)
Ep
he
dri
ne
(kilo
gra
ms)
Ep
he
dri
ne
pre
pa
rati
on
sa
(kilo
gra
ms)
Erg
om
etr
ine
(gra
ms)
Erg
ota
min
e
(gra
ms)
Iso
safr
ole
(lit
res)
Lyse
rgic
acid
(gra
ms)
3,4
-Meth
ylenedio
xyphenyl
-2-
pro
panone
(litre
s)
Nore
phed
rine
(phenyl
pro
panola
min
e)
(kilo
gra
ms)
Ph
en
yla
ce
tic a
cid
(kilo
gra
ms)
alp
ha
-ph
en
yla
ce
toa
ce
ton
itri
le
(AP
AA
N)b
(ki
log
ram
s)
1-P
he
nyl
-2-p
rop
an
on
e
(lit
res)
Pip
ero
na
l
(kilo
gra
ms)
Po
tass
ium
pe
rma
ng
an
ate
(kilo
gra
ms)
Pse
ud
oe
ph
ed
rin
e
(kilo
gra
ms)
Pse
ud
oe
ph
ed
rin
e
pre
pa
rati
on
sa
(kilo
gra
ms)
Sa
fro
le
(lit
res)
Europe
States not members of the European Union
Belarus
2011 ° – – ° – – – – – – – – – – – – ° –
2012 – – – – – – – – – – – – – – – – ° –
2013 – – – – – – – – – – – – – – – – ° –
2014 – – – – – – – – – – – – – – – 1 – –
2015 – – – – – – – – – – – – – – – – ° –
Norway
2012 – – – 1 – – – – – – – – – – – – – –
2013 – – – – – – – – – – – – – – 1 – – 2
2014 – – – – – – – – – – – – ° – – – – –
2015 – – – ° – – – – – – – – – – – – ° –
Republic of Moldova
2013 – – – ° – – – – – – – – – – – – – –
2014 – – – – – – – – – – – – – – – – a –
2015 – – ° – – – – – – – – – – – ° ° a –
Russian Federation
2011 820 – ° – – – – – – – – – 1 060 – – 3 – –
2012 5 – ° – – – – – – – – – 4 – – – – –
2013 8 – 2 – – – – 83 – – – – 30 – – – – –
2014 17 – – ° – – – – – – – – ° – – – ° –
2015 47 – ° – – – – – – – – – – – – – ° –
AN
NEX
ES
79
Country
Year Ace
tic a
nh
ydri
de
(lit
res)
N-A
ce
tyla
nth
ran
ilic
acid
(ki
log
ram
s)
Ep
he
dri
ne
(kilo
gra
ms)
Ep
he
dri
ne
pre
pa
rati
on
sa
(kilo
gra
ms)
Erg
om
etr
ine
(gra
ms)
Erg
ota
min
e
(gra
ms)
Iso
safr
ole
(lit
res)
Lyse
rgic
acid
(gra
ms)
3,4
-Meth
ylenedio
xyphenyl
-2-
pro
panone
(litre
s)
Nore
phed
rine
(phenyl
pro
panola
min
e)
(kilo
gra
ms)
Ph
en
yla
ce
tic a
cid
(kilo
gra
ms)
alp
ha
-ph
en
yla
ce
toa
ce
ton
itri
le
(AP
AA
N)b
(ki
log
ram
s)
1-P
he
nyl
-2-p
rop
an
on
e
(lit
res)
Pip
ero
na
l
(kilo
gra
ms)
Po
tass
ium
pe
rma
ng
an
ate
(kilo
gra
ms)
Pse
ud
oe
ph
ed
rin
e
(kilo
gra
ms)
Pse
ud
oe
ph
ed
rin
e
pre
pa
rati
on
sa
(kilo
gra
ms)
Sa
fro
le
(lit
res)
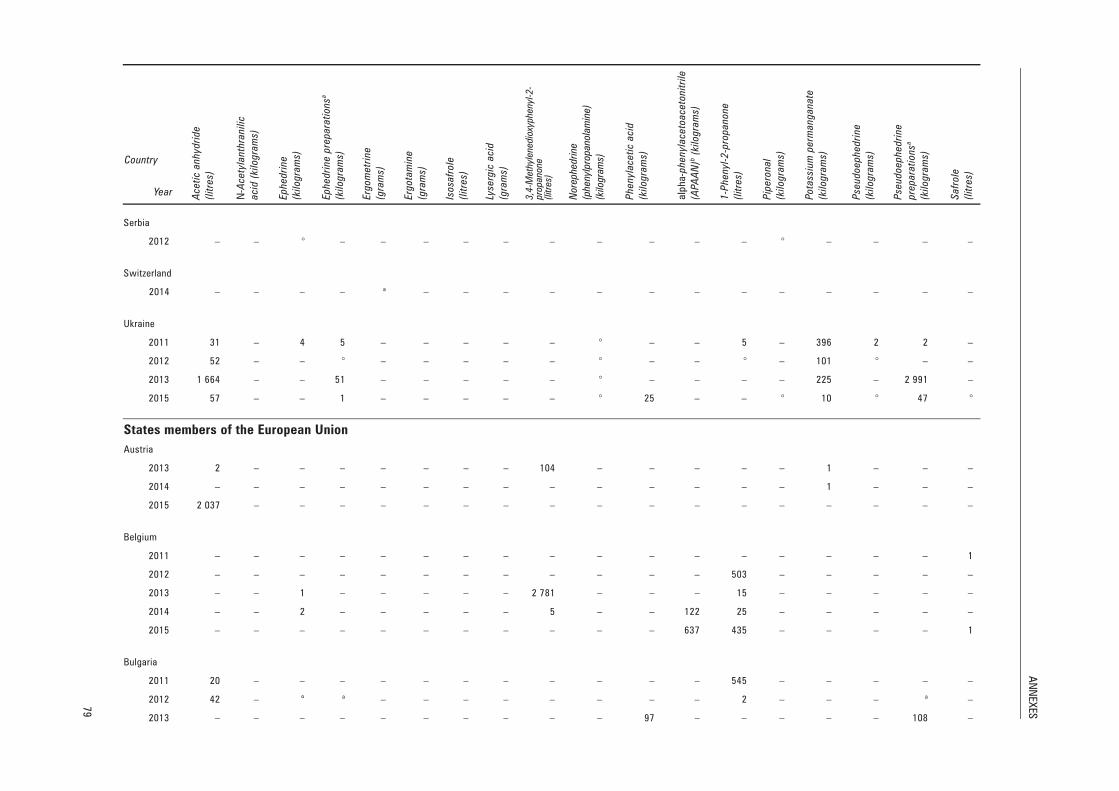
Serbia
2012 – – ° – – – – – – – – – – ° – – – –
Switzerland
2014 – – – – a – – – – – – – – – – – – –
Ukraine
2011 31 – 4 5 – – – – – ° – – 5 – 396 2 2 –
2012 52 – – ° – – – – – ° – – ° – 101 ° – –
2013 1 664 – – 51 – – – – – ° – – – – 225 – 2 991 –
2015 57 – – 1 – – – – – ° 25 – – ° 10 ° 47 °
States members of the European Union
Austria
2013 2 – – – – – – – 104 – – – – – 1 – – –
2014 – – – – – – – – – – – – – – 1 – – –
2015 2 037 – – – – – – – – – – – – – – – – –
Belgium
2011 – – – – – – – – – – – – – – – – – 1
2012 – – – – – – – – – – – – 503 – – – – –
2013 – – 1 – – – – – 2 781 – – – 15 – – – – –
2014 – – 2 – – – – – 5 – – 122 25 – – – – –
2015 – – – – – – – – – – – 637 435 – – – – 1
Bulgaria
2011 20 – – – – – – – – – – – 545 – – – – –
2012 42 – ° a – – – – – – – – 2 – – – a –
2013 – – – – – – – – – – 97 – – – – – 108 –

PR
ECU
RS
OR
S
80
Country
Year Ace
tic a
nh
ydri
de
(lit
res)
N-A
ce
tyla
nth
ran
ilic
acid
(ki
log
ram
s)
Ep
he
dri
ne
(kilo
gra
ms)
Ep
he
dri
ne
pre
pa
rati
on
sa
(kilo
gra
ms)
Erg
om
etr
ine
(gra
ms)
Erg
ota
min
e
(gra
ms)
Iso
safr
ole
(lit
res)
Lyse
rgic
acid
(gra
ms)
3,4
-Meth
ylenedio
xyphenyl
-2-
pro
panone
(litre
s)
Nore
phed
rine
(phenyl
pro
panola
min
e)
(kilo
gra
ms)
Ph
en
yla
ce
tic a
cid
(kilo
gra
ms)
alp
ha
-ph
en
yla
ce
toa
ce
ton
itri
le
(AP
AA
N)b
(ki
log
ram
s)
1-P
he
nyl
-2-p
rop
an
on
e
(lit
res)
Pip
ero
na
l
(kilo
gra
ms)
Po
tass
ium
pe
rma
ng
an
ate
(kilo
gra
ms)
Pse
ud
oe
ph
ed
rin
e
(kilo
gra
ms)
Pse
ud
oe
ph
ed
rin
e
pre
pa
rati
on
sa
(kilo
gra
ms)
Sa
fro
le
(lit
res)
2014 – – – – – – – – – – – 1 980 – – – – 841 –
2015 – – – – – – – – – – – – – – – 32 66 –
Croatia
2011 – – ° ° – – – – – – – – – – – – – –
2013 – – – ° – – – – – – – – ° – – – – –
2014 – – – ° – – – – – – – – – – – – ° –
Czechiag
2011 – – 4 a – – – – – – – – – – – 6 a –
2012 – – 3 – – – – – – – – – – – – 2 16 –
2013 – – ° – – – – – – – – – – – – 64 25 –
2014 – – 14 2 – – – – – – – – – – – 12 351 –
2015 – – – – – – – – – – – – – – – – 77 –
Estonia
2011 – – – – – – – – – – – – 10 – – – – –
2013 ° – – – – – – – – – – – ° – – – – –
2014 ° – – ° – – – – – – 100 5 – – – – – –
2015 – – – – – – – – – – – – ° – – – – –
Finland
2011 – – – a – – – – – – – – 3 – – – – –
2012 – – – a – – – – – – – – ° – – – ° –
2013 – – – 600 – – – – – – – – – – – – – –
2014 – – – ° – – – – – – – – – – – – – –
2015 – – – 2 – – – – – – – – ° ° – – ° –

AN
NEX
ES
81
Country
Year Ace
tic a
nh
ydri
de
(lit
res)
N-A
ce
tyla
nth
ran
ilic
acid
(ki
log
ram
s)
Ep
he
dri
ne
(kilo
gra
ms)
Ep
he
dri
ne
pre
pa
rati
on
sa
(kilo
gra
ms)
Erg
om
etr
ine
(gra
ms)
Erg
ota
min
e
(gra
ms)
Iso
safr
ole
(lit
res)
Lyse
rgic
acid
(gra
ms)
3,4
-Meth
ylenedio
xyphenyl
-2-
pro
panone
(litre
s)
Nore
phed
rine
(phenyl
pro
panola
min
e)
(kilo
gra
ms)
Ph
en
yla
ce
tic a
cid
(kilo
gra
ms)
alp
ha
-ph
en
yla
ce
toa
ce
ton
itri
le
(AP
AA
N)b
(ki
log
ram
s)
1-P
he
nyl
-2-p
rop
an
on
e
(lit
res)
Pip
ero
na
l
(kilo
gra
ms)
Po
tass
ium
pe
rma
ng
an
ate
(kilo
gra
ms)
Pse
ud
oe
ph
ed
rin
e
(kilo
gra
ms)
Pse
ud
oe
ph
ed
rin
e
pre
pa
rati
on
sa
(kilo
gra
ms)
Sa
fro
le
(lit
res)
France
2011 – – 1 – – – – – – – – – – – – – – –
2012 – – 1 – – – – – – – – – – – 1 1 – –
2013 – – ° – – – – – – – – – – – – ° – –
2014 – – 15 – – – – – – – – – 1 – – – – –
2015 – – 1 – – – – – – – – – – – – – ° –
Germany
2011 3 – 20 – – – – – – ° 6 000 – 24 – – 3 a –
2012 – – ° – – – – – – – – – 38 – ° – – –
2013 – – 1 a – – – – – – – – ° – 1 – a –
2014 – – ° ° – – – – – – – 5 105 2 – 1 – – –
2015 1 – 4 – – – – – – – – 38 2 ° ° ° a –
Greece
2011 – – – a – – – – – – – – – – – – – –
2012 – – ° – – – – – – – – – – – – – – –
2013 – – ° – – – – – – – – – – – – – – –
Hungary
2011 – – – 1 – – – – – – – – – – ° – – –
2012 33 – – ° – – – – – – – – – – – – – –
2013 – – – – – – – – – – – – – 4 – – – –
2014 – – ° 1 – – – – – – – – – – – – – –
2015 – – – ° – – – – – – – – 14 – – – – –
PR
ECU
RS
OR
S
82
Country
Year Ace
tic a
nh
ydri
de
(lit
res)
N-A
ce
tyla
nth
ran
ilic
acid
(ki
log
ram
s)
Ep
he
dri
ne
(kilo
gra
ms)
Ep
he
dri
ne
pre
pa
rati
on
sa
(kilo
gra
ms)
Erg
om
etr
ine
(gra
ms)
Erg
ota
min
e
(gra
ms)
Iso
safr
ole
(lit
res)
Lyse
rgic
acid
(gra
ms)
3,4
-Meth
ylenedio
xyphenyl
-2-
pro
panone
(litre
s)
Nore
phed
rine
(phenyl
pro
panola
min
e)
(kilo
gra
ms)
Ph
en
yla
ce
tic a
cid
(kilo
gra
ms)
alp
ha
-ph
en
yla
ce
toa
ce
ton
itri
le
(AP
AA
N)b
(ki
log
ram
s)
1-P
he
nyl
-2-p
rop
an
on
e
(lit
res)
Pip
ero
na
l
(kilo
gra
ms)
Po
tass
ium
pe
rma
ng
an
ate
(kilo
gra
ms)
Pse
ud
oe
ph
ed
rin
e
(kilo
gra
ms)
Pse
ud
oe
ph
ed
rin
e
pre
pa
rati
on
sa
(kilo
gra
ms)
Sa
fro
le
(lit
res)
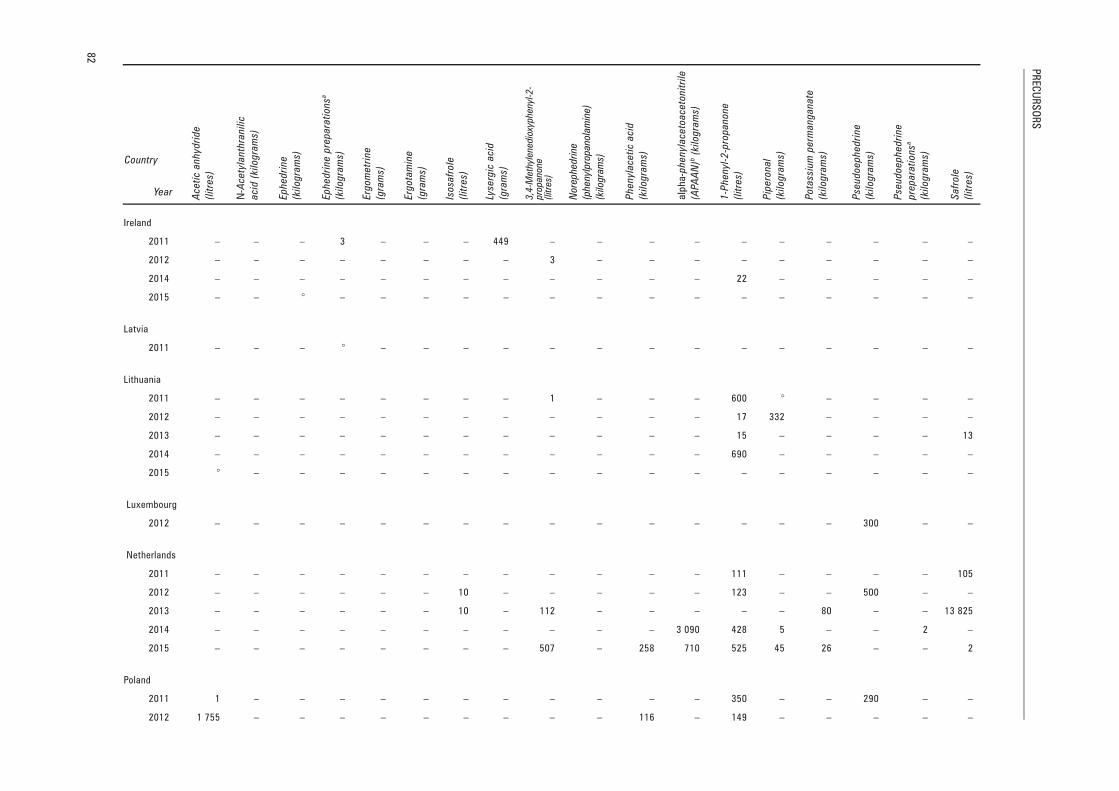
Ireland
2011 – – – 3 – – – 449 – – – – – – – – – –
2012 – – – – – – – – 3 – – – – – – – – –
2014 – – – – – – – – – – – – 22 – – – – –
2015 – – ° – – – – – – – – – – – – – – –
Latvia
2011 – – – ° – – – – – – – – – – – – – –
Lithuania
2011 – – – – – – – – 1 – – – 600 ° – – – –
2012 – – – – – – – – – – – – 17 332 – – – –
2013 – – – – – – – – – – – – 15 – – – – 13
2014 – – – – – – – – – – – – 690 – – – – –
2015 ° – – – – – – – – – – – – – – – – –
Luxembourg
2012 – – – – – – – – – – – – – – – 300 – –
Netherlands
2011 – – – – – – – – – – – – 111 – – – – 105
2012 – – – – – – 10 – – – – – 123 – – 500 – –
2013 – – – – – – 10 – 112 – – – – – 80 – – 13 825
2014 – – – – – – – – – – – 3 090 428 5 – – 2 –
2015 – – – – – – – – 507 – 258 710 525 45 26 – – 2
Poland
2011 1 – – – – – – – – – – – 350 – – 290 – –
2012 1 755 – – – – – – – – – 116 – 149 – – – – –
AN
NEX
ES
83
Country
Year Ace
tic a
nh
ydri
de
(lit
res)
N-A
ce
tyla
nth
ran
ilic
acid
(ki
log
ram
s)
Ep
he
dri
ne
(kilo
gra
ms)
Ep
he
dri
ne
pre
pa
rati
on
sa
(kilo
gra
ms)
Erg
om
etr
ine
(gra
ms)
Erg
ota
min
e
(gra
ms)
Iso
safr
ole
(lit
res)
Lyse
rgic
acid
(gra
ms)
3,4
-Meth
ylenedio
xyphenyl
-2-
pro
panone
(litre
s)
Nore
phed
rine
(phenyl
pro
panola
min
e)
(kilo
gra
ms)
Ph
en
yla
ce
tic a
cid
(kilo
gra
ms)
alp
ha
-ph
en
yla
ce
toa
ce
ton
itri
le
(AP
AA
N)b
(ki
log
ram
s)
1-P
he
nyl
-2-p
rop
an
on
e
(lit
res)
Pip
ero
na
l
(kilo
gra
ms)
Po
tass
ium
pe
rma
ng
an
ate
(kilo
gra
ms)
Pse
ud
oe
ph
ed
rin
e
(kilo
gra
ms)
Pse
ud
oe
ph
ed
rin
e
pre
pa
rati
on
sa
(kilo
gra
ms)
Sa
fro
le
(lit
res)
2013 ° 1 10 – – – – – – – – – 1 – 5 a – –
2014 4 – ° – – – – – – – – 611 1 472 – – 1 – –
2015 – – 1 – – – – – – – – 31 6 920 – – – 35 –
Portugal
2013 – – 1 – – – – – – – – – – – – ° – –
2015 – – ° – – – – – – – – – – – – – – –
Romania
2013 – – – – – – – – – – – – – 1 – – – –
2014 – – – – – – – – – – – 150 – – – – – –
Slovakia
2011 6 020 – ° – – – – – – – – – – – – ° a –
2012 – – ° – – – – – – – – – – – – ° – –
2013 – – – – – – – – – – – – – – – ° a –
2014 – – ° – – – – – – – – – – – ° – 11 –
2015 – – ° – – – – – – – – – – – 1 000 ° – –
Slovenia
2012 – – ° – – – – – ° – – – – – – – – –
2013 – – ° – – – – – 912 – – – – – ° – – –
Spain
2011 – – – – – – – – – – – – – – 1 – – –
2012 11 – 1 500 ° – – – – – – – – – – 19 – – –
2013 9 497 – – – – 1 – – – – – – – 1 400 5 926 – – –
2014 110 – – – – – – – – – – – – – – – – –
2015 1 – 2 – – – – – – – 2 122 – – – – – –

PR
ECU
RS
OR
S
84
Country
Year Ace
tic a
nh
ydri
de
(lit
res)
N-A
ce
tyla
nth
ran
ilic
acid
(ki
log
ram
s)
Ep
he
dri
ne
(kilo
gra
ms)
Ep
he
dri
ne
pre
pa
rati
on
sa
(kilo
gra
ms)
Erg
om
etr
ine
(gra
ms)
Erg
ota
min
e
(gra
ms)
Iso
safr
ole
(lit
res)
Lyse
rgic
acid
(gra
ms)
3,4
-Meth
ylenedio
xyphenyl
-2-
pro
panone
(litre
s)
Nore
phed
rine
(phenyl
pro
panola
min
e)
(kilo
gra
ms)
Ph
en
yla
ce
tic a
cid
(kilo
gra
ms)
alp
ha
-ph
en
yla
ce
toa
ce
ton
itri
le
(AP
AA
N)b
(ki
log
ram
s)
1-P
he
nyl
-2-p
rop
an
on
e
(lit
res)
Pip
ero
na
l
(kilo
gra
ms)
Po
tass
ium
pe
rma
ng
an
ate
(kilo
gra
ms)
Pse
ud
oe
ph
ed
rin
e
(kilo
gra
ms)
Pse
ud
oe
ph
ed
rin
e
pre
pa
rati
on
sa
(kilo
gra
ms)
Sa
fro
le
(lit
res)
Sweden
2011 – – – 2 – – – – – – – – – – – – – –
2012 – – ° 1 – – – – – – – – – ° – – – –
2013 – – – 1a – – – – – – – – – – – – – –
2014 – – – 3 – – – – – – – – – – – – – –
2015 – – – 1 – – – – – – – – – – – – – –
United Kingdom
2011 – – 500 a – – – – – – – – – 10 – – – –
2012 – 1 – – – – – – – – – – – – – – – –
2013 – – – – – – – – – – – – – – – – a –
Regional total
2011 6 894 0 530 11 0 0 0 449 1 1 6 000 0 2 708 10 396 304 2 106
2012 1 899 1 1 504 2 0 0 10 0 3 0 116 0 836 332 121 804 16 0
2013 11 171 1 15 653 0 1 10 83 3 910 0 97 0 61 1 405 6 240 64 3 125 13 848
2014 131 0 31 7 0 0 0 0 5 0 100 11 062 2 640 5 1 13 1 206 0
2015 2 144 0 7 3 0 0 0 0 507 0 286 1 537 7 896 45 1 036 32 225 3
Oceania
Australia
2011 6 – 261 5 – 4 ° – 1 1 10 – – ° – 724 723 2 565
2012 2 – 520 – – – ° 691 ° 2 ° – – ° – 770 2 1
2013 – – 1 253 – – 207 – 523 – 1 ° – 1 ° – 629 – 11
2014 – – 457 – – 57 ° – 20 ° ° – 1 ° – 11 – 184
2015 – – 457 – – 281 – – 139 12 1 – – 1 – 72 – 73

AN
NEX
ES
85
Country
Year Ace
tic a
nh
ydri
de
(lit
res)
N-A
ce
tyla
nth
ran
ilic
acid
(ki
log
ram
s)
Ep
he
dri
ne
(kilo
gra
ms)
Ep
he
dri
ne
pre
pa
rati
on
sa
(kilo
gra
ms)
Erg
om
etr
ine
(gra
ms)
Erg
ota
min
e
(gra
ms)
Iso
safr
ole
(lit
res)
Lyse
rgic
acid
(gra
ms)
3,4
-Meth
ylenedio
xyphenyl
-2-
pro
panone
(litre
s)
Nore
phed
rine
(phenyl
pro
panola
min
e)
(kilo
gra
ms)
Ph
en
yla
ce
tic a
cid
(kilo
gra
ms)
alp
ha
-ph
en
yla
ce
toa
ce
ton
itri
le
(AP
AA
N)b
(ki
log
ram
s)
1-P
he
nyl
-2-p
rop
an
on
e
(lit
res)
Pip
ero
na
l
(kilo
gra
ms)
Po
tass
ium
pe
rma
ng
an
ate
(kilo
gra
ms)
Pse
ud
oe
ph
ed
rin
e
(kilo
gra
ms)
Pse
ud
oe
ph
ed
rin
e
pre
pa
rati
on
sa
(kilo
gra
ms)
Sa
fro
le
(lit
res)
New Zealand
2011 ° – – 96a – – – – – – – – – – ° – 608a –
2012 ° – – 5 – – – – – – – – – – ° – 426a 1
2013 ° – – 3a – – – – – – – – – – – – 691a –
2015 3 – 952 – – – – – – – – – – – ° 61 – –
Regional total
2011 6 0 261 101 0 4 0 0 1 1 10 0 0 0 0 724 1 332 2 565
2012 2 0 520 5 0 0 0 691 0 2 0 0 0 0 0 770 429 2
2013 0 0 1 253 3 0 207 0 523 0 1 0 0 1 0 0 629 691 11
2014 0 0 457 0 0 57 0 0 20 0 0 0 1 0 0 11 0 184
2015 3 0 1 409 0 0 281 0 0 139 12 1 0 0 1 0 133 0 73
World total
2011 197 744 0 33 326 33 797 0 824 0 521 124 2 1 022 231 0 5 312 10 38 406 6 398 2 291 17 122
2012 89 657 1 7 624 2 714 0 1 650 10 694 228 286 1 700 0 6 818 336 92 702 30 481 1 583 2 028
2013 175 739 1 13 256 6 721 0 657 10 606 3 927 23 10 068 0 8 292 1 405 57 567 15 571 7 534 14 117
2014 45 071 0 33 491 3 261 0 57 2 100 14 58 0 51 066 11 062 16 653 5 173 824 351 2 002 185
2015 31 169 0 25 196 224 0 281 0 472 689 18 16 922 1 537 29 840 46 138 837 1 182 228 77
a Seizures of ephedrine and pseudoephedrine reported to the Board in consumption units (such as tablets and doses) have not been converted into kilograms,
as the actual quantity of ephedrine and pseudoephedrine is not known. The following countries have reported seizures of preparations containing ephedrine
and/or pseudoephedrine quantified in terms of consumption units:
Year
Ephedrine preparations
(units)
Pseudoephedrine preparations
(units)
Bulgaria 2012 50 000 3 660
Canada 2015 30 433 907
China, Hong Kong SAR 2013 – 656 271
Côte d’Ivoire 2011 23 962 –
2012 80 820 –

PR
ECU
RS
OR
S
86
Year
Ephedrine preparations
(units)
Pseudoephedrine preparations
(units)
Czechiag 2011 2 570 872 703
Finland 2011 6 107 –
2012 6 359 –
Germany 2011 – 1 890
2013 4 034 78
2015 – 1 779
Greece 2011 8 –
India 2015 560 3 342 792
Indonesia 2011 3 000 –
2012 53 –
2014 17 –
2015 – 60
Lebanon 2014 47 7 662
New Zealand 2011 123 431 34 833
2012 – 3 630
2013 6 956 5 073
Republic of Moldova 2014 – 60
2015 – 60
Slovakia 2011 – 1 734
2013 – 16 128
Sweden 2012 60 976 –
Switzerland 2014 185 –
Thailand 2011 – 10 240 820
2012 – 2 011 100
2013 – 302 630
United Kingdom 2011 288 000 –
2013 – 1 000
United States 2011 – 4 003 371
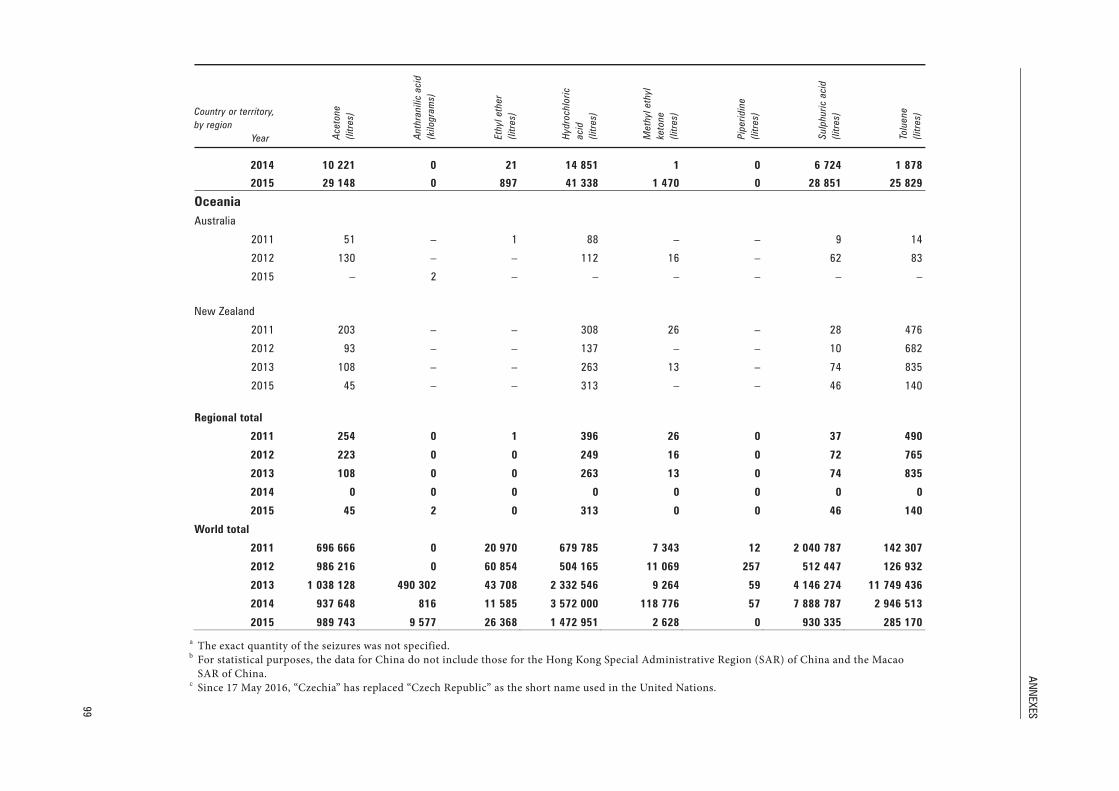
b Included in Table I of the 1988 Convention, effective 6 October 2014. c Figures reported for the United States for 2011 may inadvertently include sizeable seizures of Sida cordifolia and/or Ephedra plant extracts and are
thus not comparable with figures for previous years. d For statistical purposes, the data for China do not include those for China, Hong Kong Special Administrative Region (SAR), and China, Macao SAR. e Based on data on seizures of precursors reported annually since 2010 by the Drug Control Headquarters of the Islamic Republic of Iran in the Drug
Control Report. f Turkish National Police, Anti-Smuggling and Organized Crime Department, Turkish Report of Anti-Smuggling and Organized Crime: 2011
(Ankara, 2012). g Since 17 May 2016, “Czechia” has replaced “Czech Republic” as the short name used in the United Nations.

AN
NEX
ES
87
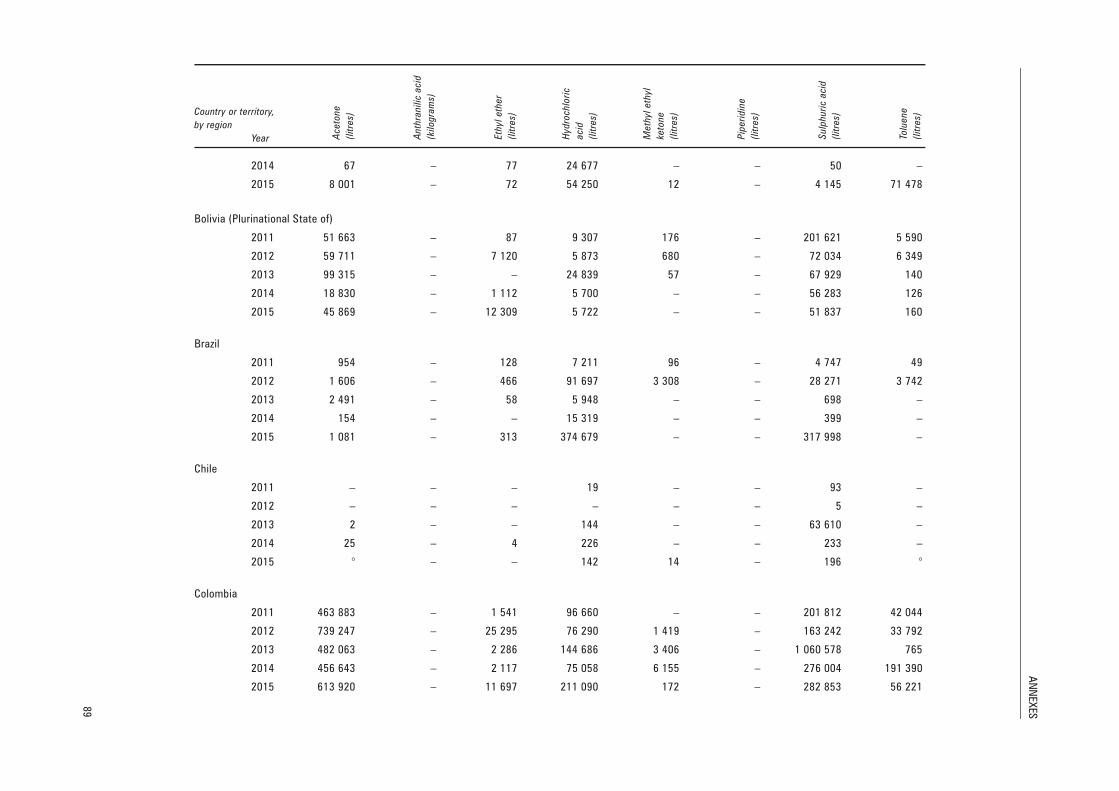
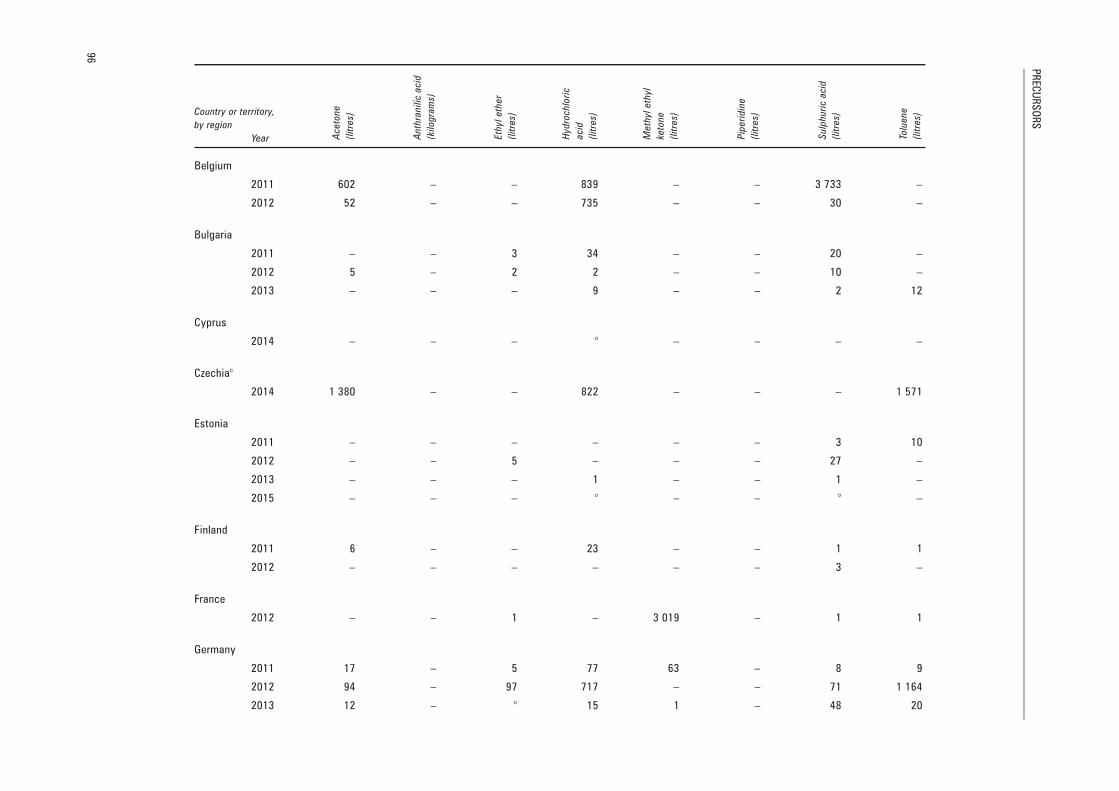
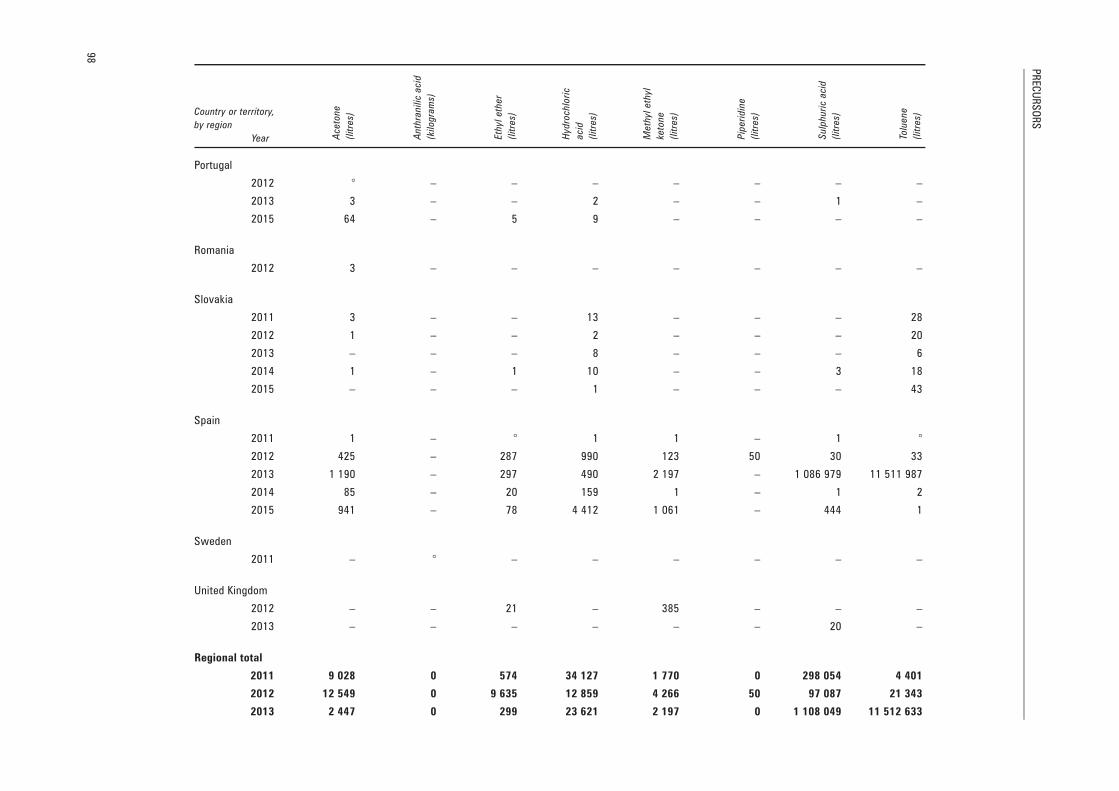
Table A.2. Seizures of substances in Table II of the 1988 Convention as reported to the International Narcotics Control Board, 2011-2015
Country or territory,
by region
Year Ace
ton
e
(lit
res)
An
thra
nilic
acid
(kilo
gra
ms)
Eth
yl
eth
er
(lit
res)
Hyd
roch
lori
c
acid
(lit
res)
Me
thyl
eth
yl
keto
ne
(lit
res)
Pip
eri
din
e
(lit
res)
Su
lph
uri
c a
cid
(lit
res)
Tolu
en
e
(lit
res)
Africa
Nigeria
2011 400 – – – – – 25 200
Regional total
2011 400 0 0 0 0 0 25 200
2012 0 0 0 0 0 0 0 0
2013 0 0 0 0 0 0 0 0
2014 0 0 0 0 0 0 0 0
2015 0 0 0 0 0 0 0 0
Americas
Central America and the Caribbean
Guatemala
2011 – – – 8 707 – – 212 –
Honduras
2011 – – – a – – – –
Regional total
2011 0 0 0 8 707 0 0 212 0
2012 0 0 0 0 0 0 0 0
2013 0 0 0 0 0 0 0 0
2014 0 0 0 0 0 0 0 0
2015 0 0 0 0 0 0 0 0
North America
Canada
2011 371 – 49 274 4 ° 201 1 825
2012 2 786 – ° 855 4 18 24 1 718

PR
ECU
RS
OR
S
88
Country or territory,
by region
Year Ace
ton
e
(lit
res)
An
thra
nilic
acid
(kilo
gra
ms)
Eth
yl
eth
er
(lit
res)
Hyd
roch
lori
c
acid
(lit
res)
Me
thyl
eth
yl
keto
ne
(lit
res)
Pip
eri
din
e
(lit
res)
Su
lph
uri
c a
cid
(lit
res)
Tolu
en
e
(lit
res)
2013 569 – – 48 – – 2 981
2014 940 – – 219 – – 153 645
2015 ° ° – ° ° ° ° –
Mexico
2011 23 262 – 219 78 125 – – 1 652 49 410
2012 10 669 – 14 29 310 64 – 3 171 26 243
2013 6 901 – 28 001 14 207 94 – 439 12 333
2014 2 402 – ° 8 446 281 – 1 406 4 324
2015 8 117 – – 188 256 184 – 4 508 26 643
United States of America
2011 71 142 – 115 109 602 29 11 1 231 111 262
2012 10 594 – 60 206 3 189 125 12
2013 2 457 – 18 1 681 11 57 1 930 102
2014 4 477 – 277 1 326 11 57 1 72
2015 3 810 – 168 1 325 18 – 1 244 41
Regional total
2011 94 775 0 384 188 001 32 12 1 232 965 51 497
2012 24 049 0 74 30 372 71 207 3 320 27 972
2013 9 926 0 28 019 15 936 104 57 2 371 13 415
2014 7 819 0 278 9 991 292 57 1 560 5 041
2015 11 927 0 168 189 581 202 0 5 752 26 684
South America
Argentina
2011 245 – 182 96 2 – 16 –
2012 311 – 131 52 53 – 26 –
2013 2 768 – 104 165 3 – 202 –
AN
NEX
ES
89
Country or territory,
by region
Year Ace
ton
e
(lit
res)
An
thra
nilic
acid
(kilo
gra
ms)
Eth
yl
eth
er
(lit
res)
Hyd
roch
lori
c
acid
(lit
res)
Me
thyl
eth
yl
keto
ne
(lit
res)
Pip
eri
din
e
(lit
res)
Su
lph
uri
c a
cid
(lit
res)
Tolu
en
e
(lit
res)
2014 67 – 77 24 677 – – 50 –
2015 8 001 – 72 54 250 12 – 4 145 71 478
Bolivia (Plurinational State of)
2011 51 663 – 87 9 307 176 – 201 621 5 590
2012 59 711 – 7 120 5 873 680 – 72 034 6 349
2013 99 315 – – 24 839 57 – 67 929 140
2014 18 830 – 1 112 5 700 – – 56 283 126
2015 45 869 – 12 309 5 722 – – 51 837 160
Brazil
2011 954 – 128 7 211 96 – 4 747 49
2012 1 606 – 466 91 697 3 308 – 28 271 3 742
2013 2 491 – 58 5 948 – – 698 –
2014 154 – – 15 319 – – 399 –
2015 1 081 – 313 374 679 – – 317 998 –
Chile
2011 – – – 19 – – 93 –
2012 – – – – – – 5 –
2013 2 – – 144 – – 63 610 –
2014 25 – 4 226 – – 233 –
2015 ° – – 142 14 – 196 °
Colombia
2011 463 883 – 1 541 96 660 – – 201 812 42 044
2012 739 247 – 25 295 76 290 1 419 – 163 242 33 792
2013 482 063 – 2 286 144 686 3 406 – 1 060 578 765
2014 456 643 – 2 117 75 058 6 155 – 276 004 191 390
2015 613 920 – 11 697 211 090 172 – 282 853 56 221

PR
ECU
RS
OR
S
90
Country or territory,
by region
Year Ace
ton
e
(lit
res)
An
thra
nilic
acid
(kilo
gra
ms)
Eth
yl
eth
er
(lit
res)
Hyd
roch
lori
c
acid
(lit
res)
Me
thyl
eth
yl
keto
ne
(lit
res)
Pip
eri
din
e
(lit
res)
Su
lph
uri
c a
cid
(lit
res)
Tolu
en
e
(lit
res)
Ecuador
2011 – – – 931 2 400 – 3 954 –
2012 – – – – – – 771 –
2013 – – – 104 1 420 – 1 625 –
2014 – – – 154 – – 708 –
2015 – – – 11 – – 2 642 –
Paraguay
2011 4 500 – 5 833 – – 5 229 2 650
2013 – – – 2 019 – – 6 960 –
Peru
2011 32 456 – 45 145 850 310 – 28 505 1 919
2012 70 024 – – 87 695 – – 29 777 100
2013 86 313 – 128 73 200 157 – 87 675 –
2014 83 006 – 4 58 907 1 225 – 87 305 3 128
2015 55 229 – – 9 904 – – 16 576 –
Venezuela (Bolivarian Republic of)
2011 15 858 – – 25 781 1 140 – 30 284 1 200
2012 39 331 – – 28 605 – – 87 470 427
2014 27 598 – – 1 061 99 – 831 301
2015 203 824 – – 19 318 – – 10 411 10 666
Regional total
2011 569 558 0 1 987 286 687 4 123 0 476 261 53 452
2012 910 230 0 33 012 290 212 5 460 0 381 596 44 411
2013 672 952 0 2 577 251 104 5 043 0 1 289 277 905
2014 586 323 0 3 313 181 101 7 479 0 421 813 194 946
2015 927 924 0 24 391 675 116 198 0 686 659 138 525

AN
NEX
ES
91
Country or territory,
by region
Year Ace
ton
e
(lit
res)
An
thra
nilic
acid
(kilo
gra
ms)
Eth
yl
eth
er
(lit
res)
Hyd
roch
lori
c
acid
(lit
res)
Me
thyl
eth
yl
keto
ne
(lit
res)
Pip
eri
din
e
(lit
res)
Su
lph
uri
c a
cid
(lit
res)
Tolu
en
e
(lit
res)
Asia
East and South-East Asia
Chinab
2011 21 474 – 17 980 150 165 1 391 – 23 024 –
2012 31 953 – 15 770 166 825 1 217 – 18 479 13 900
2013 351 870 490 302 12 204 1 627 816 1 906 2 1 297 043 221 026
2014 139 171 816 7 918 1 659 718 640 – 679 966 290 917
2015 9 768 9 575 909 565 575 727 – 177 115 91 804
Indonesia
2011 2 – – 10 – – 1 3
2012 2 – – 6 – – 5 –
2013 1 – – – – – – –
2014 1 – – 2 376 – – 1 015 506
2015 20 – – 29 – – 63 19
Malaysia
2011 800 – 45 800 – – – 950
2012 460 – – 300 – – 100 150
2013 85 – 9 219 – – – 25
2014 139 – 13 779 – – – 153
2015 194 – 3 283 – – – 513
Myanmar
2013 – – 600 145 – – 924 –
2014 193 922 – – 1 687 325 – – 6 716 899 2 452 409
Philippines
2011 21 – ° 11 – – 1 31 313
2012 6 436 – 5 1 646 25 – 3 080 17 941
2013 – – – – – – 10 –

PR
ECU
RS
OR
S
92
Country or territory,
by region
Year Ace
ton
e
(lit
res)
An
thra
nilic
acid
(kilo
gra
ms)
Eth
yl
eth
er
(lit
res)
Hyd
roch
lori
c
acid
(lit
res)
Me
thyl
eth
yl
keto
ne
(lit
res)
Pip
eri
din
e
(lit
res)
Su
lph
uri
c a
cid
(lit
res)
Tolu
en
e
(lit
res)
2014 ° – – ° – – – 640
2015 217 – – 283 – – 5 1 293
Singapore
2014 20 – – – – – – –
Thailand
2011 1 – – ° – – 163 1
2012 300 – – – – – – 450
2013 – – – 450 – – – –
Regional total
2011 22 298 0 18 025 150 986 1 391 0 23 188 32 267
2012 39 151 0 15 775 168 776 1 242 0 21 664 32 441
2013 351 956 490 302 12 813 1 628 630 1 906 2 1 297 977 221 051
2014 333 253 816 7 931 3 350 198 640 0 7 397 880 2 744 624
2015 10 199 9 575 911 566 170 727 0 177 183 93 629
South Asia
India
2014 – – – – 110 364 – – –
2015 – – – – 32 – – –
Maldives
2011 – – – 14 – – 5 –
Regional total
2011 0 0 0 14 0 0 5 0
2012 0 0 0 0 0 0 0 0
2013 0 0 0 0 0 0 0 0
2014 0 0 0 0 110 364 0 0 0
2015 0 0 0 0 32 0 0 0
AN
NEX
ES
93
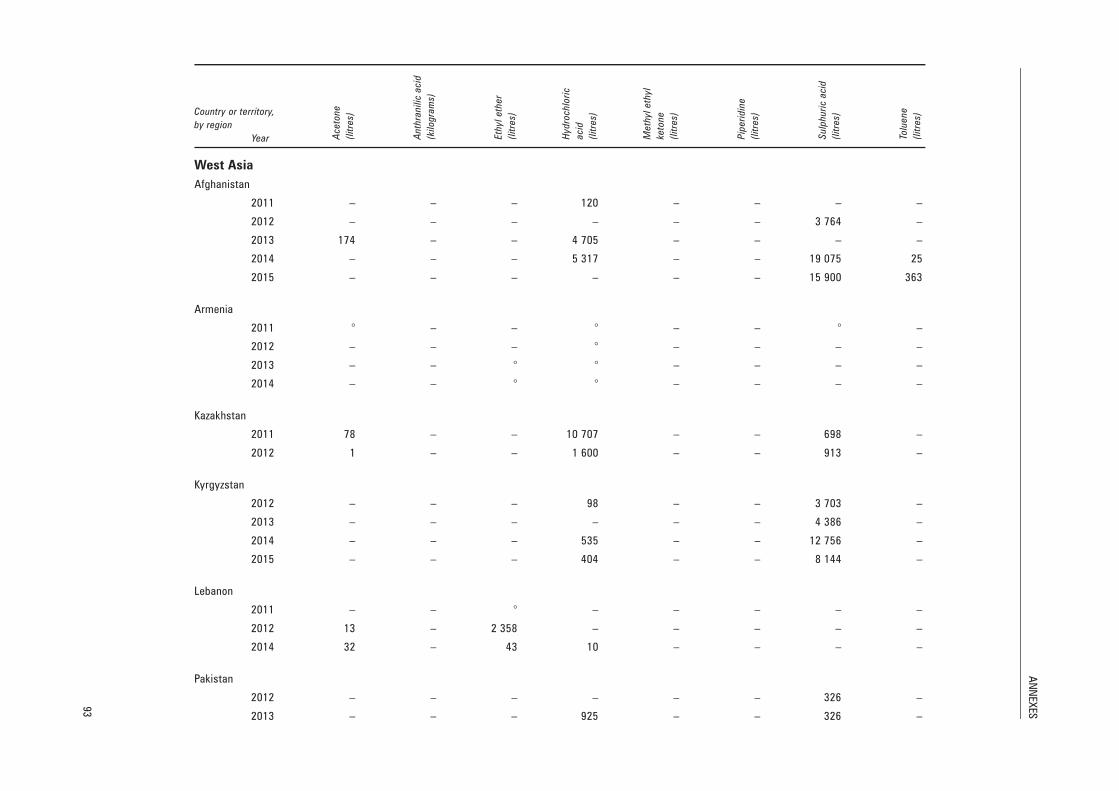
Country or territory,
by region
Year Ace
ton
e
(lit
res)
An
thra
nilic
acid
(kilo
gra
ms)
Eth
yl
eth
er
(lit
res)
Hyd
roch
lori
c
acid
(lit
res)
Me
thyl
eth
yl
keto
ne
(lit
res)
Pip
eri
din
e
(lit
res)
Su
lph
uri
c a
cid
(lit
res)
Tolu
en
e
(lit
res)
West Asia
Afghanistan
2011 – – – 120 – – – –
2012 – – – – – – 3 764 –
2013 174 – – 4 705 – – – –
2014 – – – 5 317 – – 19 075 25
2015 – – – – – – 15 900 363
Armenia
2011 ° – – ° – – ° –
2012 – – – ° – – – –
2013 – – ° ° – – – –
2014 – – ° ° – – – –
Kazakhstan
2011 78 – – 10 707 – – 698 –
2012 1 – – 1 600 – – 913 –
Kyrgyzstan
2012 – – – 98 – – 3 703 –
2013 – – – – – – 4 386 –
2014 – – – 535 – – 12 756 –
2015 – – – 404 – – 8 144 –
Lebanon
2011 – – ° – – – – –
2012 13 – 2 358 – – – – –
2014 32 – 43 10 – – – –
Pakistan
2012 – – – – – – 326 –
2013 – – – 925 – – 326 –
PR
ECU
RS
OR
S
94
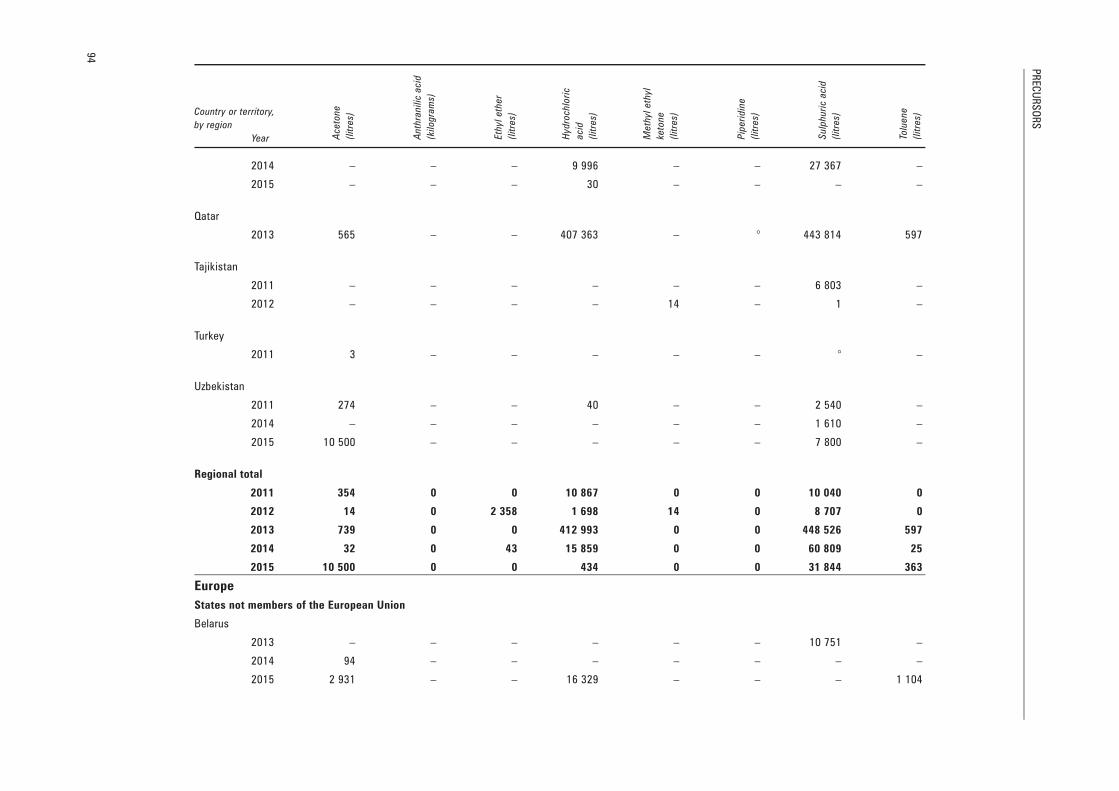
Country or territory,
by region
Year Ace
ton
e
(lit
res)
An
thra
nilic
acid
(kilo
gra
ms)
Eth
yl
eth
er
(lit
res)
Hyd
roch
lori
c
acid
(lit
res)
Me
thyl
eth
yl
keto
ne
(lit
res)
Pip
eri
din
e
(lit
res)
Su
lph
uri
c a
cid
(lit
res)
Tolu
en
e
(lit
res)
2014 – – – 9 996 – – 27 367 –
2015 – – – 30 – – – –
Qatar
2013 565 – – 407 363 – ° 443 814 597
Tajikistan
2011 – – – – – – 6 803 –
2012 – – – – 14 – 1 –
Turkey
2011 3 – – – – – ° –
Uzbekistan
2011 274 – – 40 – – 2 540 –
2014 – – – – – – 1 610 –
2015 10 500 – – – – – 7 800 –
Regional total
2011 354 0 0 10 867 0 0 10 040 0
2012 14 0 2 358 1 698 14 0 8 707 0
2013 739 0 0 412 993 0 0 448 526 597
2014 32 0 43 15 859 0 0 60 809 25
2015 10 500 0 0 434 0 0 31 844 363
Europe
States not members of the European Union
Belarus
2013 – – – – – – 10 751 –
2014 94 – – – – – – –
2015 2 931 – – 16 329 – – – 1 104

AN
NEX
ES
95
Country or territory,
by region
Year Ace
ton
e
(lit
res)
An
thra
nilic
acid
(kilo
gra
ms)
Eth
yl
eth
er
(lit
res)
Hyd
roch
lori
c
acid
(lit
res)
Me
thyl
eth
yl
keto
ne
(lit
res)
Pip
eri
din
e
(lit
res)
Su
lph
uri
c a
cid
(lit
res)
Tolu
en
e
(lit
res)
Norway
2013 1 – – ° – – – –
2015 – – – – – – – °
Russian Federation
2011 – – – 48 – – 66 –
2012 – – – 26 – – 91 433 –
2013 – – – 5 – – 15 –
2014 – – – 1 – – 7 –
2015 – – – 1 – – 14 –
Republic of Moldova
2015 – – – 2 – – ° –
Serbia
2012 – – – – – – – 20
Ukraine
2011 1 821 – 555 24 608 1 706 – 281 755 4 245
2012 10 324 – 9 216 2 211 720 – 3 302 20 089
2013 1 163 – – 3 053 – – 631 602
2015 4 275 – – 182 – – 35 24 180
States members of the European Union
Austria
2011 ° – 1 ° – – 2 –
2012 – – – – 18 – – 1
2013 3 – ° 9 – – – 6
2014 1 – – 18 – – 121 73
2015 7 – – 9 – – 5 4
PR
ECU
RS
OR
S
96
Country or territory,
by region
Year Ace
ton
e
(lit
res)
An
thra
nilic
acid
(kilo
gra
ms)
Eth
yl
eth
er
(lit
res)
Hyd
roch
lori
c
acid
(lit
res)
Me
thyl
eth
yl
keto
ne
(lit
res)
Pip
eri
din
e
(lit
res)
Su
lph
uri
c a
cid
(lit
res)
Tolu
en
e
(lit
res)
Belgium
2011 602 – – 839 – – 3 733 –
2012 52 – – 735 – – 30 –
Bulgaria
2011 – – 3 34 – – 20 –
2012 5 – 2 2 – – 10 –
2013 – – – 9 – – 2 12
Cyprus
2014 – – – ° – – – –
Czechiac
2014 1 380 – – 822 – – – 1 571
Estonia
2011 – – – – – – 3 10
2012 – – 5 – – – 27 –
2013 – – – 1 – – 1 –
2015 – – – ° – – ° –
Finland
2011 6 – – 23 – – 1 1
2012 – – – – – – 3 –
France
2012 – – 1 – 3 019 – 1 1
Germany
2011 17 – 5 77 63 – 8 9
2012 94 – 97 717 – – 71 1 164
2013 12 – ° 15 1 – 48 20

AN
NEX
ES
97
Country or territory,
by region
Year Ace
ton
e
(lit
res)
An
thra
nilic
acid
(kilo
gra
ms)
Eth
yl
eth
er
(lit
res)
Hyd
roch
lori
c
acid
(lit
res)
Me
thyl
eth
yl
keto
ne
(lit
res)
Pip
eri
din
e
(lit
res)
Su
lph
uri
c a
cid
(lit
res)
Tolu
en
e
(lit
res)
2014 10 – – 6 – – 27 17
2015 18 – – 6 – – 32 2
Hungary
2011 37 – 7 11 – – 4 6
2012 35 – 7 11 – – – –
2013 75 – 2 – – – ° –
2014 12 – – ° – – ° –
2015 26 – – – – – – 23
Latvia
2012 81 – ° 24 – – 12 –
Lithuania
2011 – – 2 – – – – –
Netherlands
2011 6 485 – – 8 429 – – 12 404 –
2012 1 245 – – 4 567 – – 2 020 –
2013 – – – 19 988 – – 8 165 1
2014 8 510 – – 13 825 – – 6 555 –
2015 20 887 – 812 20 266 409 – 28 265 465
Poland
2011 58 – 4 45 – – 58 103
2012 285 – – 3 575 – – 148 15
2013 – – – 40 – – 1 436 –
2014 130 – – 8 – – 11 196
2015 – – – 121 – – 57 7
PR
ECU
RS
OR
S
98
Country or territory,
by region
Year Ace
ton
e
(lit
res)
An
thra
nilic
acid
(kilo
gra
ms)
Eth
yl
eth
er
(lit
res)
Hyd
roch
lori
c
acid
(lit
res)
Me
thyl
eth
yl
keto
ne
(lit
res)
Pip
eri
din
e
(lit
res)
Su
lph
uri
c a
cid
(lit
res)
Tolu
en
e
(lit
res)
Portugal
2012 ° – – – – – – –
2013 3 – – 2 – – 1 –
2015 64 – 5 9 – – – –
Romania
2012 3 – – – – – – –
Slovakia
2011 3 – – 13 – – – 28
2012 1 – – 2 – – – 20
2013 – – – 8 – – – 6
2014 1 – 1 10 – – 3 18
2015 – – – 1 – – – 43
Spain
2011 1 – ° 1 1 – 1 °
2012 425 – 287 990 123 50 30 33
2013 1 190 – 297 490 2 197 – 1 086 979 11 511 987
2014 85 – 20 159 1 – 1 2
2015 941 – 78 4 412 1 061 – 444 1
Sweden
2011 – ° – – – – – –
United Kingdom
2012 – – 21 – 385 – – –
2013 – – – – – – 20 –
Regional total
2011 9 028 0 574 34 127 1 770 0 298 054 4 401
2012 12 549 0 9 635 12 859 4 266 50 97 087 21 343
2013 2 447 0 299 23 621 2 197 0 1 108 049 11 512 633
AN
NEX
ES
99
Country or territory,
by region
Year Ace
ton
e
(lit
res)
An
thra
nilic
acid
(kilo
gra
ms)
Eth
yl
eth
er
(lit
res)
Hyd
roch
lori
c
acid
(lit
res)
Me
thyl
eth
yl
keto
ne
(lit
res)
Pip
eri
din
e
(lit
res)
Su
lph
uri
c a
cid
(lit
res)
Tolu
en
e
(lit
res)
2014 10 221 0 21 14 851 1 0 6 724 1 878
2015 29 148 0 897 41 338 1 470 0 28 851 25 829
Oceania
Australia
2011 51 – 1 88 – – 9 14
2012 130 – – 112 16 – 62 83
2015 – 2 – – – – – –
New Zealand
2011 203 – – 308 26 – 28 476
2012 93 – – 137 – – 10 682
2013 108 – – 263 13 – 74 835
2015 45 – – 313 – – 46 140
Regional total
2011 254 0 1 396 26 0 37 490
2012 223 0 0 249 16 0 72 765
2013 108 0 0 263 13 0 74 835
2014 0 0 0 0 0 0 0 0
2015 45 2 0 313 0 0 46 140
World total
2011 696 666 0 20 970 679 785 7 343 12 2 040 787 142 307
2012 986 216 0 60 854 504 165 11 069 257 512 447 126 932
2013 1 038 128 490 302 43 708 2 332 546 9 264 59 4 146 274 11 749 436
2014 937 648 816 11 585 3 572 000 118 776 57 7 888 787 2 946 513
2015 989 743 9 577 26 368 1 472 951 2 628 0 930 335 285 170
a The exact quantity of the seizures was not specified.
b For statistical purposes, the data for China do not include those for the Hong Kong Special Administrative Region (SAR) of China and the Macao
SAR of China. c Since 17 May 2016, “Czechia” has replaced “Czech Republic” as the short name used in the United Nations.