seismicity in bushveld – problems …gse.vsb.cz/2007/liii-2007-1-1-14.pdf ·...
TRANSCRIPT

GeoScience Engineering Volume LIII (2007), No.1, p. 1-14, ISSN 1802-5420
Petr MIOVSKY*, Johann SCHEEPERS **
SEISMICITY IN BUSHVELD – PROBLEMS EXPERIENCED AT IMPALA PLATINUM MINES LIMITED NO. 10 SHAFT (SOUTH AFRICA)
DŮLNÍ OTŘESY A SOUVISEJÍCÍ PROBLÉMY V LOŽISKU BUSHVELD, IMPALA PLATINUM MINES LIMITED, DŮL Č. 10 (JIHOAFRICKÁ REPUBLIKA)
Abstract No.10 Shaft is one of thirteen operating shafts within the Rustenburg section of
Impala Platinum Limited. With increasing depth of mining, the level of seismic activity also increases. Unlike deep South African gold mines, where seismic events are mainly generated as shear type events on geological discontinuities, seismic activity on No. 10 Shaft results from crush type and mixed mechanism type events. This paper ties to explain these phenomena.
Abstrakt Důl č.10 je jednou ze třinácti těžících šachet společnosti Impala Platinum
Limited, oblast Rustenburg. S narůstající hloubkou dobývání dochází i ke zvyšování frekvence důlních otřesů. Na rozdíl od hlubokých zlatých dolů, kde otřesy jsou převážně způsobovány vlivem posuvu (smyku) kontaktu na geologických poruchách, na dole č.10 jsou důlní otřesy způsobovány hlavně pnutím v pilířích, jejichž mechanismus se dá zařadit mezi lokálně zvané „tlakové“ nebo „smíšené“ typy otřesů. V tomto článku se autoři snaží tento mechanismus vysvětlit.
Key words: Crush type events, yield pillars, large pillars, seismic monitoring and analysis, seismic risk management
1 INTRODUCTION South African mines produce the majority of the platinum group metals (PGM) in
the world, with Impala Platinum Limited being the world’s second largest PGM mining group. Mining takes place within the Bushveld Complex, an igneous intrusion that extends some 450 km to the East-West direction and 150 km to the North-South direction. The orebodies that are exploited are the Merensky horizon (being mined first) and UG2 chromitite seams (being mined second), both of which are narrow and tabular. The orebodies are commonly referred to as reefs. Refer to geological succession of Merensky and UG2 reefs on No. 10 Shaft – Figure 1. At No. 10 shaft, the orebodies dip
* Impala Platinum Limited, P.O.Box 5683, Rustenburg 0300, South Africa, e-mail
[email protected] ** Impala Platinum Limited, P.O.Box 5683, Rustenburg 0300, South Africa, e-mail
1

at approximately 10º towards the East. The middling between the two reefs is about 80 m and the Merensky is the upper one. The mining depth ranges from 650 to 1300 meters below surface. Since the middling of 80 m is quite substantial, there is effectively no influence of abutment stresses caused by pillars left on Merensky horizon on the lower reef excavations.
The exploitation method employed is scattered breast stoping, at a 1.0 m stoping width with scraper cleaning. The reefs are accessed by means of the off-reef development, and then opened up by means of on-reef raises and winzes which are spaced approximately 180 m apart. Panels are advanced on breast from these on-reef connections. Panel spans on average 31 m and are separated by in-stope yield pillars, of a rectangular shape with dimensions of 6 m x 3 m with 2 m holings between them. The average advance of a panel is between 15 and 20 meters per month. Refer to Figure 2 for a typical stoping layout on Impala Platinum Mine.
Fig. 1 Geological succession of Merensky and UG2 reefs to No. 10 Shaft
Drive
Raise
Travelling way
Orepass
ASG (Advanced Strike Gully)
6 x 3 m pillars
Panel face
Panel siding
Dip
Fig. 2 Typical stoping layout on Impala Platinum Mine
2

At No. 10 shaft, the Merensky horizon constitutes approximately 90% of production; the UG2 takes up the remaining 10%. With the gradual increase of mining depth and associated stress levels, failure of excavation rock walls is inevitable. While this failure is generally gradual and non-violent, energy is occasionally released violently in the form of seismic activity. Unlike deeper gold mines (2500 – 4000 m below surface), where seismicity is generated mainly by shear type events located on geological discontinuities, the seismic activity recorded to date at No. 10 Shaft has comprised crush-type and mixed-mechanism events, located on the in-stope pillars.
Seismological setting The Impala Platinum lease area lies within the Rustenburg / Brits fault system,
which is considered moderately seismically active (Figure 3, Figure 5 and Figure 6). The area produced twenty natural seismic events in the range 1.8<ML<3.4 during 2003 alone. Impala Platinum recorded more than one thousand events in the range 0.0<ML<2.1 between May 2005 and May 2006. A very large proportion of these events occur due to the violent failure of in-stope pillars. The relationship between natural occurring and mining-induced seismicity in the Impala Platinum lease area is not known.
Fig. 3 Concentrations of seismic activity in South Africa, showing the location of Impala Platinum’s Rustenburg operations. Picture adapted from Geoclips March 2002,
publication of South African Council for Geoscience
3
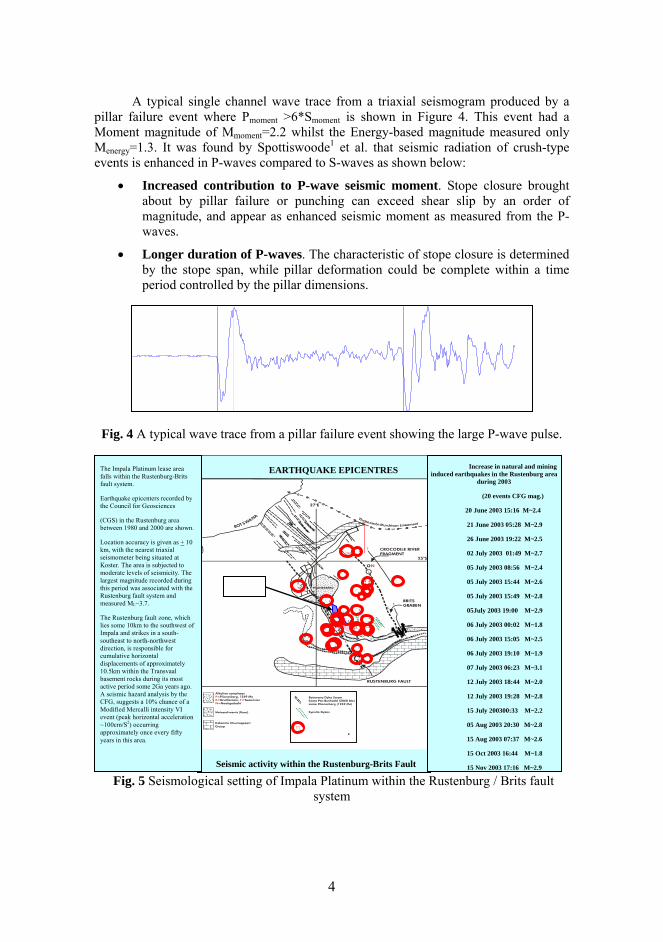
A typical single channel wave trace from a triaxial seismogram produced by a pillar failure event where Pmoment >6*Smoment is shown in Figure 4. This event had a Moment magnitude of Mmoment=2.2 whilst the Energy-based magnitude measured only Menergy=1.3. It was found by Spottiswoode1 et al. that seismic radiation of crush-type events is enhanced in P-waves compared to S-waves as shown below:
• Increased contribution to P-wave seismic moment. Stope closure brought about by pillar failure or punching can exceed shear slip by an order of magnitude, and appear as enhanced seismic moment as measured from the P-waves.
• Longer duration of P-waves. The characteristic of stope closure is determined by the stope span, while pillar deformation could be complete within a time period controlled by the pillar dimensions.
Fig. 4 A typical wave trace from a pillar failure event showing the large P-wave pulse.
Fig. 5 Seismological setting of Impala Platinum within the Rustenburg / Brits fault system
Seismicity – overviewSeismological
E
EARTHQUAKE EPICENTRES
Seismic activity within the Rustenburg-Brits Fault
Increase in natural and mining induced earthquakes in the Rustenburg area
during 2003
The Impala Platinum lease area falls within the Rustenburg-Brits fault system.
(20 events CFG mag.) Earthquake epicenters recorded by the Council for Geosciences
20 June 2003 15:16 M~2.4 (CGS) in the Rustenburg area between 1980 and 2000 are shown. 21 June 2003 05:28 M~2.9
26 June 2003 19:22 M~2.5 Location accuracy is given as + 10 km, with the nearest triaxial seismometer being situated at Koster. The area is subjected to moderate levels of seismicity. The largest magnitude recorded during this period was associated with the Rustenburg fault system and measured ML~3.7.
02 July 2003 01:49 M~2.7
05 July 2003 08:56 M~2.4
05 July 2003 15:44 M~2.6
05 July 2003 15:49 M~2.8
05July 2003 19:00 M~2.9 The Rustenburg fault zone, which lies some 10km to the southwest of Impala and strikes in a south-southeast to north-northwest direction, is responsible for cumulative horizontal displacements of approximately 10.5km within the Transvaal basement rocks during its most active period some 2Ga years ago. A seismic hazard analysis by the CFG, suggests a 10% chance of a Modified Mercalli intensity VI event (peak horizontal acceleration ~100cm/S2) occurring approximately once every fifty years in this area.
06 July 2003 00:02 M~1.8
06 July 2003 15:05 M~2.5
06 July 2003 19:10 M~1.9
07 July 2003 06:23 M~3.1
12 July 2003 18:44 M~2.0
12 July 2003 19:28 M~2.8
15 July 200300:33 M~2.2
05 Aug 2003 20:30 M~2.8
15 Aug 2003 07:37 M~2.6
15 Oct 2003 16:44 M~1.8
15 Nov 2003 17:16 M~2.9
4
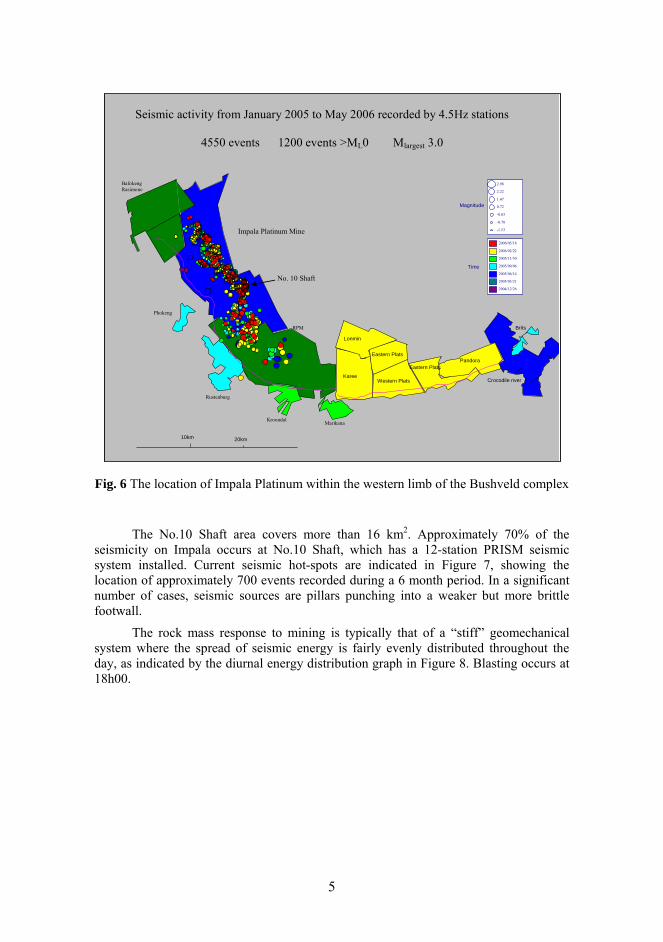
Seismic activity from January 2005 to May 2006 recorded by 4.5Hz stations
4550 events 1200 events >ML0 Mlargest 3.0
2.98 2.22 1.47 0.72 -0.03 -0.78 -1.53
Magnitude
2006/05/18 2006/02/22 2005/11/30 2005/09/06 2005/06/14 2005/03/21 2004/12/26
Time
10km 20km
Rustenburg
Phokeng
Kroondal Marikana
Bafokeng Rasimone
RPM
Lonmin
Brits
Crocodile river Karee
Pandora Eastern Plats
Western Plats
Eastern Plats
Impala Platinum Mine
No. 10 Shaft
Fig. 6 The location of Impala Platinum within the western limb of the Bushveld complex
The No.10 Shaft area covers more than 16 km2. Approximately 70% of the seismicity on Impala occurs at No.10 Shaft, which has a 12-station PRISM seismic system installed. Current seismic hot-spots are indicated in Figure 7, showing the location of approximately 700 events recorded during a 6 month period. In a significant number of cases, seismic sources are pillars punching into a weaker but more brittle footwall.
The rock mass response to mining is typically that of a “stiff” geomechanical system where the spread of seismic energy is fairly evenly distributed throughout the day, as indicated by the diurnal energy distribution graph in Figure 8. Blasting occurs at 18h00.
5

1.31
0.79
0.28
-0.23
-0.75
-1.26
-1.77
Mag
nitu
de
2005/ 09/ 14
2005/ 08/ 08
2005/ 07/ 01
2005/ 05/ 25
2005/ 04/ 17
2005/ 03/ 11
2005/ 02/ 01
Tim
e
Fig. 7 Location of approximately 700 events recorded on 10 Shaft during a 6 month period
Seismic Energy Distribution 10 Shaft
Ener
gy *1
0^7
0.00.51.01.52.0
Hour of day0 1 2 3 4 5 6 7 8 9 10111213141516171819202122230 1
Fig. 8 Diurnal energy (joules) distribution on 10 Shaft
Geotechnical setting The present major source of seismicity can be attributed to the bursting of pillars
located in the back areas. The mine’s support strategy includes the use of 20 m wide dip-oriented regional barrier pillars spaced 250 – 400 m apart, complemented by yielding in-stope 6 x 3 m rectangular pillars with 2 m holings, to control local subsidence. Since there is much additional ground left in situ in the form of geological losses, off-reef areas, areas abandoned due to poor ground conditions etc, the overall system can be regarded as stiff. Refer to Figure 9 for support standard in a typical seismic stope panel.
6

2 YELLOW AREAS – IN-STOPE BOLTING (YIELDING PROPS) – 10# SPECIFIC
1,5m
Hydrabolt max distances: 2.0m from face after blast 1,5m apart on dip (max) 1,6m apart on strike (max) 0.3m from face before blasting the face Yielding props max 6m from face after blast Breakerline spaced 9 m apart and a maximum of 15 m from the face after blast
5,6m max
PILLAR
3m
PILLAR
1,5m
6m3m
PILLAR
1.5 m XPandabolts max 2m from face after blast, max 0.3 m from face before blast, 1m apart on dip, 1m apart on strike
3m
3.5m
3m
3m
3m
3.2m
1.5 max
5,6m max
MAXIMUM LEDGING
1.5m 1.6m
1.6m
3.0m
1.5m2.0m
2.0m
2.0m
9m (max)
Siding support 4m max. from face after blast, 1.5m from ASG centerline 2m apart on strike (pre-stressed) Siding to be carried in line with ASG face
3m
2.0m
1,6m
1.5m
If bolts are less than 2.0 m from the panel or ASG face at any time, no temporary support is required
Face i h
HAZARDOUS GEOLOGICAL DISCONTINUITY WITH ADDITIONAL SUPPORT
1.6m
1.5m
2m
1.5m
Fig. 9 Support standard for a typical seismic stope panel
The shape of most pillars is uneven; even the in-stope pillars are not cut very accurately; hence the load distribution on all these pillars is uneven. Given the effects of varying rock properties within the rockmass, jointing, high horizontal stresses with changing orientation, etc, it is not surprising that at some stage some of these pillars “pop”. Usually this occurs remote from current mining faces (some 20 to 50 meters), which underlines the opinion that the response of mining in such a stiff loading system is delayed and hence difficult to predict. However, as mining progresses deeper violent spalling of pillars tends to occur closer to the face (Lougher2, 1993). Figures 10 and 11 show the comparison between the behavior of normally cut yield pillar and a pillar that was cut too big.
7

Pillar yielding mechanism – when pillars are cut correctly their skin fractures gradually with increasing load as the panel advances forward. The core of the pillar will be fractured at certain stage and the residual strength will provide required support resistance.
Gully Yield pillar
3 m
Stress fracturing of pillar skin
Gully
10º
Fig. 10 Simplified behaviour of normally cut yield pillar (section along panel face)
Abnormally large pillar mechanism – when pillars are cut incorrectly, i.e. they are too wide their skin does not fracture gradually. The core of the pillar will absorb the energy and release it violently, depending on the load of the pillar given by the extraction of the area.
Gully Large pillar of critical width
5-10 m
Pillar will not show typical stress fracturing of pillar skin; instead a build up of energy will result in violent pillar burst
10º
Ejected rocks
Ejected rocks
Fig. 11 Simplified behaviour of abnormally large cut pillar (section along panel face)
The following photographs are attached to illustrate typical crush type events (Figures 12-15). Due to numerous events that occurred at No.10 Shaft, the resulting effect was often a collapse of the hanging wall caused by overloading of mine poles. Many units were removed by ejected rock and remaining units were overloaded. These mine poles were not designed to absorb dynamic load.
Seismic Risk Management There are several systems in place to address the seismic risk on Impala and
especially at No. 10 Shaft. Seismic stickers (see Figure 16) were created and are being placed on underground mine plans to indicate areas where high seismic risk exists. A seismic procedure for addressing these issues is in place. The procedure addresses the following issues:
8
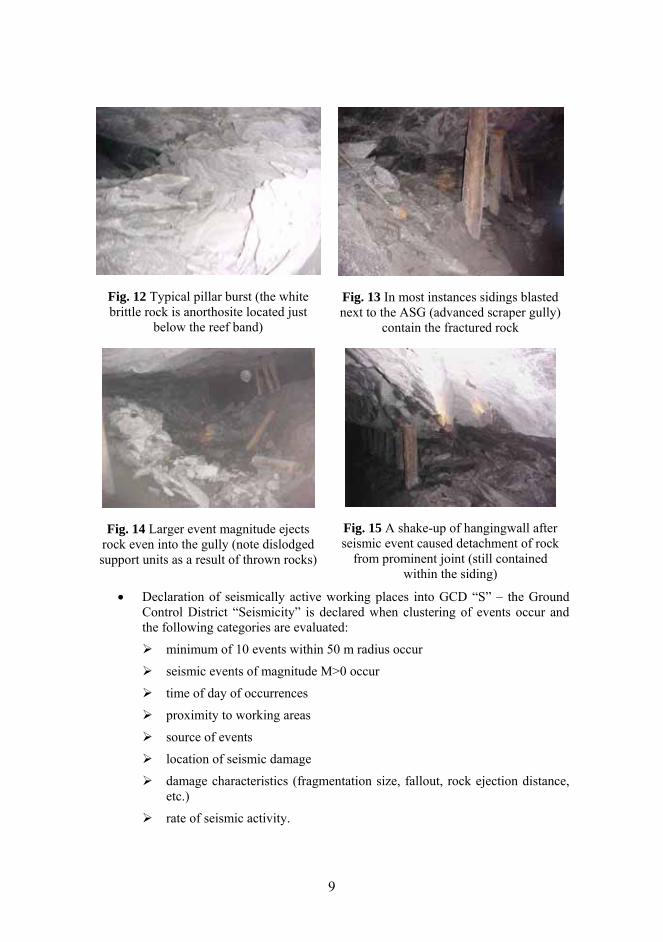
Fig. 12 Typical pillar burst (the white brittle rock is anorthosite located just
below the reef band)
Fig. 13 In most instances sidings blasted next to the ASG (advanced scraper gully)
contain the fractured rock
Fig. 14 Larger event magnitude ejects rock even into the gully (note dislodged support units as a result of thrown rocks)
Fig. 15 A shake-up of hangingwall after seismic event caused detachment of rock
from prominent joint (still contained within the siding)
• Declaration of seismically active working places into GCD “S” – the Ground Control District “Seismicity” is declared when clustering of events occur and the following categories are evaluated:
minimum of 10 events within 50 m radius occur
seismic events of magnitude M>0 occur
time of day of occurrences
proximity to working areas
source of events
location of seismic damage
damage characteristics (fragmentation size, fallout, rock ejection distance, etc.)
rate of seismic activity.
9

• Seismic evacuation procedure – emergency escape route from potentially affected working places demarcated on the underground plan, location of gathering point, re-examination of the working place after a seismic event, first aid requirements, location of a telephone etc.
• Seismic notice boards at the entrance in each working place.
• Special support standard corresponding with expected ground conditions in such areas.
• Daily, weekly and monthly seismic analysis and reporting to the management. These reports contain shaft plan with plotted event locations, time and magnitude of all events and reported damage if any (after the investigation).
2. Evacuation
3. Support
1. Demarcated
4. Crew
5. Crew No.
Fig. 16 Seismic sticker
Referring to special support standards, i.e. Figure 9, we have tested several support elements to cater for these quite unique conditions. The requirements are such that at 1300 m below surface the elastic closure is such that support unit must have yielding capabilities. On top of that, in the case of seismic event the support unit must absorb some dynamic loading from the hanging wall or footwall. Eventually we selected 200 mm diameter Stromaster prop (Figure 17) in combination with Apollo pack (Figure 18). The Stromaster yielding prop is being pre-stressed to 200 kN and has maximum yield of 450 mm and maximum load of 500 kN. The Apollo pack consists of 550 x 500 x 110 mm mats, wedged and pre-stressed to 100 kN, it has a maximum load of 2000 kN at 500 mm displacement. Since the introduction of these units almost 2 years ago the number of panel collapses at 10 Shaft decreased significantly. See also the load deformation characteristics of these two support units, in Figures 19 and 20.
From Figure 9 is also evident that in-stope roof bolting plays a major role in panel stability, especially in terms of preventing small rocks falling out. The roof bolts used are friction bolts consisting of 26 mm diameter “c” shaped steel tube, faceplate, collar and a valve with built-in load indicator. The bolt length is determined by local conditions, on average in a panel it is 1.2 m, in gullies 1.5 m. The minimum bond length required is 300 mm. The bolt is pumped at 25 MPa (pre-set pressure at the pump); it has yield bond strength of 50-70 kN and maximum tensile strength of 80 kN. It has to be noted that the hole diameter is critical for any friction bolt. On Impala the hole diameter range used is 32 - 36 mm.
10

Fig. 17 Strocam yielding props
Fig. 18 Apollo pack
Fig. 19 Load-deformation curve of Strocam yielding prop (dynamic loading)
Fig. 20 Load-deformation curve of Apollo pack
An updated and expanded PRISM seismic network is currently being installed. This seismic network will cover the entire Impala lease area. Phase 1, which is to be completed in late 2007, consists of 48 tri-axial recording stations of which 9 will be located on surface. A tri-axial 1Hz station has been installed to monitor natural earthquake activity in the area. The No.10 Shaft seismic network consists of 12 recording stations and has been fully operational since April 2005.
3 CONCLUSIONS Prediction of seismic events has always been an ultimate goal in deep level
mining. We are still far away from being able to tell when and where an event will occur. South African mining industry is however making big strides towards trying to analyze existing mining situation with use of numerical modeling and seismological data and to get closer to predicting the location and perhaps the time frame of potentially damaging seismic events. The seismic monitoring keeps improving and we made some progress in understanding the behavior of the rockmass under certain loading conditions. The numerical modeling also assists in predicting of rockmass behavior in future mining.
11

At No.10 Shaft we are pioneers in many aspects of deep level platinum mining, especially with regards to seismicity and its effect on mining. Nevertheless, there are still some unknown factors, such as gradual changes in rock properties and thus various rock behavior under similar mining environment or the varying height of tensile zone as a result of extension fracturing, which must be examined and understood. Only then a progress will be made.
REFERENCES [1] Spottiswoode SM, Aref K, Jager AJ, 1995. An assessment of seismicity at
Wildebeestfontein North Mine Impala Platinum and Frank Shaft Anglo Platinum. SIMRAC project report GAP 027/028 CSIR Miningtek South Africa. (SIMRAC: Seismicity In Mines Research Advisory Committee) *The Wildebeestfontein North mine is currently called 10 Shaft.
[2] Lougher, DR. Personal communication. Rock Engineering Manager Impala Platinum 1990 – 1994.
RESUMÉ Tento příspěvek pojednává o specifických problémech dobývání na platinovém
dole č.10 společnosti Impala Platinum Limited (Jihoafrická Republika). Platinové ložisko zvané Bushveld Complex (vyvřelé horniny) je největší na světě (rozloha zhruba 450 x 150 km). V oblasti, kterou dobývá Impala Platinum Limited se nachází dvě ploché rudné žíly, horní zvaná Merensky a spodní zvaná UG2. Úklon ložiska je asi 10º na východ. Na dole č.10 mají obě žíly zhruba 1 metr mocnost a jsou nad sebou vzdáleny asi 80 metrů. Hloubka dobývání se pohybuje od 650 do 1300 metrů pod povrchem. Dobývací metoda je stěnování. Chodby (Drives) jsou raženy 20 metrů v podloží. Z nich vede do ložiska přístupová cesta (Travelling way) a těžní komín (orepass). Poté co je přístup na žílu umožněn se razí úpadnice (raises). Vzdálenost mezi jednotlivými úpadnicemi je asi 180 metrů. Z každé úpadnice se začínají zakládat dobývky (panels), a to na obě strany (severní a jižní). Každá dobývka je asi 30 metrů dlouhá, průměrný postup jedné dobývky je 15 -20 metrů za měsíc. Na spodním okraji dobývky je těžní chodba (ASG), do které se jedním škrabákovým vrátkem dopravuje rubanina a druhý vrátek je na centrální těžní chodbě (bývalé úpadnici). Hlavní vrátek pak těží do komína. Z dobývkové těžní chodby (ASG) vede nahoru po úklonu vlastní dobývka, dolů pak krátké rameno (tzv. panel siding), které slouží k tomu, aby důlním tlakem popraskaná hornina nepadala do těžní chodby, ale zůstala na tomto rameni. Na horním konci panelu je řada pilířů obdélníkového tvaru, jejichž rozměry jsou 6 x 3 metry s dvoumetrovými mezerami na průchod větrání a osádky. Tyto pilíře byly navrženy tak, aby sloužily jako poddajná výztuž (tzv. yielding pillar design). V nevelkých hloubkách dobývání se tyto pilíře „chovají“ jako pevné (stiff), ve větších hloubkách jsou pak poddajné důlním tlakům (yielding). S tím jak dobývky postupují do pole se na každý pilíř rozkládá tlak nadloží. Tímto dochází k praskání pilíře na jeho okraji a postupnému odpadávání horniny. Obrázek č.2 schematicky znázorňuje dobývací metodu. Vyrubaný prostor mezi pilíři je pak vyztužen jak znázorňuje obrázek č.9.
Jedním z největších problémů na dole č.10 jsou důlní otřesy. Jejich původ se dá vysvětlit následovně. Oblast, ve které dobývá Impala Platinum Limited se nachází mezi
12

dvěma výraznými geologickými poruchami, tzv. Rustenburg a Brits-Graben fault. Tyto dvě poruchy jsou známy jako seismicky aktivní – obrázek č.3 znázorňuje polohu ložiska, kde Impala Platinum dobývá, obrázek č.5 zobrazuje výskyt a velikost otřesů dle Richterovy stupnice za období mezi lety 1980 a 2000, obrázek č.6 pak zobrazuje detailnější seismickou aktivitu západní části ložiska Bushveld Complex. Otřesy na dole č.10 jsou způsobovány zejména pnutím v pilířích, jejichž mechanismus se dá zařadit mezi tzv. „tlakové“. Existuje také výskyt tzv. „smíšených“ typů otřesů, jejichž původ je částečně způsoben posuvy (smykem) kontaktů na geologických poruchách v blízkosti pilířů. Z důvodu geologických poruch je často nutné zkrátit délku dobývek a tím se podstatně zvětšuje plocha pilířů. A právě tyto větší pilíře jsou schopny akumulovat napětí jako důsledek konvergence a až dojde k jejich mezi únosnosti, projeví se jeho uvolnění dosti silně ve formě otřesu. V takovém případě dojde k emisi seismické vlny, jejíž typický tvar je na obrázku č.4. Primární vlna má poněkud prodloužené trvání v závislosti na náběhu sekundární vlny. Obrázky č.7 a 8 ukazují výskyt a distribuci energie otřesů na dole č.10. Rozdíl „chování“ normálního pilíře a abnormálně velkého pilíře je znázorněn na obrázcích č.10 a 11. Z nich je patrné, že normální pilíř pozvolna praská na okrajích a tento mechanismus postupně proniká ke středu pilíře, v závislosti na nárůstu napětí vlivem postupu dobývky. Abnormálně velký pilíř je příliš pevný na to, aby se jeho napětí postupně uvolňovalo ve formě praskání na obvodu, jako je tomu u normálního pilíře, ale dochází často k náhlému uvolnění napětí a následovnému „vystřelení“ horniny. Toto je samo sebou nebezpečná situace pro osádku. K ilustraci právě popsaných jevů je přiloženo několik fotografií (obrázky č.12 až 15). Za zmínku stojí obrázky č.13 a 15, ze kterých je patrná funkce krátkého ramene dobývky, kdy „vyhozená“ hornina zůstává ležet na rameni a neohrožuje osádku na těžní chodbě. Obrázek č.14 ukazuje, že ani krátké rameno v některých případech není dostačující, zejména pokud jde o nadměrně velký pilíř. Z hlediska kontroly a managementu rizika otřesů na dole č.10 i na jiných dolech Impala Platinum Limited, kde podobné problémy začínají, jsou dodržovány určité pracovní postupy a procedury. Vychází se z informací sítě geofonů. Dva seismologové analyzují data a informují management denně, týdně a měsíčně o lokaci a velikosti otřesů. Dále jsou na důlních mapách označena riziková pracoviště symbolem (obrázek č.16), podle kterého osádka ví, která ustanovení a nařízení musí být dodržována. V neposlední řadě je důležité, aby výztuž byla schopna reagovat na konvergenci a také na dynamické pohyby nadloží způsobené otřesy v blízkosti pilířů. Po mnoha testech a zkouškách jak v laboratoři tak v dole, byly vybrány dva hlavní typy výztuže, které jsou zobrazeny na obrázcích č.17 a 18. Jejich charakteristiky jsou na obrázcích č.19 a 20.
Předpovídat otřesy při hlubinném dobývání nebylo nikdy jednoduché, zejména pokud se jedná o zodpovězení otázky „Kdy?“. Jihoafrická Republika je považována za světového lídra, co se týče monitorování a „předpovídání“ důlních otřesů ve velkých hloubkách. Poznatky nejmodernější techniky, ať už seismologické, numerického modelování důlních situací nebo nejnovější typy výztuží, pomáhají k tomu, že se postupně blížíme k plnému porozumění chování horninového masivu a možnému předpovídání otřesů ve velkých hloubkách. Existují však některé faktory jako například postupné změny mechanických vlastností hornin a tím pádem jejich rozdílné chování pod napětím, které musí být podrobně analyzovány a pochopeny. Až poté nastane výrazný pokrok.
13

Reviewer: Doc. Ing. Richard Šňupárek, CSc. – Ústav geoniky AV ČR
Ing. Petr Schreiber, CSc.
14