seismic/eruption lawrence w. braile braile/ using the seismic/eruption program in teaching larry...
Post on 21-Dec-2015
220 views
TRANSCRIPT
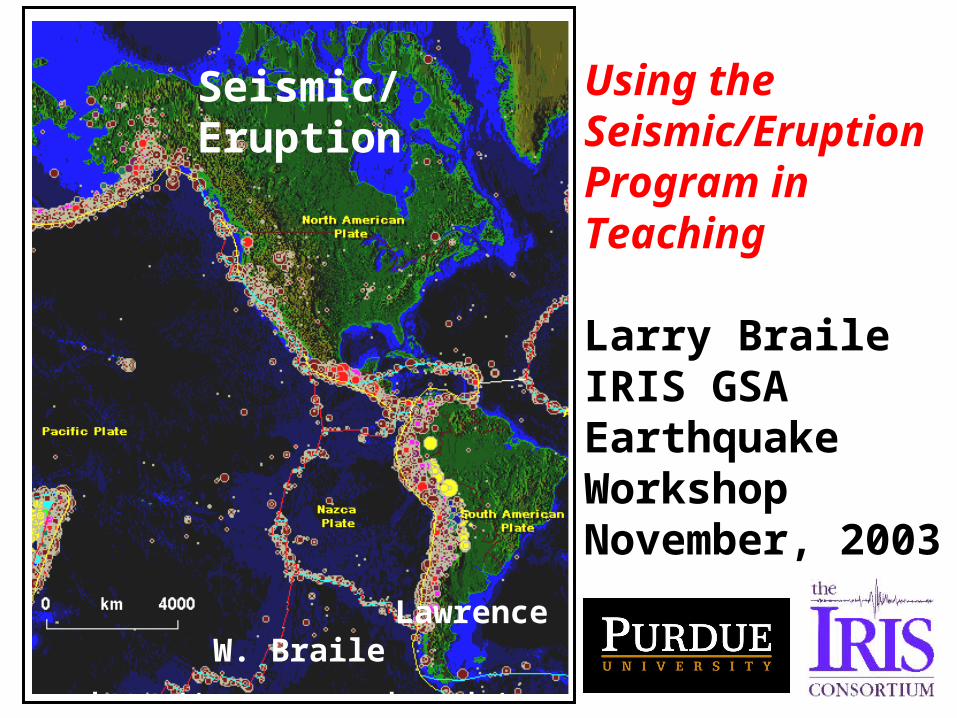
Seismic/Eruption
Lawrence W. Braile
http://www.eas.purdue.edu/~braile/
Using the Seismic/Eruption Program in Teaching
Larry BraileIRIS GSA Earthquake WorkshopNovember, 2003

Seismic/EruptionSeismic/Eruption includes up-to-date earthquake and volcanic eruption catalogs and allows the user to display earthquake and volcanic eruption activity in “speeded up real time” on global, regional or local maps that also show the topography of the area in a shaded relief map image. Seismic/Eruption is an interactive program that includes a number of tools that allow the user to analyze earthquake and volcanic eruption data and produce effective displays to illustrate seismicity and volcano patterns.
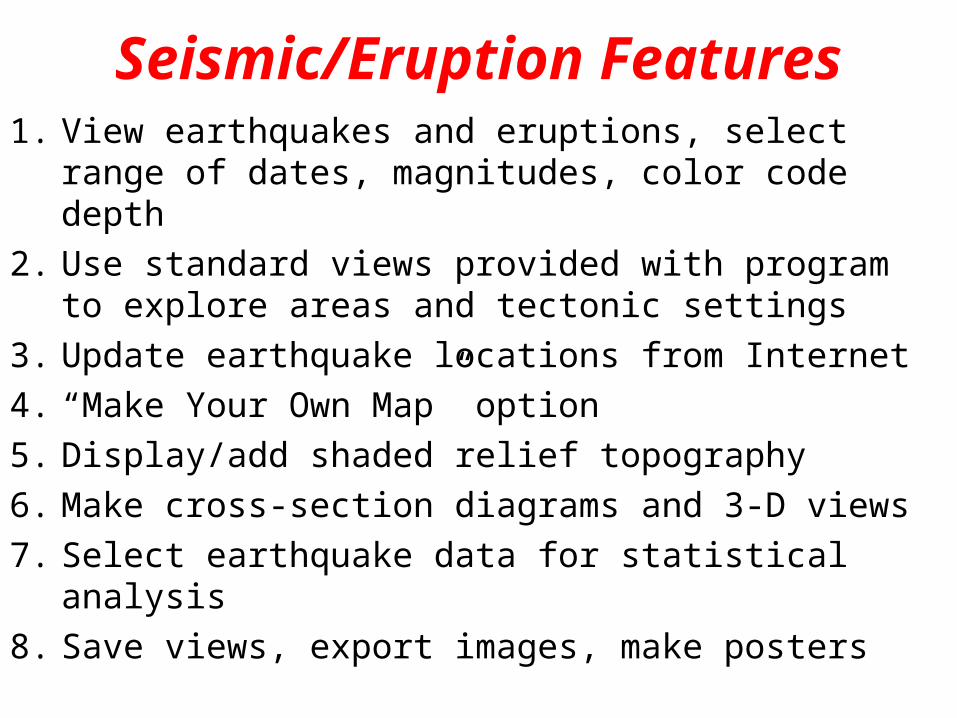
Seismic/Eruption Features1. View earthquakes and eruptions, select
range of dates, magnitudes, color code depth
2. Use standard views provided with program to explore areas and tectonic settings
3. Update earthquake locations from Internet
4. “Make Your Own Map” option
5. Display/add shaded relief topography
6. Make cross-section diagrams and 3-D views
7. Select earthquake data for statistical analysis
8. Save views, export images, make posters
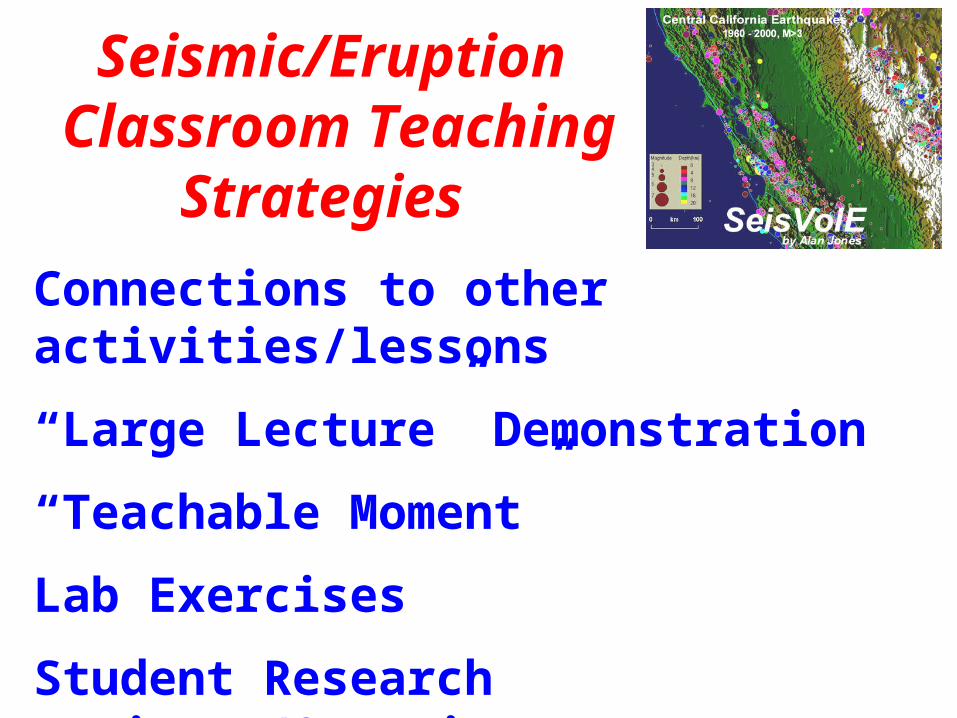
Seismic/Eruption Classroom
Teaching Strategies
Connections to other activities/lessons
“Large Lecture” Demonstration
“Teachable Moment”
Lab Exercises
Student Research Projects/Questions
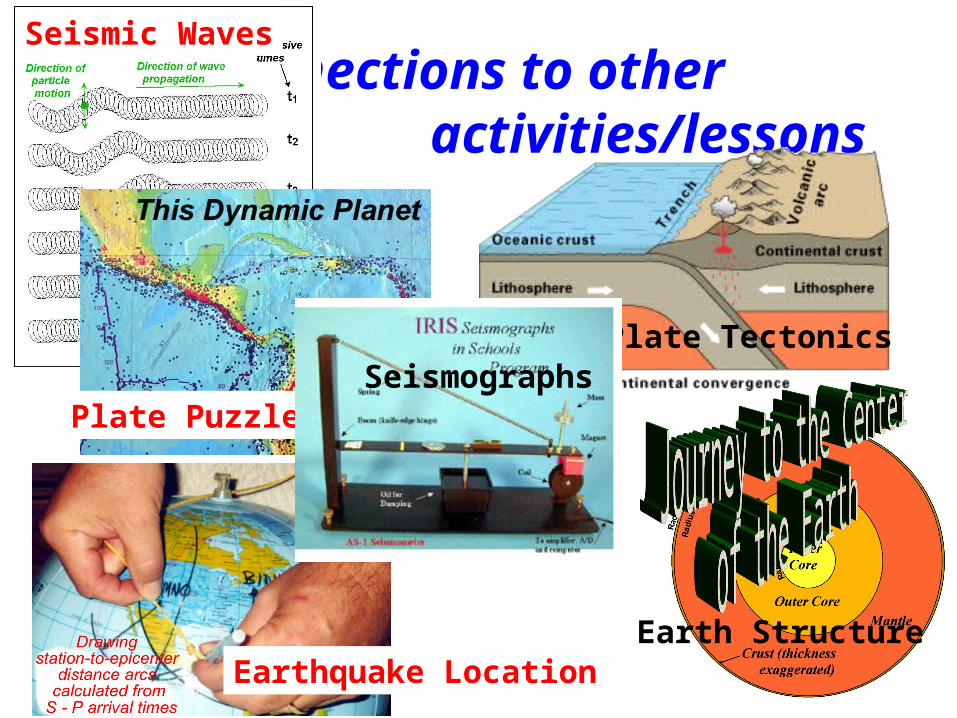
Connections to other
activities/lessons
Earthquake Location
Plate Tectonics
Earth Structure
Plate PuzzleSeismographs
Seismic Waves
“Teachable Moment”
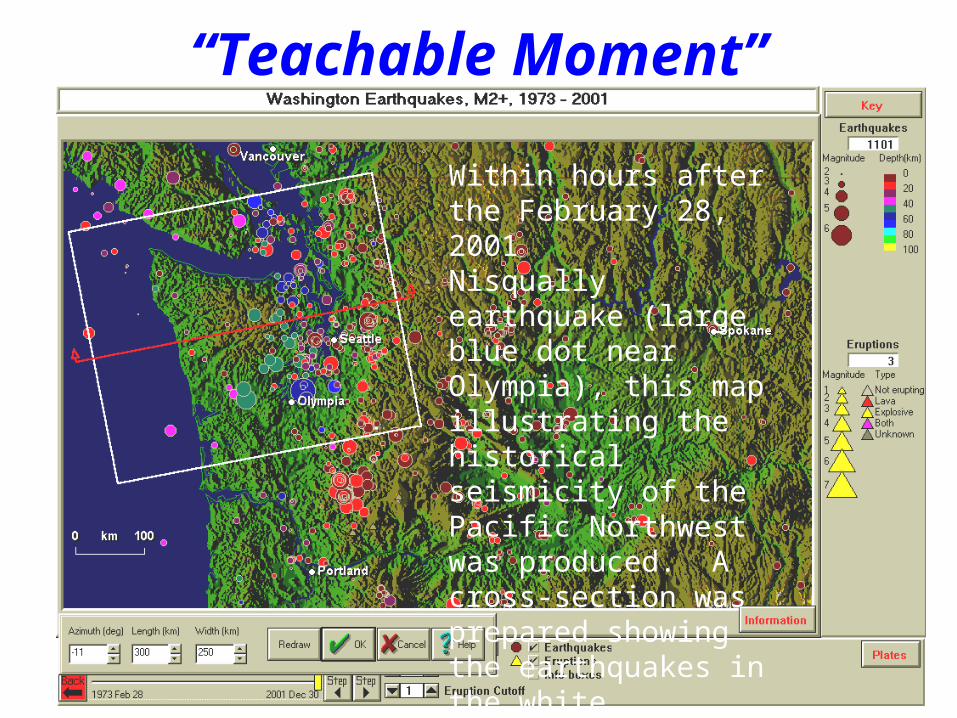
Within hours after the February 28, 2001Nisqually earthquake (large blue dot near Olympia), this map illustrating the historical seismicity of the Pacific Northwest was produced. A cross-section was prepared showing the earthquakes in the white rectangle.
“Teachable Moment”
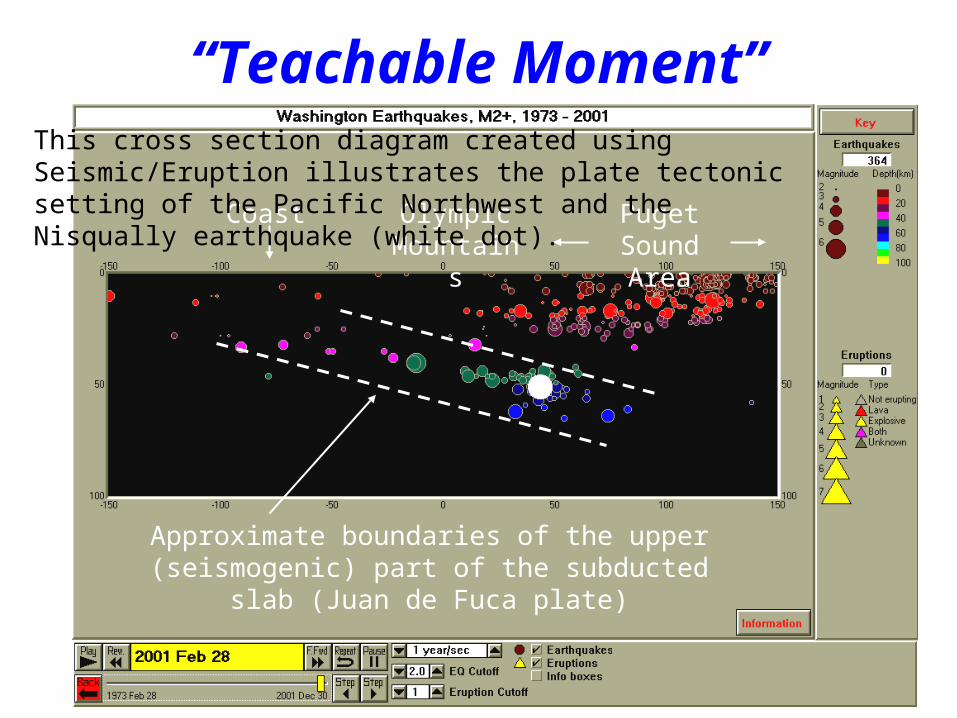
Puget SoundArea
Coast
Approximate boundaries of the upper (seismogenic) part of the subducted slab (Juan
de Fuca plate)
Olympic Mountains
This cross section diagram created using Seismic/Eruption illustrates the plate tectonic setting of the Pacific Northwest and the Nisqually earthquake (white dot).
Student Research Projects/Questions
10
100
1000
10000
6 7 8 9 10
Magnitude
Faul
t Len
gth
(km
)
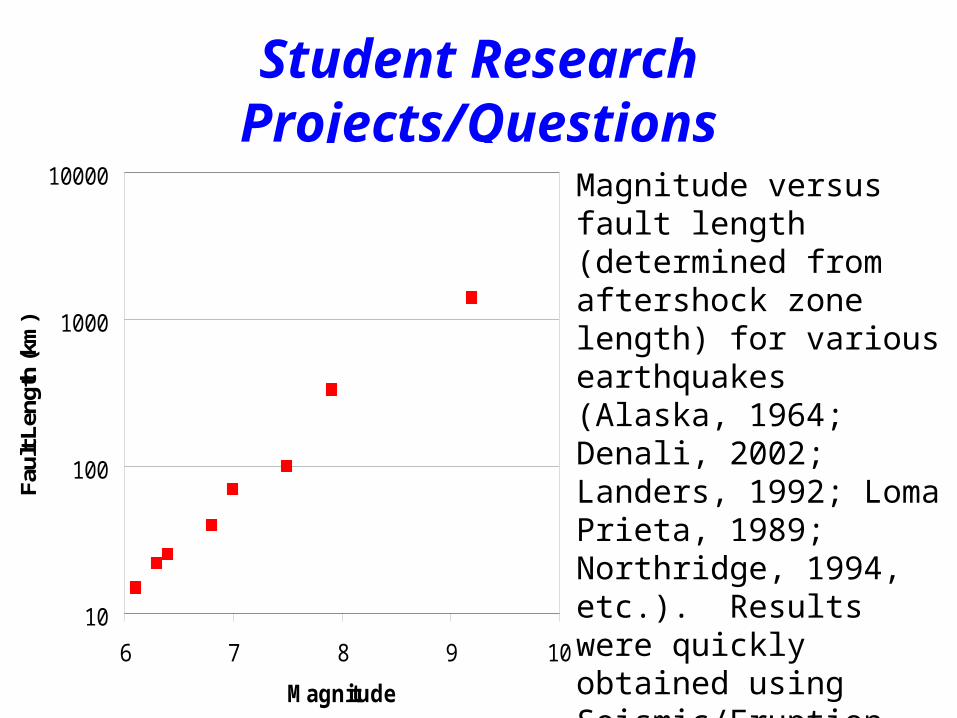
Magnitude versus fault length (determined from aftershock zonelength) for various earthquakes (Alaska, 1964; Denali, 2002; Landers, 1992; Loma Prieta, 1989; Northridge, 1994, etc.). Results were quickly obtained using Seismic/Eruption views. Graph can be logarithmic (as shown) or linear.

Student Research Projects/Questions
After a significant earthquake, how long will the aftershocks last?
How large are the aftershocks likely to be?
(Feb. 3, 1965, M8.7 Rat Island, Alaska, earthquake)
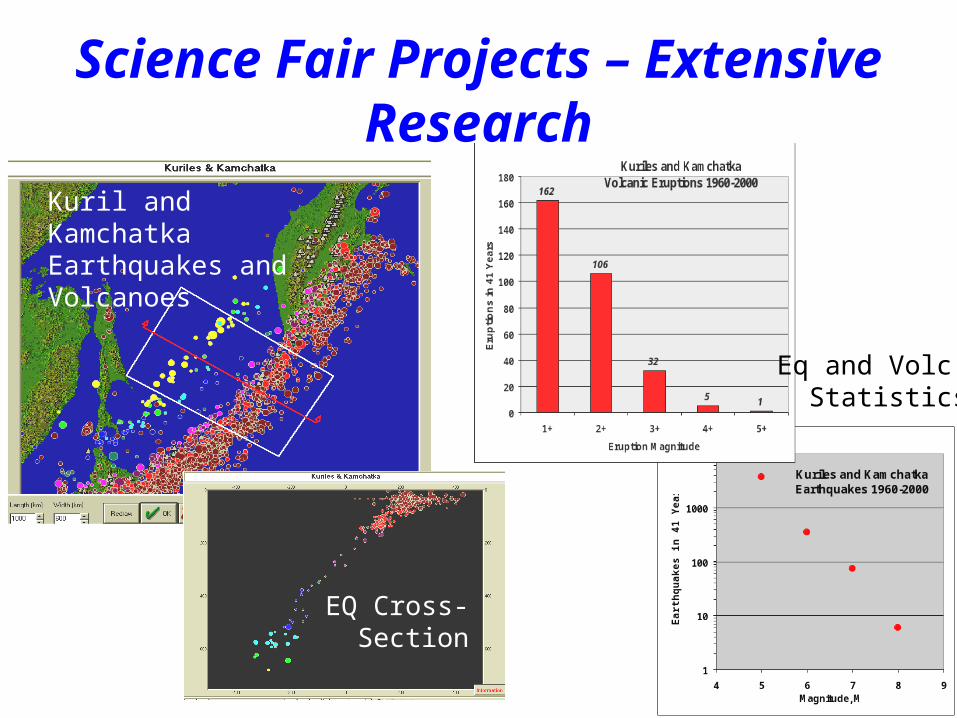
Science Fair Projects – Extensive Research
Kuril and KamchatkaEarthquakes and Volcanoes
EQ Cross- Section
Eq and Volc. Statistics
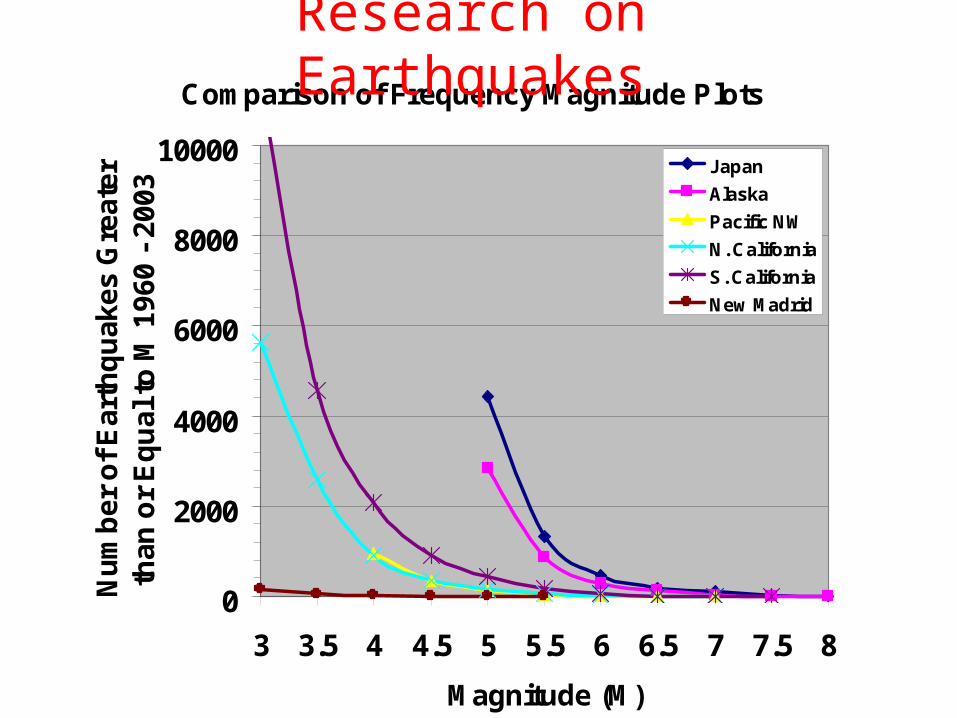
Comparison of Frequency Magnitude Plots
0
2000
4000
6000
8000
10000
3 3.5 4 4.5 5 5.5 6 6.5 7 7.5 8
Magnitude (M)
Nu
mb
er
of
Ea
rth
qu
ak
es
Gre
ate
r th
an
or
Eq
ua
l to
M 1
96
0 -
20
03
Japan
Alaska
Pacific NW
N. California
S. California
New Madrid
Research on Earthquakes

Comparison of Frequency Magnitude Plots
1
10
100
1000
10000
3 3.5 4 4.5 5 5.5 6 6.5 7 7.5 8
Magnitude (M)
Nu
mb
er
of
Ea
rth
qu
ak
es
Gre
ate
r th
an
or
Eq
ua
l to
M 1
96
0 -
20
03
Japan
Alaska
Pacific NW
N. California
S. California
New Madrid
Research on Earthquakes
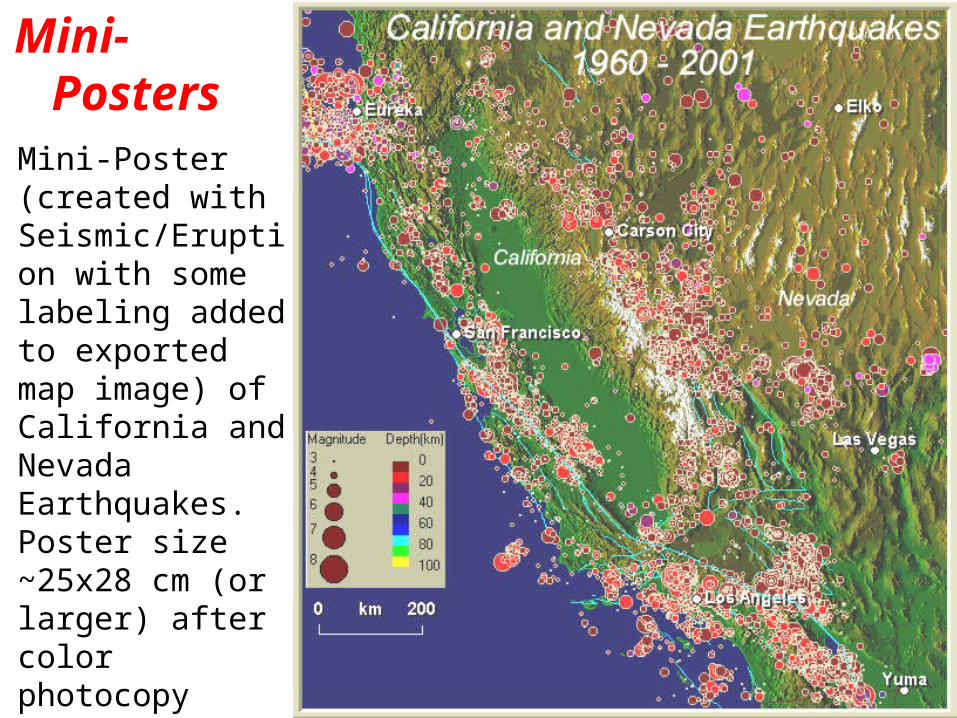
Mini-Poster (created with Seismic/Eruption with some labeling added to exported map image) of California and Nevada Earthquakes. Poster size ~25x28 cm (or larger) after color photocopy enlargement.
Mini- Posters
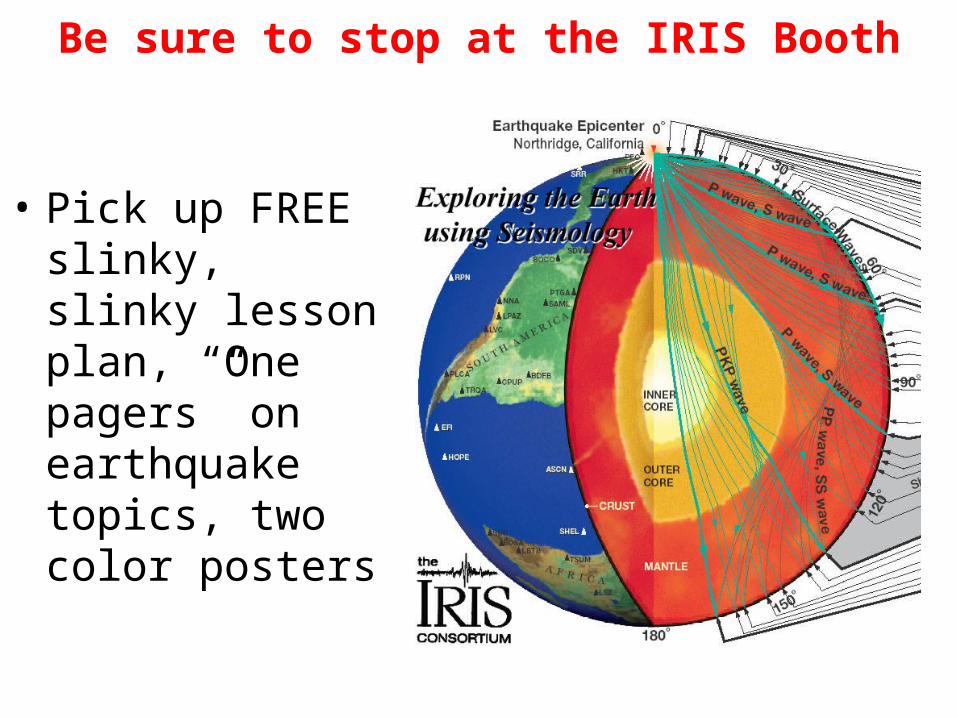
Be sure to stop at the IRIS Booth
• Pick up FREE slinky, slinky lesson plan, “One pagers” on earthquake topics, two color posters