seismic risk assessment of 3rd azerbaijan gas pipeline · seismic risk assessment of 3rd azerbaijan...
TRANSCRIPT

Seismic Risk Assessment of 3rd Azerbaijan Gas Pipeline
M. Hesari a, M. Mousavi a and A. Azarbakht a
a Department of Civil Engineering, Faculty of Engineering, Arak University, Arak 38156-8-8349, Iran.
SUMMARY:Seismic hazard analysis and risk assessment have been performed for the existing route of the 3rd Azerbaijannatural gas buried pipeline in Iran. The major seismic sources along the pipeline were identified and thegeometrical parameters as well as the seismicity rates were determined. The seismic hazard assessment of theground vibrations along the pipeline have been performed in the framework of the Probabilistic Seismic HazardAnalysis using the CRISIS 2007 software. All of components of gas pipeline along the route were identified andthe corresponding fragility functions were established through the methodology described in HAZUS guideline.The spatial analysis of hazard functions layer in combination with the fragility functions layer, in GIS format,provides an appropriate seismic risk model. The results reveal the amount of financial consequences of differentearthquake scenarios.
Keywords: Seismic risk assessment, Azerbaijan gas pipeline, Crisis, Hazus.
1. INTRODUCTION
Natural gas pipeline is one of the most important lifeline networks which supply the environmentallyfriendly hydrocarbon energy resource for industrial and domestic users. These buried or elevatedpipelines usually constitute a wide-area energy delivery network. The performance of such networksduring an earthquake has direct impact on economy and comfort of customers and any significantdisruption during energy providing process may cause a disaster.
Buried pipelines behaviour assessment is generally relied upon past earthquake data to predict futureperformance and reliability. The pipeline damage is typically expressed in terms of the numbers ofrepairs occurring per unit length of pipeline in the common available approaches for seismicvulnerability assessment. The available methods for seismic behaviour of pipelines are generally basedon observations about earthquake properties and pipeline response and damage. Some researchprojects have been done across the world to assess the seismic loss in gas pipelines e.g. L.E. Yamin etal. (2004) in Columbia. Their Geographic Information System (GIS) based study includesincorporation of seismic, landslide, volcanic and liquefaction hazards which identifies the total risk. H.Hwang et al. (2004) studied the loss induced by Chi Chi earthquake in Taiwan, 1999. They employedArias Intensity (AI) as a replacement for the Peak Ground Velocity (PGV) to estimate the pipelinesrepair rate. In addition, M. Alexoudi et al. used stochastic methods to simulate earthquake randominputs for loss estimation of gas pipelines in 2006.
Federal Emergency Management Agency (FEMA) developed a general methodology to assess hazard,vulnerability, direct and indirect loss against external elements consisting earthquake. The HAZUSMR4 is the latest version of this method and it is one of the validated methods for seismic hazardanalysis, risk assessment and producing loss estimation model. This methodology uses a very largedatabase of the past researches all over the world. A general method was developed by collecting the

databases, combining researches and verification of the results with empirical data. Therefore it can beused in any case when specific fragility curves are not available. HAZUS discusses lifelines inChapters 7 and 8 of the HAZUS MR4 technical manual and direct loss in Chapter 15.
According to HAZUS, the lifelines are divided into two major categories which are transportationsystems and utility systems. Natural gas network is one of the utility system subcomponents. A naturalgas network consists of compressor stations and the buried or elevated pipelines. Any of thesecomponents might be vulnerable under a severe earthquake. The corresponding losses can beclassified into two different categories including direct and indirect losses. In the HAZUS model, it isassumed that pipeline damages subjected to earthquakes are completely independent from the pipelinesize, class, and mechanical specifications. The only available classification for pipelines is eitherbrittle or ductile. Brittle pipelines are commonly old ones with gas welded joints and the ductile onesare steel pipelines with arc welded joints. Based on the post empirical studies by O’Rourke and Ayala(1993) on the pipelines in the four U.S. and two Mexican earthquakes, damage functions for pipelinesdue to ground shaking were established. Eqn. 1.1 expresses the relationship which represents areasonable fit for the mentioned empirical data.[ ⁄ ] ≅ 0.0001 ∗ ( ) . (1.1)
where PGV is the peak ground velocity which is expressed in cm/sec. Eqn. 1.1 is assumed to beapplied to brittle pipelines. Ductile pipelines experience 70% less damage than the brittle ones. Hencethe above relation for ductile pipelines should be multiplied by 0.3 to fit to the correspondingempirical data.
Based on HAZUS it is necessary to identify geographic location of the considered gas systemcomponents and the corresponding seismic sources. The best way to implement these geographicspecifications is to use Geographic Information System (GIS). GIS is a system with spatial anddigitized properties for every feature and can contain lots of attributes for the processing. Therefore itis an appropriate platform for performing these spatial analyzes to extract hazard and loss parameterswith accurate geographical properties.
Performance assessment of gas pipelines is an important issue in Iran as a consequence of highpotential seismic activity. This mentioned potential can be quantified based on the ProbabilisticSeismic Hazard Analysis (PSHA) which can calculate the expected ground motion intensity indifferent parts of the considered pipeline. PSHA is performed by using CRISIS 2007 software in thisstudy. The resulting seismic hazard curve can be incorporated with the seismic fragility functions ofthe given pipeline to produce the total loss. The seismic fragility functions can be calculated eitherbased on an analysis procedure or the available functions e.g. by using HAZUS guidelines. A commoncoordinate system is necessary to be chosen to represent the whole data i.e. location of pipeline,compressor stations, faults location and etc. For this purpose the WGS1984 coordinate system waschosen within ArcGIS 9.3 software and different information layers were added in this system.
2. THE 3RD AZERBAIJAN GAS PIPELINE
North West region of Iran, including east-Azerbaijan and west-Azerbaijan provinces, is located in coldclimate mountainous regions with high level of energy demand especially for natural gas. The 48 inch3rd Azerbaijan gas pipeline has been built in 2007 to provide increasing demands of natural gas for allindustrial and domestic users. This pipeline is started from Saveh city in Markazi province and reachesto Urmia in west Azerbaijan province with the approximately 600 kilometres length. It passes throughfour provinces and provides part of the energy consumption for these provinces. This pipeline wasdesigned, constructed and owned by the National Iranian Gas Company (NIGC). Four compressorstations were designed to provide the required gas pressure in which only two of them are functionaland the other ones are under construction.

3. HAZARD MODEL
The hazard model for the considered area is calculated by employing CRISIS 2007 software. Theinput data consist of three categories including (1) Source geometry, (2) Source seismicity and (3)Attenuation relationship. The source geometry was defined based on the available fault maps as shownin Figure 3.1 and Figure 3.2(Berberian 1994). Each fault is modelled by assuming it as a linear source.
The source seismicity data is based on the previous studies conducted by seismic researchers, aftermodelling all recorded seismic events by means of the historical and instrumental records (e.g.Tavakoli and Ghafory-Ashtiany 1999). Several seismically clustering models have been establishedfor Iran as indicated in Table (1). The seismicity parameters for the sources on each seismic provinceare assumed to be the same.
Figure 3.1. Source geometry menu of faults in CRISIS 2007 software.
Figure 3.2. Source geometry input data and the overall view of the pipeline under investigation.
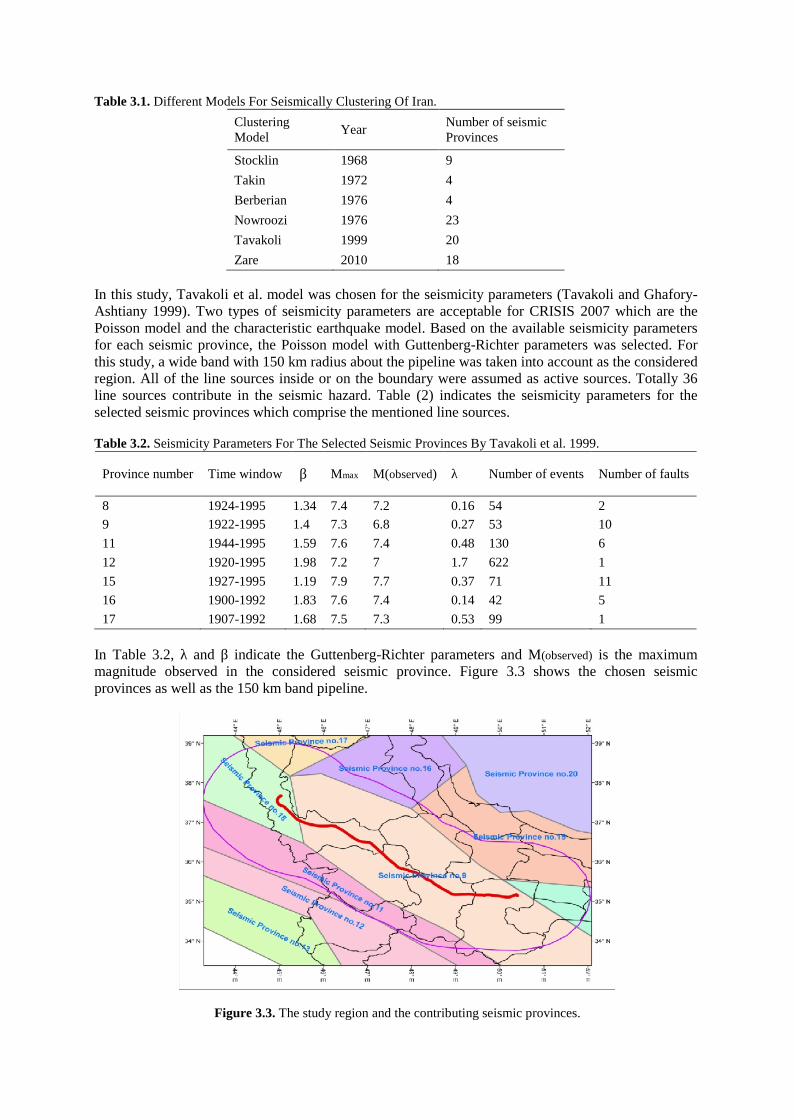
Table 3.1. Different Models For Seismically Clustering Of Iran.
ClusteringModel
YearNumber of seismicProvinces
Stocklin 1968 9
Takin 1972 4
Berberian 1976 4
Nowroozi 1976 23
Tavakoli 1999 20
Zare 2010 18
In this study, Tavakoli et al. model was chosen for the seismicity parameters (Tavakoli and Ghafory-Ashtiany 1999). Two types of seismicity parameters are acceptable for CRISIS 2007 which are thePoisson model and the characteristic earthquake model. Based on the available seismicity parametersfor each seismic province, the Poisson model with Guttenberg-Richter parameters was selected. Forthis study, a wide band with 150 km radius about the pipeline was taken into account as the consideredregion. All of the line sources inside or on the boundary were assumed as active sources. Totally 36line sources contribute in the seismic hazard. Table (2) indicates the seismicity parameters for theselected seismic provinces which comprise the mentioned line sources.
Table 3.2. Seismicity Parameters For The Selected Seismic Provinces By Tavakoli et al. 1999.
Province number Time window β Mmax M(observed) λ Number of events Number of faults
8 1924-1995 1.34 7.4 7.2 0.16 54 2
9 1922-1995 1.4 7.3 6.8 0.27 53 10
11 1944-1995 1.59 7.6 7.4 0.48 130 6
12 1920-1995 1.98 7.2 7 1.7 622 1
15 1927-1995 1.19 7.9 7.7 0.37 71 11
16 1900-1992 1.83 7.6 7.4 0.14 42 5
17 1907-1992 1.68 7.5 7.3 0.53 99 1
In Table 3.2, λ and β indicate the Guttenberg-Richter parameters and M(observed) is the maximummagnitude observed in the considered seismic province. Figure 3.3 shows the chosen seismicprovinces as well as the 150 km band pipeline.
Figure 3.3. The study region and the contributing seismic provinces.

As the third major input for CRISIS 2007, an appropriate attenuation model should be defined.CRISIS 2007 has the ability to use more than one attenuation relationship in one analysis. Despite itcan use logic tree for performing PSHA analysis, the user can specify more than one CRISIS inputdata files that are interpreted as branches of a logic tree. Each branch has a weight that must also begiven by the user. Four attenuation models with the weightings of Table 3.3 have been used in thisstudy.
Table 3.3. The Applied Attenuation Models And The Assigned Weights.Model name Assigned Weight
Zafarani et al. (2011) 0.3
Campbell, Bozorgnia (2008) 0.3
Ghasemi et al. (2009) 0.2
Sharma et al. (2009) 0.2
Zaferani’s model is resulted from a finite source stochastic approach to be used in the Zagros region,Iran (Zaferani et al 2011). Ghasemi’s model is developed based on Iranian recoded ground motions(Ghasemi et al 2009). Campbell and Bozorgnia have used a subset of the PEER NGA database andexcluded recordings and earthquakes that were believed to be inappropriate for estimating free-fieldground motions from shallow earthquake main shocks in active tectonic regimes (Campbell et al.2008). Finally, Sharma’s model has been driven to be applied for the Indian Himalaya (Sharma et al.2009). However, due to the lack of data from India, additional strong-motion data have been includedfrom the Zagros region of Iran which has comparable seismo-tectonics to the Himalaya. It is worthemphasising that the two first attenuation relationships in table 3.3 are able to predict peak groundvelocity (PGV) directly. However, two remained models are only able to predict the peak groundacceleration (PGA) and the spectral accelerations in different periods. As a solution, according toHAZUS manual, PGV is calculated based on Eqn. 3.1 for the last two models in Table 3.3,= . ∗ 1.65⁄ (3.1)
where Sa1 is the spectral acceleration at the one second period. It is obvious that prediction of PGVfrom spectral acceleration may be lead to higher degree of uncertainty comparing with directcalculating. Hence, lower weights are assigned to the two last models.
Now all of essential inputs are prepared to run the probabilistic seismic hazard analysis (PSHA).Figure 3.4 shows the expected spectral acceleration for T=1.0 sec corresponding to the 2475 yearsreturn period. Also, the expected PGV contour corresponding to the 2475 years return period can beseen in Figure 3.5.

Figure 3.4. The expected spectral acceleration for T=1.0 second corresponding to the 2475 years return period.
Figure 3.5. The expected PGV contour corresponding to the 2475 years return period.
4. LOSS ESTIMATION
4.1. Repair rate calculation
By exporting the hazard results from CRISIS 2007 to the ArcGIS software, a convenient tool is inhand to calculate the repair rates (numbers of repairs per kilometre) in different levels of hazard i.e.475 or 2475 years return periods. According to HAZUS guideline (section 8.3.6 and 8.4.6), twodamage states are considered which are leaks and breaks. Generally when a pipe is damaged due toground failure, the type of damage is likely to be a break while when a pipe is damaged due to seismicwave propagation, the type of damage is likely to be leak. In the loss methodology, it is assumed thatdamage due to seismic waves will consist of 80% leaks and 20% breaks, while damage due to groundfailure will consist of 20% leaks and 80% breaks.

Due to dry climate of central Iran region, only the damage resulted from seismic wave propagation isconsidered in this study. By applying Eqn. 1.1, the repair rates are calculated for the pipeline in twohazard levels i.e. 475 and 2475 years. Table 4.1 shows numbers of Leaks and Breaks in each 2 kmsegment, and summation of damages along the 618 km pipeline.
Based on the resulted repair rates in Table 4.1, the pipeline is classified to six vulnerable classes asdescribed in Table 4.2. Extensive, very high, moderate high, high, moderate and low are the definedclasses of vulnerability. Figure 3.5 shows the distribution of vulnerability along the pipeline.
Table 4.1. The Expected Repair Numbers, Leaks And Breaks in 475 And 2475 Years Return Periods.Return Period, 475 years Return Period, 2475 years
Length (m) PGV Repair no. Leaks Breaks PGV Repair no. Leaks Breaks
2000 18.45 0.042329 0.033864 0.008466 27.69 0.10553 0.084424 0.021106
2000 18.65 0.043369 0.034694 0.008674 28.05 0.108643 0.086914 0.021728
2000 18.52 0.042692 0.034154 0.008538 27.86 0.106994 0.085595 0.021399
2000 18.44 0.042278 0.033822 0.008456 27.74 0.10596 0.084768 0.021192
. . . . . . . . .
. . . . . . . . .
. . . . . . . . .
SUM: 618Km 4.063306 3.250671 0.812652 10.088101 8.070484 2.017629
Table 4.2. The Defined Vulnerability Classes.
Vulnerability level Repair Rate Range
Extensive 0.040 - 0.059
Very High 0.026 - 0.039
Moderate High 0.018 - 0.025
High 0.013 - 0.017
Moderate 0.009 - 0.012
Low 0.004 - 0.008
Figure 4.1. The distribution of vulnerability along the pipeline.
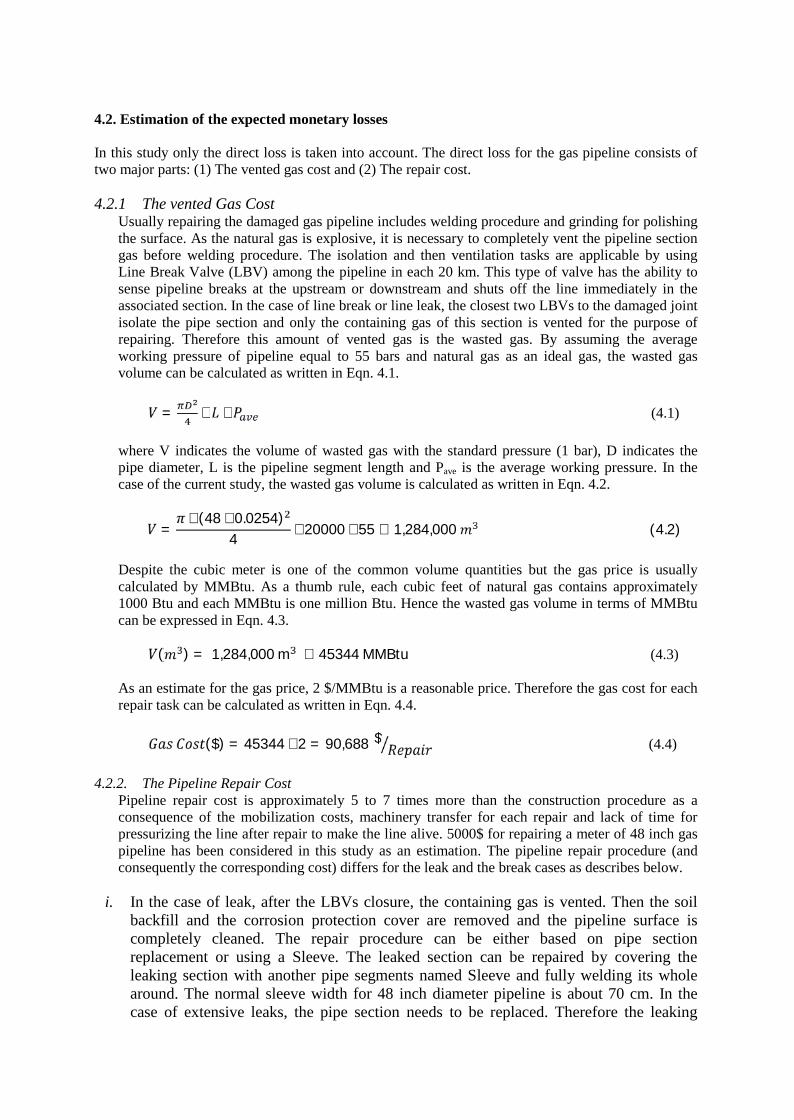
4.2. Estimation of the expected monetary losses
In this study only the direct loss is taken into account. The direct loss for the gas pipeline consists oftwo major parts: (1) The vented gas cost and (2) The repair cost.
4.2.1 The vented Gas CostUsually repairing the damaged gas pipeline includes welding procedure and grinding for polishingthe surface. As the natural gas is explosive, it is necessary to completely vent the pipeline sectiongas before welding procedure. The isolation and then ventilation tasks are applicable by usingLine Break Valve (LBV) among the pipeline in each 20 km. This type of valve has the ability tosense pipeline breaks at the upstream or downstream and shuts off the line immediately in theassociated section. In the case of line break or line leak, the closest two LBVs to the damaged jointisolate the pipe section and only the containing gas of this section is vented for the purpose ofrepairing. Therefore this amount of vented gas is the wasted gas. By assuming the averageworking pressure of pipeline equal to 55 bars and natural gas as an ideal gas, the wasted gasvolume can be calculated as written in Eqn. 4.1.= ∗ ∗ (4.1)
where V indicates the volume of wasted gas with the standard pressure (1 bar), D indicates thepipe diameter, L is the pipeline segment length and Pave is the average working pressure. In thecase of the current study, the wasted gas volume is calculated as written in Eqn. 4.2.
= ∗ (48 ∗ 0.0254)4 ∗ 20000 ∗ 55 ≅ 1,284,000 (4.2)Despite the cubic meter is one of the common volume quantities but the gas price is usuallycalculated by MMBtu. As a thumb rule, each cubic feet of natural gas contains approximately1000 Btu and each MMBtu is one million Btu. Hence the wasted gas volume in terms of MMBtucan be expressed in Eqn. 4.3.( ) = 1,284,000 m ≅ 45344 MMBtu (4.3)
As an estimate for the gas price, 2 $/MMBtu is a reasonable price. Therefore the gas cost for eachrepair task can be calculated as written in Eqn. 4.4.($) = 45344 ∗ 2 = 90,688 $ (4.4)
4.2.2. The Pipeline Repair CostPipeline repair cost is approximately 5 to 7 times more than the construction procedure as aconsequence of the mobilization costs, machinery transfer for each repair and lack of time forpressurizing the line after repair to make the line alive. 5000$ for repairing a meter of 48 inch gaspipeline has been considered in this study as an estimation. The pipeline repair procedure (andconsequently the corresponding cost) differs for the leak and the break cases as describes below.
i. In the case of leak, after the LBVs closure, the containing gas is vented. Then the soilbackfill and the corrosion protection cover are removed and the pipeline surface iscompletely cleaned. The repair procedure can be either based on pipe sectionreplacement or using a Sleeve. The leaked section can be repaired by covering theleaking section with another pipe segments named Sleeve and fully welding its wholearound. The normal sleeve width for 48 inch diameter pipeline is about 70 cm. In thecase of extensive leaks, the pipe section needs to be replaced. Therefore the leaking

section is cut off and being replaced by another pipe with the same specifications. Thetotal numbers of leaks are eight as shown in Table 4.1. Therefore the repair cost for leakcan be written as Eqn. 4.5.= ( . ≈ 8) ∗ (70 ) ∗ (5000 $⁄ ) = 28,000 $( ) = .∗ + ≅ 753,500 $ (4.5)
ii. In the case of break, pipeline acts as a pressure vessel and immediately explodesbecause of its own internal pressure. The explosion implies an extremely high stress tothe pipe body on extended area. The explosion force can highly affect the pipeline, forexample, it may cause local buckling or bend the pipe in a large deformation way. Insome cases neighbour welded joints were extremely affected and needed to be repaired.For the break damage state usually one or more pipes are necessary to be replaced. It isassumed in this study that only one complete pipe with 12 meters length should bereplaced for each break. As shown in Table 4.1, the total numbers of breaks alongpipeline are two breaks. Therefore the repair cost can be calculated as written in Eqn.4.6.
= ( . ≅ 2) ∗ 12 ∗ (5000 $⁄ ) = 120,000 $( ) = .∗ + ≅ 301,000 $ (4.6)According to the above calculations, the total repair cost for 2475 years return period of the 3rd
Azerbaijan gas pipeline can be summed as expressed in Eqn. 4.7. The total loss estimate for 2475years return period, as seen in Eqn. 4.7, is more than one million U.S. dollars and this amount can beused for insurance managements, repair strategies, improvement of pipeline development and designprograms.
= ( ) + ( )= 753,500 + 301,000 = 1,054,500 $ (4.7)
5. CONCLUSIONS
The seismic hazard analysis and risk assessment are two main prerequisites of loss estimation model. Here themain aim is to estimate the corresponding losses during and after a probable future earthquake around the 3rd
Azerbaijan gas pipeline in Iran. All of analyzes were performed with spatial coordinates and on the GIS basis.The hazard assessment of earthquake wave propagation along the pipeline has been performed in theProbabilistic Seismic Hazard Analysis framework by using CRISIS 2007 software. The ArcGIS 9.3 software isalso employed to combine different data layers. All of pipeline components and parts were identified inWGS1984 coordinate system. After studying different seismic hazard assessments, HAZUS methodology wasselected as the main framework for loss estimation. According to the HAZUS methodology, fragility curves andrepair rates were calculated for the considered pipeline. The results show that the financial loss, corresponding toa 2475 return period earthquake, can exceed a million dollar which reveal the necessity for an appropriateemergency management program.
ACKNOWLEDGEMENT
The research conducted by the authors has been funded by the National Iranian Gas Transmission Company(NIGTC) under Grant Number 51097-110. This support is gratefully acknowledged. Any opinions, findings andconclusions or recommendations expressed in this material are those of the authors and do not necessarily reflect

those of the funding body.
REFERENCES
M. Alexoudi. Th. Hatzigogos. K. Pitilakis.(2006). EARTHQUAKE RELIABILITY OF GAS SYSTEM UNDERSTOCHASTIC LOADS(Greece). Proceeding of the 3rd International ASRANet Colloquium Glasgow.
M. Berberian (1976). Contribution to the Seismotectonic of Iran(Part II). Geological and Mining Survey of Iran.39, 570.
M. Berberian (1994). Natural hazards and the first earthquake catalogue of iran. International Institute ofEarthquake Engineering and Seismology(IIEES) 1. 620.
K.W. Campbell. and Y. Bozorgnia(2008). NGA Ground Motion Model for the Geometric Mean HorizontalComponents of PGA, PGV, PGD and 5% Damped Linear Elastic Response Spectra for Periods Rangingfrom 0.01 to 10 s. Earthquake Spectra 24, 139-171.
M. Sharma (2009). Ground-motion prediction equations based on data from the Himalayan and Zagros regions.Journal of Earthquake Engineering 13:8, 1191-1210.
H. Ghasemi. M. Zare. Y. Fukushima. K. Koketsu. (2009). An empirical spectral ground-motion model for Iran.J. Seism. .doi 10.1007/s10950-008-9143-x.
HAZUS MH MR4 Technical Manual.(2007). Department of Homeland SecurityEmergency. Preparedness andResponse Directorate. FEMA.
Nowroozi (1976). Seismotectonic provinces of Iran. Bulletin Seismology Society America 66. 1249-1276.M. J. O’Rourke. G. Ayala. (1993). Pipeline damage due to wave propagation. Journal of Geotechnical
Engineering. ASCE 119:9. 1490-1498.J. Stocklin (1968). Structural history and tectonics of Iran, a review. AAPG Bulletin 52:7. 1229-1258.M. Takin (1972). Iranian geology and continental drift in the middle east. Nature 235. 147-150.B. Tavakoli. M. Ghafory-Ashtiany.(1999). Seismic hazard assessment of Iran. Annals of GEOPHYSICS.D. Wijewickreme. D. Honegger. A. Mitchell. T. Fitzell.(2005). Seismic Vulnerability Assessment and Retrofit of
a Major Natural Gas Pipeline System: A Case History. Earthquake Spectra 21. 539-567.L. E. YAMIN. S. ARÁMBULA. J. C. REYES, S. BELAGE, Á. VEGA, W. GIL.(2004). EARTHQUAKE LOSS
ESTIMATION FOR A GAS LIFELINE TRANSPORTATION SYSTEM IN COLOMBIA. 13WCEE.M. Zaré (2010). A Reevaluation of Seismic Hazard Zoning Maps for Iran. 14WCEE.H. Zafarani (2011). Simulation of strong ground motion in the Zagros region, Iran using the specific barrier
model and stochastic method. Geophysical journal international 188:2