seismic-resistant connections of edge columns with...
TRANSCRIPT

314 ACI Structural Journal/March-April 2005
ACI Structural Journal, V. 102, No. 2, March-April 2005.MS No. 04-122 received May 12, 2004, and reviewed under Institute publication poli-
cies. Copyright © 2005, American Concrete Institute. All rights reserved, including themaking of copies unless permission is obtained from the copyright proprietors. Pertinentdiscussion including author’s closure, if any, will be published in the January-February2006 ACI Structural Journal if the discussion is received by September 1, 2005.
ACI STRUCTURAL JOURNAL TECHNICAL PAPER
This paper reviews the procedure developed by Megally and Ghalifor the seismic design of nonprestressed concrete slab-columnconnections and investigates the validity of the same procedurefor prestressed slabs. A series of full-size specimens was tested,representing the connection of a prestressed slab, with post-tensionedunbonded strands, with an edge column. The amounts of theprestressed and the nonprestressed reinforcements were varied,while the flexural strengths were unchanged. The columns weresubjected to an axial load of constant magnitude and unbalancedmoment reversals, representing the effect of an earthquake, of increasingamplitude up to failure. The specimens were provided with the sameamount and arrangement of stud shear reinforcement (SSR).
It is concluded that the reviewed design procedure, intended fornonprestressed slabs, applies also to prestressed slabs having anaverage prestress of 0.4 to 1.1 MPa. The shear reinforcement,when necessary, can be designed according to ACI 421.1R-99.
Keywords: seismic; shear; slabs; studs.
INTRODUCTIONThe research on the seismic behaviour of prestressed slab-
column connections has been limited.1,2 The present papersummarizes the results of an experimental programconducted on connections of prestressed slabs with edgecolumns and proposes design recommendations.
ACI 318-023 requires that the factored nominal shearstrength φvn exceed the maximum factored shear stress vu atthe inner critical section at d/2 from the column face and atthe outer critical section at d/2 from the outer edge of theshear-reinforced zone. At the inner critical section, vn = vc +vs ≤ (1/2)√fc′ in MPa (6√fc′ in psi); at the outer criticalsection, vn = vc = (1/6)√fc′ in MPa (2√fc′ in psi); where vc andvs are the nominal shear strengths provided by the concreteand shear reinforcement, respectively. Without shearreinforcement, the nominal shear strength vn = vc = (1/3)√fc′in MPa (4√fc′ in psi) at d/2 from the column face. Smallervalues are permitted at columns having a relatively largeratio of long side to short side of column and large bo/dwhere bo is the perimeter of the critical section and d is theeffective depth of the section.
For seismic design, ACI 318-023 permits slabs withoutshear reinforcement when Vu ≤ 0.4φVc, where Vc = vcbod,with vc = (1/3)√fc′ ; Vu is the factored shear force caused bygravity load. For prestressed slabs, satisfying certain conditions,the code gives Vc = (βp + 0.3fpc)bod + Vp, where βp isthe smaller of 0.29 or (αsd/bo + 0.125); αs = 2.5 for exteriorcolumns; fpc is the average effective compressive stress inconcrete, in two directions, at centroid of section; and Vp isthe vertical component of prestressing forces crossing thecritical section.
fc′
In the shear reinforced zone, the shear strengths providedby the shear reinforcement and by the concrete are given(according to ACI 318-023 and ACI 421.1R-994) by
(1)
where Av is the area of shear reinforcement within its spacings, fyv is the specified yield strength of shear reinforcement,and vc = (1/6)√fc′ in MPa (2√fc′ in psi). When stud shearreinforcements (SSR) are used, ACI 421.1R-994 recommendsvc = (1/4)√fc′ in MPa (3√fc′ in psi) and vn = vc + vs ≤ (2/3)√fc′in MPa (8√fc′ in psi); but for seismic design, the values ofvc are to be reduced by 50% to account for the loss ofstrength provided by concrete caused by unbalancedmoment reversals.
Megally and Ghali5 gave recommendations (forconsideration by ACI Committee 421) for the seismicdesign of slab-column connections in structures having shearwalls, or other bracing systems, that limit the interstory driftratio, DRu to 0.025 (permitted by IBC6); DRu is the maximuminterstory drift, including inelastic deformation, divided by thestory height. The recommendations gave a design procedureto calculate the unbalanced moment Mu, and adopted theequations of ACI 421.1R-994 for design of shear reinforcementand suggested an increase of the upper limit of vn at d/2 fromthe column by 25% when the shear stress caused by Vu alonedid not exceed (1/3)√fc′ in MPa (that is, when the shear stresswas caused mainly by Mu rather than by Vu). Based on theexperiments presented as follows, the recommendations ofMegally and Ghali,5 intended for nonprestressed slabs, will beconsidered for the seismic design of the connections ofprestressed slabs with edge columns. The steps of design aregiven in Appendix A.
RESEARCH SIGNIFICANCEThis research develops a design procedure for seismic
resistant slab-column connections. The code provisions ofACI 318-023 and recommendations of ACI 421.1R-994 aresupplemented to produce an integral guide for the seismicdesign of edge slab-column connections in prestressed slabs.
EXPERIMENTAL PROGRAMFive full-scale post-tensioned slab-column connections
were tested. The plan and cross-sectional properties of the test
vsAv fyv
bos------------=
Title no. 102-S32
Seismic-Resistant Connections of Edge Columns with Prestressed Slabsby Mark Ritchie and Amin Ghali

315ACI Structural Journal/March-April 2005
specimens are shown in Fig. 1. The specimens represented theedge column connections in a 150 mm-thick slab having 6 x 6m2 square panels. Of the five specimens, four were prestressededge slab-column connections and the fifth specimen containedno prestressing and was considered the control slab. The proto-type slab had a gravity service live load of 2.4 kPa, superimposeddead load of 1.3 kPa, and self-weight of 3.6 kPa. The prototypewas designed such that nine 13 mm (cross sectional area =99 mm2; effective prestressing force = 110 kN (25,000 lb))post-tensioned tendons balanced approximately 85% of theservice dead load in interior spans and 65% of the servicedead load in exterior spans. The tendons were banded in thex-direction and uniformly distributed in the y-direction. Inthe test specimens, the number of tendons was variedbetween nine and zero while maintaining approximately thesame flexural strength in the x-direction. Stud shear rein-forcement was positioned on lines perpendicular to three
faces of the column. The greatest and the smallest prestressconsidered in this research were produced by nine and threetendons per panel of 6.0 m width of the prototype slab. Theeffective prestress produced by nine or by three tendonsaveraged 1.1 or 0.4 MPa, respectively, over a cross-sectionalarea equal to 6.0 x 0.15 m2.
The specimens were placed in the test frame shown in Fig. 2.The specimens were held in a vertical position on a steelsupport. Three edges of the slab were simply supported byneoprene pads; the fourth edge was free (Fig. 1). A 1000 kN-capacity horizontal actuator (A) applied the shear forcewhile the two 250 kN vertical actuators (B and C) producedthe unbalanced moment. The column was sufficientlyreinforced to prevent its failure.
Prestressing reinforcementThe number of tendons in the specimens varied (Table 1);
nonprestressed reinforcement* was provided to maintain thesame negative flexural strengths. The name of each specimenindicates the number of prestressed cables in the x-direction(running perpendicular to the free edge); for example, EC9Cindicates edge column with nine prestressed strands. Thereinforcement layout in Specimen EC9C is shown in Fig. 3(a)and 4. Specimen EC0C contained no prestressing reinforcementand was considered the control slab; it was provided with top
Mark Ritchie is a MSc student in the Department of Civil Engineering at the Universityof Calgary, Alberta, Canada. He received his BSc from the University of Calgary in2001. His research interests include prestressed and seismic design of reinforcedconcrete structures.
ACI member Amin Ghali is an emeritus professor of civil engineering at the Universityof Calgary. He is a member of ACI Committees 373, Circular Concrete StructuresPrestressed with Circumferential Tendons; and 435, Deflection of Concrete BuildingStructures; and Joint ACI-ASCE Committees 343, Concrete Bridge Design; and 421,Design of Reinforced Concrete Slabs. His research interests include analysis anddesign of concrete structures.
Fig. 1—Dimensions of test specimens and positive sign convention.
Table 1—Number of prestressing tendons and punching shear strength of test specimens compared with source equations
(1) (2) (3) (4) (5) (6) (7) (8) (9)
Testspecimen
Number of prestressed tendons
fc′ , MPa*
Shear stress at Point A (Fig. 12); (Vu)max
and negative (Mu)max
y-direction x-directionACI
318-023ACI
421.1R-994Megally
and Ghali5
EC0C 0 0 27.6 0.50 0.67 0.82 0.87 0.27
EC3C 1 3 25.8 0.50 0.67 0.83 0.93 0.29
EC5C 2 5 25.6 0.50 0.67 0.83 0.99 0.30
EC7C 2 7 29.4 0.50 0.67 0.80 0.99 0.29
EC9C 2 9 28.2 0.50 0.67 0.81 0.88 0.27*MPa = 145 psi.
vn
fc′---------
vu( )max
fc′----------------
vu( )A
fc′------------
*The nonprestressed bars used in the slabs are 10M and 15M; cross-sectional areas 100and 200 mm2, respectively; fy = 466 and 483 MPa (67.5 and 70.0 ksi), respectively.

316 ACI Structural Journal/March-April 2005
15M bars in two directions (Fig. 5). One prestressing strand,running in the x direction, replaced approximately 1.8 15Mbars. Figure 3(b), (c), and (d) depict the tendons and the topnonprestressed steel in Specimens EC7C, EC5C, and EC3C,respectively.
As mentioned previously, the test specimens wererepresenting edge column-slab connection in a prototypeslab having 6.0 m panels in x- and y-directions. The testspecimen’s plan dimensions were 1.35 and 1.90 m in thex- and y-directions, respectively. The banded tendons,running in the x-direction, produced in the specimens, aswell as in the vicinity of edge columns in the prototype slab,greater prestress than the average. The prestress in the prototypeslab would approach the average values, 1.1 to 0.4 MPa only atsections far from the free edge. In the y-direction, the prototypeslab had distributed tendons. To represent nine tendons per 6.0 mpanel, the corresponding test specimen, EC9C, should have9(1.35/6.0) = 2.03 tendons. The number of tendons providedin the y-direction was two in each of EC9C, EC7C, and
EC5C, and one in EC3C. With these numbers and thelocations of the tendons shown in Fig. 3, the prestress inthe y-direction was not equal to the average valuesmentioned previously.
Shear reinforcementThe specimens were provided with more shear reinforcement
than the minimum required to resist gravity loads applied tothe prototype structure. Each shear stud rail consisted of eightstuds (9.5 mm diameter; fyv = 462 MPa [67.0 ksi]) equallyspaced at 55 mm; the distance between the column faces andthe first line of peripheral studs was 35 mm. The overall heightof the stud rails was 115 mm and the diameter of the anchorheads was 30 mm. The rail was 5 mm thick and 25 mm wide.The location of the stud rails of Specimen EC9C is shown inFig. 6; this is typical for all five specimens.
Flexural reinforcementThe specimens were provided with sufficient flexural
reinforcement to ensure that punching failure wouldoccur prior to flexural failure. The top nonprestressedflexural reinforcement, perpendicular and parallel to thefree edge, consisted of 15M bars. All prestressed specimenshad approximately the same flexural capacity as thenonprestressed specimen, EC0C (Fig. 5). The flexuralcapacity was assessed using the yield-line theory; refer toFig. 7 and Column 5 of Table 2. In applying the yield linetheory, appropriate flexural strength values are assignedto the nonprestressed reinforcement and the prestressedtendons. All test specimens had the same uniform bottomflexural reinforcement in two orthogonal directions (Fig. 6).
For both the top and bottom reinforcements, the cover was20 mm. This resulted in effective depths of 122 and 106 mmfor the two steel directions. All top and bottom flexuralreinforcements running in the x-direction were bent at180 degrees to provide anchorage near the edges of the slab(Fig. 4(a)). All reinforcement running in the y-direction hadadequate development length without the need of bends.
Splitting reinforcementTwo studs were provided at each anchorage of the
prestressing tendons to control horizontal splitting cracksthat can occur through the slab thickness. An example of thelocation of the splitting reinforcement is shown in Fig. 6 forFig. 2—Test frame.
Fig. 3—Prestressed cables and top nonprestressed reinforcement: (a) Specimen EC9C; (b) Specimen EC7C; (c) SpecimenEC5C; and (d) Specimen EC3C.

ACI Structural Journal/March-April 2005 317
Specimen EC9C. The same type of stud as the SSR was used.At anchorages located at the free edge, no studs wereprovided, specifically to reinforce against splitting, in addition tothe studs used as shear reinforcement.
Loading Stage 1This testing stage replicated the application of gravity
loads prior to an earthquake occurrence. The shearing forceVu and the unbalanced moment MO were applied simulta-neously in load control mode such that (MO /Vu) = 0.3 m,where MO is the bending moment at the centroid of thecolumn. The eccentricity MO /Vu was determined by frameanalysis of the prototype structure. The combinations ofVu and MO were applied in five equal increments to reach
Vu = 110 kN (25,000 lb) and Mu = 33 kNm (290 kip-in.). Theforce Vu = 110 kN was sustained during Loading Stage 2.
Loading Stage 2Loading Stage 2 simulated the seismic action on the proto-
type structure when subjected to an earthquake. While theforce (Vu)max = 110 kN was sustained, the two column endswere displaced a distance of ∆/2 in opposite directions (Fig. 1).The amplitude of the displacements ∆ was increased inincrements of 1 mm. For each increment, three reversalcycles were performed. After reaching the maximumunbalanced moment (MO)max, only one cycle was performedfor each displacement increment. The increments of theimposed cyclic displacements continued until 20% of the
Fig. 4—Typical cross section: (a) perpendicular to free edge; and (b) parallel to free edge.
Fig. 5—Top nonprestressed reinforcement, Specimen EC0C.
Fig. 6—Shear and bottom nonprestressed reinforcement,typical for all specimens. Location and number of splittingreinforcement shown apply only to Specimen EC9C.

318 ACI Structural Journal/March-April 2005
unbalanced moment capacity was lost (Fig. 8). The positivedirections of Vu, MO, deflection ∆, and DR are indicated inFig. 1.
TEST RESULTSIt should be mentioned that Specimen EC7C failed
prematurely before completing Loading Stage 2, due to
malfunctioning of the loading equipment (very high Vu wasinadvertently introduced). Consequently, for this specimen,the values of the drift ratio after reaching (MO)max werenot recorded.
Ultimate loads and mode of failureAll slabs failed by punching shear inside the shear-
reinforced zone. Strain measurements on selected shearreinforcing studs indicated that the yielding of studsoccurred in each of the five tested specimens. The recordedyield was on studs located within the first three peripheralrows of studs adjacent to the faces of the columns. Beforefailure, cracks widened considerably; large deflections (40to 44 mm at ultimate) were recorded around the column slabconnection. The maximum positive and negative values of theunbalanced moment (MO)max are listed in Table 2. The values of(Vu)max /Vc vary between 0.54 and 0.58, where Vc = bod /3,with fc′ in MPa. The value of Vc is the nominal shear strengthof the connection in the absence of unbalanced moment andshear reinforcement (ACI 318-023). The values of Vu at O,the center of the column, combined with MO are staticallyequivalent to Vu at the centroid of the critical sectioncombined with Mu = MO + VuxO; where xO = –0.086 m, thex-coordinate of O (Fig. 9). For each specimen, two values of(Mu)max are given in Table 2, corresponding to the positiveand the negative (MO)max. Splitting of the slab through thethickness did not occur at any of the anchors of the tendons.
Hysteresis loopsThe large drift ratios recorded in tests (Column 6 to 8,
Table 2) indicate the ability of the tested slab-columnconnections to undergo plastic displacement withoutpunching failure. An example of the hysteresis loops of DRversus MO is shown in Fig. 10 for specimen EC0C. Envelopesof the loops for all specimens are shown in Fig. 11. Columns6 to 8 of Table 2 list the values of DRy, DRu, and DRu80(defined in Fig. 8).
DISCUSSION OF TEST RESULTSFlexural strength
As expected, the values of (MO)max recorded in the testswere smaller than the calculated (MO)yield line, where(MO)yield line is the unbalanced moment that can produce
fc′
Table 2—Test values of unbalanced moments, drift ratios, and shear stresses*(1) (2) (3) (4) (5) (6) (7) (8) (9) (10) (11) (12) (13)
Testspecimen fc′ , MPa†
(MO)max,
kNm‡(Mu)max,
kNm(MO)yield line,
kNm DRy DRu DRu80 µ∆
Maximum shear stress at d/2 from column
(vu)max /√fc′
Positive Mo Negative Mo
Side BC Point A Side BC Point A
EC0C 27.6 71.2–46.8
61.7–56.3 159 0.91 2.80 6.10 3.08 0.53 0.56 0.12 0.87
EC3C 25.8 75.0–49.0
65.5–58.5 172 0.82 2.80 6.10 3.41 0.57 0.62 0.14 0.93
EC5C 25.6 74.9–53.8
65.4–63.3 170 0.85 3.40 5.70 4.00 0.57 0.63 0.16 0.99
EC7C§ 29.4 78.3–58.9
68.8–68.4 161 0.85 2.80 — 3.29 0.55 0.62 0.18 0.99
EC9C 28.2 68.7–49.7
59.2–59.2 147 0.75 3.60 5.90 4.80 0.50 0.51 0.13 0.88
*Edge slab-column connection subjected to (Vu)max = 110 kN combined with cyclic moment transfer.†1 MPa = 145 psi.‡1 kNm = 8.851 kip-in.§Value of (MO)max and drift ratios for this specimen are smaller than what would have been reached without malfunction of loading equipment.
Fig. 8—Definition of DRy, DRu , and DRu80.
Fig. 7—Yield line pattern used to calculate values of(MO)yield line that would produce flexural failure.
ACI Structural Journal/March-April 2005 319
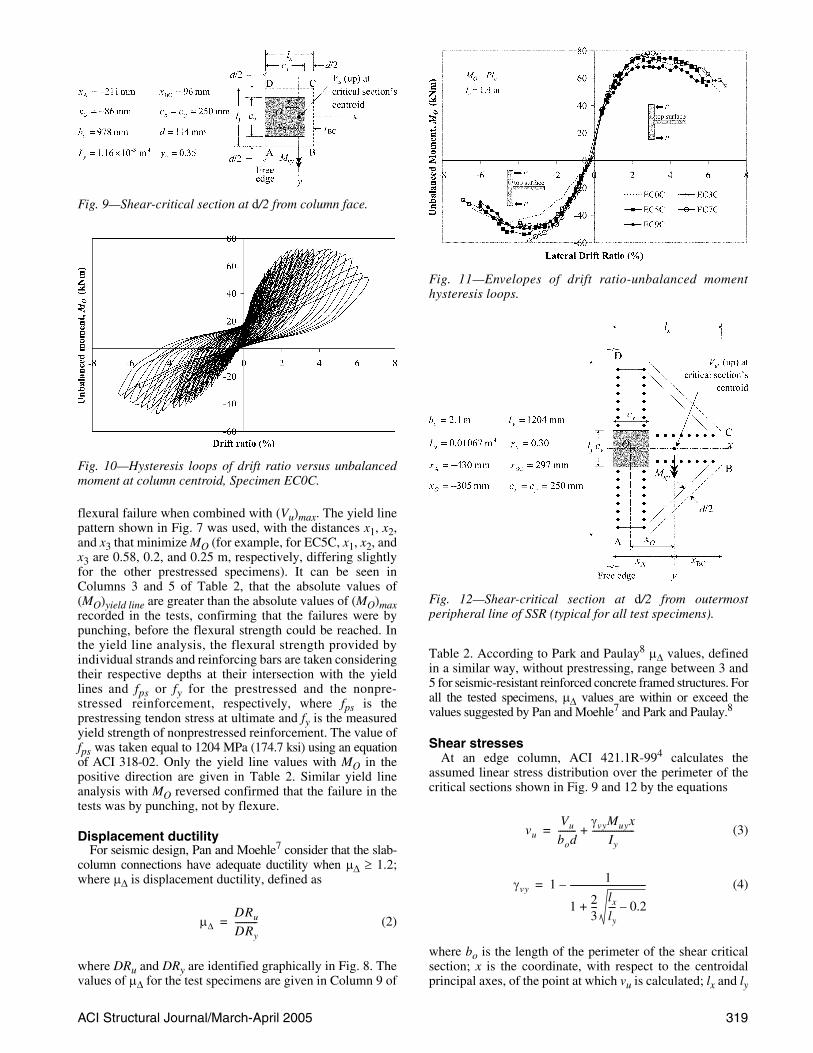
flexural failure when combined with (Vu)max. The yield linepattern shown in Fig. 7 was used, with the distances x1, x2,and x3 that minimize MO (for example, for EC5C, x1, x2, andx3 are 0.58, 0.2, and 0.25 m, respectively, differing slightlyfor the other prestressed specimens). It can be seen inColumns 3 and 5 of Table 2, that the absolute values of(MO)yield line are greater than the absolute values of (MO)maxrecorded in the tests, confirming that the failures were bypunching, before the flexural strength could be reached. Inthe yield line analysis, the flexural strength provided byindividual strands and reinforcing bars are taken consideringtheir respective depths at their intersection with the yieldlines and fps or fy for the prestressed and the nonpre-stressed reinforcement, respectively, where fps is theprestressing tendon stress at ultimate and fy is the measuredyield strength of nonprestressed reinforcement. The value offps was taken equal to 1204 MPa (174.7 ksi) using an equationof ACI 318-02. Only the yield line values with MO in thepositive direction are given in Table 2. Similar yield lineanalysis with MO reversed confirmed that the failure in thetests was by punching, not by flexure.
Displacement ductilityFor seismic design, Pan and Moehle7 consider that the slab-
column connections have adequate ductility when µ∆ ≥ 1.2;where µ∆ is displacement ductility, defined as
(2)
where DRu and DRy are identified graphically in Fig. 8. Thevalues of µ∆ for the test specimens are given in Column 9 of
µ∆
DRu
DRy
----------=
Table 2. According to Park and Paulay8 µ∆ values, definedin a similar way, without prestressing, range between 3 and5 for seismic-resistant reinforced concrete framed structures. Forall the tested specimens, µ∆ values are within or exceed thevalues suggested by Pan and Moehle7 and Park and Paulay.8
Shear stressesAt an edge column, ACI 421.1R-994 calculates the
assumed linear stress distribution over the perimeter of thecritical sections shown in Fig. 9 and 12 by the equations
(3)
(4)
where bo is the length of the perimeter of the shear criticalsection; x is the coordinate, with respect to the centroidalprincipal axes, of the point at which vu is calculated; lx and ly
vuVu
bod--------
γvyMuyx
Iy
-------------------+=
γvy 1 1
1 23---
lx
ly
--- 0.2–+
----------------------------------–=
Fig. 9—Shear-critical section at d/2 from column face.
Fig. 10—Hysteresis loops of drift ratio versus unbalancedmoment at column centroid, Specimen EC0C.
Fig. 11—Envelopes of drift ratio-unbalanced momenthysteresis loops.
Fig. 12—Shear-critical section at d/2 from outermostperipheral line of SSR (typical for all test specimens).

320 ACI Structural Journal/March-April 2005
are the projection of critical section on the centroidal principal xand y axes; and Iy is the second moment of area about the yaxis. Figure 9 and 12 show the positive directions of x and yaxes, Vu and Muy when (lx/ly) < 0, γvy = 0.
It should be mentioned that ACI 318-023 uses a parameterJ instead of I in Eq. (3) and gives equations for J and γvy thatare applicable for a critical section in the shape of aclosed rectangle. For a critical section of general shape,ACI 421.1R-994 replaces J by I, as in Eq. (3) and givesEq. (4) for γvy for edge columns.
Shear strength at critical section at d /2 from column face
With unbalanced moment reversals, the maximum shearstress (vu)max occurs at Side BC or at Points A and D of thecritical section (Fig. 9). Table 2 gives values of (vu)max/√fc′at Side BC and at Point A (or D). The values of (vu)max arecalculated by Eq. (3) with the test values (Vu)max and(MO)max. It can be seen that the greatest shear stress occursat the outer edge, Point A (or D) due to (Vu)max combinedwith negative (MO)max (Table 2, Column 13).
For seismic design of shear reinforcement, ACI 318-02,3
ACI 421.1R-99,4 and Megally and Ghali5 express thenominal shear strength vn at the critical section d/2 from thecolumn face as (in MPa)
ACI 318-023: (5)
where
vc = (1/6)√fc′ (6)
ACI 421.1R-994: (7)
where
vc = (1/8)√fc′ (8)
Megally and Ghali5: (9)
where
vc = (1/8)√fc′ (10)
The equation for vs, the nominal shear stress provided byshear reinforcement, is common for all three sources and isgiven by Eq. (1). In all the equations containing √fc′ when thestress is in psi, replace √fc′ by 12√fc′ .
Note that ACI 318-023 does not give special equations forthe seismic design of stud shear reinforcement in slabs. Onthe other hand, the equations given by ACI 421.1R-994 andby Megally and Ghali5 provide provisions for the seismicdesign of stud shear reinforcement; they recommend a relativelylow value of vc to account for the reduction in shear strengthof cracked concrete caused by cyclic loading. Regardless ofthe amount of shear reinforcement, each of the above threesources sets an upper limit for vn; the highest upper limit is(5/6)√fc′ in MPa (10√fc′ in psi). It can be seen from Table 2,Column 13 that the upper limit (5/6)√fc′ is exceeded in allspecimens at Point A of the critical section at d/2 from thecolumn face.
The nominal shear strength provided by SSR in eachspecimen is calculated by Eq. (1), with Av = 426 mm2, s = 55mm, fyv = 462 MPa, and bo = 978 mm
= 3.66 MPa
The nominal shear strength predicted by Eq. (5), (7), and(9) is the lesser of (vc + vs) and the upper limit specified foreach equation; the result of this calculation is presented foreach specimen in Table 1 in terms of its value of √fc′(Columns 5 to 7). These values can be compared with themaximum shear stress (vu)max determined from the tests(Column 8 of Table 1, or Column 13 of Table 2). Thecomparison indicates that each of Eq. (5), (7), and (9) givesa conservative prediction of vn.
Figure 13 and 14 show hysteresis loops plotted duringloading stage 2 for specimens EC0C and EC9C, respectively.The abscissas in the figures represent the drift ratio; theordinates represent the shear stress vu/√fc′, and the value ofvu is for Point A of the critical section at d/2 from the columnface (Fig. 9), calculated using Eq. (3) with Vu = 110 kNcombined with Mu varying as recorded during the loading
vn vs vc12--- fc′≤+=
vn vs vc23--- fc′≤+=
vn vs vc56--- fc′≤+=
vsAv fyv
bos------------=
Fig. 13—Shear stress at Point A of critical section (Fig. 9)during Loading Stage 2, Specimen EC0C (nonprestressedslab).
Fig. 14—Shear stress at Point A of critical section (Fig. 9)during Loading Stage 2, Specimen EC9C (slab with highestamount of prestressing).

ACI Structural Journal/March-April 2005 321
cycles. The horizontal dashed lines in Fig. 13 and 14 representthe upper limit (vn)upper limit according to ACI 318-02,3
ACI 421.1R-994 and Megally and Ghali,5 (1/2)√fc′ , (2/3)√fc′ ,and (5/6)√fc′ , respectively. From the two figures andColumn 8 of Table 1, it can be seen that in seismic designfor punching shear, it is safe to consider that (vn)upper limi t= (5/6)√fc′ in MPa (10√fc′ in psi).
Shear strength for critical section at d /2 from outermost peripheral line of SSR
ACI 318-023 requires that the shear-reinforced zoneextends to a distance (αd) such that the shear stress vu at acritical section at d/2 from the outermost peripheral line ofshear studs be less than
(11)
ACI 421.1R-994 and Megally and Ghali5 adopt the samevc value as ACI 318-02.3 In the tested specimens, thegreatest shear stress is at the free edge, Point A, when Mu isnegative. Table 1, Column 9, gives values of (vu)max /√fc′ atPoint A of the critical section at d/2 from the outermostperipheral line of SSR (Fig. 12). It can be seen that the valuesof (vu)max vary between 1.6 and 1.8 times the predictedvalue: vc = (1/6)√fc′ in MPa (2√fc′ in psi).
It should be possible by the use of Eq. (3) combined withEq. (11) to predict the value of Muy, and hence, MO, thatproduces punching shear failure at the outer critical section(Fig. 12). Similarly, the value of MO that produces punchingshear failure at the inner critical section (Fig. 9) can bepredicted by Eq. (3) combined with one of Eq. (5), (7), or (9).Consider as an example Specimen EC0C and use Eq. (9)(Megally and Ghali5), the predicted moment at the columncentroid that would produce punching shear failure at theinner and outer critical sections would be
(MO)for failure at inner section = –36 kNm (–318 kip-in.)
(MO)for failure at outer section = –4 kNm (–35 kip-in.)
The lesser of the two absolute values of MO governs. Thus,based on this analysis, one would predict that the failure wouldoccur at the outer critical section at MO = –4 kNm (–35 kip-in.).The failure in the tests of this specimen occurred at the innercritical section. Similar calculations for the other specimenswould also predict the failure at the outer critical section; inall tests, the punching failure was at the inner critical section.The reason for the false prediction is believed to be thatEq. (3) overestimates the values of vu at the outer edge dueto Vu combined with negative Mu. This is further discussedin the following section.
Calculation of maximum shear stress at critical section outside shear-reinforced zone
When the earthquake produces a negative unbalancedmoment, Eq. (3) gives an overestimate of the shear stress vuat points on (or in the vicinity of) the free edge of the criticalsection outside the shear reinforced zone (Fig. 12). No moreaccurate method exists to determine vu in this particular case.To solve this problem in design, it is suggested herein thatwhen Muy in Eq. (3) is negative, to safely ignore the SSR onthe rails running perpendicular to the inner column face (the
vn vc16--- fc′ MPa= =
studs on the right-hand side of the column in Fig. 12). Theouter shear critical section will become rectangular as shownin Fig. 15. The ratio (lx/ly) will become smaller than or closeto 0.2, resulting in γvy becoming equal or close to zero(Eq. (4)). This will avoid an overestimation of vu that willlead in design to an excessively large shear-reinforced zone(refer to the example that follows).
Example: Design of extent of shear-reinforced zoneTo show a case where the design can lead to an excessively
large shear reinforced zone, consider an edge-columnconnection (Fig. 12) with
Vu = 0.5Vc (12)
where (according to ACI 318-023)
, where fc′ is in MPa (13)
Vc is equal to the nominal shear strength (in force units) atthe inner critical section (Fig. 9) in the absence of unbalancedmoment or shear reinforcement. The critical section at d/2from the column (Fig. 9) has the properties bo = 8.57d, xO =–0.75d, xA = –1.85d, γvy = 0.35, and Iy = 6.87d 4.
Combined with Vu = 0.5Vc = (1/6) bod, assume thatthe edge column in Fig. 9 is subjected to unbalanced moment(same value as its upper limit)
(14)
This is the value of the unbalanced moment that, combinedwith Vu = 0.5Vc, produces shear stress in the inner criticalsection at the outer edge equal to (5/6)√fc′ , with fc′ in MPa.This is the upper limit for vn according to Megally andGhali.5 Equation (12) and (14) give for the critical section inFig. 9: Vu = 1.43 d2 and MO = –5.99 d3. Considerthe critical sections shown in Fig. 12 and 15. The dashed linein Fig. 16 represents αy versus the shear stress (vu)A (calcu-lated by Eq. (3)) at Point A of the critical section in Fig. 12.The point of intersection of the graph (at αy = 6.9) withthe horizontal line at coordinate (1/6)√fc′ gives the extent ofthe outer critical section. The intersection of the solid line inFig. 16 with the horizontal line at stress = (1/6)√fc′ , at αy =
Vc13--- fc′ bod=
fc′
MO16--- fc′
4Iy
γvyxA
------------ bodxO– =
fc′ fc′
Fig. 15—Alternative shear-critical section at d/2 fromoutermost peripheral line of SSR when Muy is negative.

322 ACI Structural Journal/March-April 2005
5.5, indicates the extent of shear reinforced zone when theouter critical section has the shape of three sides of a rect-angle, as shown in Fig. 15.
CONCLUSIONSOn the basis of tests and the analysis, the following
conclusions can be made concerning seismic design forpunching shear of prestressed slab-edge column connections:
1. The design recommendations of Megally and Ghali,5
intended for nonprestressed slabs, can also be used forprestressed slabs, having effective prestressing equal to 0.4 to1.1 MPa. In practice, the effective prestress is within or closeto this range. The design steps are given in Appendix A;
2. The experiments confirm Megally and Ghali’s5
recommendations that for seismic design, the upper limit ofthe nominal shear strength vn at the critical section at d/2 fromthe column can be taken equal to (5/6) in MPa (10√fc′ in psi);
3. With negative unbalanced moment Mu the maximumshear stress vu is at the outer critical section at the free edge.The use of this stress in design can lead to an excessivelylarge shear-reinforced zone. This problem can be avoidedby ignoring the shear reinforcement positioned on linesperpendicular to the free edge in calculating vu. Withpositive Mu, no shear reinforcement should be ignored indetermining vu;
4. Effective prestressing of 0.4 to 1.1 MPa in edge slab-column connections do not adversely affect the ductility orthe maximum interstory drift ratio that they can undergowithout punching failure; and
5. Headed studs prevented splitting through the slab thick-ness at the anchorages of the strands. Two studs of nominalstrength 28 kN were sufficient to prevent the splitting due toa single strand with a jacking force of 110 kN.
ACKNOWLEDGMENTSThe stud shear reinforcement used in the tests was donated by Decon,
USA and Canada. Dywidag Systems International, Vancouver, Canada,donated the prestressing strands, ducts, and anchors. Canada’s Natural Sciencesand Engineering Research Council financially supported the research.
NOTATIONAv = cross-sectional area of shear reinforcement on one peripheral
line, m2
bo = length of perimeter of shear-critical section, mcx, cy = column dimensions in the x- and y-directions, respectively, mDRu = maximum interstory drift, including inelastic deformation,
divided by lc
d = average of distances from extreme compression fiber to centroidof tension reinforcements running in two orthogonal directions, m
fc′ = specified concrete strength, Pafpc = average effective prestress in two directions at section centroid, Pafyv = specified yield strength of shear reinforcement, PaIy = second moment of area of assumed critical section about y-axis, m4
lc = story height, mlx, ly = projections of shear-critical section on its principal x- and y-axes,
respectively, mMO = unbalanced moment transferred between slab and column, NmMu = unbalanced moment transferred between slab and column at
centroid of shear-critical section, Nms = spacing between peripheral lines of shear reinforcement, mVc = nominal shear strength provided by concrete, NVu = factored shear force at section, Nvc = nominal shear strength (in stress units) provided by concrete, Pavn = nominal shear strength (in stress units), Pavs = nominal shear strength (in stress units) provided by shear rein-
forcement, Paα = ratio of distance between column face and shear-critical section
outside shear-reinforced zone to slab effective depth∆ = interstory drift, mγv = fraction of unbalanced moment transferred by eccentricity of
shear stressesµ∆ = displacement ductility
REFERENCES1. Martinez-Cruzado, J. A.; Qaisrani, A. N.; and Moehle, J. P., “Post-
Tensioned Flat Plate Slab-Column Connections Subjected to EarthquakeLoading,” 5th U.S. National Conference on Earthquake Engineering,Chicago, Ill., 1994, V. 2, pp. 139-148.
2. Hawkins, N. M., “Lateral Load Resistance of Unbonded Post-TensionedFlat Plate Construction,” PCI Journal, V. 26, No. 1, Jan. 1981, pp. 94-117.
3. ACI Committee 318, “Building Code Requirements for StructuralConcrete (ACI 318-02) and Commentary (318R-02),” American ConcreteInstitute, Farmington Hills, Mich., 2002, 443 pp.
4. ACI Committee 421, “Shear Reinforcement for Slabs (ACI 421.1R-99),”American Concrete Institute, Farmington Hills, Mich., 1999, 15 pp.
5. Megally, S., and Ghali, A., “Seismic Behavior of Edge Slab-ColumnConnections with Stud Shear Reinforcement,” ACI Structural Journal,V. 97, No. 1, Jan.-Feb. 2000, pp. 53-60.
6. International Code Council, “International Building Code (IBC-2003),”Ill., 2003, 660 pp.
7. Pan, A., and Moehle, L. P., “Lateral Displacement Ductility ofReinforced Concrete Flat-Slabs,” ACI Structural Journal, V. 86, No. 3,May-June 1989, pp. 250-258.
8. Park, R., and Paulay, T., Reinforced Concrete Structures, John Wileyand Sons, Inc., New York, 1975, 769 pp.
APPENDIX A—STEPS FOR DESIGNConsider a structure provided by shear walls or other
bracing systems such that the drift ratio in the x-direction,including plastic deformation, DRu ≤ 0.025. It is required todesign seismic resistant slab-column connections at an edgeparallel to the y-axis. The steps of design (based on Megallyand Ghali5) are summarized below. The values of fc′ , fyv, Vu,Vc, DRu, and d are given. Steps 1 and 2 calculate the value ofMu to be used in the design and Steps 3 to 6 design the shearreinforcement, if required (refer to flow chart in Fig. A1).
Step 1—Calculate the maximum elastic interstory drift ∆e
(A1)
where lc is the story height and C is a dimensionless factorspecified by IBC(2003), Section 16.17.3,6 representing theinherent inelastic deformability of the primary resistingsystem and the occupancy importance of the structure (forexample, with shearwalls, 2.7 ≤ C ≤ 6.7).
Step 2—Calculate the unbalanced moment Muy by linearelastic analysis of an equivalent frame, as specified by
∆eDRu
C----------lc=
Fig. 16—Maximum shear stress outside shear-reinforcedzone at point on free edge. Example column dimensions cx =cy = 250 mm.

323ACI Structural Journal/March-April 2005
ACI 318-02,3 Section 13.7, subjected to prescribed interstorydrifts ∆e. The value of Muy need not exceed the upper limit
(A2)
where Mpr is the probable flexural strength of the inner sideof the critical section in Fig. 9, having a width equal to ly. Foran edge column, the empirical coefficient αm is
(A3)
where γvy is the fraction of moment transferred by verticalshear stresses in the slab, and ρ is the ratio of tensile flexuralreinforcement passing through the inner side ly of the shear-critical section. The tensile flexural reinforcement is at the topor at the bottom when Mu is positive or negative, respectively.In calculating the probable flexural strengths, use 1.25 timesthe specified yield strength of the nonprestressed flexuralreinforcement and a strength reduction factor equal to 1.0.3
Step 3—Calculate the maximum shear stress vu at d/2from the column face (Eq. (3)). Verify that vu ≤ (5/6)√fc′ ; ifthis is not satisfied, the structural members should bechanged to reduce vu (for example, increase column sides,
or reduce drift by stiffening the bracing system). If vu ≥ φvn,go to Step 6 where vn is the nominal shear strength withoutshear reinforcement.
Step 4—When DRu ≤ 0.015 and (Vu/φVc) ≤ 0.4 or whenDRu ≥ 0.015 and (Vu/φVc) ≤ (0.625 – 15DRu) the connectiondoes not require shear reinforcement and the design iscomplete. If either of these conditions are not satisfied, go toStep 5.
Step 5—Provide the minimum amount of shear reinforcementsuch that the steel contribution to the nominal shear strengthsatisfies the inequality
vs = MPa (A4)
vs = psi (A4)
Step 6—Provide shear reinforcement according to ACI421.1R-992 such that vu ≤ φvn, where the nominal shearstrength vn = vs + vc, where vc and vs are the shear strengthprovided by the concrete and shear reinforcement, respectively(Eq. (10) and (1)); extend the shear-reinforced zone such thatvu in the outer critical section does no exceed (1/6)√fc′ inMPa (2√fc′ in psi).
Mu( )limit
Mpr
αm
---------≤
αm 0.55 γvy–lx ly⁄40
-----------– 40ρ+= Av fyv
bos------------ 1
4--- fc′≤
Av fyv
bos------------ 3 fc′≤
Fig. A1—Design steps for punching shear.