seismic reflection profiling for massive sulfide
TRANSCRIPT

Institute of Seismology University of Helsinki
Report S-59
SEISMIC REFLECTION PROFILING FOR MASSIVE SULFIDE EXPLORATION IN FINLAND
Suvi Heinonen
Institute of Seismology Department of Geosciences and Geography
and Division of Geophysics and Astronomy
Department of Physics Faculty of Science
University of Helsinki Helsinki, Finland
ACADEMIC DISSERTATION
To be presented, with the permission of
the Faculty of Science of the University of Helsinki, for public criticism in Auditorium PIII, Porthania,
Yliopistonkatu 3, on October 18th 2013 at 12 o’clock noon.
Helsinki 2013

©Suvi Heinonen (synopsis) Supervisor: Dr. Pekka Heikkinen
Department of Geosciences and Geography University of Helsinki, Finland
Co-supervisors: Dr. David Snyder
Geological Survey of Canada Ottawa, Canada
Prof. Ilmo Kukkonen Department of Physics University of Helsinki, Finland
Pre-examiners: Prof. Stefan Buske
Institute of Geophysics and Geoinformatics Technical University Bergakademie Freiberg, Germany
Prof. Pär Weihed Department of Civil, Environmental and Natural Resources Engineering Luleå University of Technology, Sweden
Opponent: Prof. Ramon Carbonell Department of Structure and Dynamics of the Earth Institute of Earth Sciences Jaume Almera (ICTJA/CSIC), Barcelona, Spain
Custos: Prof. Ilmo Kukkonen
Department of Physics University of Helsinki, Finland
ISSN 0357-3060 ISBN 978-952-10-5073-2 (Paperback) ISBN 978-952-10-5074-9 (PDF) http://ethesis.helsinki.fi Unigrafia Helsinki 2013

i
Abstract
Depletion of the near surface mineral deposits has created a need to develop new, innovative deep exploration tools. Seismic reflection soundings have been successfully used for hydrocarbon exploration over a century, but method’s applications in the hardrock environment have been limited until recently. Strongly 3-dimensional and discontinuous geological structures are typical for the crystalline bedrock and especially for mining camps. This causes challenges to the seismic data acquisition and processing as well as to the interpretation.
In this thesis, seismic reflection profiling is applied to the exploration of massive sulfide deposits in the Pyhäsalmi, Vihanti and Outokumpu area. Study areas belong to the Raahe-Ladoga belt containing 90% of the known sulfide deposits of Finland. In each of the study sites a network of seismic reflection profiles was acquired during the HIRE (HIgh REsolution reflection seismics for ore exploration 2007-2010) project by the Geological Survey of Finland. The multiphase deformation history of the study areas is demonstrated by folding, faulting and shearing that cause the complex subsurface reflectivity patters observed in the seismic data. These data enable thorough discussion on the applicability of the reflection seismic profiling for massive sulfide exploration in a geological environment that is highly deformed and metamorphosed.
Careful static corrections and velocity analysis are the most important steps in the processing of the seismic reflection data acquired in hardrock terrains. Steeply dipping structures are not uncommon in the study sites and proper stacking of these structures require use of unrealistically high NMO velocities. Steep and horizontal features are best interpreted from separate stacks using 3D-visualization and modeling software. Results of velocity analysis can also be utilized in the seismic interpretation. For example in Vihanti low NMO velocities correlated with the known wide fracture zone.
Difference in the acoustic impedance of the rocks defines the strength of a reflection originating from the rock contact. Geophysical drill hole logging shows that in addition to the massive sulfides, the hosting rock sequences are also strongly reflective in Vihanti, Pyhäsalmi and Outokumpu. Reflecting hosting lithology enables the determination of favorable exploration environments. In Pyhäsalmi, the known massive sulfide deposit could not be reliably identified from the seismic section because of the crooked acquisition lines, noise caused by the functioning mine and lithologically heterogeneous and strongly 3-dimensional geological background of the deposit.

ii
Based on the drill hole logging data, most reflections originate from contacts between mafic volcanic and other rocks in the Pyhäsalmi area. Mineralizations typically occur at the transition from the felsic to mafic volcanism. Reflectivity in the Pyhäsalmi area indicates continuation of the ore-critical bimodal volcanic sequence underneath wide, but shallow, granite intrusions, which has not been explored previously. Moreover, amplitude enhancement of this interpreted contact was proved to be caused by the uneconomic zinc mineralization. Amplitude enhancement inside of the reflective units interpreted as ore hosting lithology was also used as an exploration criteria in the Outokumpu area. Because sulfide ores are small compared to the typical seismic wavelength, they cause diffractions instead of reflections. Diffraction analysis was used for seismic deep exploration in Outokumpu and Vihanti.
Good seismic interpretation employs the structural geology of the study area. In Pyhäsalmi, only hinges of the subvertical folds were imaged while steep limbs could not be directly imaged by seismic profiling. Gentle open folding is typical for Vihanti region and was shown as undulating reflectivity in the seismic profiles. Reverse faults interpreted in all study regions are most prominent in the Vihanti area where strong reflectors are cut by faults. Knowledge of the fault locations is important for exploration because they might have acted as pathways for fluids carrying sulfide minerals during deformation. Seismic reflection data provides an insight to the deep continuation of the fault zones.
Research presented in this thesis shows that seismic reflection profiling is a useful tool for deep ore exploration. The depth resolution of the method is excellent and interpretation of the crossing seismic profiles enables the 3D geological modeling of the subsurface structures and lithological contacts. Successful modeling requires the use of other available geophysical and geological data. A geological 3D-model combines the knowledge acquired by different methods making strategic planning of exploration possible, in particular by facilitating the decisions of expensive deep drill holes. Seismic reflection profiles create the framework on which the geological model is built on.
iii
Tiivistelmä (in Finnish)
Tunnettujen, lähellä maan pintaa sijaitsevien mineraalivarojen ehtymisen takia on tarpeen kehittää uusia, innovatiivisia syvämalminetsintämenetelmiä. Seismistä heijas-tusluotausta on käytetty öljynetsinnässä menestyksellisesti jo lähes vuosisadan ajan, mutta menetelmää on toistaiseksi sovellettu kiteisen kallioperän malminetsintään vain rajoitetusti. Kiteiselle kallioperälle, ja erityisesti kaivosalueille, tyypilliset kolmi-ulotteiset ja epäjatkuvat rakenteet ovat haaste niin seismisen heijastusluotaus-aineiston mittaamiselle, prosessoinnille kuin tulkinnallekin.
Tämä väitöskirja käsittelee seismisen heijastusluotauksen käyttöä massiivisulfidi-malmien etsintään Pyhäsalmen, Vihannin ja Outokummun alueilla. Tutkimusalueilla tehtiin seismisiä heijastusluotausprofiileja Geologisen Tutkimuskeskusken HIRE-projektissa (HIgh REsolution reflection seismics for ore exploration 2007-2010). Tutkimusalueiden monivaiheinen deformaatiohistoria näkyy poimutuksina, siirroksina ja hiertoina, jotka saavat aikaan monimutkaisen maanpinnanalaisen heijastavuuden. Laaja aineisto mahdollistaa perusteellisen keskustelun seismisen heijastusluotauksen soveltuvuudesta malminetsintään voimakkaasti deformoituneilla alueilla.
Staattiset korjaukset ja nopeusanalyysi ovat tärkeimpiä työvaiheita kiteisen kallio-perän seismisen heijastusluotausaineiston prosessoinnissa. Tutkimusalueille tyypillis-ten, lähes vertikaalien kivilajikontaktien havaitsemisen edellytys on epärealististen korkeiden NMO-nopeuksien käyttäminen aineiston pinoamisessa. Lisäksi havaittiin, että lähes vertikaalit ja horisontaaliset piirteet on paras tulkita erillisistä seismisistä sektioista käyttäen 3D-visualisointi ja -mallinnusohjelmistoja. Nopeusanalyysin tulok-sia voidaan hyödyntää myös aineiston tulkinnassa. Esimerkiksi Vihannissa alhaisten NMO-nopeuksien todettiin korreloivan merkittävien rakovyöhykkeiden kanssa.
Seismisen aineiston tulkinnassa on ensiarvoisen tärkeää tuntea alueelle tyypillisten kivien akustinen impedanssi (seismisen nopeuden ja tiheyden tulo). Ero kivilajien akustisessa impedanssissa määrää heijastuksen voimakkuuden. Geofysikaalisten kairareikämittausten tulokset osoittavat, että niin Pyhäsalmella, Vihannissa kuin Outokummussakin sulfidimalmin lisäksi myös sen isäntäkiviseurue on voimakkaasti heijastava. Useimmat sulfidimalmit ovat pieniä verrattuna seismisiin aallonpituuksiin tutkimussyvyyksillä, joten malmien suora havaitseminen seismisten profiilien avulla on epätodennäköistä. Pyhäsalmen tunnettua massiivisulfidimalmia ei pystytty luotettavasti tunnistamaan kaivoksen läheisistä seismisistä profiileista mittauslinjojen mutkaisuuden, kaivostoiminnan aiheuttamien häiriöiden sekä malmia ympäröivän vaihtelevan ja 3-ulotteisen geologian takia.
Pyhäsalmen alueella heijastavuus syntyy pääsääntöisesti mafisten ja felsisten vulkaanisten kivien kontaktissa, johon myös mineralisaatiot liittyvät. Kairareiästä

iv
tunnistettua kontaktipintaa pystyttiin seuraamaan seismiseltä heijastusluotauslinjalta toiselle aiemmin malminetsinnän ulkopuolelle jätetyn graniitti-intruusion alle, mikä on suurentanut alueen malmipotentiaalia merkittävästi. Lisäksi kontaktiin liittyvän seismisen amplitudin kasvun todettiin johtuvan sinkkimineralisaatiosta. Myös Outokummussa malmin tyypillisiksi isäntäkiviksi tulkittujen heijastajien amplitudin voimistumista on käytetty kriteerinä uusien malminetsintäkohteiden määrittämisessä. Sulfidimalmit ovat pieniä suhteessa seismisiin aallonpituuksiin, joten ne aiheuttavat heijastusten sijaan diffraktiota. Diffraktioanalyysiä sovellettiin seismisessä syvämal-minetsinnässä Outokummussa ja Vihannissa.
Seismisen heijastusluotausaineiston hyvä tulkinta on sidoksissa tutkimusalueen rakennegeologiseen tuntemukseen. Pyhäsalmella vain pystyjen poimujen harjat pystyttiin havaitsemaan seismisissä sektioissa, koska pinnalla olevien lähteiden ja vastaanottimien avulla ei voida suoraan havaita lähes vertikaaleja poimun kylkiä. Vihannille tyypillinen loiva poimutus näkyi seismisissä sektioissa aaltoilevana heijastavuutena. Käänteissiirrokset ovat tyypillisiä niin Outokummun, Vihannin kuin Pyhäsalmenkin alueille. Vihannissa siirrosten vaikutus näkyy selvimmin, sillä siirrokset katkovat voimakkaita suoraviivaisia heijastajia. Siirrosten sijainti on malminetsinnän kannalta tärkeää, koska fluidit ovat voineet kuljettaa metalleja niitä pitkin deformaation aikana.
Tutkimukseni osoittaa, että seisminen heijastusluotaus on toimiva työkalu syvämalminetsinnässä. Seismisen menetelmän syvyysulottuvuus on erinomainen, ja yhdistämällä seismiset tulkinnat risteävillä 2D-linjoilla pystytään luomaan 3D-malli maanpinnanalaisista geologisista rakenteista useiden kilometrien syvyyteen. Mallinnuksessa on välttämätöntä käyttää apuna myös muiden geofysiikan menetelmien tuloksia sekä erityisesti rakennegeologisia tietoja. Geologinen 3D-malli yhdistää eri menetelmillä saadun tiedon kallioperän rakenteista ja mahdollistaa paremman malminetsintästrategian sekä erityisesti helpottaa syväkairareikien suunnittelua.

v
Acknowledgements
My supervisors Dr. Pekka Heikkinen, Dr. Ilmo Kukkonen and Dr. David Snyder introduced me to the idea of making thesis about the use seismic reflection profiling for ore exploration after I finished my masters degree in 2008. Following years of research and studies brought me a number of opportunities to meet people from both academia and industry and become friends with them, travel around the world and also to have glorious, memorable moments investigating the miracles that seismic reflection data reveals of the deep(ish) subsurface. First of all, I acknowledge all three of my supervisors for providing me these great opportunities to learn and gain experience.
Numerous trips to Geological Survey of Canada (GSC) and international scientific conferences would not have been possible without the support of director Pekka Heikkinen. He has encouraged and supported me to present my work in top meetings and network both nationally and internationally which has been important source of motivation for me. David Snyder has welcomed me cordially to Canada, introduced me to the basic concepts of structural geology and also provided advice during the different phases of my PhD and career planning. Without Ilmo Kukkonen’s persistence and eagerness the unique hardrock seismic data I used in my studies would hardly exist.
I’ve received advice and assistance from colleagues and friends that has made working with my thesis much more pleasant. I am thankful for Outi Valtonen, Kaisa Nikkilä and other colleagues in the Institute of Seismology for their support, companionship and all the fun parties during my years in Seismo. I became a geophysics major after Emilia Koivisto had been teaching me about seismic wave propagation and later Emilia has been my unrivalled seismic partner in crime. I thank Annakaisa Korja for extensive discussions and giving me the final kick to stop wondering and wrap up my thesis. Kari Komminaho and Jukka Keskinen have provided me invaluable technical assistance. Happiness is said to start from warm feet: thus I am grateful to Katriina Arhe for, among other things, knitting me excellent woollen socks that have protected me from freezing during the long hours in the office when making thesis has been tedious.
I feel privileged to be part of Pyhäsalmi ProMine-team. Working in a multi-disciplinary group has been stimulating and rewarding. I admire the amount of enthusiasm and knowledge Timo Mäki and Jouni Luukas have about Pyhäsalmi region and I feel grateful that they have shared parts of it with me. Working with Marcello Imaña and Tuulia Häkkinen taught me a great deal of geology and provided some unforgettable experiences, such as trying to get a taxi back to Koivikkotie at the early hours of the morning after having been singing karaoke in Pyhäsalmi local bar. I’m also thankful for

vi
Jukka Kousa and Eeva-Liisa Laine for good collaboration on the research regarding Vihanti area, and Peter Sorjonen-Ward and Doug Schmitt for their input on research regarding Outokumpu.
I would not have spent so long periods of times in Canada if not such a great crowd worked in the GSC Ottawa. I am ever thankful for David and Lori Snyder for their friendliness and hospitality. Barbara Dietiker and Dirk Pfaff also offered me a home-away-from-home, delicious breakfasts and a position of basement princess, as well as introduced me to bunch of nice people and the Canada’s great outdoors. I am grateful and happy for their friendship. Ernst Schetselaar has been of great help in 3D geological modeling and I also appreciate his warm friendship and knowledge about the significance of the pupil shape on toxicity of a snake. Gilles Bellefleur spent substantial time on helping me to get started with seismic data processing and modeling. Azad Rafeek was always ready to help me with poster printing and maps, among other things. In addition to the people already mentioned, I thank also respectable Dr. Don White, Brian Roberts, Eric de Kemp, Jim Craven and others for excellent company (especially in Friday Beers!) and all the help they’ve provided during my visits to GSC.
I am grateful to Ilmari Smedberg, Minna Kuusisto, Johanna Keskinen, Lars Kaislaniemi, and other members of HaGe-group for peer support and beer reviews! Especially, I’m thankful to Eero Heikkinen for encouragement and his interest in my research. There are many of you who have influenced on my PhD work that I have not mentioned by name. However, you must know how much I appreciate all discussions (especially seismic) and all the fun we’ve had during different meetings, conferences and occasions!
I am most thankful for the support of my family, relatives and friends outside of the
scientific community. Finally, I thank Lasse for bringing my life not only audible and
enjoyable sound waves but also for delicious packed lunches. In the past five years,
my life would only have been a reflection without him.
In Helsinki, 19.09.2013
Suvi Heinonen

vii
“By three methods we may learn wisdom:
first by reflection, which is noblest;
second, by imitation, which is easiest;
and third, by experience, which is the most bitter.”
-Confucius
”En osaa auttaa, hän haluaa heijastuksen.”
-Ultramariini (in “Hän haluaa heijastuksen” , 2010)

viii
ix
Contents
Abstract ............................................................................................................ i
Tiivistelmä (in Finnish)..................................................................................... iii
Acknowledgements .......................................................................................... v
Contents ..........................................................................................................ix
Abbreviations ................................................................................................... x
List of original publications ...............................................................................xi
Contributions ................................................................................................. xiii
1. Introduction................................................................................................. 1
Review of the original publications ............................................................ 4
2. Raahe-Ladoga belt ....................................................................................... 6
3. Seismic reflection data acquisition and processing ..................................... 8
Data acquisition ........................................................................................ 8
Seismic processing .................................................................................. 12
4. Seismic interpretation ............................................................................... 14
Physical rock properties .......................................................................... 14
Geometry of the target ........................................................................... 17
From 2D-interpretation to 3D-model ...................................................... 20
Guidelines for hardrock seismic exploration ............................................ 22
5. Conclusions ................................................................................................ 24
References ..................................................................................................... 26

x
Abbreviations
2D 2-dimensional 3D 3-dimensional A amplitude CMP Common Mid Point d depth DMO Dip Move-Out F width of the first Fresnel zone f frequency NMO Normal Move-Out RC Reflection coefficient S/N Signal-to-Noise ratio t travel time of the seismic wave TWT two-way-travel time v P-wave velocity VMS Volcanogenic Massive Sulfide Z acoustic impedance x offset (distance between shot and receiver points) λ seismic wavelength ⍴ density

xi
List of original publications
This thesis is based on the following publications, which are referred to in the text by their roman numerals:
I. Heinonen, S., Kukkonen, I.T., Heikkinen, P.J. and Schmitt, D.R., 2010. High Resolution Reflection Seismics Integrated With Deep Drill Hole Data in
Outokumpu, Finland in Kukkonen, I. (ed). Outokumpu Deep Drilling Project. Geological Survey of Finland, Special Paper 51, p. 105-118.1
II. Heinonen, S., Imaña, M., Snyder, D.B., Kukkonen, I.T. and Heikkinen, P.J., 2012. Seismic reflection profiling of the Pyhäsalmi VHMS-deposit: A complementary approach to the deep base metal exploration in Finland. Geophysics, 77, p. WC15-WC23.2
III. Kukkonen, I.T., Heinonen, S., Heikkinen, P.J. and Sorjonen-Ward, P., 2012. Delineating ophiolite-derived host rocks of massive sulfide Cu-Co-Zn deposits with 2D high-resolution seismic reflection data in Outokumpu, Finland. Geophysics, 77, p. WC213-WC222.3
IV. Heinonen, S., Heikkinen, P.J., Kousa, J., Kukkonen, I.T. and Snyder, D.B., 2013. Enhancing hardrock seismic images: reprocessing of high resolution seismic reflection data from Vihanti, Finland. Journal of Applied Geophysics, 93, p.1-11.4
The articles have been reprinted with kind permission from the following publishers: 1 © 2010 Geophysical Survey of Finland 2 © 2012 Society of Exploration Geophysicists 3 © 2012 Society of Exploration Geophysicists 4 © 2013 Elsevier B.V.

xii
Additional refereed journal articles published during the PhD work that are not included in the thesis:
Koivisto, E., Malehmir, A., Heikkinen, P.J., Heinonen,S. and Kukkonen, I.T., 2012. 2D reflection seismic investigations at the Kevitsa Ni-Cu-PGE deposit, northern Finland. Geophysics 77, p. WC149–WC162.
Kukkonen, I., Heikkinen, P., Heinonen, S., Laitinen, J. & HIRE Working Group of the Geological Survey of Finland, 2011.Reflection seismics in exploration for mineral deposits: initial results from the HIRE project. In Nenonen, K. & Nurmi, P. (eds.), Geoscience for Society: 125th Anniversary Volume. Geological Survey of Finland, Special 49, 10 p.
Schijns, H., Heinonen, S., Schmitt, D.R., Heikkinen, P.J., Kukkonen, I.T.,2009: Seismic refraction traveltime inversion for static corrections in a glaciated shield rock environment: a case study. Geophysical Prospecting 57, p. 997-1008.

xiii
Contributions
I: I carried out data processing, analysis and interpretation, and wrote the manuscript. Discussions with co-authors have influenced the processing procedure and data interpretation. The final manuscript was corrected and modified according to the comments by co-authors. I also participated in the data acquisition done by University of Alberta and supported by ICDP (International Continental Scientific Drilling Program).
II: I carried out data processing and interpretation, wrote the manuscript and prepared figures. Seismic data used in the study was collected during HIRE (High Resolution Reflection Seismics for Ore Exploration, 2007-2010) project led by Geological Survey of Finland. I contributed to the planning of the drill hole geophysical measurements that were conducted by Astrock Oy. Co-authors participated data interpretation and the final manuscript was modified according to comments by the co-authors.
III: I contributed to the research presented in the paper by conducting drill hole data analysis, synthetic seismogram calculations and attribute analysis of seismic profiles, and contributed to compilation of figures. Writing of the manuscript and data interpretation was mainly done by the first author. Seismic data used in the study was collected as a part of the HIRE project.
IV: I carried out data processing and interpretation, and wrote the manuscript as well as prepared figures. Research was discussed with co-authors who also commented on different versions of the manuscript. Seismic data used in the study was collected during the HIRE project.

xiv

1
1. Introduction
Global base metal consumption has increased because of the growing standard of living especially in the developing countries. In Western Europe, each person consumes approximately 8 kg of copper and 20 kg of aluminum yearly (Rogich and Matos, 2008). Active mining and new mineral discoveries are needed to satisfy mankind’s appetite for metals. Only some 15% of metals used in European Union are also mined and refined in Europe and this ratio is expected to remain approximately constant (Kananoja et al., 2012). Growth of global metal market prices and increased demand combined with the EU’s stated aim to secure and increase domestic metal production has led to the boom of mineral exploration especially in Nordic countries having high potential for yet undiscovered mineral resources. In 2010, 18.2 Mt of base and precious metals were extracted from the Finnish bedrock and Finland is among Europe’s top producers of gold, nickel, zinc and cobalt, and the only producer of chrome. In 2012, 42 companies spent a total of 60.9 million Euros for mineral exploration in Finland (Uusisuo, 2012).
Depletion of the known shallow mineral resources has increased the interest to develop deep exploration techniques. Currently the deepest mine on earth, AngloGold Ashanti’s gold mine Mponeng in South Africa reaches 3.9 km in depth
(AngloGold Ashanti, 2012). In Europe’s deepest mine, Pyhäsalmi, ore is extracted at the depth of 1.5 km. These examples show that techniques needed for the deep mineral extraction exist and economic mining of the deep ore bodies is possible especially when the exploitation infrastructure is already in place. Nevertheless, new and innovative techniques are required for discovery of an undisturbed mineral deposit lying hundreds of meters below the earth’s surface. Underlying physical principles of many geophysical methods used in mineral exploration impose inescapable limitations on their sensitivity and resolving power at depth (Eaton et al., 2003).
The seismic reflection method has a unique capability to image earth structures in high resolution down to the depth of tens of kilometers and this method has been commonly used in the hydrocarbon exploration for almost a century. In active seismic studies, seismic waves are produced either by explosions or using purpose-built vibroseis sources. When physical properties in the subsurface abruptly change, seismic waves reflect and resulting seismic signal that reaches the surface is measured with seismometers (geophones). Seismic reflection profiling has also been used to study the deep crustal structures down to the depth of the Mohorovicic discontinuity, for example in United

2
States (COCORP), Canada (LITHOPROBE), Great Britain (BIRBS), Spain (IBERSEIS), Russia (URSEIS), Finland (FIRE) and Japan (e.g. Bastida et al., 1997; Brewer et al., 1981; Brown et al., 2012; Clowes et al., 1996; Dentith et al., 2000; Diakonova et al., 2007; Drummond et al., 2006; Goleby et al., 2004 and 2009; Hammer and Clowes, 1997; Kashubin and Juhlin, 2010; Klemperer and Hobbs, 1992; Korsch et al., 1998; Kukkonen and Lahtinen, 2006 and reference therein; Ludden et al., 1993; Sato et al., 1998 and 2009; Steer et al., 1998). These studies target crustal architecture and tectonic evolution, but they also have important implications for mineral exploration because they provide information about the large scale geological environments favorable for ore formation.
Volcanogenic massive sulfide (VMS) deposits contribute approximately 22% of Zn, 6% of Cu, 9.7% of Pb, 8.7% of Ag and 2.2% of Au of the world-wide production of these metals from over 800 known VMS deposits exceeding geological reserves of 200 000 t each (Galley et al., 2007). VMS are stratabound mineral deposits that have formed by the precipitation of sulfide minerals on and near the seafloor during submarine volcanic activity. Because of their polymetallic nature, VMS deposits are a desirable deposit type in that they provide security against fluctuating market prices of metals. Over 90 % of the known sulfide mineral resources in Finland are located in the Raahe-Ladoga belt, sometimes called the Main Sulfide Ore Belt, that trends across the Finland from northwest to southeast in the
central part of the country (Hattula and Rekola, 1997). Many mines have been and are still operating in the Raahe-Ladoga belt and likely many deeply buried mineral deposits still lie undiscovered.
Early applications of seismic profiling for mineral exploration had only limited success because the first attempts of hardrock seismic data acquisition and processing were done without the required modification to the procedures typically used previously in hydrocarbon exploration (Milkereit and Eaton, 1998). In many VMS-districts globally, multiphase deformation history and metamorphism change the composition and orientation of the originally sub-horzontal volcanic and sedimentary strata through faulting, folding and alteration. Complexity of geology and the small size of the exploration targets create challenges to seismic exploration that need to be addressed all stages of a seismic reflection project. Mining industry increasingly needs deep exploration targets as easily detectable shallow ore bodies become rarer (Boszczuk et al., 2011) and also because mature mining camps need new reserves in order to continue operations.
The seismic reflection method has become more popular in the mineral exploration in the past few years despite of the challenges of the hardrock applications (e.g. Malehmir et al., 2012 and 2013). Unlike as is the case in crustal-scale seismic experiments where the lower crust cannot be drilled, mining camps seismic interpretations can be

3
adjusted to the lithological data available from the drill holes. Geophysical drill hole logging enables the determination of the seismic velocities and densities of the main lithological units in the study area. This knowledge is a crucial part of the interpretation of the seismic reflection profiles. Laboratory experiments suggest that massive sulfides are reflective in any typical host rock setting (Salisbury et al., 2000), making seismic detection of massive sulfide deposit possible. Because deposits are typically stratabound, identification and mapping of the ore hosting unit as a seismic reflector is also feasible. Seismic reflection studies sometimes aim for direct detection of the ore (Malehmir et al., 2009; Milkereit et al., 2000), but more commonly to image the lithological contacts, structural style and fault systems associated with the mineralization (Calvert an Li, 1999; Malehmir and Bellefleur, 2010; Milkereit et al., 1992; Perron and Calvert, 1998; Snyder et al., 2009; Spencer et al., 1993).
This PhD-thesis includes four published and peer reviewed research papers concerning seismic reflection profiling in three massive sulfide mining camps; Outokumpu (papers I and III), Vihanti (paper IV) and Pyhäsalmi (paper II). These mining camps are part of the same mineralized zone, the Raahe-Ladoga belt. Vihanti and Pyhäsalmi also belong to the same Zn-Cu mining district. Vihanti is a former mine site with decades of mining that ended when the known ore reserves were mined out. Mining started in the 1960’s in Pyhäjärvi
region and is still ongoing, making Pyhäsalmi the oldest mine in Finland. In Pyhäsalmi, the known ore reserves are estimated to deplete in 2019 (First Quantum Minerals Ltd, 2013) and the discovery of a new deposit is vital in order to continue the use of the extensive infrastructure in place. In the Outokumpu district, three major base metal mines were producing from 1914 to 1989 and currently new underground mine developments are taking place (Altona Mining Limited, 2013). These mining districts still have a high potential for new ore discoveries even if the exploration has been active for decades. The discovery of the shallow deposits has led to the finding of deep continuation of the ore, confirming that big ore bodies can still exist at depths where conventional geophysical techniques do not provide sufficient resolution. The need for innovative deep exploration methods motivate the study of the applicability of reflection seismic profiling for mineral exploration in the Pyhäsalmi-Vihanti and Outokumpu districts.
This thesis aims to develop the concept of hardrock seismic profiling for mineral exploration through advances in data processing, interpretation methods and 3D-modeling. The most important questions discussed in the thesis are:
1. Is seismic reflection profiling an applicable tool for base metal exploration in highly deformed areas such as mining camps of the Raahe-Ladoga belt?

4
2. Do physical rock properties favor seismic detection of lithological contacts and what types of contacts can be mapped by using the seismic method? One of the most important questions is whether the ore hosting stratigraphy is reflective and whether it is possible to distinguish reflections originating from fracture zones and lithological contacts.
3. What known geological structures and features can also be identified from the seismic profiles?
4. Can we use seismic reflection profiling for direct detection of a massive sulfide deposit?
5. What are the key processing steps for improved seismic images?
6. Can we use seismic reflection profiling for shaping the deep exploration strategies?
A network of seismic reflection profiles was acquired with similar parameters in all study sites (papers II, III, IV) within the HIRE-project (HIgh REsolution reflection seismic for ore exploration, 2007-2010), and in Outokumpu an additional high resolution seismic profile was acquired and processed (paper I). At all these study sites, geophysical drill hole logging data are available that make correlation of lithologies and reflectivity possible. These high quality data enable thorough discussion of the questions raised about the use of the seismic reflection profiling for massive sulfide deposit exploration in Finland.
Review of the original publications
Data used in paper I provided an excellent opportunity to correlate reflectivity of the high resolution seismic reflection profile with the continuous geophysical logging data of the 2.5 km long Outokumpu deep drill hole. We present the processing of a high resolution reflection seismic profile acquired with irregular crooked line geometry. Careful static corrections proved to be crucial for the quality of the final seismic image. Analysis of the geophysical logging data measured in the Outokumpu deep drill hole show that the ore hosting Outokumpu assemblage rock units have distinct acoustic impedances from other typical rocks in the area (mica schist, biotite gneiss and quartz-feldspar schist). Inside the Outokumpu assemblage, low acoustic impedance serpentinites are in contact with the high acoustic impedance skarn rocks resulting in prominent internal reflectivity. Synthetic seismogram calculated from the drill hole data is very similar to the trace extracted from the migrated and depth converted reflection seismic profile allowing reliable correlations. Prominent reflectivity caused by the Outokumpu assemblage rocks is apparent, and also a reflection at ~1000 m depth caused by a water bearing fracture zone is observed in the seismic profile.
In paper II, a network of seismic reflection profiles in Pyhäsalmi reveals a complex reflectivity pattern of the subsurface. The area is characterized by

5
folds with subvertical axial plane of which only subhorizontal hinges are directly imaged as seismic reflectors. In the drill hole logging, seismic velocities changed according to the lithology and no commonly assumed increase of velocity with depth was observed. For data migration, constant velocity was found superior to the preliminary velocity function that had velocity increasing with depth. Drill hole logging data indicates that high density massive sulfides are feasible targets for seismic imaging, but the seismic signal caused by the known massive sulfide ore body could not be confidently identified from the stacked seismic reflection profiles. However, the reflective contact of felsic and mafic volcanic rocks was mapped over a wide area and enhanced amplitudes associated with the contact proved to contain uneconomical zinc mineralization. Furthermore, seismic reflection profiles show the continuation of the ore hosting mafic-to-felsic transition zone under granites which extends the exploration ground in the Pyhäsalmi mine vicinity.
The aim of paper III was to delineate and model the ore hosting Outokumpu assemblage rocks in the area where reflection seismic profiles were acquired during the HIRE-project. The previous study (I) showed that the Outokumpu assemblage is strongly reflective and thus seismic mapping of the ore-hosting rocks is possible. Paper III presents a 3D interpretation of the network of the seismic profiles. Experiments with synthetic seismograms indicate that the ore formation that has occured inside of
the assemblage would further enhance the internal reflectivity of the unit. Envelope plots were used to identify the strongest reflections inside of the reflective packages interpreted to be the Outokumpu assemblage rocks. Massive sulfide ore is likely to be a diffractor rather than a reflector of the seismic energy because the size of the ore lens is less than the typical seismic wavelength. Diffractor analysis of NMO-stacks was thus combined with envelope plots and several potential targets for further exploration were identified based on the analysis.
In paper IV, reprocessing of the seismic reflection data acquired in the Vihanti mining camp reveals that better seismic images result if substantial effort is put on the velocity analysis during the data processing. Drill hole logging shows that the ore hosting Vilminko formation rocks are reflective and can be identified on seismic sections. Offset limited stacks indicated that imaging of several shallow features is dependent upon the source to receiver offset and cross-profile distance of a reflection point from the acquisition line. Not only lithological contacts, but fracturing proved to be an important source of reflections in Vihanti. Results suggested that an extensive fracture zone could be distinguished from the lithological contacts by its associated low stacking velocity. The fracture zone was also characterized by low frequency reflections; its signature disappeared at the higher frequencies. Interpretation of the seismic data suggests that reverse faults have dislocated the lithological

6
contacts. A diffractor prominent using a 15° cross dip processing value at 1.5 km depth might originate from a massive sulfide ore body and suggests that
remobilization of the ore minerals occurred in this compressional tectonic setting.
2. Raahe-Ladoga belt
Numerous massive sulfide deposits and prospects are hosted in the Raahe-Ladoga belt in central Finland. The Raahe-Ladoga belt is a major NW-SE striking structure separating Archean rocks to the north and younger Paleoproterozoic island arc complexes to the south. Crustal thickening, nappe-style deformation and emplacement of tonalities and granodiorites (1.89–88 Ga) resulted from the collision of the Proterozoic island arc complexes with the Archean craton (Roberts et al., 2003b). Defined in geophysical terms, the belt is 40 to 150 km wide and at least 400 km long and best characterized by a strong gravity low due to the crustal structure (Hattula and Rekola, 1997). The metallogenic map of the area (Figure 1) shows the high exploration potential of the belt including the Vihanti-Pyhäsalmi and Outokumpu base metal mining districts discussed in this thesis.
Several mines have been in operation in the Raahe-Ladoga zone, including the historical Vihanti and Outokumpu mines and the currently active Pyhäsalmi mine. All known significant VMS deposits in the Fennoscandian shield are associated with Paleoproterozoic volcanic arcs with slightly differing ages (Weihed et al., 2005). Outokumpu (1.97 Ga) was the
earliest volcanic arc emplaced onto the Karelian craton between 1.94 and 1.89 Ga. Using a strict classification, the Outokumpu Cu-Zn-Co deposits are not VMS ores, but mineralization has polygenetic origin (Peltonen et al., 2008). Mineralization in the Outokumpu area is spatially associated with mantle derived serpentinite. Zhang et al. (2006) suggested that the metal enrichment and remobilization of the ore occurred during the ca. 1.9-1.8 Ga Svecofennian orogeny. The collision of the Proterozoic Outokumpu assemblage with an Archean continental crust transposed ore bodies into isoclinal folds within thrusts and imbricate fold sequences. In Outokumpu, mechanical remobilization and fluid-rock interaction resulted in the formation of high-grade ore (Peltonen et al., 2008; Zhang et al., 2006).
In the Vihanti-Pyhäsalmi district massive sulfides are hosted by a highly deformed and metamorphosed (amphibolites to granulite facies) bimodal volcanic rocks. Deposits typically display a close spatial association with regionally extensive felsic subvolcanic intrusions (Roberts et al., 2004). Alteration enveloping these deposits contains cordierite, orthoamphibolite, and garnet bearing rocks which are metamorphosed

7
equivalents of sea-floor related alteration assemblages. Dominant ore minerals in the Pyhäsalmi-Vihanti deposits are pyrite, pyrrhotite, sphalerite and chalcopyrite and they occur as massive, brecciated and disseminated (Roberts et al., 2003b). The Pyhäsalmi volcanic arc was formed between 1.93
and 1.92 Ga during rifting of a Paleoproterozoic oceanic island arc. Zn-Cu rich massive sulfide deposits often occur at the transition from the mafic to felsic volcanic rocks or are hosted by the felsic pyroclastic rocks. Vihanti is geologically similar to Pyhäsalmi, but volcanic rocks are slightly younger. In
Figure 1. Metallogenic map of the Raahe-Ladoga belt. Several mines have been in operation in the Pyhäsalmi-Vihanti and Outokumpu districts, and theseareas still have high potential for new base metal discoveries. Figure modified from the Metallogeni Map of the Fennoscandian Shield (Eilu et al., 2011).
8
Vihanti, the Cu-Zn-Pb ore is hosted by the Vilminko formation composed of volcanic rocks, calc-silicate rocks and cordierite-sillimanite gneisses.
Delineation of high-silica rhyolites in the Vihanti-Pyhäsalmi district is a powerful exploration tool for identifying favorable volcanic sequences for mineralization (Roberts et al., 2004). The Vihanti and Pyhäsalmi areas are both characterized by the multiphase deformation that
included folding, faulting and shearing. This also resulted in ore horizons that are folded, tectonically thickened and disjoined from their feeder systems. Also stratigraphic relationships between ore, altered host rocks and unaltered protoliths have been obscured by the polyphase deformation history and superposition of regional and contact metamorphic events (Ekhdal, 1993; Roberts et al., 2003b).
3. Seismic reflection data acquisition and processing
Data acquisition
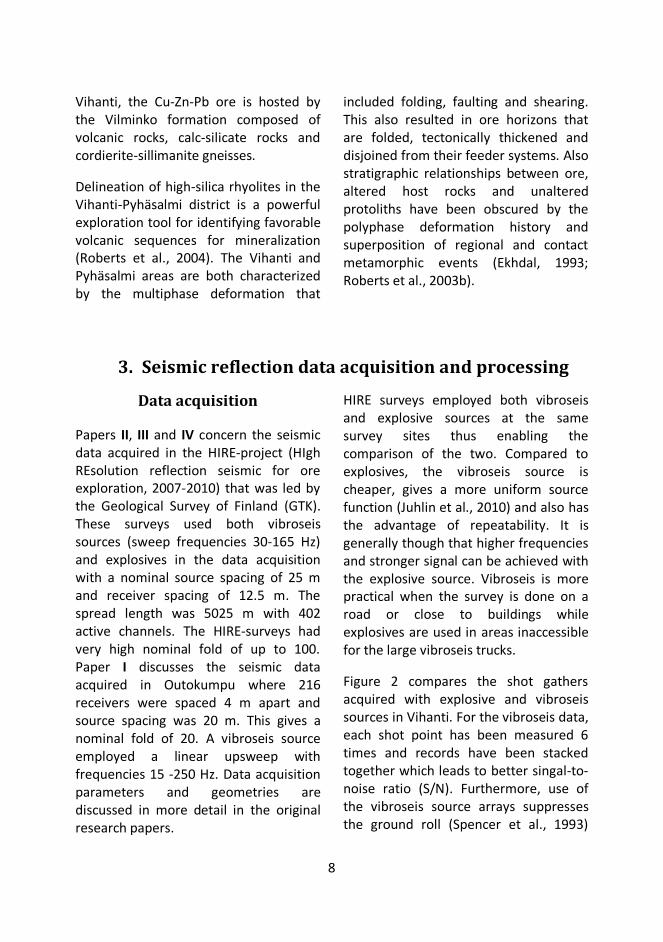
Papers II, III and IV concern the seismic data acquired in the HIRE-project (HIgh REsolution reflection seismic for ore exploration, 2007-2010) that was led by the Geological Survey of Finland (GTK). These surveys used both vibroseis sources (sweep frequencies 30-165 Hz) and explosives in the data acquisition with a nominal source spacing of 25 m and receiver spacing of 12.5 m. The spread length was 5025 m with 402 active channels. The HIRE-surveys had very high nominal fold of up to 100. Paper I discusses the seismic data acquired in Outokumpu where 216 receivers were spaced 4 m apart and source spacing was 20 m. This gives a nominal fold of 20. A vibroseis source employed a linear upsweep with frequencies 15 -250 Hz. Data acquisition parameters and geometries are discussed in more detail in the original research papers.
HIRE surveys employed both vibroseis and explosive sources at the same survey sites thus enabling the comparison of the two. Compared to explosives, the vibroseis source is cheaper, gives a more uniform source function (Juhlin et al., 2010) and also has the advantage of repeatability. It is generally though that higher frequencies and stronger signal can be achieved with the explosive source. Vibroseis is more practical when the survey is done on a road or close to buildings while explosives are used in areas inaccessible for the large vibroseis trucks.
Figure 2 compares the shot gathers acquired with explosive and vibroseis sources in Vihanti. For the vibroseis data, each shot point has been measured 6 times and records have been stacked together which leads to better singal-to-noise ratio (S/N). Furthermore, use of the vibroseis source arrays suppresses the ground roll (Spencer et al., 1993)

9
that dominates the low frequencies of the shot gather acquired with the explosive source. In the HIRE surveys, three vibroseis trucks were used in constructing the 25 m source array.
Figure 2 also demonstrates that the explosive source data does not have higher frequencies better represented than the vibroseis source data, but actually frequencies of 50-125 Hz are
more prominent in the vibroseis record. More reflections can be recognized in the unprocessed vibroseis data than in the data collected with the explosive source.
Resolution of the seismic survey is mainly influenced by the data acquisition parameters and surface conditions at the study site. The highest preserved frequency (fmax [Hz]) defines the
Figure 2. Comparison of a shot gather acquired with explosive (E1) and vibroseis (V3) sources from Vihanti. Each vibroseis shot point had 3 measurements that were stacked together resulting in the improved S/N.

10
Figure 3. Synthetic seismogram calculated for a contact with felsic volcanic rock (V=5950 m/s, ⍴=2750 kg/m3) and massive sulfide (V=7000 m/s, ⍴=4100 kg/m3). An Ormsby wavelet (30-50-120-150 Hz) was used for convolution. In the right panel, the thickness of the sulfide layer is 2.5 m.
minimum seismic wavelength (λ [m]). In the reflection seismic surveys, a minimum layer thickness tmin that can be resolved is
where [m/s] is the average bulk seismic velocity. In the HIRE-surveys, the maximum vibroseis frequency used was 165 Hz resulting in 9 m vertical resolution when the average velocity is 6000 m/s. For the high resolution Outokumpu seismic survey maximum vertical resolution is 6 m. Thinner layers can also be detected, but their thickness cannot be resolved. According to Widess (1973), the amplitude A resulting from a thin layer is approximately
where A0 is the amplitude of a reflection in the case of a single contact, b is the thickness of the bed and λb is the predominant wavelength in the bed. Figure 3 3 illustrates the amplitude decay and change of the signal shape in the case of a thin layer (2.5 m) compared to a single contact. Unlike in the sedimentary strata, in crystalline rock layered subsurface rarely exists, but rule of minimum resolvable layer thickness can be used in a local sense to estimate the possible origin of the reflections. The attenuation of the seismic waves is frequency dependent and low frequencies penetrate to greater depths. High frequencies are also more vulnerable to unfavorable near surface conditions at the source or receiver, such as unconsolidated glacial till typical for Outokumpu or swamps in the Vihanti and Pyhäsalmi areas.
Horizontal resolution of a seismic survey depends on the detection depths while vertical resolution is solely sensible to the frequency content of the signal (e.g. Kadillak et al., 1991; Praeg, 2003). The reflection point defined by the ray theory is surrounded by an area called a Fresnel zone on which constructive reflections accumulate (e.g. Lindsey, 1989). Width of the first Fresnel zone (F, [m]) can be defined as
where d [m] is the observation depth. The concept of the Fresnel zone is
11
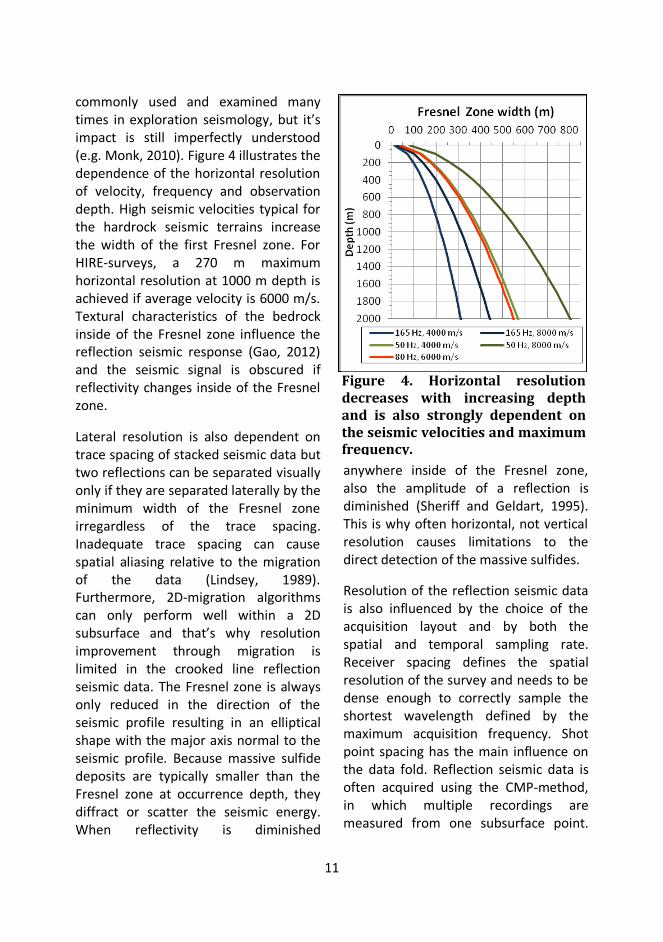
commonly used and examined many times in exploration seismology, but it’s impact is still imperfectly understood (e.g. Monk, 2010). Figure 4 illustrates the dependence of the horizontal resolution of velocity, frequency and observation depth. High seismic velocities typical for the hardrock seismic terrains increase the width of the first Fresnel zone. For HIRE-surveys, a 270 m maximum horizontal resolution at 1000 m depth is achieved if average velocity is 6000 m/s. Textural characteristics of the bedrock inside of the Fresnel zone influence the reflection seismic response (Gao, 2012) and the seismic signal is obscured if reflectivity changes inside of the Fresnel zone.
Lateral resolution is also dependent on trace spacing of stacked seismic data but two reflections can be separated visually only if they are separated laterally by the minimum width of the Fresnel zone irregardless of the trace spacing. Inadequate trace spacing can cause spatial aliasing relative to the migration of the data (Lindsey, 1989). Furthermore, 2D-migration algorithms can only perform well within a 2D subsurface and that’s why resolution improvement through migration is limited in the crooked line reflection seismic data. The Fresnel zone is always only reduced in the direction of the seismic profile resulting in an elliptical shape with the major axis normal to the seismic profile. Because massive sulfide deposits are typically smaller than the Fresnel zone at occurrence depth, they diffract or scatter the seismic energy. When reflectivity is diminished
anywhere inside of the Fresnel zone, also the amplitude of a reflection is diminished (Sheriff and Geldart, 1995). This is why often horizontal, not vertical resolution causes limitations to the direct detection of the massive sulfides.
Resolution of the reflection seismic data is also influenced by the choice of the acquisition layout and by both the spatial and temporal sampling rate. Receiver spacing defines the spatial resolution of the survey and needs to be dense enough to correctly sample the shortest wavelength defined by the maximum acquisition frequency. Shot point spacing has the main influence on the data fold. Reflection seismic data is often acquired using the CMP-method, in which multiple recordings are measured from one subsurface point.
Figure 4. Horizontal resolution decreases with increasing depth and is also strongly dependent on the seismic velocities and maximum frequency.

12
Many recordings from one point improve the S/N after stacking, which is crucial in the hardrock terrains where reflections are typically weak.
Seismic processing
The goal of the seismic data processing is to render an image of the subsurface from the recorded wave field that represents the true structural configuration of reflectors as accurately as possible (Eaton and Wu, 1996). This requires S/N enhancement, correction of the travel times to correspond the zero-offset reflection (NMO-correction) and stacking the reflections collected from the same computational point, and finally migrating reflections to their real subsurface position. Papers I and IV show that good quality seismic images can be achieved with relatively standard processing flow, commonly used in the hardrock reflection seismic studies (e.g. Dehghannejad et al., 2010 and 2012; Juhlin and Palm, 2003; Koivisto et al., 2012; Roberts et al., 2003a). Surface waves and dispersive S-waves are severe noise sources in the shot gathers, but do not often stack coherently after deconvolution. In many studies S-waves are removed with f-k filtering (e.g. Juhlin, 1995, Milkereit and Eaton, 1998). F-k filtering was not used in the reprocessing of the data presented in this thesis because it was noted to easily cause artifacts to the seismic images.
In this thesis, the most important processing steps proved to be static corrections and velocity analysis, which are also the most time consuming and laborious processing steps needing a substantial amount of manual work. Even if the elevation differences along the seismic profile are small, a good static solution is crucial. The local variations near the geophone stations can cause considerable time delays because of changes in the thickness and acoustic properties in the overburden (e.g. Juhlin, 1995; Bergman et al., 2002). The desire to preserve the high frequency reflections in the data further emphasizes the importance of the static solution (Spencer et al., 1993). Malehmir and Juhlin (2010) demonstrated the importance of the residual static corrections for preservation of the short steeply dipping reflections and diffractions that might indicate mineral deposits.
The importance of careful velocity analysis for functional NMO-corrections is stressed in paper IV where a Vihanti reflection seismic profile was reprocessed but also in other studies (e.g. Dehghannejad et al., 2012; Juhlin et al., 2010). The path of a reflected wave from dipping and flat surfaces are compared in the Figure 5. Travel time of the seismic signal observed in a shot gather is dependent on the reflector dip according to the equation

13
where tx [s] is the arrival time of the signal at offset x [m], V1 is the velocity of the rock, h [m] is the distance from the source to the reflector and α is the dip angle of the reflector. Velocity analysis aims to define the NMO velocity that moves the reflections imaged with different offsets to correspond to the zero offset response. NMO-corrections are defined by the equation
.
Figure 5 illustrates the effect of the NMO velocity to the dipping reflector. For a horizontal reflector the true seismic velocity in the rock moves the signals to the straight line (6b, solid black line) while a dipping reflector aligns poorly. For the dipping reflector, a NMO-velocity of
stacks the data appropriately. Subhorizontal seismic events stack with realistic NMO-velocities while steeply dipping events are flattened with high NMO-velocities which are not the same as the velocity in the formation (Levin, 1971).
DMO (Dip Move-Out) corrections are often used in the areas where structures have conflicting dips (e.g. Bergman et al., 2002; Calvert and Li, 1999). Reprocessing of the Vihanti seismic reflection data (IV) indicated that currently available DMO algorithms struggle with hardrock seismic data, which has also been observed for example by Dehghannejad et al. (2012) and Juhlin et al. (2010). The
Figure 5. Illustration of the path of a reflected wave from a dipping (solid red line) and horizontal surfaces (dashed violet lines).
Figure 6. a) A CMP gather imaging a flat reflector (solid line) and reflector dipping with 60° (dashed line) at 1000 m depth. b) NMO correction with the real velocity in the formation (6000 m/s). c) NMO velocity of 12000 m/s.

14
main reason for failure of the DMO corrections is the irregular offset distribution caused by a crooked acquisition line and irregular shot spacing. DMO is also challenged because of the out-of-plane reflections common in 2D profiles acquired over lithological units that vary in shape and extent in 3D. Better results can be achieved when unrealistically high NMO velocities are used to stack the data where steep dips are the main interest (Figure 6). Juhlin et al. (2010) merged together subhorizontal and steeply dipping stacks, with certain weighting that gives the best visual compromise. With modern 3D-visualization and modeling software differently processed stacks can also be easily compared without visual compromises. Existence of several versions of the seismic images from the same profile does not complicate the interpretation notably.
When seismic data acquisition is done using a crooked line geometry, theoretical reflection points do not focus underneath the acquisition line, but spread over an area proportional to the line crookedness. Hardrock geology is typically variable in 3-dimensions which results in recording of reflections from
several points of the same structure in the cross line direction in one seismic profile. This phenomenon is well illustrated in paper IV, where different offset limited stacks are compared. Long offset data image a different structure than short offset data which needs to be considered in the data interpretation. Cross-dip analysis can be used to study the dip of a structure perpendicular to the seismic profile (IV; Malehmir et al., 2009), but this procedure does not work for more complex geological structures, such as folds that have opposing limbs at the different sides of the seismic profile for example.
In the data processing presented in this thesis, the migration procedure was kept as simple as possible. Detailed velocity distribution of the subsurface in Vihanti and Pyhäsalmi is poorly known and complex due to the geology. It is clear that 2D-migration does not function optimally when geology is strongly variable in 3D (Spencer et al., 1993). Constant velocity migration with the Stolt algorithm proved to provide robust results and relatively good correlation with deep drill hole lithologies in Pyhäsalmi and Vihanti (II and IV).
4. Seismic interpretation
Physical rock properties
Physical rock properties form the basis for interpretation of the seismic reflection data. For example, Milkereit
and Eaton (1998) stress that any reliable seismic mineral exploration program must utilize and integrate borehole geophysical data. Seismic reflections
15
occur when the acoustic impedance ((Z [kg/m2s]) changes abruptly; the greater the difference, the stronger the reflection. These changes can be attributed to the change in lithology, deformation style or fracturing. Acoustic impedance is a product of density (ρ [kg/m3]) and seismic velocity (v [m/s]). For the vertical incidence P-wave, the reflection coefficient (RC [kg/m2s]) is expressed
where Z1 and Z2 are the acoustic impedances of the adjacent lithologies. When seismic waves face a layer with smaller acoustic impedance compared to the upper layer, the reflection coefficient is negative which means that the seismic wave changes polarity. Thus, in theory low acoustic impedance layers could be recognized in the seismic images as polarity changes, but in the real data these interpretations have been difficult in sedimentary basins (Verm and Hilterman, 1995) and in the hardrock environment such analyses are further complicated due to the complex reflectivity patterns.
Density and seismic velocity in the rock can be measured from the samples in the laboratory or in situ using geophysical drill hole logging. In papers I, II and IV full waveform sonic and gamma-gamma density logging were used to derive the petrophysical parameters. Seismic data acquisition was done with single component geophones that register P-waves and thus S-wave
impedances are not considered. Many density and velocity changes are local small scale features not large enough to cause reflection detectable with the surface seismic profiling. On the other hand, variations in velocity and density in drill hole logs might not have a clear geological explanation that is observed in core logs, but these features can have a strong seismic response (Calvert and Li, 1999). Drill hole logging enable the calculation of reflection coefficient series and its convolution with the hypothetical source signal; that is calculating the relevant synthetic seismograms. Comparisons of the synthetic seismograms to reflection seismic profiles, which is done in papers I, II and III, make an implicit assumption that the lateral continuation of lithological contacts exceeds the width of the first Fresnel zone. This assumption might not be valid in areas with a large variation in geology in 3D, such as Pyhäsalmi and Vihanti. However, comparison of synthetic seismograms to the reflectivity in the seismic profiles provides information about continuity of some geological features. Synthetic seismograms also help to estimate the influence of the acquisition frequency band to the observed seismic signature (III). Some features prominent at high frequencies can be unrecognizable at low frequencies. Signal tuning or interference of the reflected signal also influence the recorded amplitude of the seismic signal. The amplitude of the first reflection can be increased or decreased based on the travel time delay of the reflection originating from the second reflective contact (e.g. Gochioco, 1992).

16
Drill hole logging results from Vihanti, Pyhäsalmi and Outokumpu show that in these areas the ore hosting rock formations have distinct reflective characteristics compared to the other typical lithologies. In Pyhäsalmi, mineralization occurs in the contact zone between the felsic and mafic volcanic sequences. Difference in the average acoustic impedances of the unaltered mafic and felsic volcanic rocks is large enough to make the contact reflective (II). Sulfide mineralization has higher acoustic impedance than the mafic volcanic rocks, and thus sulfide deposits might be located where reflectivity of the mapped felsic-to-mafic contact is further enhanced. In paper II, such an enhancement of reflectivity is correlated with a sub-economic zinc mineralization.
The Pyhäsalmi drill hole logging shows that the hydrothermal alteration of mafic volcanic rocks to garnet-cordierite gneiss causes decrease of the acoustic impedance. Altered volcanic rocks are generally reflective only when in contact with the unaltered mafic volcanic rocks despite of the composition of the unaltered protolith (II). Sonic and density logging done in the short drill hole inside of the massive sulfide ore body at Pyhäsalmi reveal that ore also is internally reflective. Variation of the acoustic impedance is large enough to cause reflections with RC ~0.06. Internal reflectivity complicates the direct detection of the Pyhäsalmi type massive sulfides.
In Outokumpu, massive sulfides are hosted in the ophiolite assemblage that
includes skarn rocks, serpentinite and quartz rocks. Host rocks are typically enveloped with black schist layers. Paper I shows that skarn rocks have very high acoustic impedance and serpentinite has low. This contrast causes the Outokumpu assemblage to be internally strongly reflective and thus makes it a good target for seismic reflection profiling. Similarly to Pyhäsalmi, enhancement of reflection amplitudes inside of the interpreted Outokumpu-assemblage rocks might be caused by sulfide mineralization (III).
Generally changes in seismic wave velocity and density correlate positively. High density indicates high seismic velocity and thus high acoustic impedance. In paper I, peculiar behavior of the physical properties of pegmatic granites was observed in the Outokumpu deep drill hole. Compared to the main lithologies in the area (mica schist and biotite gneiss), the density increased in the presence of pegmatic granite while the velocity decreased. The density contrast between mica schist and biotite gneiss indicates high RC, but velocity decrease evens out the acoustic impedance contrast. This example emphasizes the importance of the in situ measurements of rock properties.
In Vihanti, the ore hosting Vilminko formation consists of volcanic rocks, calc-silicate rocks and cordierite-sillimanite gneisses. Drill hole logging presented in paper IV shows that calc-silicate rocks have higher acoustic impedances than other rocks in the area, making contacts of the ore-hosting rock

17
sequences reflective. Vihanti drill hole density logging data also indicate some interesting results regarding rock properties of the fractured granites. Generally fracture zones are considered to have lower seismic velocity and density than the intact rock (Juhlin, 1995). Density logging shows decreased values at the location of some individual fractures, but extensive fracturing reported in the geological drill core logs does not cause notable changes to bulk density. The seismic profile shows prominent reflections correlating with the reported fracture zones indicating that fracturing has more substantial influence on the bulk seismic velocity than on density. Even though fracturing is extensive, the volume of the fractures is negligible and no significant change in the density occur. However, fractures substantially weaken the rock causing seismic velocities to decrease. Perron and Calvert (1998) report a decrease in the P-wave velocity at the location of a fault zone where no major density changes occur. Juhlin et al. (2010) and Spencer et al. (1993) suggest that fault gouge and a thicker disturbed zone around the fault gives rise to the seismic reflections. Results of paper IV suggests that low local stacking velocities could be used as indicators of a fracture zone that is of no interest for mineral exploration. Accordingly paper I reports that a water bearing subhorizontal fracture zone caused prominent reflections at the approximate depth of ~1000 m in Outokumpu.
Geometry of the target
Knowledge of typical acoustic impedances is important when making geological interpretations from reflection seismic data but equally important are geometrical considerations. Besides the size of the target, the orientation of the contact influences the seismic detection. Relatively simple geological structures, such as recumbent folds, result in complex reflectivity, especially when the seismic profile and the strike of geological units are oblique. Data acquisition is often done using existing roads, which are seldom designed to be perpendicular to the strike of the geological structures. The smaller the angle between the seismic acquisition line and the strike of the geological units, the more horizontal a contact will appear on the seismic image. Any 2D seismic data, and especially data acquired with a crooked line, suffer from the out-of-plane reflections that add uncertainty to the interpretation as interpreted features might not lie directly underneath the profile (e.g. Calvert and Li, 1999). If crossing seismic profiles image the same geological contact, true dip of the structure can be calculated which is also the case when the reflection can be correlated with geological features at the surface or in drill holes. Crossing lines also enable the estimation of the true subsurface position of a reflector.
Typical size and composition of the massive sulfide deposits enable their detection with the seismic reflection

18
method in theory. However, the Pyhäsalmi massive sulfide ore body could not be confidently recognized from the seismic reflection profiles even if the size of it exceeds the theoretical detection limits (II). Forward modeling studies show that massive sulfide ore bodies are indeed detected when the background geology is close to homogeneous (e.g. Bohlen et al., 2003; Eaton, 1999; Hobbs, 2003). Clarke and Eaton (2003) conclude that the shape of an ore body plays a significant role in the directivity of backscattered waves. Local radius of the surface curvature and surface roughness influence the detected seismic signal. L’Heureux et al. (2009) conclude that the detection of a massive sulfide target is dependent on the scattering nature of the background geology. When geology is complex, scattering of the seismic energy typically dilutes the seismic images. The Pyhäsalmi massive sulfide deposit has an irregular shape and it is located in the highly heterogeneous background geology. The ratio of the seismic wavelength to the heterogeneity scale length has important influence on the seismic detection and relatively large geological bodies with high acoustic impedance can be masked behind the scattered seismic waves. Even weak scattering environments can mask seismic signals from economically feasible massive sulfide deposits (Cheraghi et al., 2013). Calvert and Li (1999) report that the top of the Bell Allard deposit, Québec, was identified from 2D reflection seismic data, but that key reflection did not differ from the other reflections in the area while
Malehmir et al. (2009) suggest that the diffractor package in the Kristineberg mining area results from a series of massive sulfide deposits. Additionally to the complex geology, noise caused by the active mine and crooked acquisition lines hamper seismic detection of the Pyhäsalmi massive sulfide deposit (II).
In hydrocarbon exploration, seismic attributes such as instantaneous frequency, weighted average frequency and apparent polarity, and amplitude-versus-offset (AVO) analysis are commonly used, but have not been popular in interpretation of the hardrock seismic data (Harrison and Urosevic, 2012). Most robust of the seismic attributes are envelope plots that emphasis the brightest reflections. The bright spot technique is generally applied in hydrocarbon exploration, where large seismic amplitudes are often associated with gas-saturated sands (e.g. Verm and HIlterman, 1995). In the hardrock environment, bright spots can originate from massive sulfide occurrences as was discussed in paper III for the HIRE data from Outokumpu. Just like in the case of gas reservoirs, not all large amplitudes originate from sulfides and unfortunately neither do all sulfide deposits cause large amplitude reflections. The display of the data is an inherent part of the seismic interpretation (e.g. Taner et al., 1979) and the testing of different color scales for the data visualization should not be disdained. Colors might help the interpreter to see the interrelationship and spatial changes in the data which are not obvious in the traditional wiggle
19
plots of the seismic profiles. In the case of envelope plots, a smooth rainbow color scale changing from blue to red was found effective for spotting the high energy reflections (III).
Based on the surface geological observations in the Pyhäsalmi, at shallow depths rock contacts are subvertical. This complicates the correlation of the known geology from the drill holes with the seismic profiles (II). Furthermore, drill holes are not vertical or even straight, but have deviated paths. Reflection seismic data acquired from the Earth’s surface lack the ability to directly image vertical rock contacts and generally the method is considered to be best suited for subhorizontal structures. Zaleski et al. (1997) report near vertical dikes causing reflections of refracted seismic waves resulting in subhorizontal linear events in the seismic images. When geology is poorly known a priori these kinds of effects are almost impossible to interpret from the seismic reflection profiles. Even though the rock contacts could not be imaged directly, the change in the reflectivity characteristics were used in paper II for indirect geological interpretations. Upright tight folds are characteristic for the Pyhäsalmi region and hinges of the folds cause clear reflections while rock contacts in the steep limbs cause changes in the reflectivity pattern instead of continuous reflections. White et al. (2000) note that missing reflection from a fold limb is easily misinterpreted as a fault. Thus integrating seismic interpretations with the pre-existing knowledge of the structural style is
essential for successful interpretation. In contrast to the tight folds in Pyhäsalmi (II), gentle open folds are typical for the Vihanti area and are interpreted to cause the undulating reflectivity observed in the area (IV).
Reverse faults play an important role in the deformation history of Outokumpu. In the seismic section a major fault is characterized by a ~500 m wide non-reflective zone that displaces strongly reflective geological units (III). Spencer et al. (1993) observed strong reflectivity of faults that they attributed to substantial movement during deformation, while Drummond et al. (1998) observed high reflectivity of faults in a close spatial association with mineralization where the migration of hot fluids along the fault have caused alteration. In New Brunswick, faults are observed in seismic data because they juxtapose highly and weakly reflective domains (Malehmir and Bellefleur, 2010). These differences in observations of reflectivity of faults can be attributed to dikes that have intruded the fault plane, variation of geology at opposite sides of fault and also to the intensity of faulting. Faulting is the most obvious reason for discontinuous reflections (e.g. Calvert and Li, 1999) and paper IV illustrates how steep reverse faults cut Vihanti volcanic rocks. Faults themselves are not strongly reflective in this case, but merely make reflective lithologies discontinuous. Reverse faults have also been identified from the reflection seismic data in Pyhäsalmi (Figure 7).

20
From 2D-interpretation to 3D-model
Understanding that structures in the bedrock do not form random configurations is a prerequisite to any geological 3D modeling (Tirén et al., 1999). A network of seismic profiles is an order of magnitude cheaper than a 3D seismic survey, but still enables mapping of reflectors instead of merely identifying them (Li and Eaton, 2005). Seismic reflection data pinpoints the subsurface location of the contrasting acoustic impedances, but do not implicitly indicate the geological nature of these contacts. 3D interpretation of the seismic data is further constrained by the surface geology, geophysical and geological drill hole logging and other available data. By combining other data and geological understanding of the structural style, the gaps between the seismic reflection profiles can be filled. Integrated 3D models allow for an easy comparison of the different methods and results, and facilitate the integrated phrasing of an important research
questions across different scales of the data (Goleby et al., 2006). A 3D geological model can be considered as a working hypothesis of the subsurface structures that is improved when new information is available and interpretations are developed. The 3D environment also facilitates understanding of the scale of different data and enables the interpretation of several seismic profiles simultaneously. Sometimes migration moves the reflections crossing one another in two NMO-stacked sections apart from each other (e.g. Juhlin, 1995). When data interpretation is done in 3D, the true location of the reflective feature is more easily recognized.
In paper II, correlation of the Pyhäsalmi lithologies from drill holes with the seismic data shows that the major reflections at below 1000 m depth originate from the contact of the felsic and mafic volcanic rocks and can be followed over several kilometers in the area, even underneath the previously unexplored granites. 3D-modeling of the
Figure 7. 3D view of the modeled contact between felsic and mafic volcanic rocks (green), a reverse fault (blue) and Pyhäsalmi ore (red) from north and south, respectively. A magnetic map is plotted on top of the seismic profiles.

21
interpreted contact (Figure 7) enables the correlation of the seismic interpretation with the lithological units from drill core not in close vicinity of the profile. Unlike in Pyhäsalmi, mapping of volcanic stratigraphy was not possible in the Ansil mining camp located in the Archean Abitibi greenstone belt, Canada (Perron and Calvert, 1998). Volcanic eruptions may result in sharp boundaries between the lavas or clastic units with different compositions as is the case in Pyhäsalmi or successive eruptions may vary in the composition gradually causing only gradational changes in the acoustic impedance resulting in the lack of prominent reflections. According to the geological model based on the seismic reflectivity, granites separating the Pyhäsalmi volcanic rocks from the slightly younger Mullikkoräme formation are wide but shallow. Seismic data show a reverse fault located in the granite that has influenced the relative crustal position of these two volcanic formations. A reverse fault with similar orientation is identified east of the Pyhäsalmi mine (Figure 7) and this fault has caused relative uplift of the eastern part of the volcanic stratigraphy. Based on the seismic data, the oblique movement along the fault has been substantial. The combination of seismic interpretation and structural measurements from drill core can be used for defining the direction of the fault movement if kinematic indicators such as mineral lineations can be observed at the location of interpreted fault zones. Reverse faults have a key role for understanding the structural evolution of the Pyhäsalmi area and
similarly to the Buchans Mine, Newfoundland (Spencer et al., 1993) and Flin Flon located on the border of Manitoba and Saskatchewan (Schetselaar, 2013), thrusting has likely resulted in repeated and discontinuous ore stratigraphy at both local and regional scale.
Strength of a reflection from a lithological contact is sometimes related to the way the contact was created (Perron and Calvert, 1998). Intrusions are typically emplaced rapidly along existing fracture or fault zones which results in extensive sheet-like intrusions with sharp boundaries to the surrounding rocks, making intrusive sheets prominent reflectors. It is not always that the geological origin of a reflection can be recognized because of the lack of drill hole data or outcrops. However, recognizing axial fold planes and continuity of deformation style is often as important as the knowledge of the location and continuation of certain lithological units. Zhang et al. (2006) showed that the Outokumpu ore deposits are structurally controlled and identification of interesting exploration targets from reflection seismic profiles can also be done by recognizing favorable structural features at depth. Similarly, the position of the Pyhäsalmi deep ore in a synclinal structure in the close vicinity of the interpreted fault might give hints about what kind of structures should be looked for in future exploration.

22
Guidelines for hardrock seismic exploration
Seismic surveys are neither cheap nor easy or fast and thus careful planning of the required actions taken prior, during and after data acquisition are important. Based on the experiences gained during this PhD work I suggest the procedure presented in Figure 8 for a seismic reflection exploration project.
Prior to the seismic survey, it would be beneficial to establish a rough geological model and perform seismic forward modeling. Information about density and seismic velocity variations is needed in the modeling and can be derived from geophysical drill hole logging. Results of logging also help to interpret potential sources of reflections in the study area and set the realistic goals for the seismic survey. Studies of physical rock properties should cover the ore and the ore hosting stratigraphy, but also other common rock types of the area. A preliminary geological model helps to
define the most important holes for logging. Continuous data from long drill holes is especially valuable because it is easier to correlate with the seismic profiles. Examples from the HIRE seismic surveys, which provide seismic images beyond the 5 km depth, show that quality of the data is not optimal in the first couple of hundred meters depth (II).
Seismic forward modeling will help to define the survey parameters and choose the location of the seismic lines. It is also worth to consider different types of the seismic surveys. If the area of interest is well defined, 3D data acquisition is probably the best solution. A high-resolution 3D-seismic survey offers a large detection radius together with accurate depth estimates (e.g. Milkereit et al., 2000). If more regional scale understanding is demanded, a network of seismic profiles suits the purpose. If the structures of interest are sub-vertical, and deep drill holes are available, downhole seismic imaging (DSI) provide information about the
Figure 8. Suggested work flow for seismic reflection mineral exploration project. Data interpretation at the end of the project is iterative and resulting geological model can to be improved when new information is available.

23
location and continuity of geological structures. Since only seismic 2D-profiles are considered in this thesis, the following discussion concerns seismic profiling, but the same ideas are applicable to the other types of surveys.
Data coverage of the seismic profiles is always poor at the edge of the line which makes data slightly unreliable in the peripheral parts. Long, continuous profiles are thus preferable to many short lines. Because of the better fold in the middle of the profiles, it is also good to design crossings at the central part of the acquisition lines, not at the ends. This also enables 3D-mapping of an observed reflector.
Seismic data processing is time consuming because the optimal processing parameters need to be tested and crucial processing steps such as static corrections and velocity analysis require manual work. Quality of the seismic data can almost always be improved and additional information gained through the reprocessing. In order to save time and effort during reprocessing, it is good to also save intermediate processing steps to the SEG-Y format, readily readable later with any seismic processing or interpretation software. The most important intermediate processing steps to save in SEG-Y files are (1) field data with correct geometries in the trace headers, (2) first break picks saved in trace headers, (3) processed pre-stack data with and without NMO-corrections, (4) velocity field used in NMO-corrections and migration. Additionally to these data,
detailed description of the processing flow and chosen parameters should be available.
In 3D-modeling software, differently processed seismic profiles can be investigated and real data compared to the forward modeling results. When there are discrepancies between the modeled and measured seismic signatures, models needs to be refined or processing of the data revised. Data interpretation and processing are best done interactively so that the features important for the geological interpretation of the area are already sought during the intermediate processing steps and, for example, anomalous stacking velocities are investigated carefully in order to gain information about exploration targets. Preliminary processing results provide the framework that can be used for the first interpretations which are later refined after new knowledge is gained from other methods or through the seismic reprocessing. Based on the geological model, reprocessing can be targeted for areas of special interest.
Reflection amplitude is proportional to the contrast of the acoustic impedance between two materials and seismic data does not directly indicate the origin of the reflection. Interpretation of the geology at depth is first aided by deep penetrating geophysical data and potentially later by deep exploration holes validating or invalidating the geological model. In Thompson nickel belt exploration in Canada, seismic data most suitable to image subhorizontal

24
structures was successfully combined with deep probing electromagnetic methods ideally suited to identify near-vertical structures (White et al., 2000). High density massive sulfides cause not only reflections, but also gravity anomalies and thus gravimetric
measurements are useful to combine with reflection seismic imaging. The framework provided by seismic reflection data can be used to constrain modeling of potential field data (Tavakoli et al., 2012; Malehmir et al, 2006;) which help to define exploration targets.
5. Conclusions
The main conclusions in this thesis are:
1. Seismic reflection profiling combined with 3D geological modeling improves the structural interpretation of mining camps. Furthermore, seismic profiling can be used to map the reflective contacts beyond the existing drill holes.
2. In situ sonic and density logging data from drill holes proved to be crucial for seismic interpretation.Drill hole logging data shows that not only are massive sulfide reflective in typical host rock settings, but also that the ore hosting lithological sequence in the Outokumpu, Vihanti and Pyhäsalmi areas have distinct acoustic properties. This enables subsurface tracing of the ore hosting lithologies using seismic reflection profiles which has led to opening of new exploration ground at depth.
3. Seismic data indicate that granites in Vihanti and Pyhäsalmi are shallow and that the volcanic stratigraphy continues under the granites. Previously exploration has been neglected these areas.
4. Heterogeneous country rock with variable geologic structures in 3-dimensions masks the seismic signal originating from the massive sulfide ore bodies. With 2D profiles, confidently distinguishing the seismic signature of an unknown massive sulfide deposit from other seismic events is not realistic in highly deformed areas, where complex geology causes scattering, diffractions and non-continuous reflections.
5. Reflection seismic profiling proved to be an efficient tool for mapping the ore hosting units in Pyhäsalmi, Vihanti and Outokumpu. Enhanced reflectivity of the ore critical horizon might indicate presence of sulfides.
6. Fracture zones and faults cause decreases in P-wave velocity, but not necessarily decreased density. Low stacking velocity can be useful when identifying wide fracture zones from the seismic profiles.
7. Reprocessing of the data often results in better seismic images and the understanding of structures is improved through the information

25
gained during the different processing steps. Key processing steps for good quality seismic images in the hardrock terrains are static corrections and velocity analysis. Subhorizontal and steeply dipping reflections are best interpreted from the separate NMO-stacks.
8. Reverse faults were recognized in the seismic data in Vihanti, Pyhäsalmi and Outokumpu. Faulting and folding during the Svecofennian orogeny has played a significant role for the current structural position of the ore. Remobilization of the sulfide minerals during the deformation is also probable.
9. Results in this thesis suggest that the seismic reflection method is applicable for hardrock mineral exploration even in complex geological settings typical for the Proterozoic terrains in Finland. The framework provided by reflection seismic data can be used for geological 3D-modeling, which in turn is an important tool in defining the exploration strategy and optimize the expensive deep exploration drilling.

26
References
Bastida, F., Aller, J., Puchkov, V.N., Juhlin, C. and Oslianski, A., 1997. A cross-section through the Zilair Nappe (southern Urals). Tectonophysics, 276, 253-263.
Bergman, B., Juhlin, C. and Palm, H., 2002. High-resolution reflection seismic imaging of the upper crust at Laxemar, southeastern Sweden. Tectonophysics 355, 201-213.
Bohlen, T., Müller, C. and Milkereit, B., 2003. Elastic Seismic-wave Scattering from Massive Sulfide Orebodies: On the Role of Composition and Shape in Eaton, D.W., Milkereit, B. and Salisbury, M.H. (eds.) Hardrock Seismic Exploration. SEG Develop-ments in Geophysics Series, 70-90.
Boszczuk, P., Cheng, L.Z., Hammouche, H., Roy, P., Sylvain, L. and Cheilletz, Al., 2011. A 3D gravity data interpretation of the Matagami mining camp, Abitibi Subprovince, Superior Province, Québec, Canada: Application to VMS deposit exploration. Journal of Applied Geophysics, 75, 77-86.
Brewer, J. A., Brown, L. D., Steiner, D., Oliver, J. E., Kaufman, S., and Denison, R. E., 1981. Proterozoic basin in the southern mid-continent of the United States revealed by COCORP deep seismic reflection profiling. Geology, 9, 569-575.
Brown, D., Zhang, X., Palomeras, I., Simancas, F., Carbonell, R., Juhlin, C., and Salis-bury, M., 2012. Petrophysical analysis of a mid-crustal reflector in the IBERSEIS profile, SW Spain. Tectonophysics, 550-553, 35-46.
Calvert, A.J. and Li, Y., 1999. Seismic reflection imaging over a massive sulfide deposit at the Matagami mining camp, Québec. Geophysics, 64, 24-32.
Cheraghi, S., Malehmir, A., Bellefleur, A., Bongajum, E., and Bastani, M., 2013. Scaling behavior and the effect of heterogeneity on shallow seismic imaging of mineral de-posits: A case study from Brunswick No. 6 mining area, Canada. Journal of Applied Geophysics, 90, 1-18.
Clarke, G.J. and Eaton, D.W., 2003. Influence of Morphology and Surface Roughness on the Seismic Response of Massive Sulfides, Based on Elastic-Wave Kirchhoff Model-ing in Eaton, D.W., Milkereit, B. and Salisbury, M.H. (eds.) Hardrock Seismic Explora-tion. SEG Developments in Geophysics Series, 45-58.
Clowes, R.M., Calvert, A.J., Eaton, D.W., Hajnal, Z., Hall, J., and Ross, G.M., 1996. LITHOPROBE reflection studies of Archean and Proterozoic crust in Canada. Tectonophysics. 264, 65-88.

27
Dehghannejad, M., Juhlin, C., Malehmir, A., Skyttä, P. and Weihed, P., 2010. Reflection seismic imaging of the upper crust in the Kristineberg mining area, northern Sweden. Journal of Applied Geophysics, 71, 125-136.
Dehghannejad, M., Bauer, T.E., Malehmir, A., Juhlin, C. and Weihed, P., 2012. Crustal geometry of the central Skellefte district, Northern Sweden –Contsraints from reflec-tion seismic investigations. Tectonophysics, 524-525, 87-99.
Dentith, M.C., Dent, V.F., and Drummond, B.J., 2000. Deep crustal structure in the southwestern Yilgarn Craton, Western Australia. Tectonophysics, 325, 227-255.
Diakonova, A.G., Ivanov, K.S., Astafiev, P.F., Vishnev, V.S., and Konoplin, A.D., 2007. Resistivity pattern of crust and upper mantle in Southern Urals. Russian Geology and Geophysics, 48, 844-850.
Drummond, B.J., Goleby, B.R., Goncharov, A.G., Wyborn, L.A.I., Collins, C.D.N. and MacCready, T., 1998. Crustal-scale structures in the Proterozoic Mount Isa Inlier of north Australia: their seismic response and influence on mineralization. Tectonophysics, 288, 43-56.
Drummond, B., Lyons, P., Goleby, B., and Jones, L., 2006. Constraining models of the tectonic setting of the giant Olympic Dam iron oxide-copper-gold deposit, South Aus-tralia, using deep seismic reflection data. Tectonophysics, 420, 91-103.
Eaton, D.W., 1999. Weak elastic-wave scattering from massive sulfide orebodies. Ge-ophysics, 64, 289-299.
Eaton, D.W., Milkereit, B., and Salisbury, M., 2003. Seismic methods for deep mineral exploration: Mature technologies adapted to new targets. The leading edge, 580-585.
Eaton, D.W.S. and Wu, J., 1996. Relative-amplitude preserving processing for crustal seismic reflection data: an example from western Canada. Tectonophysics, 264, 357-370.
Eilu, P., Bergman, T., Bjerkgård, T.,Feoktistov, V., Hallberg, A., Korsakova, M., Krasotkin, S., Muradymov, G., Nurmi, P. A., Often, M., Perdahl, J-A., 5Philippov, N.,Sandstad, J.S., Stromov, V. and Tontti, M., 2011. Metallogenic Map of the Fennoscandian Shield, 1:2 000 000. Geological Survey of Finland, Geological Survey of Norway, Geological Survey of Sweden, The Federal Agency of Use of Mineral Re-sources of the Ministry of Natural Resources and Ecology of the Russian Federation.
28
Ekhdal, E., 1993. Early Proterozoic Karelian and Svecofennian Formations and the Evolution of the Raahe-Ladoga Ore Zone, based on the Pielavesi area, central Finland. Geological Survey of Finland Bulletin, 373, 137 p.
Galley, A.G., Hannington, M.D., and Jonasson, I.R., 2007. Volcanogenic massive sul-phide deposits, in Goodfellow, W.D., ed., Mineral Deposits of Canada: A Synthesis of Major Deposit-Types, District Metallogeny, the Evolution of Geological Provinces, and Exploration Methods: Geological Association ofCanada, Mineral Deposits Division, Special Publication No. 5, 141-161
Gao, D., 2012. Implications of the Fresnel-zone texture for seismic amplitude interpre-tation. Geophysics, 77, O35-O44.
Goleby, B.R., Blewett, R.S., Korsch, R.J., Champion, D.C., Cassidy, K.F., Jones, L.E.A., Groenewalkd, P.B. and Henson, P., 2004. Deep seismic reflection profiling in the Archean northeastern Yilgarn Craton, Western Australia: implications for crustal archi-tecture and mineral potential. Tectonophysics, 388, 119-133.
Goleby, B.R., Blewett, R.S., Fomin, T., Fishwick, S., Reading, A.M., Henson, P.A., Ken-nett, B.L.N., Champion, D.C., Jones, L., Drummond, B.J., and Nicoll, M., 2006. An inte-grated multi-scale 3D seismic model of the Archean Yilgarn Craton, Australia. Tectonophysics, 420, 75-90.
Goleby, B.R., Huston, D., Lyons, P., Vandenberg, L., Bagas, L., Davies, B.M., Jones, L.E.A., Gebre-Mariam, M., Johnson, W., Smith, T. and English, L., 2009. The Tanami deep seismic experiment: An insight into gold mineralization and Paleoproterozoic collision in the North Australian Craton. Tectonophysics, 472, 169-182.
Gochioco, L.M., 1992. Modeling study of interference reflections in thin-layered me-dia bounded by coal seams. Geophysics, 57, 1209-1216.
Hammer, P.T.C., and Clowes, R.M., 1997. Moho reflectivity patterns –a comparison of Canadian LITHOPROBE transects. Tectonophysics, 269, 179-198.
Harrison, C.B., and Urosevic, M., 2012. Seismic processing, inversion and AVO for gold exploration –Case study from Western Australia. Geophysics, 77, WC235-WC243.
Hattula, A., and Rekola, T., 1997. The power and role of geophysics applied to regional and site-specific mineral exploration and mine grade control in Outokumpu Base Metals Oy in Gubins, A.G. (ed.). Proceedings of Exploration 97: Fourth Decennial In-ternational Conference on Mineral Exploration, 617-630.

29
Hobbs, R.W., 2003. 3D Modeling of Seismic-Wave Propagation Using Complex Elastic Screens, with Application to Mineral Exploration in Eaton, D.W., Milkereit, B. and Salisbury, M.H. (eds.) Hardrock Seismic Exploration. SEG Developments in Geophysics Series, 59-69.
Juhlin, C., 1995. Imaging of fracture zones in the Finnsjön area, central Sweden, using the seismic reflection method. Geophysics 60, 66-75.
Juhlin, C., Dehghannejad, M., Lund, B., Malehmir, A. and Pratt, G., 2010. Reflection seismic imaging of the end-glacial Pärvie Fault system, northern Sweden. Journal of Applied Geophysics, 70, 307-316.
Juhlin, C. and Palm, H., 2003. Experiences from Shallow Reflection Seismics over Gra-nitic Rocks in Sweden in Eaton, D.W., Milkereit, B. and Salisbury, M.H. (eds.) Hardrock Seismic Exploration. SEG Developments in Geophysics Series, 93-109.
Kadillak, M.J., Ebrom, D.A., McDonald, J.A., and Tatham, R.H., 1991. Study of Fresnel Zone and Diffraction Amplitudes In a Physical Modeling Experiment. SEG Technical Program Expanded Abstracts, 665-668.
Kananoja, T., Ahtola, T., Hyvärinen, J., Kallio, J., Kinnunen, K., Luodes, H., Makkonen, H., Sarapää, O., Tuusjärvi, M., and Virtanen, K., 2012. Geologisten luonnonvarojen hyödyntäminen Suomessa vuonna 2010 (Summary: Geological resources in Finland, production data and annual report 2010). Geological Survey of Finland, Report of Investigation 197, 61 p.
Kashubin, A.S. and Juhlin, C., 2010. Mapping of crustal scale tectonic boundaries in the Ossa-Morena Zone using reprocessed IBERSEIS reflection seismic data. Tectonophysics, 489, 139-158.
Klemperer, S., and Hobbs, R. (eds.), 1992. The BIRPS Atlas. Cambridge University Press, 128p.
Korsch, R.J., Goleby, B.R., Leven, J.H., and Drummond, B.J., 1998. Crustal architecture of central Australia based on deep seismic reflection profiling. Tectonophysics, 288, 57-69.
Koivisto, E., Malehmir, A., Heikkinen, P.J., Heinonen,S. and Kukkonen, I.T., 2012. 2D reflection seismic investigations at the Kevitsa Ni-Cu-PGE deposit, northern Finland. Geophysics, 77, WC149–WC162.
Kukkonen, I.T., and Lahtinen, R., 2006. Finnish Reflection Experiment FIRE 2001-2005. Geological Survey of Finland, Special Paper 43. 246 p.
30
Levin, F.K., 1971. Apparent velocity from dipping interface reflections. Geophysics, 36, 510-516.
L’Hereux, E., Milkereit, B., and Vasudevan, K., 2009. Heterogeneity and seismic scat-tering in exploration environments. Tectonophysics, 472, 264-272.
Li, T. and Eaton, D.W., 2005. Delineating the Tuwu porphyry copper deposit at Xin-jiang, China, with seismic-reflection profiling. Geophysics 70, B53-B60.
Lindsey, J.P., 1989. The Fresnel zone and it’s interpretive significance. The Leading Edge, October, 33-39.
Ludden, J., Hubert, C., Barnes, A., Milkereit, B., and Sawayer, E., 1993. A three dimen-sional perspective on the evolution of Archean crust: LITHOPROBE seismic reflection images in the southwestern Superior province.Lithos, 30, 357-372.
Malehmir, A., and Bellefleur, G., 2010. Reflection seismic imaging and physical proper-ties of base metal and associated iron deposits in the Bathurst Mining Camp, New Brunswick. Canada. Ore Geology Reviews, 38, 319-333.
Malehmir, A., Durrheim, R., Bellefleur, G., Urosevic, M., Juhlin, J., White, D.J., Milkereit, B., and Campbell, G., 2012. Seismic methods in mineral exploration and mine planning. A general overview of past and present case histories and look into the future. Geohphysics, 77, WC173-WC190.
Malehmir, A., and Juhlin, C., 2010. An investigation of the effects of the choice of stacking velocities on residual statics for hardrock reflection seismic processing. Jour-nal of Applied Geophysics, 72, 28-38.
Malehmir, A., Koivisto, E., Manzi, M., Cheraghi, S., Durrheim, R.J., Bellefleur, G., Wijns, C., Hein, K.A.A., and King, N., 2013. A review of reflection seismic investigations in three major metallogenic regions: The Kevitsa Ni-Cu-PGE district (Finland), Witwaters-rand goldfields (South Africa), and Bathurst Mining Camp (Canada). Ore Geology Re-views, in press.
Malehmir, A., Schmelzbach, C., Bongajum, E., Bellefleur, G., Juhlin, C., and Tryggvason, A., 2009. 3D constraint on a possible deep > 2.5 km massive sulphide mineralization from 2D crooked-line seismic reflection data in Kristineberg mining area, northern Sweden. Tectonophysic, 479, 233-240.
Malehmir, A., Tryggvason, A., Juhlin, C., Rodriguez-Tablante,J., Weihed, P., 2006. Seismic imaging and potential field modelling to delineate structures hosting VHMS deposits in the Skellefte Ore District, northern Sweden. Tectonophysics, 426, 319-334.

31
Milkereit, B., Berrer, E.K., King, A.R., Watts, A.H., Roberts, B., Adam, E., Eaton, D.W., Wu, J., and Salisbury, M., 2000. Development of 3-D seismic exploration technology for deep nickel deposits – A case history from the Sudbury basin, Canada. Geophysics, 65, 1890-1899.
Milkereit, B., and Eaton, D.W.S, 1998. Imaging and interpreting the shallow crystalline crust. Tectonophysics, 286, 5-18.
Milkereit, B., Green, A., and Sudbury Working Group, 1992. Deep geometry of the Sudbury structure from seismic reflection profiling. Geology, 20, 807-811.
Monk, D.J., 2010. Fresnel-zone binning: Fresnel-zone shape with offset and velocity function. Geophysics, 75, T9-T14.
Peltonen, P., Kontinen, A., Huhma, H. and Kuronen, U., 2008. Outokumpu revisited: New mineral deposit model for the mantle peridotite-associated Cu-Co-Zn-Ni-Ag-Au sulphide deposits. Ore Geology Reviews, 33, 559-617.
Perron, G. and Calver, A.J., 1998. Shallow, high-resolution seismic imaging at the Ansil mining camp in the Abitibi greenstone belt. Geophysics 63, 379-391.
Praeg, D., 2003. Seismic imaging of mid-Pleistocene tunnel-valleys in the North Sea Basin—high resolution from low frequencies. Journal of Applied Geophysics, 53, 273-298.
Roberts, B., Zaleski, E., Perron, G., Adam, E., Petrie, L. and Salisbury, M., 2003a. Seis-mic Exploration of the Manitouwadge Greenstone Belt, Ontario: A Case History in Eaton, D.W., Milkereit, B. and Salisbury, M.H. (eds.) Hardrock Seismic Exploration. SEG Developments in Geophysics Series, 110-126.
Roberts, M.D., Oliver, N.H.S., Fairlough, M.C., Hölttä, P.S. and Lahtinen, R., 2003b. Geochemical and Oxygen Isotope Signature of Sea-Floor Alteration Associated with a Polydeformed and Highly Metamorphosed Massive Sulfide Deposit, Ruostesuo, Cen-tral Finland. Economic Geology, 98, 535-556.
Roberts, M.D., Oliverm N.H.S., and Lahtinen, R., 2004. Geology, lithogeochemistry and paleotectonic setting of the host sequence to the Kangasjärvi Zn-Cu deposit, central Finland: Implications for volcanogenic massive sulphide exploration in the Vihanti-Pyhäsalmi district. Bulletin of the Geological Society of Finland, 76, 31-62.
Rogich, D.G. and Matos, G.R., 2008. The Global Flows of Metals and Minerals. U.S. Geological Survey Open-File Report 2008-1355, 11p., available online at http://pubs.usgs.gov/of/2008/1355/.

32
Salisbury, M.H., Milkereit, B., Ascourgh, G., Adair, R., Matthews, L., Schmitt, D.R., Mwenifumbo, J., Eaton, D.W. and Wu, J., 2000. Physical properties and seismic imag-ing of massive sulfides. Geophysics, 65, 1882-1889.
Sato, H., Hirata, H., Ito, T., Tsumura, N., and Ikawa, T., 1998. Seismic reflection profil-ing across the seismogenic fault of the 1995 Kobe earthquake, southwestern Japan. Tectonophysics, 286, 19-30.
Sato, H., Ito, K., Abe, S., Kato, N., Iwasaki, T., Hirata, N., Ikawa, T., and Kawanaka, T., 2009. Deep seismic reflection profiling across active reverse faults in the Kinki Trian-gle, central Japan. Tectonophysics, 472, 86-94.
Schetselaar, E.M., 2013. Mapping the 3D lithofacies architecture of a VMS ore system on a curvilinear-faulted grid: A case study from the Flin Flon mining camp, Canada. Ore Geology Reviews, 53, 261-275.
Sheriff, R.E. and Geldart, L.P., 1995. Exploration Seismology, second edition. Cam-bridge University Press, 592 p.
Snyder, D.B., Cary, P., and Salisbury, M., 2009. 2D-3C high-resolution seismic data from the Abitibi Greenstone Belt, Canada. Tectonophysics, 472, 226-237.
Spencer, C., Thurlow, G., Wright, J., White, D., Carroll, P., Milkereit, B., and Reeds, L., 1993. A vibroseis reflection seismic survey at the Buchans Mine in central Newfound-land. Geophysics 58, 154-166.
Steer, D.N., Knapp, J.H., and Brown, L.D., 1998. Super-deep reflection profiling: ex-ploring the continental mantle lid. Tectonophysics, 286, 111-121.
Taner, M.T., Koehler, F., and Sheriff, R.E., 1979. Complex seismic trace analysis. Geo-physics, 44, 1041-1063.
Tavakoli, S., Bauer, T., Elming, S-Å., Thunehed, H., and Weihed, P., 2012. Regional-scale geometry of the central Skellefte district, northern Sweden –results from 2.5D potential field modeling along three previously acquired seismic profiles. Journal of Applied Gephysics, 85, 43-58.
Tirén, S.A., Askling, P., Wänstedt, S., 1999. Geological site characterization for deep nuclear waste disposal in fractured rock based on 3D data visualization. Engineering Geology 52, 319-346.
Uusisuo, M., 2012. Kaivosteollisuus (The Mining Industry). Sector Report, Ministry of Employment and the Economy, 118 p. in Finnish.

33
Verm, R., and Hilterman, F., 1995. Lithology-coded seismic sections: The calibration of AVO crossplotting to rock properties. The leading edge, August, 847-853.
Weihed, P., Arndt, N., Billström, K., Duchesne, J., Eilu, P., Martinsson, O., Papunen, H. and Lahtinen, R., 2005. 8: Precambrian geodynamics and ore formation: The Fennoscandian Shield. Ore Geology Reviews, 27, 273-322
Widess, M.B., 1973. How thin is a thin bed? Geophysics, 38, 1176-1180.
White, D., Boerner, D., Wu, J., Lucas, S., Berrer, E., Hannila, J., and Somerville, R., 2000. Mineral exploration in the Thompson nickel belt, Manitoba, Canada, using seismic and controlled-source EM methods. Geophysics, 65, 1871-1881.
Zaleski, E., Eaton, D.W., Milkereit, B., Roberts, B., Salisbury, M. and Petrie, L., 1997. Seismic reflections from subvertical diabase dikes in an Archean terrane. Geology 25, 707-710.
Zhang, Y., Sorjonen-Ward, P. and Ord, A., 2006. Modelling fluid transport associated with mineralization and deformation in the Outokumpu Cu–Zn–Co deposit, Finland. Journal of Geochemical Exploration, 89, 465-469.
Web references
AngloGold Ashanti, 2012 Annual Integrated Report. Available online: www.anglogoldashanti.com Webpage visited 08.05.2013.
Altona Mining Limited, 2013. http://www.altonamining.com/finland/outokumpu-copper-project Webpage visited 03.06.2013
First Quantum Minerals Ltd., 2013. http://www.first-quantum.com/Our-Business/operating-mines/Pyhasalmi/default.aspx Webpage visited 03.06.2013