seismic + oceanic sensors (sos) - paroscientificsos).pdf · seismic + oceanic sensors (sos) ......
TRANSCRIPT

Seismic + Oceanic Sensors (SOS) for Ocean Disasters & Geodesy
Seismic + Oceanic Sensors (SOS) Seismic + Oceanic Sensors (SOS) have been developed for disaster warning, geodesy, and climate change measurements. Short-term events like earthquakes and tsunamis are measured with high-resolution Absolute Pressure Gauges and Triaxial Accelerometers. An in-situ calibration method, A-0-A, eliminates drift to allow Long-term measurements of geodesy and sea level changes. The SOS modules work on cabled systems, in remote ocean bottom recorders, and in underwater vehicles.
Disaster Warning Systems
The SOS modules contain Triaxial Accelerometers and Absolute Pressure Gauges that independently measure dynamic short-term events such as earthquakes and tsunamis. See: (http://paroscientific.com/pdf/10_Oceans_2012_Disaster_Warning_Systems.pdf). The pressure sensors and accelerometers will not clip (saturate) while measuring huge mega-thrust earthquakes and tsunamis. Nano-resolution processing electronics provide parts-per-billion resolution to make sensitive pressure measurements to microns at depths of thousands of meters and acceleration measurements to nano-g’s with 3 g full-scale accelerometers. Geodesy There are needs for improved offshore geodetic measurements including slow slip events and sea level changes due to global warming (See Appendix “Excerpts”). The slow secular changes can be masked by instrument drift. An in-situ calibration method, A-0-A, has been developed to eliminate sensor drift. As described in the Appended Links, there are two root causes of drift: (1) Unloaded (Outgassing) in the direction of increasing output and (2) Loaded (Creep) in the direction of decreasing output. Drift due to both Outgassing and Creep decrease

exponentially with time. The combination of these two effects depends on the history of the mission profile. The A-0-A In-situ Calibration Method eliminates the drift regardless of root cause because drift only affects the offsets at 0 and not the span. SOS Construction The SOS module contains (2) Absolute Pressure Gauges with available ranges of 700, 1400, 2000, 3000, 4000, and 7000 meters plus (1) Triaxial Accelerometer with an internal alignment matrix, plus (1) Digiquartz® Barometer, plus (3) Nano-resolution processing electronics. The pressure connection lines are vacuum oil-filled and can connect to a 3-way ball valve that switches between seawater pressures, (A), and an interior oil reservoir, (0).
Temperature compensated and linearized RS-232 outputs are provided from all sensors: • Seawater pressures (A) and temperature readings from each pressure gauge (1 port) • X-Y-Z plus total Vector accelerations and accelerometer temperature readings (1 port)
• Interior housing barometric pressures (0) and barometer temperature readings (1 port) • All sensors can be synchronized and time-stamped using PPS inputs.
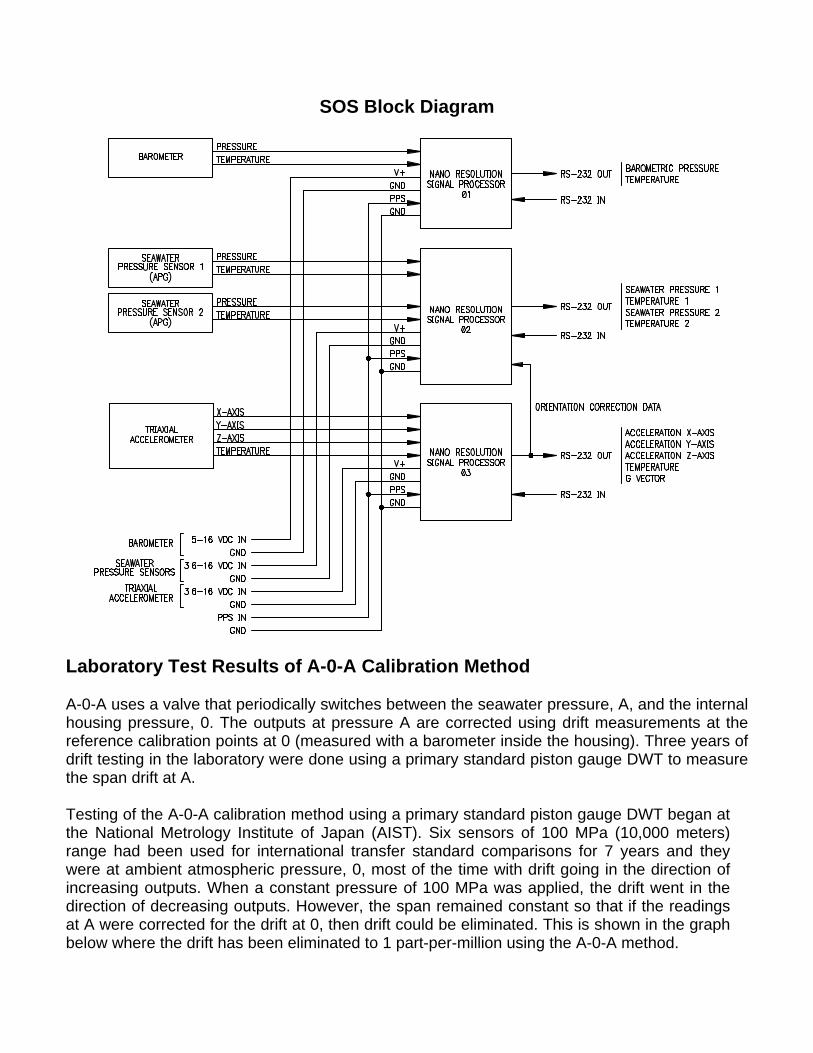
SOS Block Diagram
Laboratory Test Results of A-0-A Calibration Method
A-0-A uses a valve that periodically switches between the seawater pressure, A, and the internal housing pressure, 0. The outputs at pressure A are corrected using drift measurements at the reference calibration points at 0 (measured with a barometer inside the housing). Three years of drift testing in the laboratory were done using a primary standard piston gauge DWT to measure the span drift at A. Testing of the A-0-A calibration method using a primary standard piston gauge DWT began at the National Metrology Institute of Japan (AIST). Six sensors of 100 MPa (10,000 meters) range had been used for international transfer standard comparisons for 7 years and they were at ambient atmospheric pressure, 0, most of the time with drift going in the direction of increasing outputs. When a constant pressure of 100 MPa was applied, the drift went in the direction of decreasing outputs. However, the span remained constant so that if the readings at A were corrected for the drift at 0, then drift could be eliminated. This is shown in the graph below where the drift has been eliminated to 1 part-per-million using the A-0-A method.
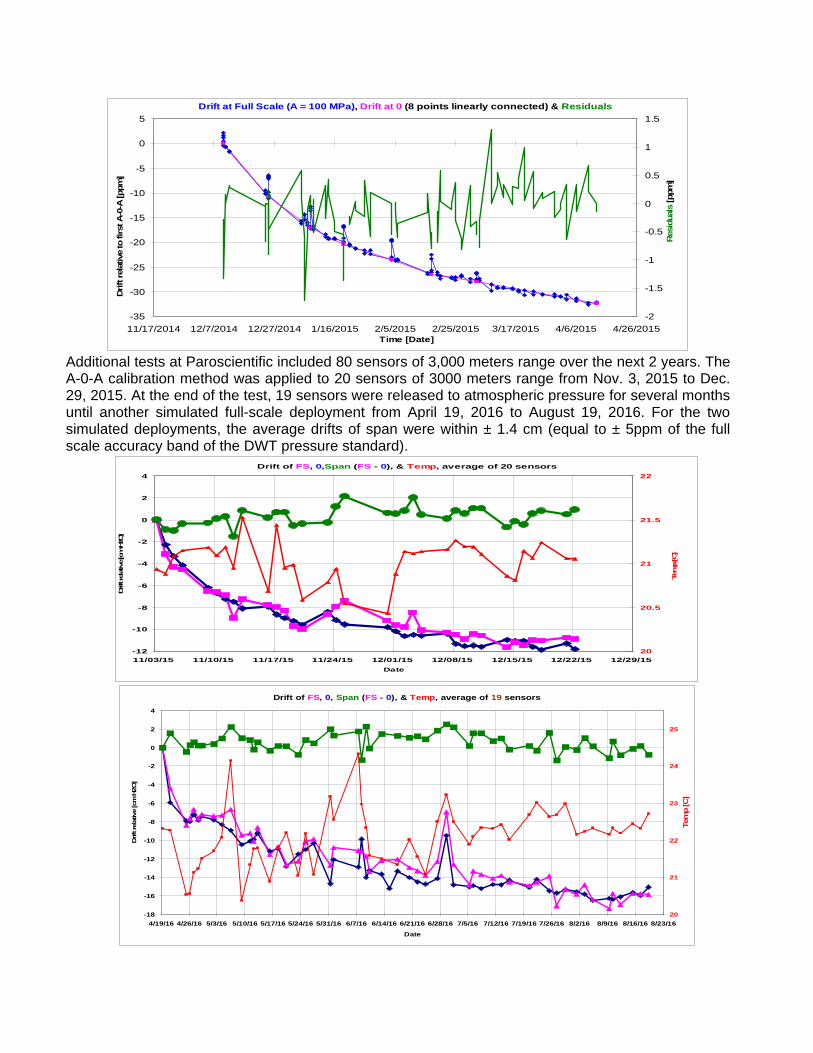
Drift at Full Scale (A = 100 MPa), Drift at 0 (8 points linearly connected) & Residuals
-35
-30
-25
-20
-15
-10
-5
0
5
11/17/2014 12/7/2014 12/27/2014 1/16/2015 2/5/2015 2/25/2015 3/17/2015 4/6/2015 4/26/2015Time [Date]
Drif
t rel
ativ
e to
firs
t A-0
-A [p
pm]
-2
-1.5
-1
-0.5
0
0.5
1
1.5
Res
idua
ls [p
pm]
Additional tests at Paroscientific included 80 sensors of 3,000 meters range over the next 2 years. The A-0-A calibration method was applied to 20 sensors of 3000 meters range from Nov. 3, 2015 to Dec. 29, 2015. At the end of the test, 19 sensors were released to atmospheric pressure for several months until another simulated full-scale deployment from April 19, 2016 to August 19, 2016. For the two simulated deployments, the average drifts of span were within ± 1.4 cm (equal to ± 5ppm of the full scale accuracy band of the DWT pressure standard).
Drift of FS, 0,Span (FS - 0), & Temp,
20
20.5
21
21.5
22
Temp [C
]
average of 20 sensors
-12
-10
-8
-6
-4
-2
0
2
4
11/03/15 11/10/15 11/17/15 11/24/15 12/01/15 12/08/15 12/15/15 12/22/15 12/29/15 Date
Drift relative [cm H
2O]
Drift of FS, 0, Span (FS - 0), & average of 19 sensors
-18
-16
-14
-12
-10
-8
-6
-4
-2
0
2
4
4/19/16 4/26/16 5/3/16 5/10/16 5/17/16 5/24/16 5/31/16 6/7/16 6/14/16 6/21/16 6/28/16 7/5/16 7/12/16 7/19/16 7/26/16 8/2/16 8/9/16 8/16/16 8/23/16
Date
Drif
t rel
ativ
e [c
m H
2O]
Temp,
20
21
22
23
24
25
Tem
p [C
]

SOS Ocean Tests at the Monterey Accelerated Research System (MARS) The University of Washington deployed the SOS module at MARS in mid-June of 2017. The co-located Triaxial Accelerometer and the 2 Absolute Pressure Gauges (APGs) make high-resolution measurements of pressure and acceleration associated with earthquakes on land and in the ocean. Shown below are the vertical and horizontal accelerations and the pressure changes associated with the M8.1 Chiapas, Mexico earthquake on September 7, 2017.
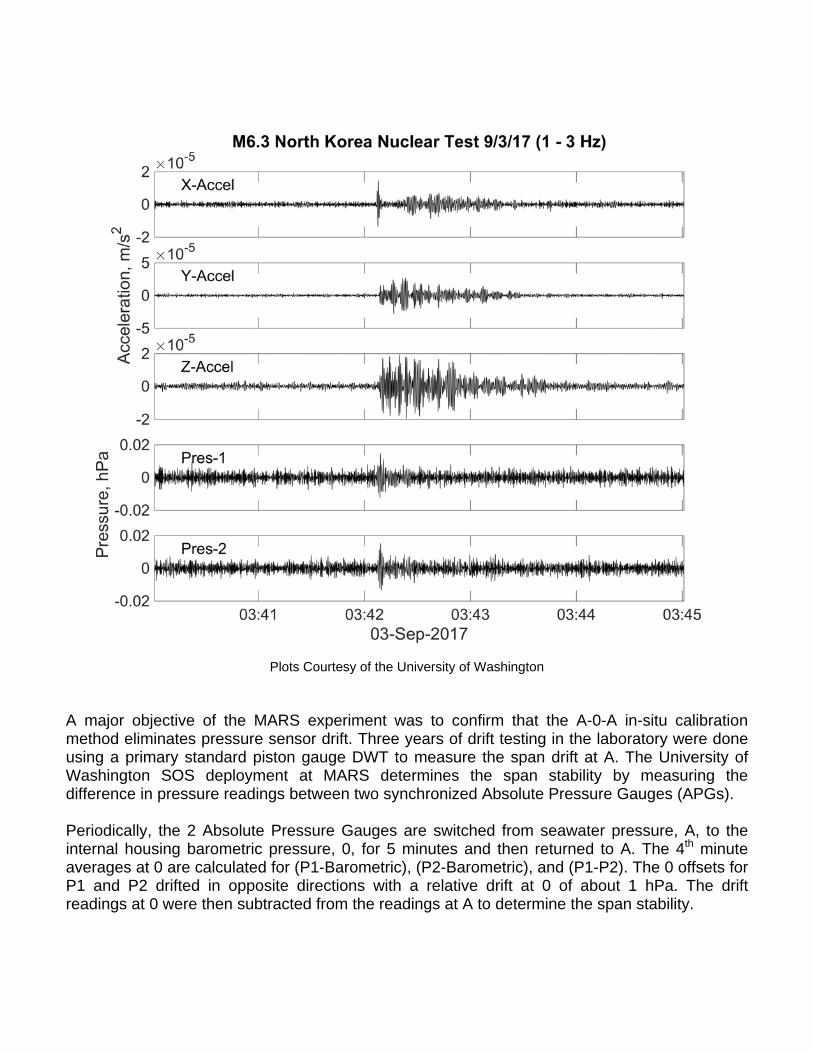
Plots Courtesy of the University of Washington
On September 3, 2017, North Korea exploded a nuclear device that the SOS measured 9000 kilometers away in Monterey. As shown in the following plot, the Triaxial Accelerometer recorded the event on all axes with a magnitude of about 1 micro-g. The Absolute Pressure Gauges (APGs) recorded the pressure signals with a magnitude of about 0.01 hPa (0.1 millimeter at 900 meters depth).
Plots Courtesy of the University of Washington
A major objective of the MARS experiment was to confirm that the A-0-A in-situ calibration method eliminates pressure sensor drift. Three years of drift testing in the laboratory were done using a primary standard piston gauge DWT to measure the span drift at A. The University of Washington SOS deployment at MARS determines the span stability by measuring the difference in pressure readings between two synchronized Absolute Pressure Gauges (APGs). Periodically, the 2 Absolute Pressure Gauges are switched from seawater pressure, A, to the internal housing barometric pressure, 0, for 5 minutes and then returned to A. The 4th minute averages at 0 are calculated for (P1-Barometric), (P2-Barometric), and (P1-P2). The 0 offsets for P1 and P2 drifted in opposite directions with a relative drift at 0 of about 1 hPa. The drift readings at 0 were then subtracted from the readings at A to determine the span stability.

The plot below shows that drift has been eliminated to a fraction of 1 millimeter (0.5 ppm of full-scale per year). The standard deviation is less than 0.02 hPa (0.2 mm of water).
Elimination of Quartz Sensor Drift with A-0-ASpan @ A and Span @ A Corrected for Offset (0) Drift
-0.2
0
0.2
0.4
0.6
0.8
1
1.2
1.4
1.6
1.8
6/19/17 7/19/17 8/18/17 9/17/17 10/17/17 11/16/17 12/16/17 1/15/18 2/14/18 3/16/18 4/15/18 5/15/18Time
Span
@ A
and
Cor
rect
ed S
pan
@ A
[hPa
]
Uncorrected Drift
A-0-A Corrected Drift is less than 1 mm per Year
Conclusions Seismic + Oceanic Sensors (SOS) provide improved seafloor measurements of Short-term events like earthquakes and tsunamis with high-resolution Absolute Pressure Gauges and Triaxial Accelerometers. An in-situ calibration method, A-0-A, eliminates drift to allow Long-term measurements of geodesy and sea level changes. The SOS modules work on cabled systems, in remote ocean bottom recorders, and in underwater vehicles. This choice of platforms provides economic and technical flexibility to meet a variety of mission requirements. Appended Links to Application Notes:
• The root causes of drift are described at: http://www.paroscientific.com/pdf/G8101_Root_Causes_of_Quartz_Sensors_Drift.pdf
• Mathematical models of drift are described at:
http://www.paroscientific.com/pdf/G8095_Mathematical_Models.pdf • In-situ Calibration Methods to Eliminate Sensor Drift are described at:
http://www.paroscientific.com/pdf/G8097_Calibration_Methods_to_Eliminate_Sensor_Drift.pdf
• Triaxial Accelerometers for Improved Seismic and Geodetic Measurements: http://www.paroscientific.com/pdf/G8096_Triaxial_Accelerometer.pdf

Appendix - Excerpts from Papers on Disaster Warning Systems & Geodesy
Papers published in 2016 describe seafloor instrumentation used for short-term disaster warning systems as well as long-term geodetic measurements. The excerpts below show examples of absolute pressure gauges used for tsunami warning systems and slow slip measurements as well as triaxial accelerometers used for both seismic measurements and tilt.
Complete sensing systems have been developed that include absolute pressure sensors, triaxial accelerometers and X-Y tiltmeters together with in-situ calibration methods to eliminate sensor drift. There are 3 different sensors to independently measure dynamic seismic and pressure events such as earthquakes and tsunamis. There are 2 independent methods to measure earth movements – depth changes and tilt. The in-situ A-0-A calibration method provides measurements to eliminate long-term pressure sensor drift.
Excerpts from Papers:
Measuring slow slip offshore
Anne M. Tréhu Science 06 May 2016: http://science.sciencemag.org/content/352/6286/654
This has led to development of alternative techniques for obtaining seafloor geodetic data such as differencing of swath bathymetric data, seafloor and borehole strain meters, and arrays of absolute pressure gauges (APGs), which measure changes in the mass of overlying ocean, from which seafloor uplift or subsidence can be determined. Because of their relatively low unit cost, APGs can achieve the spatial coverage needed to understand complex environments, although there are a number of challenges to be overcome, including long-term sensor drift and separation of tectonic signals from oceanographic effects.
Slow slip near the trench at the Hikurangi subduction zone, New Zealand
Laura M. Wallace, Spahr C. Webb, Yoshihiro Ito, Kimihiro Mochizuki, Ryota Hino, Stuart Henrys, Susan Y. Schwartz, Anne F. Sheehan Science 06 May 2016: http://science.sciencemag.org/content/352/6286/701
The range of fault slip behaviors near the trench at subduction plate boundaries is critical to know, as this is where the world’s largest, most damaging tsunamis are generated. Our knowledge of these behaviors has remained largely incomplete, partially due to the challenging nature of crustal deformation measurements at offshore plate boundaries. Here we present detailed seafloor deformation observations made during an offshore slow-slip event (SSE) in September and October 2014, using a network of absolute pressure gauges deployed at the Hikurangi subduction margin offshore New Zealand. These data show the distribution of vertical seafloor deformation during the SSE and reveal direct evidence for SSEs occurring close to the trench (within 2 kilometers of the seafloor), where very low temperatures and pressures exist.
Seafloor geodetic constraints on interplate coupling of the Nankai Trough megathrust zone Yusuke Yokota, Tadashi Ishikawa, Shun-ichi Watanabe, Toshiharu Tashiro & Akira Asada Nature (2016) doi:10.1038/nature17632: http://www.nature.com/nature/journal/vaop/ncurrent/full/nature17632.html
Interplate megathrust earthquakes have inflicted catastrophic damage on human society. Such an earthquake is predicted to occur in the near future along the Nankai Trough off southwestern Japan—an economically active and densely populated area in which megathrust earthquakes have already occurred. Megathrust earthquakes are the result of a plate-subduction mechanism and occur at slip-deficit regions (also known as ‘coupling’ regions where friction prevents plates from slipping against each other and the accumulated energy is eventually released forcefully. Many studies have attempted to capture distributions of slip-deficit rates (SDRs) in order to predict earthquakes. However, these studies could not obtain a complete view of the earthquake source region, because they had no seafloor geodetic data. The Hydrographic and Oceanographic Department of the Japan Coast Guard (JHOD) has been developing a precise and sustainable seafloor geodetic observation network in this subduction zone to obtain information related to offshore SDRs. Here, we present seafloor geodetic observation data and an offshore interplate SDR-distribution model. Our data suggest that most offshore regions in this subduction zone have positive SDRs. Specifically, our observations indicate previously unknown regions of high SDR that will be important for tsunami disaster mitigation, and regions of low SDR that are consistent with distributions of shallow slow earthquakes and subducting seamounts. This is the first direct evidence that coupling conditions might be related to these seismological and geological phenomena. Our findings provide information for inferring megathrust earthquake scenarios and interpreting research on the Nankai Trough subduction zone. Tsunami data assimilation of Cascadia seafloor pressure gauge records from the 2012 Haida Gwaii earthquake Gusman, A. R., A. F. Sheehan, K. Satake, M. Heidarzadeh, I. E. Mulia, and T. Maeda (2016), Geophys. Res. Lett., 43, doi: 10.1002/2016GL068368.
Recent addition of pressure gauges to ocean bottom seismometers (OBSs) provides alternative data for tsunami forecast simulation. Because OBSs are usually deployed in a dense array, they provide high-density tsunami observations as well.
Here we use the tsunami waveforms recorded on the Cascadia OBS array to demonstrate two different approaches for tsunami forecast: (1) estimation of the fault slip distribution of the 2012 Haida Gwaii earthquake by tsunami waveform inversion and then forecasting the coastal tsunami heights by numerical forward modeling and (2) progressive assimilation of the tsunami waveforms recorded in the array, reproduction of wavefields in the vicinity of the array, and then forecasting of wavefields by numerical modeling.
The tsunami amplitudes recorded by the DPGs are less reliable than those recorded by the DARTs and APGs. Therefore, only 27 tsunami waveforms at DART and APG stations are used for waveform inversion.
The accuracy of the tsunami forecast strongly depends on the spatial distribution of the stations. A denser array would predict the wavefield between the stations both accurately and quickly, which in turn widens the lead time of an accurate forecast. Although the APG and DPG data during the 2012 Haida Gwaii tsunami were not transmitted in real time, our retrospective data assimilation demonstrates the capability of such a dense tsunami array to forecast an incoming tsunami. Real-time tsunami observation technologies, such as the cabled offshore dense tsunami array of S-net (about 150 stations spaced at 30–50 km intervals) that is being deployed in the Japan subduction zone, would provide data required for real-time tsunami forecasts using the methods presented in this paper.
The tsunami forecast from the tsunami data assimilation method produces similar results as those from the traditional tsunami-forecasting method which starts from a fault model. The tsunami data assimilation method that we present can be run continuously in real time and does not require a tsunami source

model. The method can be tested further for various configurations of tsunami source and coast to be implemented for future tsunami warning systems.
Connecting slow earthquakes to huge earthquakes Kazushige Obara* and Aitaro Kato, Science 15 Jul 2016: Vol. 353, Issue 6296, pp. 253-257 DOI: 10.1126/science.aaf1512, http://science.sciencemag.org/content/353/6296/253 . Slow earthquakes are characterized by a wide spectrum of fault slip behaviors and seismic radiation patterns that differ from those of traditional earthquakes. However, slow earthquakes and huge megathrust earthquakes can have common slip mechanisms and are located in neighboring regions of the seismogenic zone. The frequent occurrence of slow earthquakes may help to reveal the physics underlying megathrust events as useful analogs. Slow earthquakes may function as stress meters because of their high sensitivity to stress changes in the seismogenic zone. Episodic stress transfer to megathrust source faults leads to an increased probability of triggering huge earthquakes if the adjacent locked region is critically loaded. Careful and precise monitoring of slow earthquakes may provide new information on the likelihood of impending huge earthquakes. If we can retrieve a precursory signal prior to a megathrust earthquake, it would be useful for disaster mitigation. Slow earthquakes provide phenomenological evidence for the existence of a transition zone between locked and creeping zones proposed by thermal modeling studies and the partial release of slip deficit. In the past two decades, slow earthquakes have been detected in many subduction zones along the Pacific Rim. Among the various slow earthquake types observed along the Pacific Rim, ETS behavior in Cascadia is similar to that seen in Nankai; however, the scale of activity is much larger in Cascadia, where the ETS zone extends for 1200 km along the strike of the subducting plate and is divided into several segments. Recently, seafloor pressure gauge observations revealed that the slip area of the SSE extends close to the (Hikurangi) trench. Slow earthquakes with various time scales in and around the rupture area of the Tohoku earthquake had loaded the mainshock fault. A decade-long SSE took place in the deepest part of the Tohoku mainshock rupture area and accelerated over time. Near the mainshock rupture initiation point, SSEs were detected geodetically by seafloor pressure gauges in 2008 and 2011 in the vicinity of the high-slip area of the mainshock rupture zone. Long-term monitoring of slow earthquakes is required so that a reliable picture of these phenomena can be built over all time scales, and so that physics-based numerical simulations that reproduce the observed plate boundary faulting behavior can be developed. Sensing of upslope passages of frontal bores across the trench slope break of the Japan Trench Fukao, Y., H. Sugioka, A. Ito, H. Shiobara, J. M. Paros, and R. Furue (2016), J. Geophys. Res. Oceans, 121, doi:10.1002/2015JC011432.
The original purpose of our observations is to detect postseismic seafloor disturbances, including submarine landslides, in the epicentral region of the 2011 Tohoku-Oki. The observations are made with a free-fall/pop-up ocean bottom accelerometer (AOBS) and a free-fall/pop-up broadband ocean bottom seismometer (BBOBS). The AOBS contains a triaxial accelerometer developed by Quartz Seismic

Sensors, Inc., which uses quartz crystal resonators to convert the analog force inputs to digital outputs. The accelerometers have ranges of 20 m/s2, sensitivity in ppb, and a good long-term stability. They can measure strong earthquakes without clipping and can use the invariance of the Earth’s 1 g gravity vector as a reference. The triaxial accelerometer senses both the acceleration change due to ground displacement and the component change of the 1 g gravity vector due to ground tilt. The former is dominant in the frequency range related to strong seismic waves, and the latter is dominant well below that range. The latter is the frequency range of our interest, where the root-mean-square (RMS) noise floor is below 10–8 g. The three axes of the accelerometer are designed to be mutually orthogonal, and any small internal mechanical misalignments are corrected in the retrieved data using the alignment matrix table prepared by the factory. Using the alignment matrix allows accurate measurements of seismic signals and tilts on the decoupled orthogonal axes. The sampling rate is set at 1 Hz. In practice, the measured total acceleration value is not time invariant but decreases quasi exponentially through the observational period of 10 months. This decrease is due to the long-term drifts of the component sensors, but it is slow enough to ignore for the analysis of the transient events of our interest. The accelerometer contains an internal quartz crystal temperature sensor to compensate for thermal effects on acceleration. Even though there is a thermal time lag, the internal temperature is a good measure of external temperature changes.
Excerpt from: An, C., Cai, C., Zheng, Y., Meng, L., & Liu, P. (2017). Theoretical solution and applications of ocean bottom pressure induced by seismic seafloor motion. Geophysical Research Letters, 44. https://doi.org/10.1002/2017GL075137
Seismic signals captured by ocean bottom pressure sensors, which are designed to record tsunami waves, are largely ignored. In this paper, we derive a simple theoretical solution of the ocean bottom pressure as a function of prescribed seafloor motion. All the assumptions are clearly stated and analyzed. The solution is checked by comparing the seafloor displacement and pressure from three M7+ earthquakes, recorded by ocean bottom seismometers and pressure gauges located off the Japanese coast. We then show two applications. First, using the seafloor displacement data recorded by an ocean bottom seismometer, the pressure amplitude recorded by the associated pressure gauge is corrected, and vice versa. Second, pressure recordings from Deep Ocean Assessment and Reporting of Tsunamis during the 2011 Tohoku earthquake are converted to seafloor displacements, which are then utilized to estimate the earthquake focal mechanism. Thus, we demonstrate that seismic signals recorded by pressure sensors have great potential for fast estimate of earthquake source parameters.
Excerpt from: Tolkova, E., Nicolsky, D., Wang, D. A Response Function Approach for Rapid Far-Field Tsunami Forecasting Pure Appl. Geophys. (2017) 174: 3249. https://doi.org/10.1007/s00024-017-1612-0 Tsunami forecasting, in particular in application to ocean-wide seismically generated tsunamis, relies on numerical modeling for predicting the tsunami wave height and currents before the actual tsunami arrives at the coasts. Conventionally, the modeling solves an initial value problem with an estimated tsunami source function. At the same time, deducing the tsunami source presents a major challenge. Existing instruments do not directly measure the tsunami source—an initial displacement of the sea surface in the earthquake (EQ) area. Instead, the source has to be inferred from related data. The first-available land-based seismic and geodetic observations can provide for rapid warning for nearby coasts within a few minutes after the EQ, with more elaborated source products to follow (Melgar et al. 2016). The next available source estimate, produced by a technology termed W phase inversion of centroid moment tensor, uses measurements of long period (100–1000 s) seismic waves in the far field of the EQ. Since 2009, the Pacific Tsunami Warning Center (PTWC) routinely makes realtime tsunami forecasts taking the

focal mechanism from the W phase inversion and assuming a uniform slip on a rectangular fault (Foster et al. 2012; Wang et al. 2012). Seismogeodesy with near-source realtime GPS measurements (Crowell et al. 2012; Melgar et al. 2013; Titov et al. 2016a) can improve characterization of the fault geometry, but its applicability is limited to EQs occurring in the vicinity of dense GPS arrays. This sequence of early to relatively early available source models is used for estimating expected tsunami heights by coarsely defined ranges assigned to coastal zones (Melgar et al. 2016 and references therein). Once a tsunami reaches open-ocean tsunameter stations, sea level measurements offer an attractive option to bypass the complexity of fault motions, and to reconstruct the tsunami source directly. Commonly, the source is assembled from pre-defined basis functions. It is assumed that hypothetical tsunamis radiated by these basis sources linearly superimpose in deep water. Then the basis sources/tsunamis are combined to achieve the best fit to the observations—a procedure termed source inversion. The resulting source is expected to further advance the accuracy of the forecast, which can now aim at predicting location-specific time-histories of wave elevation and currents.