seismic ,nterpretation ang olumetric stimation o ³saa ... · p-d seismic ,nterpretation ang...
TRANSCRIPT
3-D Seismic Interpretation and Volumetric Estimation of “Osaja Field” Niger Delta, Nigeria
Osaki Lawson Jack1a, *Opara Alexander Iheanyichukwu1b, Okereke Chikwendu Njoku1c, Adiela Uche Petters2a,
Njoku Ikechukwu Onyema1d, Emberga Theophilus Terhemba3a and Eluwa Ndidiamaka4a
1Department of Geology, Federal University of Technology Owerri, Imo State, Nigeria
2 Department of Petroleum Engineering, Nigeria Agip Oil Company Ltd, Portharcourt, Nigeria
3 Department of Physics, Federal Polytechnic Nekede, Imo State, Nigeria
4 Department of Geology/Geophysics, Federal University Ndufu Alike-Ikwo Abakaliki, Ebonyi State, Nigeria
Email:[email protected], [email protected], [email protected], [email protected], [email protected],
[email protected], [email protected]
Keywords: Reserve estimation, Seismic interpretation, Niger Delta, Petrophysical, Reservoir
Abstract. 3-D seismic interpretation and petrophysical analysis of the Osaja Field, Niger Delta, was
carried out with aim of carrying out a detailed structural interpretation, reservoir characterization
and volumetric estimation of the field. Four wells were correlated across the field to delineate the
lithology and establish the continuity of reservoir sand as well as the general stratigraphy of the
area. The petrophysical analysis carried out, revealed two sand units that are hydrocarbon bearing
reservoirs (Sand_A and Sand_B). The spatial variation of the reservoirs were studied on a field
wide scale using seismic interpretation. Time and depth structural maps generated were used to
establish the structural architecture/geometry of the prospect area of the field. The depth structure
map revealed NE-SW trending anticlinal structures with F5 and F6 as faults assisted closures to the
reservoir. Furthermore, reservoir parameters such as net pay, water saturation porosity, net-to-gross
etc, were derived from the integration of seismic and well log data. The structural interpretation on
the 3-D seismic data of the study area revealed a total of seven faults ranging from synthetic to
antithetic faults. The petrophysical analysis gave the porosity values of the reservoir Sand_A
ranging from 18.1 - 20.3% and reservoir Sand_B ranging from 13.1-14.9% across the reservoir. The
permeability values of reservoir Sand_A ranging from 63-540md and reservoir Sand_B ranging
from 18-80 md hence there is decrease in porosity and permeability of the field with depth. The net-
to-gross varies from 22.1% to 22.4% in Rerservoir Sand A to between 5.34- 12% for Rerservoir
Sand _A while Sw values for the reservoirs ranges from 38-42% in well 2 to about 68.79-96.06% in
well 11. The result of original oil in place for all the wells calculated revealed that well 2 has the
highest value with 9.3mmbls. These results indicate that the reservoirs under consideration have a
poor to fair hydrocarbon (oil) prospect.
Introduction
The evaluation of the intrinsic properties of a reservoir like thickness, net-to-gross ratio, pore
fluid, porosity, permeability, water saturation and volumetric reserve is what is most often regarded
as reservoir characterization. Most of these reservoir properties are previously estimated using
information from borehole logs. However, in the past few years, most of these properties have been
mapped with the help of seismic attributes especially when calibrated with available well data
within the study area. This methodology has certain inherent advantages which includes the high
spatial coverage as well as the fact that the seismic data can be used for interpolating and
extrapolating within and beyond the locations of the few available well data [1]. Seismic attributes
International Letters of Natural Sciences Submitted: 2016-06-14ISSN: 2300-9675, Vol. 59, pp 14-28 Revised: 2016-09-03doi:10.18052/www.scipress.com/ILNS.59.14 Accepted: 2016-09-05© 2016 SciPress Ltd., Switzerland Online: 2016-10-07
SciPress applies the CC-BY 4.0 license to works we publish: https://creativecommons.org/licenses/by/4.0/

are characteristics of a seismic data often represented by analytical maps that aids the interpreter in
better interpretation and visualization of geological features of interest. Seismic attributes have
evolved over the past three decades and have been invaluable in making far better accurate
predictions and characterization of reservoir properties [2-6]. They are specifically applied in
hydrocarbon exploration and development [6]. They are widely used for lithological and
petrophysical prediction of reservoir properties. Common seismic attributes such as complex trace
[7], coherence [8], curvature [9], or spectral decomposition attributes [10] use mathematical
formulations to capture the geometry or physical properties of the subsurface and can be used
clarify subtle geologic features of interest. A methodology has now been proposed and described
for 3-D structural characterization and based on the combinations of specific attributes of interest
and other visualization techniques. Because of their efficiency, Semblance, Structure, and Curvature
are three key attributes that must be included in interpretation. The correct combination and
sequence of these attributes can enhance the final goal of identifying features that were not visible
before.
The areal extent of the Niger delta is about 75000 km2 with a clastic fill of about 12,000 m
[11]. It ranks amongst the world’s most prolific petroleum producing tertiary deltas that together
account for about 5% of the world’s oil and gas reserves. Sedimentation in the depobelts is a
function of sediment supply and of accommodation space created by basement subsidence and
growth faulting. Growth faults, triggered by a pene-contemporaneous deformation of deltaic
sediments are the dominant structural features in the Niger delta. For any given depobelt, gravity
tectonics were completed before deposition of the Benin Formation and are expressed in complex
structures, including shale diapirs, rollover anticlines, collapsed growth fault crests, back-to-back
features, and steeply dipping, closely spaced flank faults [12-13]. These faults mostly offset
different parts of the Agbada Formation and flatten into detachment planes. Petroleum in the Niger
Delta is produced from sandstone and unconsolidated sands predominantly reservoir rocks of
Eocene to Pliocene in age and are often stacked, ranging in thickness from less than 15 meters to
about 45 meters [12]. Based on reservoir geometry and quality, the lateral variation in reservoir
thickness is strongly controlled by growth faults, with the reservoir thickening towards the faults of
the downthrown block [14].
There is therefore the need to use a technologically and economically viable method in the
exploration and exploitation of oil and gas is inevitable owing to the huge sum of money required
for a detail geophysical survey and subsequent exploitation vis-a-vis drilling of wildcat wells. To
avert wastage of resources and reduce uncertainty which are major challenges in the oil and gas
industry, there is need to properly characterize a reservoir and evaluate a formation in order to
accurately ascertain the hydrocarbon potential of the reservoir. It is also very important to determine
its petro-physical properties (porosity, permeability, water saturation, etc) and reserve potentials. In
this study, 3-D seismic reflection data was integrated with well logs to identify and characterize the
various units within the study area using petro-physical analysis and seismic interpretation. Several
workers have carried out structural interpretation of seismic data in different sedimentary basins
worldwide using 3-D seismic and well log data [16-19].Similarly, structural interpretation,
petrology, provenance and depositional environment studies of the reservoir sandstones of part of
the Niger Delta have been carried out to determine the hydrocarbon potentials of the area by various
authors[12,14,20-27]. Over the years, 3-D seismic and well log data have been integrated for
possible generation of geologic models that often incorporate geologic, petrophysical and
geophysical constraints leading to more robust interpretation of the seismic data [2-3,15].
This work is therefore aimed at integrating 3-D seismic and well log data for reservoir
characterization and volumetric estimation in the study area. The ability of the seismic data to
image sub-surface structures and the assessment of the interpreted structures and their closures as
potential reservoirs favourable for hydrocarbon entrapment and accumulation is also investigated.
International Letters of Natural Sciences Vol. 59 15
Geology of the Study area
The geology, stratigraphy, petroleum geology and structure of the Niger delta basin have been
extensively discussed in several key publications [12,14,23,26,28-31].
The Niger Delta is made up of three generalized lithostratigraphic units (from oldest to
youngest) namely Akata, Agbada and the topmost Benin Formations [26]. These are the Benin,
Agbada, and Akata Formations. These formations were deposited in marine, transitional and
continental environments respectively but together they form a thick, over all progradational
passive-margin wedge. The Akata Formation is Paleocene to Pliocene in age and it is the basal unit
composed mainly of marine shales believed to be the main source rock within the basin. The Akata
Formation consist of massive monotonous and generally dark grey marine shales and is generally
very rich in fauna and flora remains [26]. Sandstone lenses (rings) occur near the top of the
formation, particularly at the contact with the overlying Agbada Formation. Akata Formation is the
major source rock for the Hydrocarbons of the Niger delta [12]. Its thickness is uncertain but may
reach 7000m in the central part of the delta with age ranging from Paloecene to Holocene [27]. The
Agbada Formation that overlies the Akata (basal) Formation is a paralic sequence represented by an
alternation of sandstones and shales in various proportions [21]. The Agbada Formation which is
made up of an alternation of sand and shale units is Eocene to Quaternary in age while the Benin
Formation is Oligocene to Recent in age and it is mainly made up of non-marine fine to coarse
grained sands with a few shale intercalations. Deposition of the three formations occurred in each of
the five off lapping siliciclastic sedimentation cycles that comprise the Niger Delta. These cycles
(depo-belts) are 30-60 kilometers wide, prograde southwestward 250 kilometers over oceanic crust
into the Gulf of Guinea, and are defined by syn-sedimentary faulting that occurred in response to
variable rates of subsidence and sediment supply [21]. Six major depo-belts are generally
recognized, each with its own sedimentation, deformation, and petroleum history. The coastal
swamp depo-belt is one of the six depo-belts and is a major hydrocarbon bearing zone in the Niger
delta.
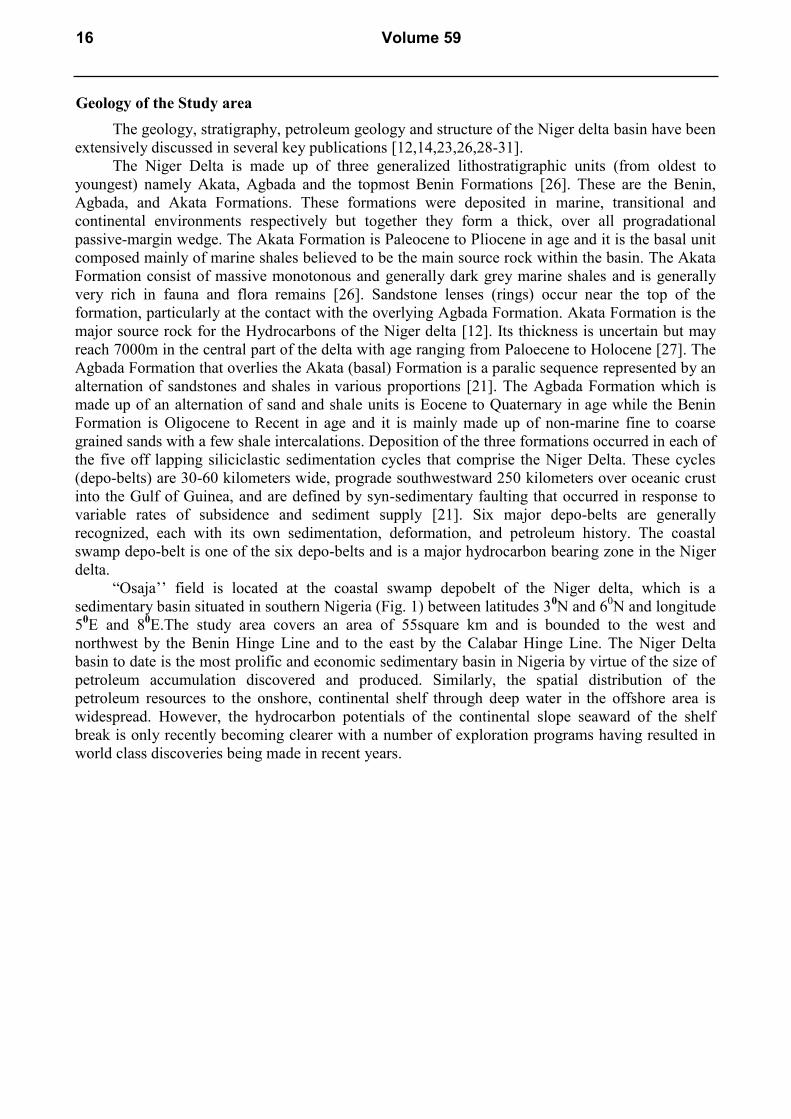
“Osaja’’ field is located at the coastal swamp depobelt of the Niger delta, which is a
sedimentary basin situated in southern Nigeria (Fig. 1) between latitudes 30N and 6
0N and longitude
50E and 8
0E.The study area covers an area of 55square km and is bounded to the west and
northwest by the Benin Hinge Line and to the east by the Calabar Hinge Line. The Niger Delta
basin to date is the most prolific and economic sedimentary basin in Nigeria by virtue of the size of
petroleum accumulation discovered and produced. Similarly, the spatial distribution of the
petroleum resources to the onshore, continental shelf through deep water in the offshore area is
widespread. However, the hydrocarbon potentials of the continental slope seaward of the shelf
break is only recently becoming clearer with a number of exploration programs having resulted in
world class discoveries being made in recent years.
16 Volume 59
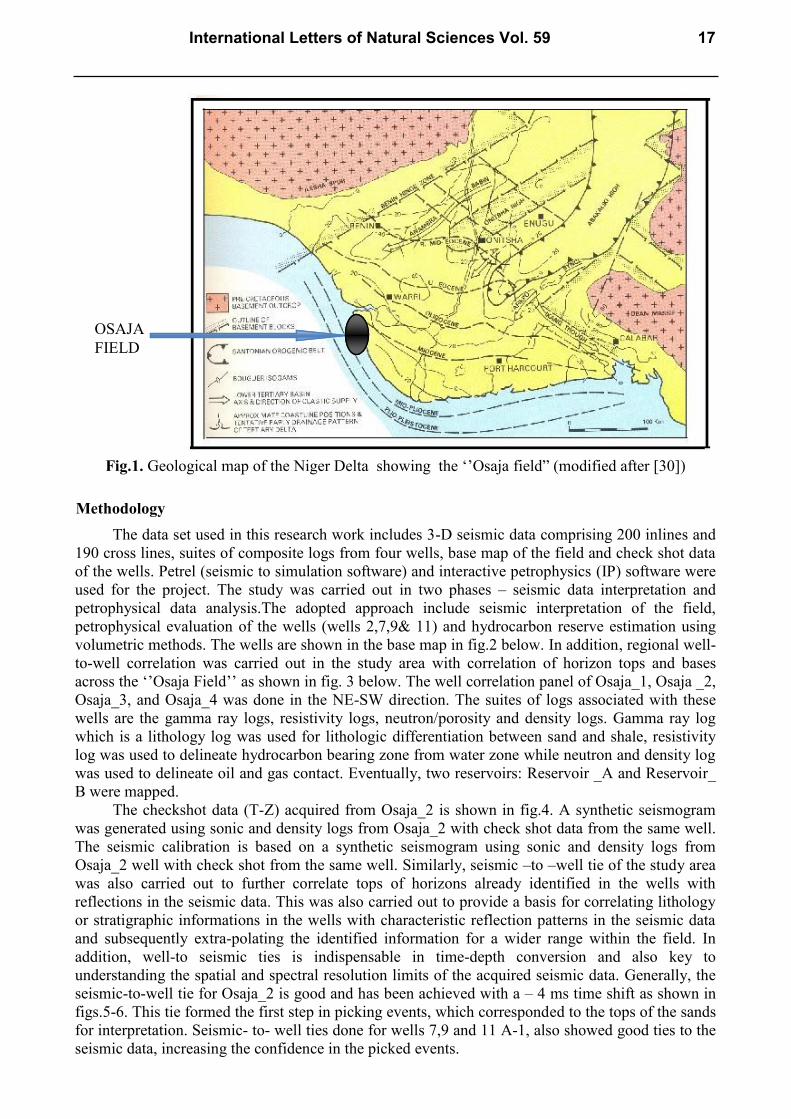
Fig.1. Geological map of the Niger Delta showing the ‘’Osaja field” (modified after [30])
Methodology
The data set used in this research work includes 3-D seismic data comprising 200 inlines and
190 cross lines, suites of composite logs from four wells, base map of the field and check shot data
of the wells. Petrel (seismic to simulation software) and interactive petrophysics (IP) software were
used for the project. The study was carried out in two phases – seismic data interpretation and
petrophysical data analysis.The adopted approach include seismic interpretation of the field,
petrophysical evaluation of the wells (wells 2,7,9& 11) and hydrocarbon reserve estimation using
volumetric methods. The wells are shown in the base map in fig.2 below. In addition, regional well-
to-well correlation was carried out in the study area with correlation of horizon tops and bases
across the ‘’Osaja Field’’ as shown in fig. 3 below. The well correlation panel of Osaja_1, Osaja _2,
Osaja_3, and Osaja_4 was done in the NE-SW direction. The suites of logs associated with these
wells are the gamma ray logs, resistivity logs, neutron/porosity and density logs. Gamma ray log
which is a lithology log was used for lithologic differentiation between sand and shale, resistivity
log was used to delineate hydrocarbon bearing zone from water zone while neutron and density log
was used to delineate oil and gas contact. Eventually, two reservoirs: Reservoir _A and Reservoir_
B were mapped.
The checkshot data (T-Z) acquired from Osaja_2 is shown in fig.4. A synthetic seismogram
was generated using sonic and density logs from Osaja_2 with check shot data from the same well.
The seismic calibration is based on a synthetic seismogram using sonic and density logs from
Osaja_2 well with check shot from the same well. Similarly, seismic –to –well tie of the study area
was also carried out to further correlate tops of horizons already identified in the wells with
reflections in the seismic data. This was also carried out to provide a basis for correlating lithology
or stratigraphic informations in the wells with characteristic reflection patterns in the seismic data
and subsequently extra-polating the identified information for a wider range within the field. In
addition, well-to seismic ties is indispensable in time-depth conversion and also key to
understanding the spatial and spectral resolution limits of the acquired seismic data. Generally, the
seismic-to-well tie for Osaja_2 is good and has been achieved with a – 4 ms time shift as shown in
figs.5-6. This tie formed the first step in picking events, which corresponded to the tops of the sands
for interpretation. Seismic- to- well ties done for wells 7,9 and 11 A-1, also showed good ties to the
seismic data, increasing the confidence in the picked events.
OSAJA
FIELD
International Letters of Natural Sciences Vol. 59 17
Fig.2. Seismic survey base map of the study area showing location of four wells and the seismic
incline and cross line sections
18 Volume 59
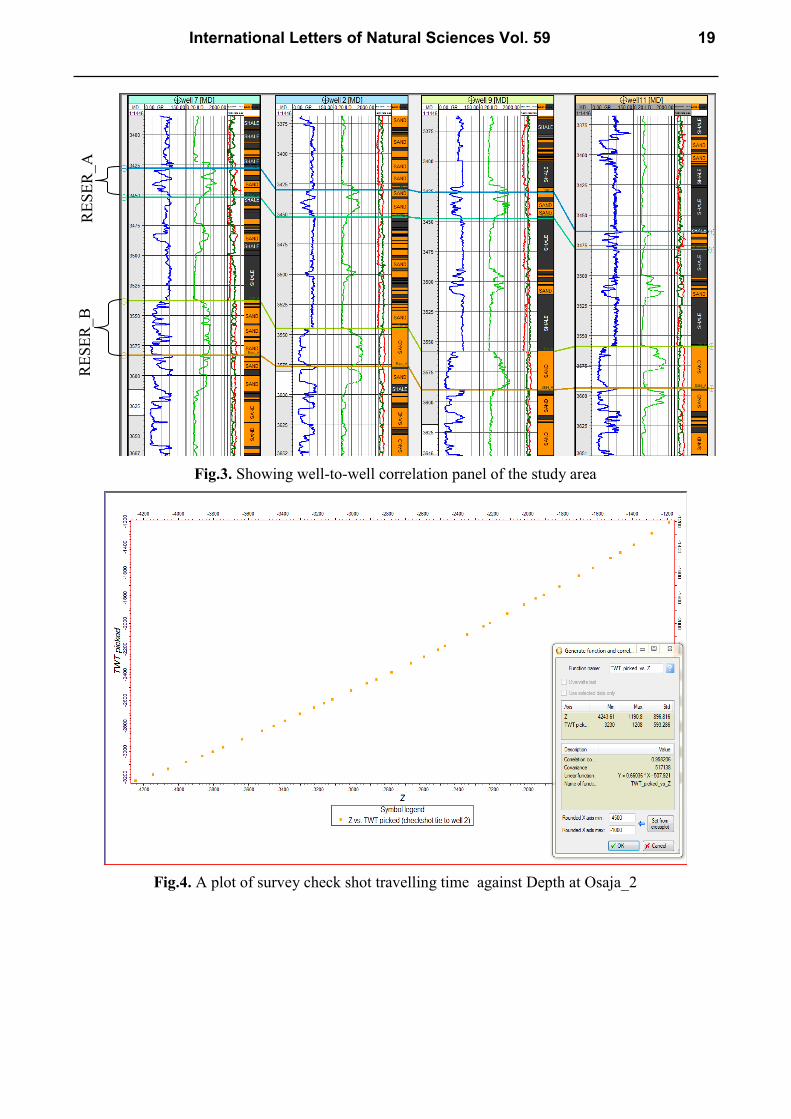
Fig.3. Showing well-to-well correlation panel of the study area
Fig.4. A plot of survey check shot travelling time against Depth at Osaja_2
RE
SE
R_A
R
ES
ER
_B
International Letters of Natural Sciences Vol. 59 19
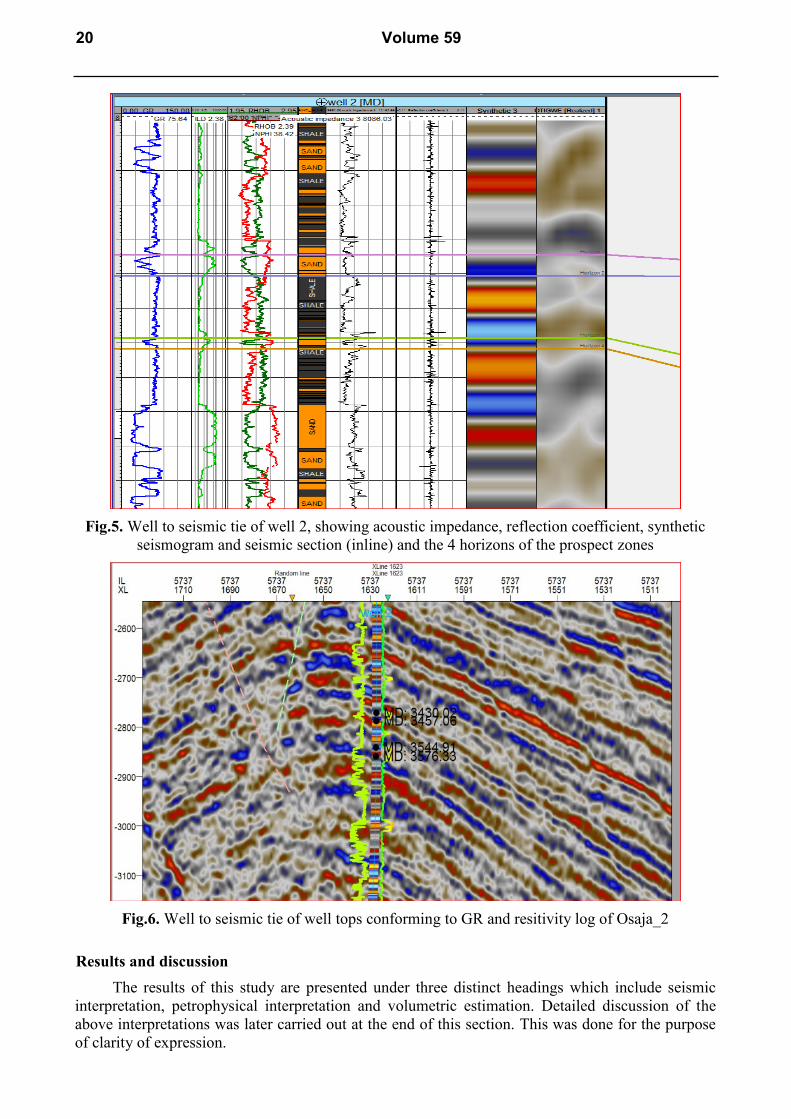
Fig.5. Well to seismic tie of well 2, showing acoustic impedance, reflection coefficient, synthetic
seismogram and seismic section (inline) and the 4 horizons of the prospect zones
Fig.6. Well to seismic tie of well tops conforming to GR and resitivity log of Osaja_2
Results and discussion
The results of this study are presented under three distinct headings which include seismic
interpretation, petrophysical interpretation and volumetric estimation. Detailed discussion of the
above interpretations was later carried out at the end of this section. This was done for the purpose
of clarity of expression.
20 Volume 59

Seismic interpretation
Fault mapping was done on the vertical seismic display across the seismic volume as shown
in figs 7-9. The seismic calibration is based on a synthetic seismogram using sonic and density logs
from Osaja_2 well with checkshot data from same well. Generally, the seismic-to-well-tie was good
with – 4 ms time shift. The tie is an integral part in picking of horizons which corresponded to the
reservoir top and base (Reser_1 and Reser_2). The horizons (H1, H2, H3 and H4) were converted to
surfaces to obtain the time structure maps, which was later converted to depth structure maps using
check shot data. Time to depth conversion of the mapped time events was carried out using a
velocity model based on the Osaja 3-D migration velocities calibrated using T-Z from wells 2, 7, 9
and 11. Time-migrated 3-D seismic data obtained from the field was used to develop time and depth
maps from which the vertex (representation of the prospect/pay zone) was extracted as shown in
figs. 10&11 below. The time and depth structure maps were generated from the horizons. With
available information from the well logs, the GRV (Gross rock volume or volume of impregnated
rock) of the prospect was determined for reserve estimation using volumetric approach. Time
structure and depth structure maps were generated from the seismic section while formation
parameters such as porosity, permeability, water saturation, net to gross etc, were calculated using
the volumetric method. The procedures taken for both phases were carefully done with
consideration of the objective of the study, which is to determine appropriate locations for drilling
appraisal or development wells and to estimate the reserves in the “Osaja field’’.
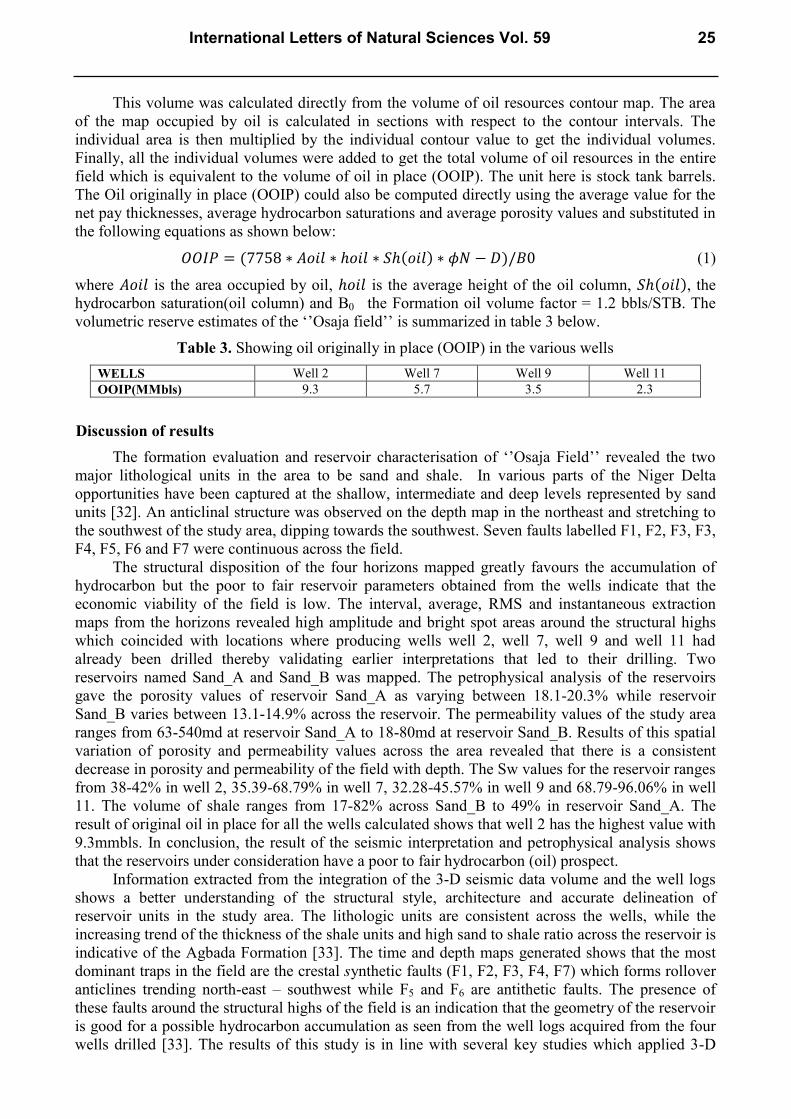
The seismic tie carried out on the seismic section revealed that the top of the shallow reservoir
(Reser_A) which occurred at 3430 m corresponded to 2750ms on the inline while the top of the
deeper reservoir (Reser_B) at 3544 m corresponds to 2850ms on the inline. The structural
interpretation on the 3-D seismic data of the field revealed a total of seven faults which were
identified (F1, F2, F3, F4, F5, F6 and F7) as shown in figs 7-8. While F1, F2, F3, F4 and F7 are synthetic
faults, the faults identified as F6 and F5 are antithetic faults. Four horizons were established and
indicated the top and base of the two reservoirs (Reser_A and Reser_B) as shown in figs.7 and 10.
Fig.10-11 revealed anticlinal structures at the north east of the field stretching to the south west
region (trending NE-SW) with F5 and F6 as faults assisted closures to the reservoir.
Fig.7. The vertical section (inline 57I7) through well 2, showing the faults and the picked horizons
(H1, H2, H3 and H4)
International Letters of Natural Sciences Vol. 59 21

Fig.8. 3-D seismic section of inlie 5713 with time slice showing the fault architecture of the field
Fig.9. Time structural map showing the fault geometry of the prospect zone with penetrated wells
22 Volume 59

Fig. 10. The event time structure maps of horizon H1 and H3 (tops of Reser_A and Reser_B
reservoir) at 2700ms and 27800ms respectively
Fig. 11. Depth structure maps of the tops of Sand_A and Sand_B Reservoir at 3450m and 3500 m
respectively
Structural
high
Structural
high
International Letters of Natural Sciences Vol. 59 23
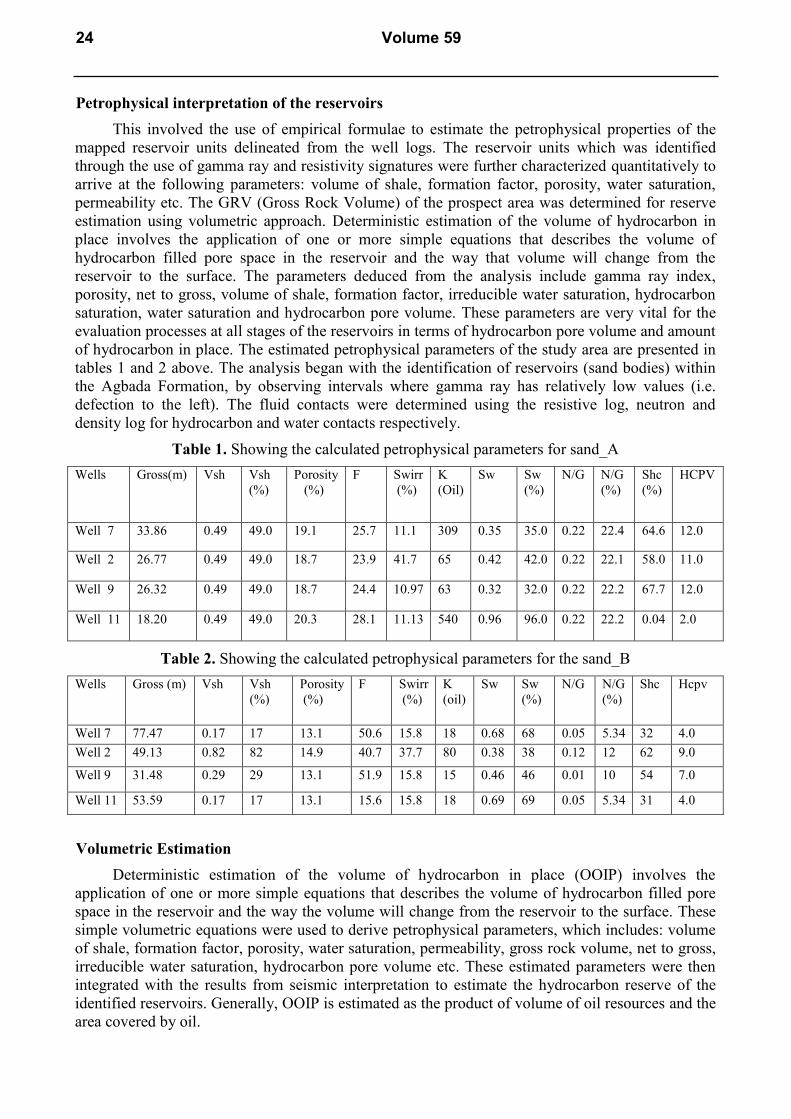
Petrophysical interpretation of the reservoirs
This involved the use of empirical formulae to estimate the petrophysical properties of the
mapped reservoir units delineated from the well logs. The reservoir units which was identified
through the use of gamma ray and resistivity signatures were further characterized quantitatively to
arrive at the following parameters: volume of shale, formation factor, porosity, water saturation,
permeability etc. The GRV (Gross Rock Volume) of the prospect area was determined for reserve
estimation using volumetric approach. Deterministic estimation of the volume of hydrocarbon in
place involves the application of one or more simple equations that describes the volume of
hydrocarbon filled pore space in the reservoir and the way that volume will change from the
reservoir to the surface. The parameters deduced from the analysis include gamma ray index,
porosity, net to gross, volume of shale, formation factor, irreducible water saturation, hydrocarbon
saturation, water saturation and hydrocarbon pore volume. These parameters are very vital for the
evaluation processes at all stages of the reservoirs in terms of hydrocarbon pore volume and amount
of hydrocarbon in place. The estimated petrophysical parameters of the study area are presented in
tables 1 and 2 above. The analysis began with the identification of reservoirs (sand bodies) within
the Agbada Formation, by observing intervals where gamma ray has relatively low values (i.e.
defection to the left). The fluid contacts were determined using the resistive log, neutron and
density log for hydrocarbon and water contacts respectively.
Table 1. Showing the calculated petrophysical parameters for sand_A
Wells Gross(m) Vsh Vsh
(%)
Porosity
(%)
F Swirr
(%)
K
(Oil)
Sw Sw
(%)
N/G N/G
(%)
Shc
(%)
HCPV
Well 7 33.86 0.49 49.0 19.1 25.7 11.1 309 0.35 35.0 0.22 22.4 64.6 12.0
Well 2 26.77 0.49 49.0 18.7 23.9 41.7 65 0.42 42.0 0.22 22.1 58.0 11.0
Well 9 26.32 0.49 49.0 18.7 24.4 10.97 63 0.32 32.0 0.22 22.2 67.7 12.0
Well 11 18.20 0.49 49.0 20.3 28.1 11.13 540 0.96 96.0 0.22 22.2 0.04 2.0
Table 2. Showing the calculated petrophysical parameters for the sand_B
Wells Gross (m) Vsh Vsh
(%)
Porosity
(%)
F Swirr
(%)
K
(oil)
Sw Sw
(%)
N/G N/G
(%)
Shc Hcpv
Well 7 77.47 0.17 17 13.1 50.6 15.8 18 0.68 68 0.05 5.34 32 4.0
Well 2 49.13 0.82 82 14.9 40.7 37.7 80 0.38 38 0.12 12 62 9.0
Well 9 31.48 0.29 29 13.1 51.9 15.8 15 0.46 46 0.01 10 54 7.0
Well 11 53.59 0.17 17 13.1 15.6 15.8 18 0.69 69 0.05 5.34 31 4.0
Volumetric Estimation
Deterministic estimation of the volume of hydrocarbon in place (OOIP) involves the
application of one or more simple equations that describes the volume of hydrocarbon filled pore
space in the reservoir and the way the volume will change from the reservoir to the surface. These
simple volumetric equations were used to derive petrophysical parameters, which includes: volume
of shale, formation factor, porosity, water saturation, permeability, gross rock volume, net to gross,
irreducible water saturation, hydrocarbon pore volume etc. These estimated parameters were then
integrated with the results from seismic interpretation to estimate the hydrocarbon reserve of the
identified reservoirs. Generally, OOIP is estimated as the product of volume of oil resources and the
area covered by oil.
24 Volume 59
This volume was calculated directly from the volume of oil resources contour map. The area
of the map occupied by oil is calculated in sections with respect to the contour intervals. The
individual area is then multiplied by the individual contour value to get the individual volumes.
Finally, all the individual volumes were added to get the total volume of oil resources in the entire
field which is equivalent to the volume of oil in place (OOIP). The unit here is stock tank barrels.
The Oil originally in place (OOIP) could also be computed directly using the average value for the
net pay thicknesses, average hydrocarbon saturations and average porosity values and substituted in
the following equations as shown below:
𝑂𝑂𝐼𝑃 = (7758 ∗ 𝐴𝑜𝑖𝑙 ∗ ℎ𝑜𝑖𝑙 ∗ 𝑆ℎ(𝑜𝑖𝑙) ∗ 𝜙𝑁 − 𝐷)/𝐵0 (1)
where 𝐴𝑜𝑖𝑙 is the area occupied by oil, ℎ𝑜𝑖𝑙 is the average height of the oil column, 𝑆ℎ(𝑜𝑖𝑙), the
hydrocarbon saturation(oil column) and B0 the Formation oil volume factor = 1.2 bbls/STB. The
volumetric reserve estimates of the ‘’Osaja field’’ is summarized in table 3 below.
Table 3. Showing oil originally in place (OOIP) in the various wells
WELLS Well 2 Well 7 Well 9 Well 11
OOIP(MMbls) 9.3 5.7 3.5 2.3
Discussion of results
The formation evaluation and reservoir characterisation of ‘’Osaja Field’’ revealed the two
major lithological units in the area to be sand and shale. In various parts of the Niger Delta
opportunities have been captured at the shallow, intermediate and deep levels represented by sand
units [32]. An anticlinal structure was observed on the depth map in the northeast and stretching to
the southwest of the study area, dipping towards the southwest. Seven faults labelled F1, F2, F3, F3,
F4, F5, F6 and F7 were continuous across the field.
The structural disposition of the four horizons mapped greatly favours the accumulation of
hydrocarbon but the poor to fair reservoir parameters obtained from the wells indicate that the
economic viability of the field is low. The interval, average, RMS and instantaneous extraction
maps from the horizons revealed high amplitude and bright spot areas around the structural highs
which coincided with locations where producing wells well 2, well 7, well 9 and well 11 had
already been drilled thereby validating earlier interpretations that led to their drilling. Two
reservoirs named Sand_A and Sand_B was mapped. The petrophysical analysis of the reservoirs
gave the porosity values of reservoir Sand_A as varying between 18.1-20.3% while reservoir
Sand_B varies between 13.1-14.9% across the reservoir. The permeability values of the study area
ranges from 63-540md at reservoir Sand_A to 18-80md at reservoir Sand_B. Results of this spatial
variation of porosity and permeability values across the area revealed that there is a consistent
decrease in porosity and permeability of the field with depth. The Sw values for the reservoir ranges
from 38-42% in well 2, 35.39-68.79% in well 7, 32.28-45.57% in well 9 and 68.79-96.06% in well
11. The volume of shale ranges from 17-82% across Sand_B to 49% in reservoir Sand_A. The
result of original oil in place for all the wells calculated shows that well 2 has the highest value with
9.3mmbls. In conclusion, the result of the seismic interpretation and petrophysical analysis shows
that the reservoirs under consideration have a poor to fair hydrocarbon (oil) prospect.
Information extracted from the integration of the 3-D seismic data volume and the well logs
shows a better understanding of the structural style, architecture and accurate delineation of
reservoir units in the study area. The lithologic units are consistent across the wells, while the
increasing trend of the thickness of the shale units and high sand to shale ratio across the reservoir is
indicative of the Agbada Formation [33]. The time and depth maps generated shows that the most
dominant traps in the field are the crestal synthetic faults (F1, F2, F3, F4, F7) which forms rollover
anticlines trending north-east – southwest while F5 and F6 are antithetic faults. The presence of
these faults around the structural highs of the field is an indication that the geometry of the reservoir
is good for a possible hydrocarbon accumulation as seen from the well logs acquired from the four
wells drilled [33]. The results of this study is in line with several key studies which applied 3-D
International Letters of Natural Sciences Vol. 59 25
interpretation and advanced visualization in geologicaly interpretation of structural and stratigraphic
features [34-40]. Generally, the structural style of the study area is dominated by simple rollover
anticlines and collapsed crest faults which is in line with previous studies in the Niger delta [12, 21-
22, 32]. The subsurface of the Niger Delta basin is extensively deformed by growth fault structures
and roll over anticlines [21]. For any given depobelt, gravity tectonics were completed before
deposition of the Benin Formation and are expressed in complex structures, including shale diapirs,
roll- over anticlines, collapsed growth fault crests, back-to-back features, and steeply dipping,
closely spaced flank faults [12, 21, 34]. These faults mostly offset different parts of the Agbada
Formation and flatten into detachment planes near the top of the Akata Formation. Certainly the
reservoirs are not uniform, they have variable porosity, permeability, and may be
compartmentalized with fractures and faults breaking them up and complicating fluid flow,
therefore more wells should be drilled around the anticline with core sample analysis to improve
estimation of the reserve and reduce uncertainty.
Analysis of the well logs revealed that the reservoirs have a roughly cylindrical log motif
suggesting distributary channel depositional environment. The petrophysical results of the wells
(table 2) show fair porosity despite high Vsh (shaliness) cut offs. Similarly, it was observed that
porosity and permeability decreases with depth, which is believed to be due to compaction resulting
from over burden. The interaction of the resistivity, porosity and density logs revealed that the
reservoirs are more of gas bearing zones which is further proven by the increase in gas to oil ratio as
we move basin ward. The bulk volume water of the reservoir units are not constant across the wells
indicating a variation in water saturation and irreducible water (sw > swr) across the study area.
Geologically this shows that the reservoirs may not produce water free hydrocarbons. The reserve
estimates revealed that the reservoirs are not economical; they have fair to poor porosities and
permeabilities and with an average hydrocarbon saturation across the study area less than 50%.
Conclusion
The formation evaluation and reservoir characterisation of ‘’Osaja Field’’ revealed a
shale/sand sequence. The 3-D seismic interpretation of the study area revealed that the structural
style is dominated by simple rollover anticlines and collapsed crest faults which is in line with
previous studies in the Niger delta. Certainly the reservoirs are not uniform; they have variable
porosity, permeability, and may be compartmentalized with fractures and faults breaking them up
and complicating fluid flow, therefore more wells should be drilled around the anticline with core
sample analysis to improve estimation of the reserve and reduce uncertainty. The structural
disposition of the four horizons mapped greatly favours the accumulation of hydrocarbon but the
poor to fair reservoir parameters obtained from the wells indicate that the economic viability is low.
In conclusion, the result of the seismic interpretation and petrophysical analysis shows that the
reservoirs under consideration have a poor to fair hydrocarbon (oil) prospect.
Acknowledgement
The authors appreciate with thanks the support received from the Federal University of
Technology Owerri (FUTO). We sincerely wish to thank the Department of Petroleum Resources
(DPR), a subsidiary of Nigerian National Petroleum Corporation (NNPC) for their support and
Monipolo Limited for the data sets and softwares used for this study.
26 Volume 59
References
[1] D.A.Cooke, T.Muryanto, Reservoir Quantification of B Field, Java Sea via Statistical and
Theoretical Methods, Submitted for presentation at the SEG International Exposition and
Meeting, Houston, TX USA, 1999.
[2] G.A.Dorn, Modern 3-D seismic interpretation, The Leading Edge. 17(9) (1998) 1262–1272
[3] T.A.Jones, S.J.Helwick, Methods of generating 3-D Geologic models incorporating geologic
and geophysical constraints, United States Patent, USOO5838634A., Nov, 1998.
[4] D.Gao, Volume texture extraction for 3-D seismic visualization and interpretation,
Geophysics. 68 (2003) 1294-1302.
[5] D.Gao, Texture model regression for effective feature discrimination: Application to seismic
facies visualization and interpretation, Geophysics. 69 (2004) 958- 967.
[6] S. Chopra, K. Marfurt, Seismic Attributes – a promising aid for geologic prediction, CSEG
RECORDER, Special Edition. (2006) 111-121.
[7] M.T. Taner, F. Koehler, R. E. Sheriff, Complex seismic trace analysis, Geophysics. 44 (1979)
1041–1063.
[8] M. Bahorich, S. Farmer, 3-D seismic discontinuity for faults and stratigraphic features: The
coherence cube, The Leading Edg.e 14 (1995) 1053–1058.
[9] K.J. Marfurt, R.L. Kirlin, 3-D broad band estimates of reflector dip and amplitude,
Geophysics. 65 (2000) 304–320.
[10] G. Partyka, J. Gridley, J. Lopez, Interpretational applications of spectral decomposition in
reservoir characterization, The Leading Edge. 18 (1999) 353–360.
[11] K.J. Weber, Hydrocarbon distribution patterns in Nigerian growth fault structures controlled
by structural style and stratigraphy, Journal of Petroleum Science and Engineering. 1 (1987)
91-104.
[12] B.D. Evamy et al., Hydrocarbon habitat of Tertiary Niger Delta, American Association of
Petroleum Geologists Bulletin.62 (1978) 277-298.
[13] H. Xiao, J. Suppe, Origin of Rollover, American Association of Petroleum Geologists
Bulletin. 76 (1992) 509-229.
[14] K.J. Weber, E.M. Daukoru, Petroleum geology of the Niger Delta, Proceedings of the Ninth
World Petroleum Congress, Geology: London, Applied Science Publishers, Ltd. 2 (1975)
210-221.
[15] A.I. Opara, Prospectivity Evaluation of “Usso” Field, Onshore Niger Delta Basin, Using 3-D
Seismic and Well Log Data, Petroleum and Coal. 52(4) (2010) 307-315.
[16] A.I. Opara, U.O.Anyim, V.I.Nduka, 3D Seismic Interpretation and Structural Analysis of
“Ossu” Oil Field, Northern Depobelt, Onshore Niger Delta, Nigeria, Pacific Journal of
Science and Technology. 12(1) (2011) 502-509.
[17] E. M. Hamed, J.M. Kurt, Structural interpretation of the Middle Frio Formation using 3-D
seismic and well logs: An example from the Texas Gulf Coast of the United States, The
Leading Edge. 27(7) (2008) 840-854.
[18] R.W. Wiener, J.A. Helwig, J.Rongpei, Seismic Interpretation and Structural Analysis of the
Rifted Thrust Belt, Jianghan Basin, China, The Leading Edge. 60(8) (1997) 1177–1183.
[19] R. Esedo, B. Ozumba, New Opportunity Identification in a Mature Basin: The Oguta North
Prospect in OML 20, Niger Delta, Society of Petroleum Engineers Conference Proceedings,
28th
Annual SPE International Conference and Exhibition, Abuja, August 2-4, 2004, Paper
SPE 98812.
[20] S.O. Nwachukwu, The tectonic evolution of the southern portion of the Benue Trough,
Nigeria: Geology Magazine. 109 (1972) 411-419.
[21] K.C. Short, A.J. Stäuble, Outline of geology of Niger Delta, American Association of
Petroleum Geologists Bulletin. 51 (1965) 761-779.
[22] R.A. Reyment, Aspects of the geology of Nigeria, university of Ibadan press, Nigeria, 1965.
International Letters of Natural Sciences Vol. 59 27
[23] H. Doust, E. Omatsola, Niger Delta, in J.D. Edwards, P.A .Santogrossi, eds.,
Divergent/passive Margin Basins, AAPG Memoir 48: Tulsa, American Association of
Petroleum Geologists. (1990) 239-248.
[24] A.A. Avbovbo, Tertiary lithostratigraphy of Niger Delta, American Association of Petroleum
Geologists Bulletin. 62 (1978) 295-300.
[25] F.T. Beka, M.N. Oti, The distal Offshore Niger Delta: frontier prospects of a mature
petroleum province, in Oti, M.N., Postma, G., eds., Geology of Deltas: Rotterdam, A.A.
Balkema. (1995) 237-241.
[26] J.E. Ejedawe, Patterns of incidence of oil reserves in Niger Delta Basin, American
Association of Petroleum Geologists. 65(1981) 1574-1585.
[27] C.M. Ekweozor et al., Preliminary organic geochemical studies of samples from the Niger
Delta, Nigeria: Part 1, analysis of crude oils for triterpanes, Chemical Geology. 27 (1979) 11-
28.
[28] P.I. Merki, Structural Geology of Cenozoic Niger Delta, First African Regional Geological
Conference Proceedings, Ibadan University Press, Ibadan, Nigeria. (1971) 251 –266.
[29] A.J. Whiteman, Nigeria: Its Petroleum Geology: Resources and Potential, volume 1-2.
Graham and Trottan, London, UK, 1982.
[30] A.O. Owoyemi, B.J. Willis, Depositional Patterns Across Syndepositional Normal Faults,
Niger Delta, Nigeria, Journal of Sedimentary Research. 76(2) (2006) 346-363.
[31] F. Bilotti, J.H. Shaw, Deepwater Niger Delta Fold and Thrust Belt modeled as a Critical –
Taper Wedge: The Influence of Elevated Basal Fluid Pressure on Structural Styles, AAPG
Bulletin. 89(11) (2005) 1475-1491.
[32] K.J. Weber, Hydrocarbon Distribution Patterns in Nigerian Growth Fault Structures
Controlled by Structural Style and Stratigraphy, Journal of Petroleum Science and
Engineering. 1 (1987) 91-104.
[33] M.T. Olowokere, S.J. Abe, Structure and Facies Development Resulting From Neogene
Gravity Tectonics and Depositional Processes: Application to Afo Field, Niger Delta, Nigeria,
Journal of Emerging Trends in Engineering and Applied Sciences. 4(3) (2013) 541-544.
[34] R.W. Wiener, J.A. Helwig, J. Rongpei, Seismic Interpretation and Structural Analysis of the
Rifted Thrust Belt, Jianghan Basin, China, The Leading Edge. 60(8) (1997) 1177-1183.
[35] P. Van Rensbergen, C.K. Morley, 3-D Seismic study of a shale expulsion syncline at the base
of the Champion delta, offshore Brunei and its implications for the early structural evolution
of large delta systems; Marine and Petroleum Geology. 17 (2000) 861–872.
[36] M. Mariela, A Geological Interpretation of 3D Seismic Data of a Salt Structure and Subsalt
Horizons in the Mississippi Canyon Subdivision of the Gulf of Mexico, University of New
Orleans Theses and Dissertations, 2006.
[37] S. Xia et al., Application of 3D fine seismic interpretation technique in Dawangzhuang Area,
Bohai Bay Basin, Northeast China, Arabian Journal of Geosciences. 8(1) (2015) 87-97, DOI
10.1007/s12517-013-1225-6.
[38] M.R. Malleswar, K.J. Marfurt, Seismic texture analysis for reservoir prediction and
characterization, The Leading Edge. 29(9) (2010) 1116-1121.
[39] L. Castanie, F. Bosquet, B. Levy, Advances in seismic interpretation using new volume
visualization techniques, First Break, EAGE. 23 (2005) 69-72.
[40] H.M. Khan, A.S.M. Woobaidullah, C. Quamruzzaman, Seismic Interpretation of 2D Data
over Kailashtila Gas Field, NE Bangladesh, International Journal of Emerging Technology
and Advanced Engineering. 3(11) (2013) 23-34.
[41] H. Doust, The Niger Delta hydrocarbon potential, a major Tertiary Niger Province;
Proceedings of KNGMG Symposium, Coastal Lowstands, Geology and Geotechnology, The
Hague, Kluiver Acad. Publ., Dordrecht. (1989) 22-25.
28 Volume 59