seismic hazard for brazilian northeastern region risco sísmico na
TRANSCRIPT

The Brazilian territory presents low seismicity, typical of a tectonic intra-plates region. Nevertheless, the seismic effects cannot be simply disre-garded in the engineering projects. Therefore, a study is presented in this paper, of the seismicity of the Brazilian Northeastern Region, which due to its proximity with the South Atlantic Ridge, presents a seismic activity rate higher than of other Brazilian regions. In this way, the seismic recur-rences and the probabilistic distribution functions of spectral accelerations are determined for the region. From the obtained values, the design response spectra are defined for the region, being its values compared, for several periods, with the design spectrum presented by the Brazilian Seismic Standard NBR 15421.
Keywords: seismic hazard, seismic engineering, hazard anaysis.
O território brasileiro apresenta baixa atividade sísmica, característica de região tectônica intra-placas. Entretanto, os efeitos dos sismos não podem ser simplesmente desconsiderados em projetos de engenharia. Assim, é apresentado neste trabalho um estudo da sismicidade da região Nordeste do Brasil, que por estar posicionada próxima à falha do Atlântico Central, a leva a apresentar uma taxa de atividade sísmica com con-tinuidade de ocorrência mais alta do que a de outras regiões brasileiras. Dentro deste contexto, são calculadas as recorrências sísmicas e as distribuições probabilísticas de acelerações espectrais para a região. De posse desses valores, são determinados os espectros de resposta de projeto para a região, fazendo as devidas comparações entre os resultados obtidos para cada período de recorrência com o espectro apresen-tado pela Norma Brasileira de Sismos NBR 15421.
Palavras-chave: risco sísmico, engenharia sísmica, análise de risco.
Seismic Hazard for Brazilian Northeastern Region
Risco Sísmico na Região Nordeste do Brasil
S. H. C. SANTOS a
S. SOUZA LIMA b
F. C. M. SILVA c
a Polytechnic School, Federal University of Rio de Janeiro, [email protected], PO Box 60529, CEP 21945-970, Rio de Janeiro, Brazil.b Polytechnic School, Federal University of Rio de Janeiro, [email protected], PO Box 60529, CEP 21945-970, Rio de Janeiro, Brazil.c Tecton Engineering, [email protected], Rua do Carmo 57, 8th floor, CEP 20011-020, Rio de Janeiro, Brazil.
Received: 28 Dec 2009 • Accepted: 23 Jul 2010 • Available Online: 10 Sep 2010
Abstract
Resumo
Volume 3, Number 3 (September, 2010) p. 374 - 389 • ISSN 1983-4195
© 2010 IBRACON

2. Seismic data in Brazil and South America
The analysis of the seismicity of the Brazilian territory is not yet completed.. There is, however, a study of seismic risk on a global scale made by the GFZ-Potsdam Institute [5]. This study is con-sidered by the U.S. Geological Survey [6] on its map of global seis-micity, which is reproduced in Figure 1 for South America. The map shows that Brazilian territory has a very low seismic-ity, with horizontal accelerations usually less than 0.4 m / s 2. It is noteworthy also that in some areas of Brazil, the seismicity is not negligible. Regions with higher seismicity are some Northeastern states, due to its position with respect to the failure of the Central Atlantic Ridge and the western part of the North and Midwest re-gions, due to its proximity to the Andes. In a paper presented by Falconi and Baez [7] a study of the seis-micity in South America is presented. In a more recent paper, previously cited, Falconi [2] presents a comparative analysis of the standards for seismic design of six South American countries. Bra-zil was not included in this study, but the actual Brazilian seismic activity, mainly in its Northern areas can be inferred using data from the seismic zoning of neighboring countries. Considering these studies and taking into account the geographi-cal continuity between neighboring countries, the map of seismic activity in Brazil was consolidated by Santos and Souza Lima [1]. The same analyses were used to define the seismic zones of Bra-zil in the NBR 15421. Brazilian seismicity zones and their respec-tive nominal values of the horizontal accelerations ag are shown in Figure 2, where g is the gravity acceleration.
1. Introduction
The first scientific studies of seismicity in the Brazilian territory began around the year 1970, from which seismic data began be-ing collected, but these studies have not yet been completed. Initially, it had been considered in Brazil data from the results of seismological studies conducted in other countries. Santos and Souza Lima [1], considering the geographical continuity between the neighboring countries of Brazil, from a study by Falcone [2], who analyzed seismic design standards for six South American countries excluding Brazil, consolidated a seismicity map of Bra-zil. These studies provided the basis for the proposal of the Bra-zilian Standard for the Design of Seismic-Resistant Structures, NBR 15421 [3]. This Standard considers that most of Brazil has low seismicity, but in two regions, part of the Northeast and parts of North and Central West (Western Amazonia), the seismic po-tential is not negligible. The present paper aims to present a detailed analysis of the seis-micity of the Brazilian Northeastern Region and to obtain their nominal horizontal accelerations, according to the periods of re-currence of seismic events and their design response spectra for seismic analysis in order to compare them with the spectrum of NBR 15421. The seismic data available and the studies already done for defining the functions of probability distribution of earth-quake magnitudes are used. This same subject has been already presented more briefly by Santos and Souza Lima [4]. The paper summarizes part of Graduation Project of the third author, per-formed at the Polytechnic School of UFRJ, under the guidance of the first two authors.
375IBRACON Structures and Materials Journal • 2010 • vol. 3 • nº 3
S. H. C. SANTOS | S. SOUZA LIMA | F. C. M. SILVA
376 IBRACON Structures and Materials Journal • 2010 • vol. 3 • nº 3
Seismic Hazard for Brazilian Northeastern Region
3. Calculation of seismic recurrence
Gutenberg and Richter [9] performed studies of seismic recurrence related to accumulated annual frequency, suggesting the expres-sion below:
In this expression, a and b are coefficients which depend on the local seismicity, M is the magnitude and ΣN is the total number of earthquakes with magnitude equal to or greater than M in a period of one year. The expression above can also be written as:
where TM is the period of recurrence of an earthquake with a mag-nitude of at least equivalent to M, where:
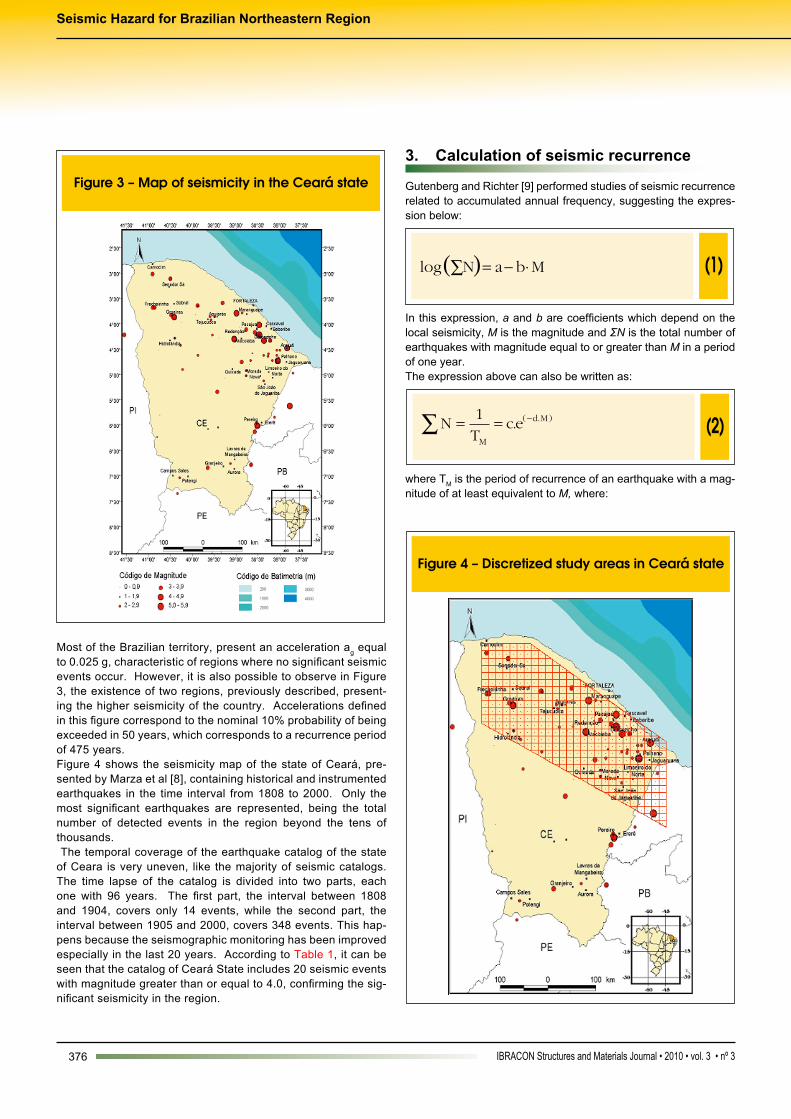
Most of the Brazilian territory, present an acceleration ag equal to 0.025 g, characteristic of regions where no significant seismic events occur. However, it is also possible to observe in Figure 3, the existence of two regions, previously described, present-ing the higher seismicity of the country. Accelerations defined in this figure correspond to the nominal 10% probability of being exceeded in 50 years, which corresponds to a recurrence period of 475 years. Figure 4 shows the seismicity map of the state of Ceará, pre-sented by Marza et al [8], containing historical and instrumented earthquakes in the time interval from 1808 to 2000. Only the most significant earthquakes are represented, being the total number of detected events in the region beyond the tens of thousands. The temporal coverage of the earthquake catalog of the state of Ceara is very uneven, like the majority of seismic catalogs. The time lapse of the catalog is divided into two parts, each one with 96 years. The first part, the interval between 1808 and 1904, covers only 14 events, while the second part, the interval between 1905 and 2000, covers 348 events. This hap-pens because the seismographic monitoring has been improved especially in the last 20 years. According to Table 1, it can be seen that the catalog of Ceará State includes 20 seismic events with magnitude greater than or equal to 4.0, confirming the sig-nificant seismicity in the region.

377IBRACON Structures and Materials Journal • 2010 • vol. 3 • nº 3
S. H. C. SANTOS | S. SOUZA LIMA | F. C. M. SILVA
Adopting this formula for seismic characterization corresponds to con-sidering the “diffuse seismicity”, as defined by McGuire [10]. This means that for this type of intra-plate tectonic region, the seismicity is assumed to have future distributions of properties and release points of energy that do not vary in time and space. The seismic risk is not evaluated taking into account that active faults presenting a potential seismic data, but diffuse sources distributed in the tectonic province considered. Marza et al. [8] developed a study to characterize the seismicity of Ceará State that can be considered as representative and conser-vative enough for the region in question. The statistical analysis of earthquakes occurrence was made, by these authors using the frequency-magnitude relation of Guten-berg and Richter, Equation 1 or Equation 2. The cumulative distri-bution of the frequencies of earthquakes was represented by the following relationship:
The results presented by Marza et al. have shown that the seismic potential of the State of Ceará is not negligible and the probabil-ity of occurrence of significant events (magnitude greater than or equal to 4) are quite high, as can be seen graphically in Figure 3.
4. Methodology for analysis of seismic data
The study performed for the Northeastern region is restricted to the state of Ceará, since it is considered the most active area in the condidered seismic region, as previously empha-sized. The limits of the seismic area under study, shown in Figure 4, were defined in order to involve the largest num-ber of points of occurrence of earthquakes with larger magni-tudes and denser distribution points (in this case, the northern area of Ceará State). The discretized region is an area with 78.729km 2 in total, which was divided into 351 sub-regions with 225km2 each one (perfect squares). Sub-regions posi-tioned on the boundary of the total area, were considered only when presenting with an area greater than or equal to half the area of a perfect square. In this study 8 magnitudes lev-els have been used: M1≥3.5; M2≥4.0; M3≥4.5; M4≥5.0; M5≥5.5; M6≥6.0; M7≥6.5; M8≥7.0. Using Equation 4 and considering the above discretization, the number of events that occur in the following ranges can be evalu-ated: 3.5 ≤ M ≤ 4.0, 4.0 ≤ M ≤ 4.5, 4.5 ≤ M ≤ 5.0, 5.0 ≤ M ≤ 5.5, 5.5 ≤ M ≤ 6.0, 6.0 ≤ M ≤ 6.5, 6.5 ≤ M ≤ 7.0. This number is divided

378 IBRACON Structures and Materials Journal • 2010 • vol. 3 • nº 3
Seismic Hazard for Brazilian Northeastern Region
among the number of sub-regions that compose the total area. The results are presented in Table 2.
5. Probabilistic distribution of accelerations There are not yet available studies defining seismic attenuation functions for the Brazilian territory. Then, it is considered that the attenuation functions proposed by Toro et al. [11] for the regions of central and eastern United States, considered areas of low seis-micity within the U.S. territory, can be used in the case of Brazil, since it presents similar conditions of low seismicity. The function adopted is the following:
Where ag is the spectral horizontal acceleration in g units; R M =
(r 2 + C7 2)1/2, being r the distance to the epicenter (km); M is the magnitude of the earthquake; C1, C2, … C7 are constants that are different for different spectral frequency values, being their values reproduced in Table 3. 6. Calculation of periods of recurrence
With values of acceleration spectra calculated for each area element, and each range of magnitudes, it is possible to evaluate how many sub-regions (discretized elements) have accelerations (g’s) within the defined ranges. With these values, they are simply multiplied by the number of events that occur in one million years in each sub-region according to the considered magnitude, as presented in Table 2, and summed up for each interval of accelerations. The values of the pe-riod of recurrence were obtained by inverting the values of cumulative frequency. The evaluated results were listed according to the con-sidered magnitude and the spectral ranges of accelerations. As ex-amples of the obtained results, the results for the PGA (peak ground acceleration), corresponding to the frequency of 0 hertz), and the fre-quency of 10 hertz, are presented respectively in Tables 4 and 5.

379IBRACON Structures and Materials Journal • 2010 • vol. 3 • nº 3
S. H. C. SANTOS | S. SOUZA LIMA | F. C. M. SILVA
7. Nominal horizontal accelerations
According to NBR 15 421 [3], the period of recurrence established as the basic criterion for defining the nominal values of horizontal accelerations is 475 years. ASCE [12] assumes the values of hori-zontal accelerations equal to two thirds of the values of accelera-tions corresponding to the period of recurrence of 2475 years. In the sequel, the graphs of horizontal accelerations (g’s) ver-sus period of recurrence (years) calculated for the Northeast-ern region (Figures 5 and 6) are presented. In these graphs, the intersections of curves corresponding to each of the peri-ods considered in the construction of the spectra, with verti-
cal lines corresponding to the periods of recurrence of 475 years and 2475 years, give the values of the accelerations to be assigned in the spectra of equal probability, remember-ing that in the latter case, the factor of 2/3 should be applied.
8. Design Spectra
The concept of design spectrum is naturally linked to the concept of response spectrum. Response spectrum may be defined as a graph showing the maximum response, in terms of displacement, velocity or acceleration, depending on the natural period of sys-tem with one degree of freedom, considering a certain excitation.

380 IBRACON Structures and Materials Journal • 2010 • vol. 3 • nº 3
Seismic Hazard for Brazilian Northeastern Region
Response spectra for accelerations at the base are important in seismic analysis, because the accelerations produced by an earth-quake are the more significant way to characterize its effects on structures. With the response of a system of one degree of free-dom subjected to movement in its base, the equations of the dis-placements, velocities and accelerations of the mass relative to ba-sis of the structure can be obtained. Combining these equations,
we obtain a differential equation of relative motion whose solution provides the conditions to calculate displacements, velocities, and subsequently the absolute accelerations. For lightly damped sys-tems, the pseudo-acceleration Sa, defined in equation 6 is a good approximation of the absolute acceleration.Where ω represents the circular frequency and Sd the spectral displacement. The maximum values of absolute accelerations are called spec-tral accelerations and the variation of this quantity as a function of natural period is the spectrum of acceleration or response spec-trum. Design spectra are made from a set of response spectra for earthquakes that occurred at the site of interest by statistical criteria. Therefore, the response spectrum has no direct applica-tion in the design or verification of structures, since it represents a particular earthquake at a certain place and it is not assured that its features recur in future earthquakes. Within this context, from the graphs presented in item 7, the response spectra are obtained. As described above, the intersections of curves corresponding to the periods considered, with the lines for the recurrence periods of 475 years and 2475 years, give the values of the accelerations of the spectra of equal probability. These were, therefore, the values of horizontal accelerations used to define the design spectrum pre-sented in the graph shown in Figure 7. Table 6 presents the input data to define the spectrum of respons-es to the Northeastern region. In this table, the first column list all
the frequencies under which were made the graphs of horizontal acceleration (g’s) x period of recurrence (years) and the second column equals the inverse of the first, representing the periods (in seconds) corresponding to each frequently studied. The third col-umn lists the values of spectral accelerations obtained from the graphs of Figures 5 and 6 for the period of recurrence of 475 years. The fourth column lists the values of spectral accelerations for the period of recurrence of 2475 years. And finally, the fifth column lists the values of spectral accelerations of the fourth column mul-tiplied by 2/3 to meet the criterion of nominal values of horizontal accelerations according to ASCE [12].
9. Final remarks and conclusion The results presented in the graph in Figure 7 and the spectrum for the region, respectively, show that the design spectrum defined by NBR 15421 [3] (red curve) is conservative enough. It is important

381IBRACON Structures and Materials Journal • 2010 • vol. 3 • nº 3
S. H. C. SANTOS | S. SOUZA LIMA | F. C. M. SILVA
point out that the spectrum defined by the Brazilian Standard takes into account a period of recurrence of 475 years. Considering this, it can be observed in the graphs that the curve on the spectrum of standard exceeds the curve of response spectrum considering a recurrence time of 475 years (blue curve). It is also observed that the curve on the response spectrum obtained according to the ASCE [12] (yellow curve), where it is established that the nominal values of horizontal accelerations are taken as two thirds of the values corresponding to the time of recurrence 2475 years, is also covered by the design spectrum of NBR 15421 [3]. Therefore, NBR 15421 [3] appears to be conservative enough for this region and may be adopted as a standard reference for the de-sign spectrum to be used in seismic analysis of building structures.
10. References
[01] Santos, S.H.C., Souza Lima, S. Estudos da Zonificação Sísmica Brasileira Integrada em um Contexto Sul-Americano. In: Jornadas Argentinas de Ingeniería estructural, Buenos Aires, Argentina, 2004, Proceedings. [02] FALCONI, R.A. Espectros Sísmicos de Riesgo Uniforme para Verificar Desempeño Estructural em Países Latinoamericanos. XVII Seminário Iberoamericano de Ingeniería Sísmica, Mendoza, Argentina, 2003, Proceedings. [03] ASSOCIAÇÃO BRASILEIRA DE NORMAS TÉCNICAS. Projeto de Estruturas Resistentes a Sismos – Procedimento - NBR 15421, Rio de Janeiro, 2006. [04] SANTOS, S.H.C., Souza Lima, S. The New Brazilian Standard for Seismic Design. In: The 14th World Conference on Earthquake Engineering, Beijing, China, 2008, Proceedings. [05] GeoForschungsZentrum - Potsdam (GFZ). Global Seismic Hazard Map In: www.gfzpotsdam.de/pb5/ pb53/projects/en/gshap/menue_gshap_e.html, 1999. [06] United States Geological Survey. Seismic Hazard Map of South America. In: http://earthquake.usgs.gov/ research/hazmaps/index.php , 2006. [07] FALCONI, R.A., Baeza, A.G.H. Zonificación Seismic
en Bolivarian Countries. Instituto de Materiales y estructurales Models, Universidad Central de Venezuela, Caracas, Technical Bulletin, 2000, v.38 (3), p.27-41. [08] MARZA V.I., BARROS L.V., Chimpliganond C.N., Caixeta, D.F. Brief Characterization of Seismicity in Ceará. Brasília - Seismological Observatory, University of Brasilia. [09] B. GUTENBERG, CF RICHTER Frequency of Earthquakes in California. Bulletin of the Seismological Society of America, 1944, 185-188. [10] MCGUIRE R.K., Seismic Hazard and Risk Analysis. Earthquake Engineering Research Institute (EERIE), Oakland, California, USA, 2004. [11] TORO G.R., ABRAHAMSON N.A., SCHNEIDER J.F. Model of Strong Ground Motions from Earthquakes in Central and Eastern North America: Best Estimates and Uncertainties. Seismological Research Letters 1997, 41-57. [12] AMERICAN SOCIETY OF CIVIL ENGINEERS (ASCE). Minimum Design Loads for Buildings and Other Structures (ASCE / SEI 7-05). Washington, DC, 2005.