seismic evaluation and retrofit of an ... of engineering sciences, assiut university, vol. 36, no....
TRANSCRIPT

Journal of Engineering Sciences, Assiut University, Vol. 36, No. 2, pp. 313-335, March 2008
313
SEISMIC EVALUATION AND RETROFIT OF AN ASYMMETRIC REINFORCED CONCRETE FLAT SLAB BUILDING
Waleed Abo El-Wafa Mohamed Lecturer, Civil Engineering Department, Faculty of Engineering, Assiut
University, Assiut, Egypt
Mostafa Abdou Abd El-Naiem Lecturer, Civil Engineering Department, Faculty of Engineering, Assiut
University, Assiut, Egypt
(Received December 9, 2007 Accepted February 20, 2008)
Seismic performance evaluation of existing structures and retrofit
strategies are considered as a complicated multi-criteria problem. This
study presents a performance evaluation of a gravity load designed or
designed to earlier codes six stories asymmetrical flat slab building.
Building with flat slab system may lack the required lateral stiffness to
withstand seismic lateral loads. Three different retrofit systems to
increase the lateral strength and stiffness of the building are proposed
and examined. These systems include the addition of external frames,
using shear walls and introducing steel knee bracing. The 3-D nonlinear
pushover analysis procedure is utilized in evaluating the seismic
performance of the original building and the retrofitted one, capacity and
demand spectrum curves are presented for each studied case. The results
are compared with elastic time history analysis method. Three different
real earthquake records with intensities suitable for zones I, III and IV
appeared in the renewed (2003) version of the Egyptian code of loads are
utilized. It is found that the applied 3-D nonlinear analysis can be
considered as a powerful tool in evaluating the seismic performance of
frame structures. The study also shows that how can every suggested
retrofitting system upgrade the seismic behavior of the gravity load
designed flat slab building. Cost analysis comparison study is carried out.
KEYWORDS: seismic evaluation, nonlinear pushover analysis, flat
slab building, retrofit systems, strength and stiffness
1. INTRODUCTION
The seismic performance evaluation and upgrading of non-seismic designed building
structures located in new seismic zones is considered as an innovative challenge for
seismic engineers and researchers. This concept has become an urgent issue in Egypt
after the potential damage observed for many buildings during 1992 and 1995 quakes
to achieve the purpose of seismic hazard mitigation. The seismic risk analysis of
buildings is important for identifying the seismic vulnerability of structural systems
under the effect of seismic ground motions [1], [2]. A great task for seismic engineers
Waleed Abo El-Wafa Mohamed and Mostafa Abdou Abd El-Naiem 314
and researchers is to decide how to retrofit an existing structure to upgrade its seismic
capacity and to what level of protection [3].
Flat slab building structure is widely used due to many advantages it posses
over the moment resisting frames. It provides lower building heights, unobstructed
space, architectural flexibility and easier frame work. However, due to lack of deep
beams and/or shear walls, the resulted transverse stiffness will be low. This may lead to
potential damage even when subjected to earthquakes with moderate intensity. The
brittle punching failure due to transfer of shear forces and unbalanced moments
between slabs and columns may cause serious problems. Flat slab systems are also
susceptible to significant reduction in stiffness resulting from the cracking that occurs
from construction loads, service gravity and lateral loads [4]. The importance of
accurately evaluating the seismic performance of flat slab structures highly increases
when the structure is asymmetric in plan due to the torsional effects; in this case, the
3-D analysis of the full structure is required. Due to the previous mentioned reasons,
and due to the tremendous number of buildings that use this system, effective and
economic retrofit systems should be provided for the weak buildings.
There are many retrofit systems developed for RC buildings. Essentially, there
are two main retrofitting techniques, the first is considered as non-conventional
method, which incorporates base isolation and energy dissipation systems. This
technique aims to increase the structural ductility and hence reduce the earthquake
demand. The practical applicability of this technique is somehow limited. The second
one is the system of strengthening and stiffening which is considered the most common
seismic performance improvement strategies adopted for buildings with inadequate
lateral force resisting systems. Typical systems employed for stiffening and
strengthening include column strengthening and the addition of new vertical elements
as moment resisting frames, shear walls or braced frames. The philosophy here is to
provide systems that are strong enough to resist the seismic forces and light enough to
keep the structural elements from needing further reinforcement [5], [6]. Most of the
existing methods need emptying the building during the retrofitting process, which
creates serious problems due to the evacuation of the building during the retrofit
process. Therefore, it is highly preferable that these systems could be installed quickly
and eliminates the need to distribute the occupants of the existing structure [7].
Nonlinear time history analysis of a detailed analytical model may be the best
decision for estimating the damage. However, there are many uncertainties due to the
selection of specific input and with the analytical models representing the behavior of
the structure. Pushover analysis monitors the progressive stiffness degradation of a
structure as it is loaded into the post elastic range. The inelastic static pushover
analysis is an effective option for estimating the strength capacity and highlighting
potential weak areas in the structure. The method allows tracing the sequence of
yielding and failure of the members and also capture the overall capacity curve of the
structure. The static pushover procedure has been recommended as a tool for design
and assessment purposes by many associations as the National Earthquake Hazard
Reduction Program 'NEHRP' (FEMA 273) [8] guidelines for the seismic rehabilitation
of existing buildings and the Seismic Evaluation and Retrofit of Concrete Buildings
ATC-40) [9]. The technique has been used and evaluated as the main tool of analysis in
several studies [10]- [14].

SEISMIC EVALUATION AND RETROFIT OF AN ASYMMETRIC …
315
The seismic design provisions and analysis methods appeared in the 2003
version of the Egyptian Code of Loads (ECL 201) [15] are considered a significant step
toward improving the seismic behavior of buildings constructed in Egypt. The concept
of retrofitting and upgrading gravity load designed or designed according to earlier
codes that do not guarantee seismic protections is considered important. However, the
Egyptian Code of Practice for design and construction of concrete structures (ECCS
203) [16] or (ECL 201) [15] do not offer provisions about how to deal with such
branch neither recommendations about the suitable approaches of evaluations and the
acceptable performance limits.
The purpose of this study is to offer a seismic performance evaluation of a
gravity load designed six stories asymmetric flat slab building with plan dimensions of
36.0 m x 30.0 m fewer than three different earthquake levels. Three different
retrofitting techniques are suggested and evaluated, these techniques include the
addition of external frames, using shear walls and introducing steel knee bracing. All
these systems are external systems, which do not require the evacuation of the
building. 3-D nonlinear pushover analysis is adopted to evaluate the performance of
the existing and retrofitted structure. Moreover, an elastic time history analysis is
carried out. The objectives of this investigation can be summarized as:
(i) To examine the seismic performance of non-seismic flat slab building under three
different earthquake levels.
(ii) Suggest three different retrofitting systems and compare there performances.
(iii) Apply the approach of nonlinear pushover analysis and compare it with the elastic
time history analysis.
(iv) Present comparative cost analysis.
2. ORIGINAL BUILDING DESCRIPTION AND MODELING
The studied building is a six stories reinforced concrete office building. The plan
measures 36.0 meter by 30 meter. A typical bay width is 6.0 m in both directions, the
configuration of the building resulted in the L-shaped plan shown in Fig. 1. The
building has six stories with height from the ground of 18.5 m, the typical story height
is 3.0 m except the first story, which has a height of 3.5 m, and no basement is
presented. The gravity load resisting system consists of 0.22 m thickness two-way flat
slabs carrying the floor loads to interior columns and perimeter frames. The lateral load
resisting system is only the relatively rigid slabs through frames and columns. The
perimeter frames consist of beams and columns with rectangular sections, the interior
columns have square sections. The dimensions and reinforcement of the interior
columns vary with height; every successive two stories have the same dimensions and
reinforcement, as shown in Table 1. The perimeter columns have fixed dimensions of
0.30 x 0.75 m over height and fixed reinforcement of 14 Ø 22.
The compressive strength of concrete used in the building is 22.50 MPa while
the used steel is mild steel with yield strength of 240 MPa. The three dimensional
nonlinear pushover and linear time history are constructed and analyzed using ETABS
software package, nonlinear version 8 [17].

Waleed Abo El-Wafa Mohamed and Mostafa Abdou Abd El-Naiem 316
Fig. 1: Plan of the investigated building
Table 1: Variation of dimensions and reinforcement of interior columns over height
Stories 1 & 2 3 & 4 5 & 6
Interior
columns
Dim. Reinf. Dim. Reinf. Dim. Reinf.
0.65 x 0.65 16 Ø 16 0.50 x 0.50 12 Ø 16 0.40 x 0.40 8 Ø 16
3. ACCELERATION RECORDS
Egypt is in low to medium seismicity region and subjected to frequent moderate
earthquakes. The new edition of the (ECL 201) which was renewed in 2004, has
divided Egypt to five different seismic zones. These zones are identified by their Peak
Ground Accelerations (PGA) which range from 0.1g to 0.25g.
In this investigation, set of three real earthquakes records of different
intensities ranging between 0.097 to 0.215 are selected to cover a wide spectrum of
frequency and meet the range of peak ground accelerations selected for Egypt. The
three selected records are:
1- Aqaba 1995 (Aqb.), E-W component, peak ground acceleration = 0.097 g and peak
velocity of 0.14 m/s. The duration of this quake is 60 second. This quake is
considered as level I quake.
2- Victoria, Mexico 1980 (Mex.), peak ground acceleration = 0.15 g and peak velocity
of 0.248. The time duration is 26.92 sec. This quake is considered as level II quake.
6.0 6.0 6.0 6.0 6.0 6.0
36.0 m
6.0
6.0
6.0
6.0
6.0
30.0
m
1 2 3 4 5 6 7
A
B
C
D
E
F
3,5
Stair
Beam 0.25x0.60Interior columns
Exterior columns
4,5

SEISMIC EVALUATION AND RETROFIT OF AN ASYMMETRIC …
317
3- El Centro 1940 (ELC.), of peak ground acceleration = 0.215 g and peak velocity of
0.302 m/sec. Time duration is 40 sec. The quake is considered as level III quake.
These quakes are applied either in longitudinal or transverse directions. As the
period of the investigated building is about 0.95 sec, which is within the effective
period of the applied quakes, the actual response spectra of the selected quakes is
normalized and used in the analysis, the dominant period in the elastic type 1 spectrum
suggested by (ECL 201) is much less than the period of the investigated building. Fig.
2 shows the time history of the selected earthquakes while Fig. 3 shows the
acceleration response spectra for 5% damping.
Fig. 2 : Time history of earthquake records
Fig. 3 : Acceleration response spectra
0 5 10 15 20 25 30 35 40
-0.2
-0.1
0
0.1
0.2
Tak
Elc.
Aqb.
0 5 10 15 20 25 30 35 40 45 50 55 60
-0.2
-0.1
0
0.1
0.2
Time (sec)
Acc
eler
atio
n (g
)
Time (sec)
Acc
eler
atio
n (g
)
Acc
eler
atio
n (g
)
Time (sec)
0 5 10 15 20 25
-0.2
-0.1
0
0.1
0.2
Fer
Mex.
15 20 235 140
0 1 2 3 4 50
0.1
0.2
0.3
0.4
0.5
0.6
Tak
Elc.
Aqb.
0 1 2 3 4 50
0.1
0.2
0.3
0.4
0.5
0.6
Period (sec)
Spec
tral A
cc. (
g)
Period (sec)
Spec
tral A
cc. (
g)
Spec
tral A
cc. (
g)
Period (sec)
15 20 235 140
0 1 2 3 4 50
0.1
0.2
0.3
0.4
0.5
0.6
Fer
Mex.
Waleed Abo El-Wafa Mohamed and Mostafa Abdou Abd El-Naiem 318
4- NONLINEAR PUSHOVER AND EVALUATION METHODOLOGY
The recent advent of performance based design has brought the nonlinear static
pushover analysis procedure to the forefront. The pushover analysis procedure is
performed by employing the capacity spectrum method. The structure is loaded first
with vertical gravity loads, then pushed with incrementally increased static equivalent
earthquake loads until the specified level of roof drift is reached. With the increase in
the magnitude of loading, weak links and failure modes of the structure are found. The
post elastic degradation of the flexural stiffness of a frame member begins when the
material fibers furthest from the neutral axis of the cross section experience initial
yielding. Under increasing moment, the degradation continues as plasticity spreads
through the section depth and along the member length to form a fully developed
plastic hinge, at which the flexural stiffness of the member section is exhausted.
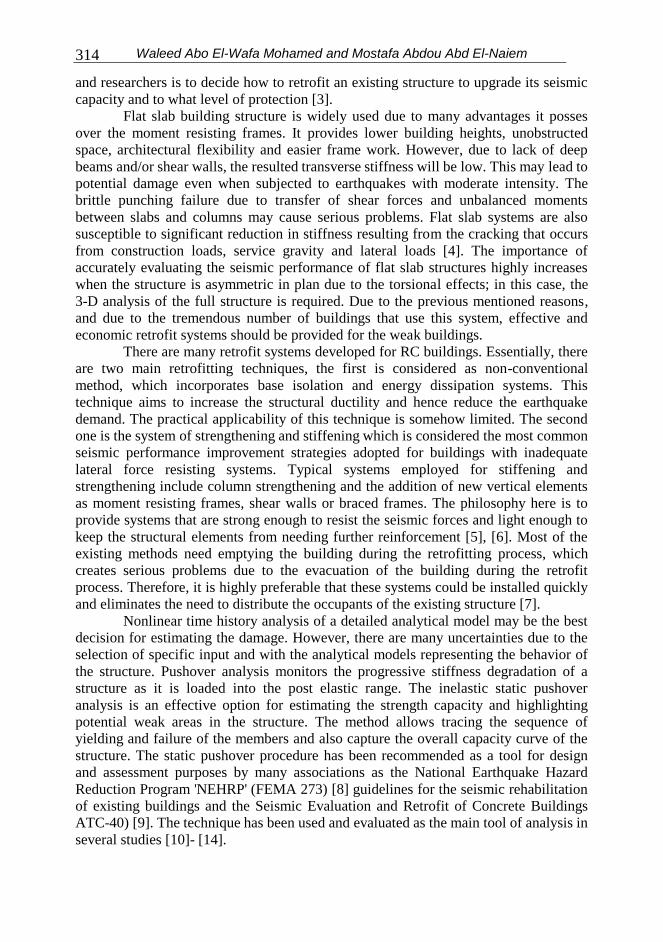
The methodology of pushover analysis concentrates on the formulation of the
inelastic capacity curve for the structure. This curve is a plot of the horizontal
movement of the structure as it is pushed to one side. Initially the plot is a straight line
as the structure moves linearly, as the parts of the structure yields the plot begins to
curve. The generation of the capacity curve defines the capacity of the building
uniquely and independently of any specific seismic demands, it replaces the base shear
capacity of traditional procedures. When an earthquake displaces the building laterally,
its response is represented by a point on the curve (performance point). This point
defines a specific damage state for the building.
The methodology of the pushover performance analysis can be summarized in
four steps as follows:
1- Idealizing the structure as a nonlinear model: A model of the entire structure is built
from nonlinear representation of all of its elements and components.
2- Determining the capacity spectrum of the structure: The central focus of the
simplified nonlinear procedure is the generation of the pushover or capacity curve
This represents the lateral displacement as a function of the force applied to the
structure. This process is independent of the method used to calculate the demand
and provide valuable insight about the building. A schematic diagram displays the
capacity curve of a building is shown in Fig. 4.
Fig. 4 : Capacity curve of a structure
Force, V
Displacement , δ

SEISMIC EVALUATION AND RETROFIT OF AN ASYMMETRIC …
319
3- Determination of the demand spectrum and performance point: The elastic
spectrum of the effective applied earthquake (5% damped) is determined and is
reduced depending on the inelastic behavior of the structure to intersect the capacity
curve to find a performance point (a p , d p). This spectrum is plotted in spectral
ordinates (ADRS) format showing the spectral acceleration S a as a function of
spectral displacement S d. The equal displacement point (a o , d o) is a good starting
point for the iterative process. A schematic diagram illustrates this process is
presented in Fig. 5.
Fig. 5 : Determination of performance point
4- Specify the performance of the structure according to the applied criteria: Using the
Performance Point or Target Displacement, the global response of the structure and
individual component deformations are compared to limits in light of the specific
performance goals of the structure. In this study, the ATC-40 [ 9 ] guidelines are
used to define the force-deformation criteria for hinges used in the pushover
analysis. As shown in Fig. 6, five points labeled A, B, C, D and E are used to define
the force deflection behavior of the hinge and three points labeles IO, LS and CP
are used to define the acceptance criteria of the hinge. (IO, LS and CP stand for
Immediate Occupancy, Life Safety and Collapse Prevention, respectively). The
values assigned to each of these points vary depending on the type of member as
well as many other parameters defined in the guidelines.
Fig. 6 : Force- deformation for pushover hinge
S a Initial seismic demand
d o d p S d
Capacity spectrum
Reduced seismic demand
Performance point
a p a o
Force
Deformation
B
IO
A
LS CP
C
D E
Waleed Abo El-Wafa Mohamed and Mostafa Abdou Abd El-Naiem 320
5 - RETROFITTING SYSTEMS
The basic safety objective requires that for the required performance level, the gravity
resistance of the frame should be enhanced, the deformation in the frame columns
should be limited and the vulnerability of the frame columns to shear failure should be
reduced. The suggested and investigated retrofitting systems are based on adding new
simple technique to constitute a primary system for seismic resistance while keeping
the existing building as a secondary system mainly responsible for carrying the gravity
loads. A number of alternatives are available to provide the needed strength and
stiffness to satisfy the required performance characteristics. A review of some
parameters as desired performance level, the existing architectural character of the
building, the level of the disruption associated with each system and the access
required to execute the required construction is carried out. Relying on this review,
three retrofitting systems are suggested and evaluated in this study. A preliminary
approach to design these systems using the nonlinear pushover analysis to find
performance points within required deformation limit is carried out. The applied
systems are briefly described as follows:
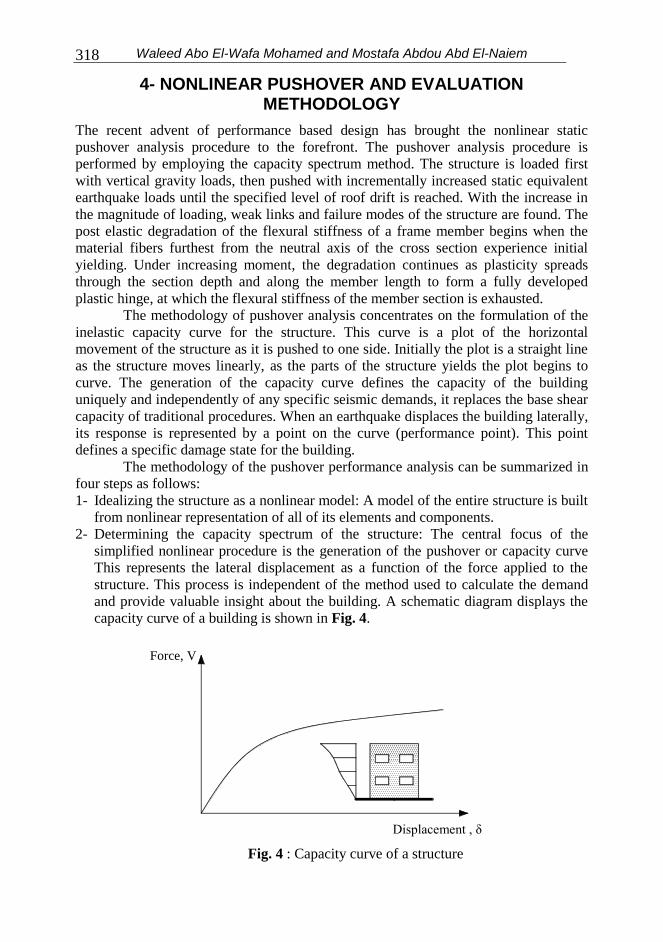
System I, Adding new exterior frames (St.): Two new R.C. exterior frames are
added to the building, one is in the longitudinal direction adjacent to frame along axis
A, between axes 2 and 6, the other is in the transverse direction adjacent to frame
along axis 1, between axes A and F. The columns of the applied frames have section of
1.0 x 0.35 m and fixed reinforcement of 20 Ø 22. The new beams are with overall
depth of 0.8 m and width of 0.3 m, the main reinforcement is 5 Ø 22 at regions of
positive and negative moments. An elevation of the two frames is presented in Fig. 7.
(a) Frame in longitudinal direction (b) Frame in transverse direction
Fig. 7 : Elevation of the two new exterior frames
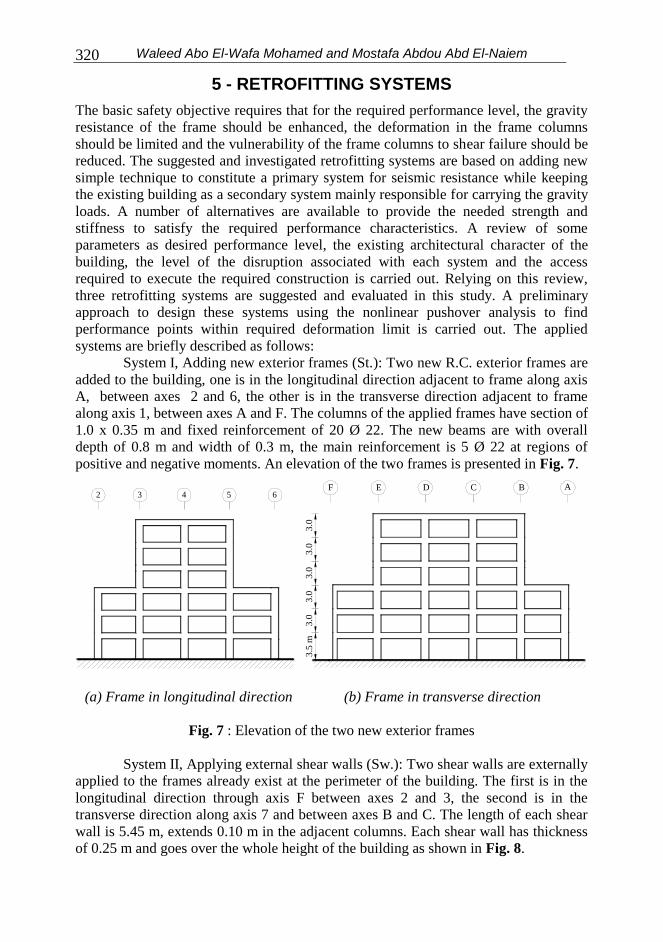
System II, Applying external shear walls (Sw.): Two shear walls are externally
applied to the frames already exist at the perimeter of the building. The first is in the
longitudinal direction through axis F between axes 2 and 3, the second is in the
transverse direction along axis 7 and between axes B and C. The length of each shear
wall is 5.45 m, extends 0.10 m in the adjacent columns. Each shear wall has thickness
of 0.25 m and goes over the whole height of the building as shown in Fig. 8.
65432
3.5
m3
.03
.03
.03
.03
.0
F E D C B A
SEISMIC EVALUATION AND RETROFIT OF AN ASYMMETRIC …
321
(a) Frame in longitudinal direction (b) Frame in transverse direction
Fig. 8 : Elevation of the original frames with the new inserted shear walls
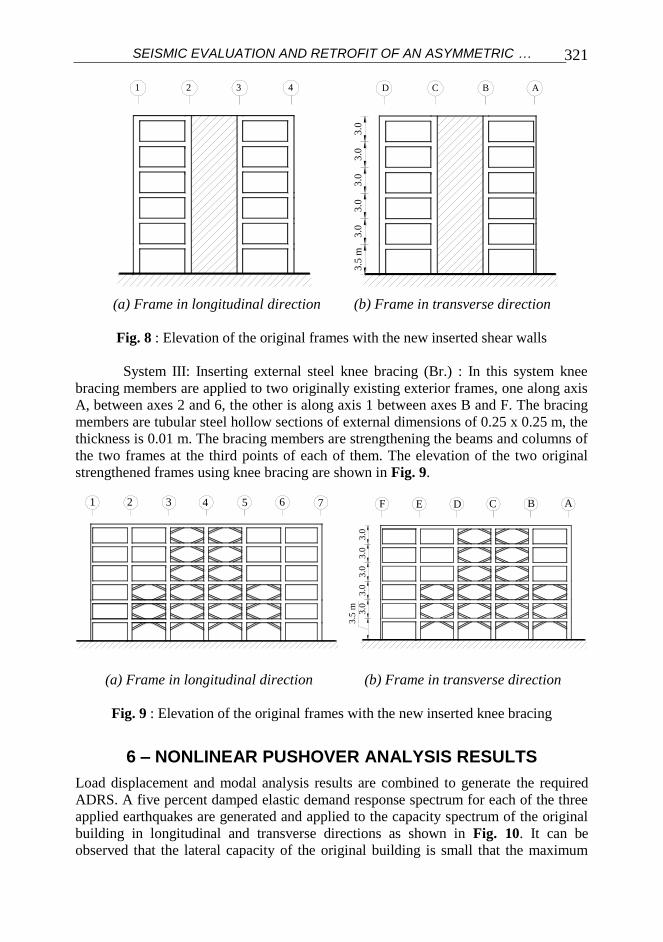
System III: Inserting external steel knee bracing (Br.) : In this system knee
bracing members are applied to two originally existing exterior frames, one along axis
A, between axes 2 and 6, the other is along axis 1 between axes B and F. The bracing
members are tubular steel hollow sections of external dimensions of 0.25 x 0.25 m, the
thickness is 0.01 m. The bracing members are strengthening the beams and columns of
the two frames at the third points of each of them. The elevation of the two original
strengthened frames using knee bracing are shown in Fig. 9.
(a) Frame in longitudinal direction (b) Frame in transverse direction
Fig. 9 : Elevation of the original frames with the new inserted knee bracing
6 – NONLINEAR PUSHOVER ANALYSIS RESULTS
Load displacement and modal analysis results are combined to generate the required
ADRS. A five percent damped elastic demand response spectrum for each of the three
applied earthquakes are generated and applied to the capacity spectrum of the original
building in longitudinal and transverse directions as shown in Fig. 10. It can be
observed that the lateral capacity of the original building is small that the maximum
3.5
m3
.03
.03
.03
.03
.0
ABCD1 2 3 4
62 3 4 51 7 BCDE
3.0
3.0
3.0
3.0
3.0
3.5
m
AF

Waleed Abo El-Wafa Mohamed and Mostafa Abdou Abd El-Naiem 322
value of spectral acceleration exhibited by the building does not exceed 0.11. The
original building fails to intersect the elastic spectra for Mex. or Elc. quakes while it
can hardly intersect the elastic spectra of Aqb. quake at the almost the end of the
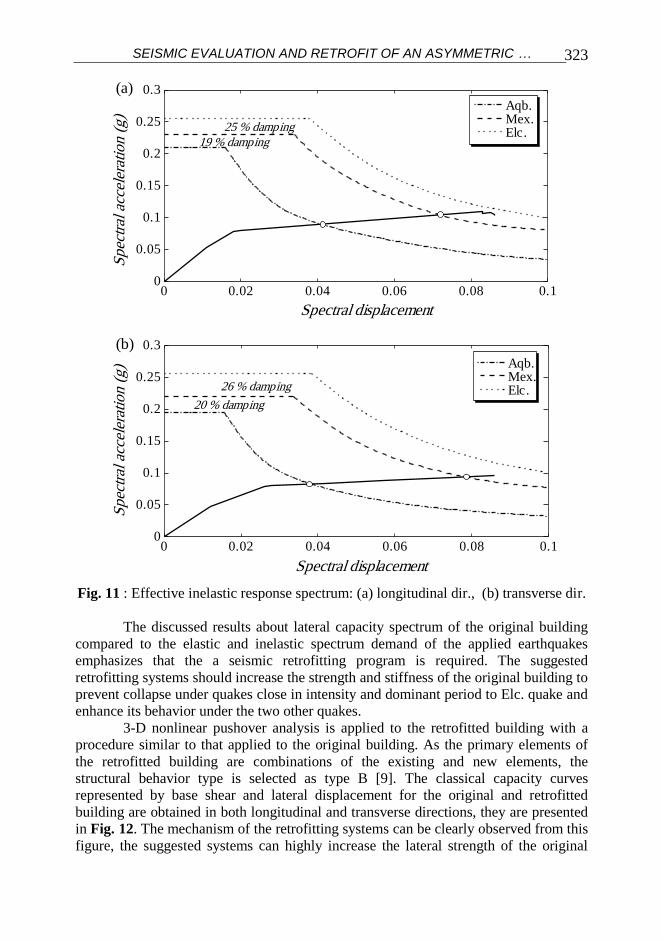
response. The effective inelastic damping of the applied earthquakes are calculated
using the reduction factors for both acceleration and velocity then applied to original
building in longitudinal and transverse direction, observe Fig. 11. The effective
inelastic damping ratios calculated for Aqb. and Mex. quakes reaches up to 20% and
26%, respectively. This inelastic response enables the original building to meet the
inelastic response of the two quakes (for Mex. quake the performance point is almost at
the end of performance) in performance point coordinates of (0.041, 0.09 g) and (0.073,
0.10 g), respectively for the longitudinal direction. These values are (0.038, 0.08 g) and
(0.079, 0.094 g) for the transverse direction. It can be seen that the original structure is
not capable of achieving any performance level under Elc. quake.
0 0.02 0.04 0.06 0.08 0.10
0.05
0.1
0.15
0.2
0.25
0.3
Spectral displacement
Sp
ectr
al a
ccel
erat
ion
(g
)
(b)
Capacity Aqb. Mex. Elc.
Aqb. Mex. Elc.
19 % damping
25 % dampingS
pec
tral
acc
eler
atio
n (
g)
Spectral displacement
(a)
55 25 200 105
Aqb. Mex. Elc.
Aqb. Mex. Elc.
55 105 200 185
0 0.02 0.04 0.06 0.08 0.10
0.1
0.2
0.3
0.4
0.5
0.6
0 0.02 0.04 0.06 0.08 0.10
0.05
0.1
0.15
0.2
0.25
0.3
Spectral displacement
Sp
ectr
al a
ccel
erat
ion
(g
)
(b)
Capacity Aqb. Mex. Elc.
Aqb. Mex. Elc.
19 % damping
25 % damping
Sp
ectr
al a
ccel
erat
ion
(g
)
Spectral displacement
(b)
55 25 200 105
Aqb. Mex. Elc.
Aqb. Mex. Elc.
55 105 200 185
0 0.02 0.04 0.06 0.08 0.10
0.1
0.2
0.3
0.4
0.5
0.6
y
no
Fig. 10 : Five percent damped elastic spectrum: (a) longitudinal dir., (b) transverse dir.
SEISMIC EVALUATION AND RETROFIT OF AN ASYMMETRIC …
323
0 0.02 0.04 0.06 0.08 0.10
0.05
0.1
0.15
0.2
0.25
0.3
Spectral displacement
Sp
ectr
al a
ccel
erat
ion
(g
)
(a)
Capacity Aqb. Mex. Elc.
Aqb. Mex. Elc.
19 % damping
25 % dampingS
pec
tral
acc
eler
atio
n (
g)
Spectral displacement
20 % damping
26 % damping
(b)
55 25 200 105
Aqb. Mex. Elc.
Aqb. Mex. Elc.
55 105 200 185
0 0.02 0.04 0.06 0.08 0.10
0.05
0.1
0.15
0.2
0.25
0.3
0 0.02 0.04 0.06 0.08 0.10
0.05
0.1
0.15
0.2
0.25
0.3
Spectral displacement
Sp
ectr
al a
ccel
erat
ion
(g
)
(a)
Capacity Aqb. Mex. Elc.
Aqb. Mex. Elc.
19 % damping
25 % dampingS
pec
tral
acc
eler
atio
n (
g)
Spectral displacement
20 % damping
26 % damping
(b)
55 25 200 105
Aqb. Mex. Elc.
Aqb. Mex. Elc.
55 105 200 185
0 0.02 0.04 0.06 0.08 0.10
0.05
0.1
0.15
0.2
0.25
0.3
Fig. 11 : Effective inelastic response spectrum: (a) longitudinal dir., (b) transverse dir.
The discussed results about lateral capacity spectrum of the original building
compared to the elastic and inelastic spectrum demand of the applied earthquakes
emphasizes that the a seismic retrofitting program is required. The suggested
retrofitting systems should increase the strength and stiffness of the original building to
prevent collapse under quakes close in intensity and dominant period to Elc. quake and
enhance its behavior under the two other quakes.
3-D nonlinear pushover analysis is applied to the retrofitted building with a
procedure similar to that applied to the original building. As the primary elements of
the retrofitted building are combinations of the existing and new elements, the
structural behavior type is selected as type B [9]. The classical capacity curves
represented by base shear and lateral displacement for the original and retrofitted
building are obtained in both longitudinal and transverse directions, they are presented
in Fig. 12. The mechanism of the retrofitting systems can be clearly observed from this
figure, the suggested systems can highly increase the lateral strength of the original

Waleed Abo El-Wafa Mohamed and Mostafa Abdou Abd El-Naiem 324
building. The percentage increase in strength for the building with different retrofitting
systems ranges between 90 to 99% in the longitudinal direction and between 88% to
98% in the transverse direction, relative to the strength of the original building. These
percentage ratios give a glance that the capacity base shear curves of the retrofitted
building with different systems have similar trends. The observed stiffness of the
retrofitted building also increased but with ratios much less than those of the strength.
0 0.02 0.04 0.06 0.08 0.1 0.120
1
2
3
4
5
6
7
Org. St. Sw. Br.
Bas
e sh
ear
(MN
.m)
(a)
Monitored lateral displacement (m)
0 0.02 0.04 0.06 0.08 0.1 0.120
1
2
3
4
5
6
7
Org. St. Sw. Br.
Bas
e sh
ear
(MN
.m)
(a)
Monitored lateral displacement (m)
70 65 210 145
Bas
e sh
ear
(MN
.m)
(b)
Org. St. Sw. Br.
Monitored lateral displacement (m)
70 145 210 225
0 0.02 0.04 0.06 0.08 0.1 0.120
1
2
3
4
5
6
7
Fig. 12 : Base shear versus lateral displacement (a) longitudinal dir., (b) transverse dir.
The capacity spectrum curves defined by spectrum displacement and spectrum
acceleration (ADRS) are calculated and plotted for the building with different
retrofitting systems relying on the pushover analysis. The performance points resulting
from the intersection between nonlinear capacity spectrum and reduced effective
earthquake spectrum are illustrated in Figs. 13 to 15. It can be realized that all
suggested retrofitting systems succeed in highly increasing the spectrum acceleration

SEISMIC EVALUATION AND RETROFIT OF AN ASYMMETRIC …
325
associated with the original building, this increase is considered as a direct result of
increasing the lateral stiffness of the building. The ratios of maximum increase in
spectrum acceleration is not less than 120 % relative to the original building, this ratio
increases in some cases to reach up to 267 %. The highest ratios are observed for Sw.,
Br. and St. systems, respectively, the ratios of percentage increase in acceleration are
shown in Table 2. As the suggested retrofitting systems are applied to increase the
stiffness and strength of the original building rather than increasing its ductility, the
percentage increase in spectrum displacement for the retrofitted building have small
values relative to the spectrum acceleration. These ratios range between 9.67 % and
25.43 % as shown in Table 3. The increase in capacity spectrum acceleration of the
retrofitted building enables the capacity spectrum of the building from safely
intersecting the reduced demand spectrum of the different applied quakes.
0 0.02 0.04 0.06 0.08 0.10
0.05
0.1
0.15
0.2
0.25
0.3
Spectral displacement
Sp
ectr
al a
ccel
erat
ion
(g
)
(a)
Capacity Aqb. Mex. Elc.
Aqb. Mex. Elc.
19 % damping
25 % damping
Sp
ectr
al a
ccel
erat
ion
(g
)
Spectral displacement
13 % damping
19 % damping
(a)
55 25 200 105
Aqb. Mex. Elc.
Aqb. Mex. Elc.
55 105 200 185
23 % damping
0 0.02 0.04 0.06 0.08 0.10
0.05
0.1
0.15
0.2
0.25
0.3
0.35
Retrofitted
Original
0 0.02 0.04 0.06 0.08 0.10
0.05
0.1
0.15
0.2
0.25
0.3
Spectral displacement
Sp
ectr
al a
ccel
erat
ion
(g
)
(a)
Capacity Aqb. Mex. Elc.
Aqb. Mex. Elc.
19 % damping
25 % damping
Sp
ectr
al a
ccel
erat
ion
(g
)
Spectral displacement
11 % damping18 % damping
(b)
55 25 200 105
Aqb. Mex. Elc.
Aqb. Mex. Elc.
55 105 200 185
21 % damping
0 0.02 0.04 0.06 0.08 0.10
0.05
0.1
0.15
0.2
0.25
0.3
0.35
st y
Original
Retrofitted
Fig. 13 : Response spectra of St. system (a) longitudinal dir., (b) transverse dir.

Waleed Abo El-Wafa Mohamed and Mostafa Abdou Abd El-Naiem 326
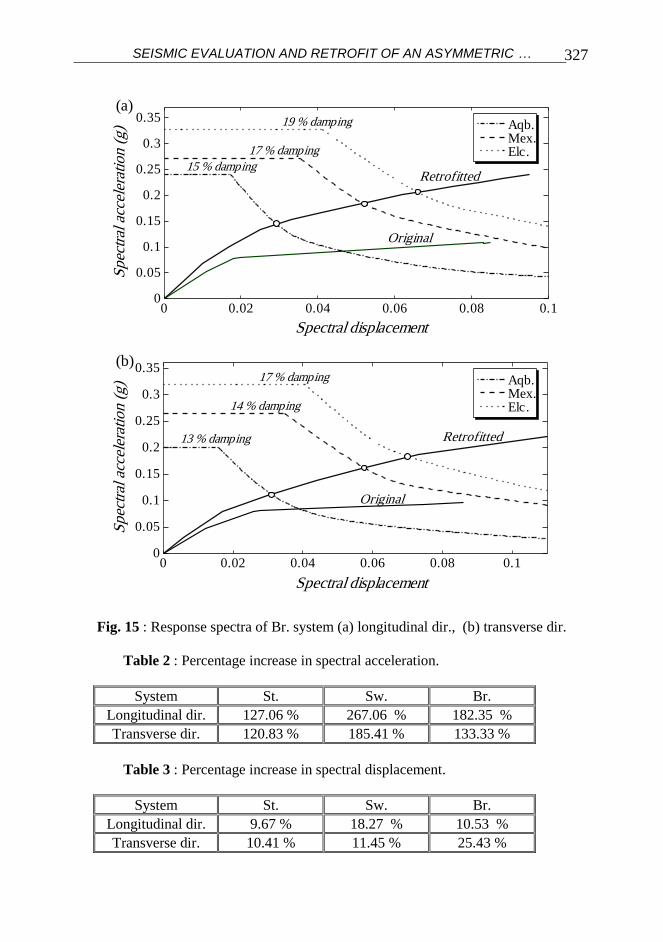
The performance points associated with the original building are successfully
shifted towards highly enhancing the seismic behavior of the building. This enhanced
performance is considered as a direct result of applying the suggested retrofitting
systems which highly increase the strength of the building and hence the capacity
spectral acceleration. The effectiveness of this shift increases as the spectral
displacement of the retrofitted building itself increased. A notable point that can be
realized is that the effective damping of the reduced spectrum of the earthquakes
applied to the original structure is reduced for the same quakes applied to the retrofitted
building. The calculated inelastic effective damping for Mex. quake does not exceed
19%, 15% and 17% for St., Sw. and Br. systems while for the original structure this
values was up to 26%. The reduction in the effective damping results from the
corresponding reduction in the hysteretic plastic behavior of the building, the values of
the effective damping are illustrated in Figs. 13 to 15.
0 0.02 0.04 0.06 0.08 0.10
0.05
0.1
0.15
0.2
0.25
0.3
Spectral displacement
Sp
ectr
al a
ccel
erat
ion
(g
)
(a)
Capacity Aqb. Mex. Elc.
Aqb. Mex. Elc.
19 % damping
25 % dampingS
pec
tral
acc
eler
atio
n (
g)
Spectral displacement
12 % damping
16 % damping
(a)
55 25 200 105
Aqb. Mex. Elc.
Aqb. Mex. Elc.
55 105 200 185
18 % damping
0 0.02 0.04 0.06 0.08 0.10
0.05
0.1
0.15
0.2
0.25
0.3
0.35
0.4
sw x
Original
Retrofitted
0 0.02 0.04 0.06 0.08 0.10
0.05
0.1
0.15
0.2
0.25
0.3
Spectral displacement
Sp
ectr
al a
ccel
erat
ion
(g
)
(a)
Capacity Aqb. Mex. Elc.
Aqb. Mex. Elc.
19 % damping
25 % damping
Sp
ectr
al a
ccel
erat
ion
(g
)
Spectral displacement
11 % damping
15 % damping
(b)
55 25 200 105
Aqb. Mex. Elc.
Aqb. Mex. Elc.
55 105 200 185
17 % damping
Original
Retrofitted
0 0.02 0.04 0.06 0.08 0.10
0.05
0.1
0.15
0.2
0.25
0.3
0.35
0.4
Fig. 14 : Response spectra of Sw. system (a) longitudinal dir., (b) transverse dir.
SEISMIC EVALUATION AND RETROFIT OF AN ASYMMETRIC …
327
0 0.02 0.04 0.06 0.08 0.10
0.05
0.1
0.15
0.2
0.25
0.3
Spectral displacement
Sp
ectr
al a
ccel
erat
ion
(g
)
(a)
Capacity Aqb. Mex. Elc.
Aqb. Mex. Elc.
19 % damping
25 % damping
Sp
ectr
al a
ccel
erat
ion
(g
)
Spectral displacement
15 % damping
17 % damping
(a)
55 25 200 105
Aqb. Mex. Elc.
Aqb. Mex. Elc.
55 105 200 185
19 % damping
Original
Retrofitted
0 0.02 0.04 0.06 0.08 0.10
0.05
0.1
0.15
0.2
0.25
0.3
0.35
no
0 0.02 0.04 0.06 0.08 0.10
0.05
0.1
0.15
0.2
0.25
0.3
Spectral displacement
Sp
ectr
al a
ccel
erat
ion
(g
)(a)
Capacity Aqb. Mex. Elc.
Aqb. Mex. Elc.
19 % damping
25 % damping
Sp
ectr
al a
ccel
erat
ion
(g
)
Spectral displacement
13 % damping
14 % damping
(b)
55 25 200 105
Aqb. Mex. Elc.
Aqb. Mex. Elc.
55 105 200 185
17 % damping
Original
Retrofitted
0 0.02 0.04 0.06 0.08 0.10
0.05
0.1
0.15
0.2
0.25
0.3
0.35
br y
Fig. 15 : Response spectra of Br. system (a) longitudinal dir., (b) transverse dir.
Table 2 : Percentage increase in spectral acceleration.
System St. Sw. Br.
Longitudinal dir. 127.06 % 267.06 % 182.35 %
Transverse dir. 120.83 % 185.41 % 133.33 %
Table 3 : Percentage increase in spectral displacement.
System St. Sw. Br.
Longitudinal dir. 9.67 % 18.27 % 10.53 %
Transverse dir. 10.41 % 11.45 % 25.43 %

Waleed Abo El-Wafa Mohamed and Mostafa Abdou Abd El-Naiem 328
Based on the pushover analysis the sequence of hinging of beams and columns
is studied for both original and retrofitted building under the different applied
earthquake levels, the number and type of hinges associated with the rehabilitation
building at the performance points are shown in Tables 4 and 5.
It can be observed that under Aqb. (level I quake), the retrofitted building with
any of the suggested systems can shift the performance of the original building from
life safety (LS) performance limit to immediate occupancy (IO) performance limit. For
this level of performance the maximum number of elements with plastic rotations up to
0.005 does not exceed 11% of the total number of elements.
Affected by Mex. (level II quake), applied in the longitudinal direction, it can
be observed that only one element of the retrofitted building exhibits performance
criteria of collapse preventions (CP), as the case of St. system. The behavior of all
elements of the other two systems do not exceed the life safety (LS) criteria. The
behavior in the transverse direction shows that the elements of the building with shear
wall systems are within the life safety criteria while only three elements of St. system
and four elements of Br. systems exhibited plastic hinges higher than Life safety (LS)
and less than the collapse prevention (CP) limit. Note the for the existing building 24
elements exhibited collapse prevention (CP) behavior.
The retrofitted building with all retrofitting systems could eliminate
completely the collapse that occurred to the 26 elements of the original building under
Elc. (level III quake) applied in the longitudinal direction and 17 elements under the
same quake applied in the transverse direction. All the elements of the retrofitted
building did not exceed the collapse prevention (CP) criteria. The maximum number of
elements in limits ranges between LS and CP is 19 elements.
Table 4 : Number and limits of plastic hinges in longitudinal direction.
System Quake B-IO IO-LS LS-CP CP-C CD D-E
Org.
Aqb. 42 14
Mex. 64 1 26
Elc. 74 2 26
St.
Aqb. 65
Mex. 107 21 1
Elc. 109 14 19
Sw.
Aqb. 62
Mex. 85 12
Elc. 111 10 8
Br.
Aqb. 42
Mex. 35 25
Elc. 61 11 16

SEISMIC EVALUATION AND RETROFIT OF AN ASYMMETRIC …
329
Table 5 : Number and limits of plastic hinges in transverse direction.
System Quake B-IO IO-LS LS-CP CP-C CD D-E
Org.
Aqb. 46 14
Mex. 53 1 24
Elc. 60 1 6 1 17
St.
Aqb. 47
Mex. 87 17 3
Elc. 101 10 18
Sw.
Aqb. 44
Mex. 82 13
Elc. 100 11 4
Br.
` 50
Mex. 80 16 4
Elc. 105 7 13
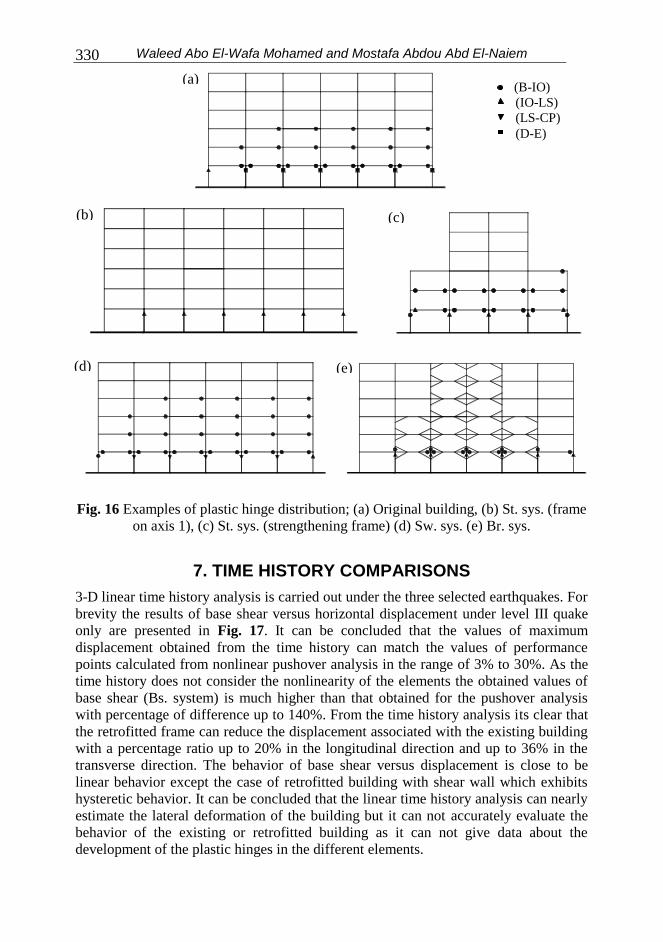
The distribution of plastic hinges and their limits for the original building
before and after the retrofit is monitored. For brevity, only examples of plastic hinge
distribution and their limits under Elc. quake, applied in the longitudinal direction, for
frame on axis 1 as shown in Fig. 16 (a), (b), (d) and (e), or the strengthening frame
adjacent to it as shown in Fig. 16 (c) are plotted. It can be realized that the damage of
the original building is concentrated in the columns of the first floor that under the Elc.
earthquake, almost all these columns suffer collapse. For these columns, the values of
plastic hinge ratios exceed 0.035 and the performance limit is (D-E). The plastic hinges
also developed in the columns of the second floor and third floors but with
performance level (B-IO). The distribution of plastic hinge for beams are concentrated
in the beams located in the first three floors, these beams exhibited plastic hinges of
limits ranging between (B-IO) to (IO-LS).
The columns of the retrofitted building exhibited similar behavior for the
different retrofitting systems. The maximum limit of performance is observed for the
columns of the first floor, for these columns, the plastic hinges are with limits range
between (B-IO) and (LS-CP). The distribution of plastic hinges spreads to the columns
of the second, third and fourth floors but with plastic hinge does not exceed (B-IO)
limit. The plastic hinge distribution of beams for Sw. and Br. systems are similar, for
those two systems, the beams still exhibit some plasticity distributed over the second ,
third, fourth and fifth floor, the maximum performance limit observed for these beams
does not exceed (B-IO) limit. As the St. retrofitting system is the only retrofitting
system that presents new beams to the original building, the observed plastic hinge
distribution is different. For this system, the plastic hinges distributed only between the
beams of the strengthening frame, the original marginal beams did not display any
plasticity.
Waleed Abo El-Wafa Mohamed and Mostafa Abdou Abd El-Naiem 330
Fig. 16 Examples of plastic hinge distribution; (a) Original building, (b) St. sys. (frame
on axis 1), (c) St. sys. (strengthening frame) (d) Sw. sys. (e) Br. sys.
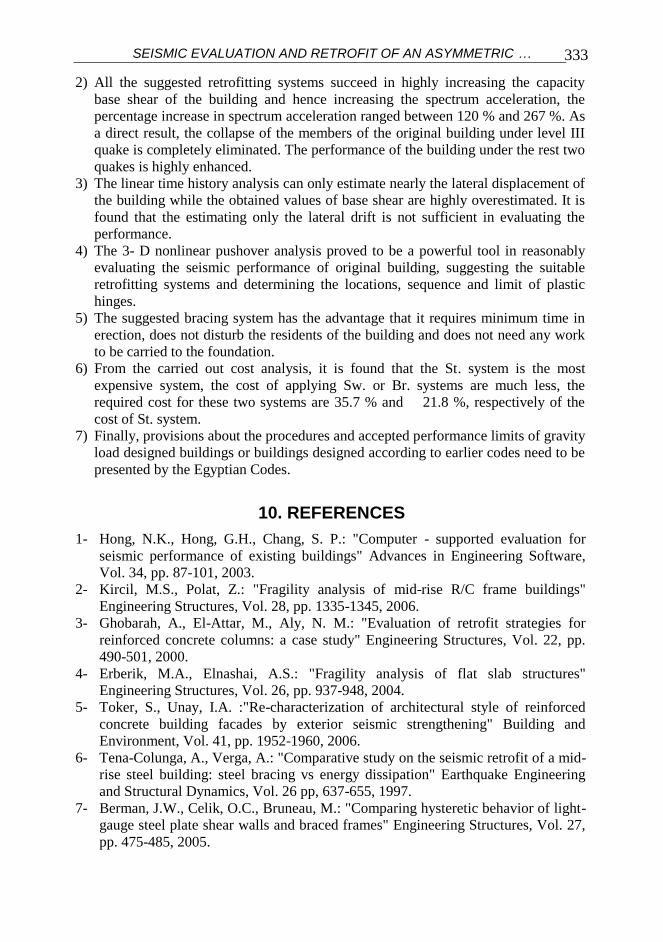
7. TIME HISTORY COMPARISONS
3-D linear time history analysis is carried out under the three selected earthquakes. For
brevity the results of base shear versus horizontal displacement under level III quake
only are presented in Fig. 17. It can be concluded that the values of maximum
displacement obtained from the time history can match the values of performance
points calculated from nonlinear pushover analysis in the range of 3% to 30%. As the
time history does not consider the nonlinearity of the elements the obtained values of
base shear (Bs. system) is much higher than that obtained for the pushover analysis
with percentage of difference up to 140%. From the time history analysis its clear that
the retrofitted frame can reduce the displacement associated with the existing building
with a percentage ratio up to 20% in the longitudinal direction and up to 36% in the
transverse direction. The behavior of base shear versus displacement is close to be
linear behavior except the case of retrofitted building with shear wall which exhibits
hysteretic behavior. It can be concluded that the linear time history analysis can nearly
estimate the lateral deformation of the building but it can not accurately evaluate the
behavior of the existing or retrofitted building as it can not give data about the
development of the plastic hinges in the different elements.
(a)
(b)
(c)
(d)
(b)
(d) (e)
(B-IO)
(IO-LS)
(LS-CP)
(D-E)

SEISMIC EVALUATION AND RETROFIT OF AN ASYMMETRIC …
331
-12
-8
-4
0
4
8
12Max. dis. = 0.084 mMax. B.S. = 10.04 MN
Max. dis. = 0.093 mMax. B.S. = 8.78 MN
-12
-8
-4
0
4
8
12
Max. dis. = 0.066 mMax. B.S. = 10.79 MN
Max. dis. = 0.059 mMax. B.S. = 8.06 MN
Lin
ear
bas
e sh
ear
(MN
)
Linear lateral displacement (m)
10 15 210 270
-12
-8
-4
0
4
8
12
Max. dis = 0.066 mMax. BS= 10795 kNMax. dis = 0.059 mMax. BS= 8055 kNMax. dis = 0.066 mMax. BS= 10795 kNMax. dis = 0.066 mMax. BS= 10795 kNMax. dis = 0.066 mMax. BS= 10795 kN
St. sys.Longtudinal dir.
Org. buildingLongtudinal dir.
St. sys.Transverse dir.
Org. buildingTransverse dir.
Sw. sys.Transverse dir.
Br. sys.Transverse dir.
-12
-8
-4
0
4
8
12
Max. dis. = 0.064 mMax. B.S. = 9.09 MN
-12
-8
-4
0
4
8
12
Max. dis = 0.064 mMax. BS= 9093 kN
Sw. sys.Longtudinal dir.
Br. sys.Longtudinal dir.
-12
-8
-4
0
4
8
12Max. dis. = 0.055 mMax. BS = 7.74 MN
Max. dis. = 0.060 mMax. BS = 12.139 MN
Max. dis. = 0.057 mMax. B.S. = 8.47 MN
-0.1 -0.05 0 0.05 0.1
-12
-8
-4
0
4
8
12
-0.1 -0.05 0 0.05 0.1
-12
-8
-4
0
4
8
12
Fig. 17 : Base shear & lateral displacement for the different systems
8. COST ANALYSIS
A cost model study is carried out to report on the applicability of using the structural
performance levels for the seismic retrofit designs. The objective of the cost analysis is
to estimate approximately the building retrofit costs and provide a comparison between

Waleed Abo El-Wafa Mohamed and Mostafa Abdou Abd El-Naiem 332
the cost of retrofit of the different suggested retrofitting systems. The following
assumptions are made considering the prices for year 2007 in Egypt.
1- The price of cubic meter of R.C including constituent, additives, frame work
and labors is 2400 Egyptian pound.
2- The cost of one cubic meter of steel required for bracing including fabrication
and erection is 10000 Egyptian pound, 20% of the section material is added to
accommodate the connections.
3- The prices of finishes are not included.
The computed quantities and prices required for each system are shown in
Table 6, it can be seen that most expensive system is applying external strengthening
frames, for this system the cost is about 408720 EP. The cost of the Sw. and Br.
retrofitting systems are much less than the St. retrofitting system, the cost for these
two systems are calculated to be 35.7% and 21.8 %, respectively of the St. retrofitting
system. The St. retrofitting system requires strengthening of the foundation while the
Sw. retrofitting system requires the erection of new foundations under the new added
shear walls. The Br. retrofitting system is the less expensive retrofitting system, the
cost for this alternative is about 89000 EP, and from the architecture point of view, it
presents the minor disturbance to the building and does not need any work to be carried
out to the foundation. Table 6 : Comparison between material quantities and cost of retrofitting systems
St. system Sw. system Br. system
RC (m 3) 170.30 60.74 -
Steel sec. (ton) - - 8.90
Total cost 408720 145776 89000
% 100% 35.7% 21.80%
9. CONCLUSIONS
An analytical seismic performance evaluation of an asymmetric flat slab building
designed for gravity loads only is carried out. Three different retrofitting systems, all of
them are located on the perimeter of the building or adjacent to it, are suggested and
evaluated using 3-D nonlinear pushover analysis. However, comparison with linear
time history analysis is carried out. Three real earthquake records with different
intensities close to the intensities proposed by ECL 201 are applied. The following
conclusions may be drawn out.
1) The original flat slab building is susceptible to the applied seismic loads, the
building fail to meet the requirements of the inelastic spectrum of Elc. (level III
quake), most of the columns of the first floor almost collapsed due to the
application of this quake. The original building could meet the inelastic
requirements of Mex. (level II quake), at almost the end of the response, high
plasticity is observed for many members under this quake.
SEISMIC EVALUATION AND RETROFIT OF AN ASYMMETRIC …
333
2) All the suggested retrofitting systems succeed in highly increasing the capacity
base shear of the building and hence increasing the spectrum acceleration, the
percentage increase in spectrum acceleration ranged between 120 % and 267 %. As
a direct result, the collapse of the members of the original building under level III
quake is completely eliminated. The performance of the building under the rest two
quakes is highly enhanced.
3) The linear time history analysis can only estimate nearly the lateral displacement of
the building while the obtained values of base shear are highly overestimated. It is
found that the estimating only the lateral drift is not sufficient in evaluating the
performance.
4) The 3- D nonlinear pushover analysis proved to be a powerful tool in reasonably
evaluating the seismic performance of original building, suggesting the suitable
retrofitting systems and determining the locations, sequence and limit of plastic
hinges.
5) The suggested bracing system has the advantage that it requires minimum time in
erection, does not disturb the residents of the building and does not need any work
to be carried to the foundation.
6) From the carried out cost analysis, it is found that the St. system is the most
expensive system, the cost of applying Sw. or Br. systems are much less, the
required cost for these two systems are 35.7 % and 21.8 %, respectively of the
cost of St. system.
7) Finally, provisions about the procedures and accepted performance limits of gravity
load designed buildings or buildings designed according to earlier codes need to be
presented by the Egyptian Codes.
10. REFERENCES
1- Hong, N.K., Hong, G.H., Chang, S. P.: "Computer - supported evaluation for
seismic performance of existing buildings" Advances in Engineering Software,
Vol. 34, pp. 87-101, 2003.
2- Kircil, M.S., Polat, Z.: "Fragility analysis of mid-rise R/C frame buildings"
Engineering Structures, Vol. 28, pp. 1335-1345, 2006.
3- Ghobarah, A., El-Attar, M., Aly, N. M.: "Evaluation of retrofit strategies for
reinforced concrete columns: a case study" Engineering Structures, Vol. 22, pp.
490-501, 2000.
4- Erberik, M.A., Elnashai, A.S.: "Fragility analysis of flat slab structures"
Engineering Structures, Vol. 26, pp. 937-948, 2004.
5- Toker, S., Unay, I.A. :"Re-characterization of architectural style of reinforced
concrete building facades by exterior seismic strengthening" Building and
Environment, Vol. 41, pp. 1952-1960, 2006.
6- Tena-Colunga, A., Verga, A.: "Comparative study on the seismic retrofit of a mid-
rise steel building: steel bracing vs energy dissipation" Earthquake Engineering
and Structural Dynamics, Vol. 26 pp, 637-655, 1997.
7- Berman, J.W., Celik, O.C., Bruneau, M.: "Comparing hysteretic behavior of light-
gauge steel plate shear walls and braced frames" Engineering Structures, Vol. 27,
pp. 475-485, 2005.

Waleed Abo El-Wafa Mohamed and Mostafa Abdou Abd El-Naiem 334
8- FEMA. NEHRP guidelines for the seismic rehabilitation of buildings. FEMA 273,
Federal Emergency Management Agency, 1996.
9- Applied Technology Council, Seismic evaluation and retrofit of concrete
buildings, Vol. 1. Washington, DC, USA: ATC- 40, 1996.
10- Mwafy, A.M., Elnashai, A.S.:"Static pushover versus dynamic collapse analysis of
RC buildings" Vol. 23, pp. 407-424, 2001.
11- Moghaddam, H., Hajirasouliha, I.: "An investigation on the accuracy of pushover
analysis for estimating the seismic deformation of braced steel frames" Journal of
constructional steel research, Vol. 62, pp. 343-351, 2006.
12- Hasan, R., Xu, L., Grierson, D. E." Push-over analysis for performance-based
seismic design" Computers & Structures, Vol. 80, pp. 2483-2493, 2002.
13- Sucuoglu, H., Gurel, T.Y., Gunay, S.: " Performance-based seismic rehabilitation
of damaged reinforced concrete buildings" J. Structural Engineering, ASCE, Vol.
130, No. 10, pp. 1475- 1486, (2004).
14- Balkaya, C., Kalkan, E.: "Nonlinear seismic response evaluation of tunnel form
building structures, Computers & Structures, Vol. 81, pp. 153-165, 2003.
15- The Egyptian Code for Calculation of Loads and Forces in Structural and Building
Work, ECL 201, Cairo, Egypt, 2003.
16- The Egyptian Code for Design and Construction of Concrete Structures ECCS
203, Cairo, Egypt, 2001.
17- " ETABS, Nonlinear version 8 Beta, Extended 3-D analysis of building systems",
Computers and Structures, Inc., Berkeley, U.S.A., 2001.
تقييم السلوك الزلزالي وتأهيل مبني خرساني غير متماثل منشأ بنظام البالطات الالكمرية
نتيجة للزالزل التي تعرضت لها مصر في الآلونة األخيرة فقد أصبح تقيبيا الوبلول الزلزالبي واحتبراي وتقيبيا لكبببودات حديمبببة مببب نظبببا تل يبببل للمحببباني القالمبببة حال عبببل والمصبببممة فقببب حقبببا ل مبببال الرأوبببية أو حقبببا
الت ديات األواوية التي تواجه مهندوي الزالزل والحبا يي وحبد اوبتلير نظباا الح بات ال كمريبة حانت بار واوببن نتيجببة للعديببد مبب المميببزات التببي يقببدمهاق ولكبب نظببرا لببنقأ الكمببرات العميقببة و أو ببوال القببأ
ت لب تقيبيا وبلوكه الزلزالبي حدحبه واحتبراي ودراوبة يعتحر ذا النظاا ا عند تعرضه أل مال الزالزل مما ي أنظمة تل يل تضم و مته
ويقدا ذا الح ث دراوة ت ليلية لتقييا ولول محني غير متمايل في الموتوي األفقي مكو م وبتة أدوارق تببا النظبباا اشن ببالي لهببذا المحنببي عحببارة عبب ح ببات الكمريببة مرتكببزة علببي أعمببدة داخليببة وخارجيببة وحببد
تصميا المحني ليت مل فق األ مال الرأوية تا احتراي ودراوة ي ية أنظمة لتل يل المحني األصبلي مقدمبة ة جميعهببا فببي أمبباك علببي الم ببي الخببارجي أو م صببقة لببه فببي االتجبباه ال ببولي والعرضببي ببذه األنظمبب
كمبا تبا (Sw. system)أو شن باط بال ي للقبأ ) (St. system عحبارة عب شن باط ش باري خبارجيي تببا شجببراط التقيببيا حاوببتخداا (knee)مبب النببور الركحببة (Br. system)احتبراي ودراوببة تقببديا نظبباا تببدعيا

SEISMIC EVALUATION AND RETROFIT OF AN ASYMMETRIC …
335
كمببا تببا مقارنببة النتببال (pushover analysis)ال ببل ال خ ببي الي يببي األحعبباد موببتخدما ريقببة الببدفن قة الوجل الزمنبي الخ بي تبا اوبتخداا ي يبة التي تا ال صول عليها حاوتخداا ذه ال ريقة من نتال ريلتتناوب مبن ال بدة الزلزاليبة 092.0و 090.0زالزل قيقية ذات دة منووحة لعجلة الزلزال تتراوي حي
لي ية مب المنبا ا المختل بةق 2002المقتر ة م الكود المصري ل مالقالت ديث األولق الصادر عاا لمحني م ل الدراوة تقن في ال دود المبثيرة لهبذه البزالزل فقبد تبا اوبتخداا يب ونظرا أل ال ترة ال حيعية ل
التجاو ال قيقي لهذه الزالزل حعد عمل نموذج لها وحد حينت النتال أ المحني ق ححل التل يلق لا يتمك م شيجاد نق ة أداط ت بت تبليير الزلبزال ذو الموبتوي
أعمدة الدور األرضي لهذا المحني م االنهيار الكلي أما ت ت تليير اليالث وحناطا عليه فقد عانت معظا كييبرة وذات بدود (plastic hinge) ال مرنبةالزلزالي ذوي الموتوي األول والياني فقد ظهبرت م صب ت
مت اوتة وحاوتخداا أنظمة التل يل المقتر ة وجد أ عناصر المحنبي لبا تعباني مب أي انهيبار وتبا ت وبي % كمببا 260% و 20.الزلزالببي للمحنببي نتيجببة زيببادة يبب التجبباو للعجلببة حنوبب تتببراوي حببي الوببلول
حينت الدراوبة أ ريقبة البدفن الب خ يبة تعتحبر ريقبة فعالبة فبي تقيبيا األداط الزلزالبي للمحنبي وتتحبن نقبا خ ببي للزلببزال الم صبب ت ال مرنببة و ببدود ا فببي األعضبباط المختل ببة علببي عكببز ريقببة الوببجل الزمنببي ال
% مقارنبة 20.للقبأ عنبد القاعبدة حنوب وصبلت البي (over estimated)التي نت عنهبا حبيا مرت عبة ح ريقة الدفن ال خ ية وحدراوة تكل ة نظا التل يل المقتر ة وجد أ أكير ا تكل ة و نظباا التل يبل البذي
كل ببة النظبببامي ا,خببري ق شن ببباط وحينببت الدراوبببة أ ت (St. system)شن بباط ش ببباري خببارجيي يتضببم % و 7090 ببي علببي التببوالي (Br. system)وتقببديا نظبباا للتببدعيا (Sw. system) ببال ي للقببأ
ذو التكل بببة األحبببل حضبببللة تبببلييره علبببي ال بببكل (Br. system)% يتميبببز نظببباا التبببدعيا المقتبببري 2.92 ت المعماري حاشضافة شلي أنه ال ي تاج أي أعمال خاصة حاألواوا