seismic design of shape memory alloy reinforced concrete
TRANSCRIPT
ACI Fall Convention OCTOBER 15-
19, 2017
Seismic Design of Shape Memory Alloy Reinforced Concrete
Bridge Pier
Dr. AHM Muntasir Billah, P.Eng.Bridge Engineer, Parsons
Dr. M. Shahria Alam, P.Eng.The University of British Columbia
ACI Fall Convention OCTOBER 15-
19, 2017
Outline
•Current seismic design philosophy
•Performance based seismic design (PBSD)
•PBSD for new materials
•PBSD Example on SMA-RC Pier
•Conclusion
ACI Fall Convention OCTOBER 15-
19, 2017
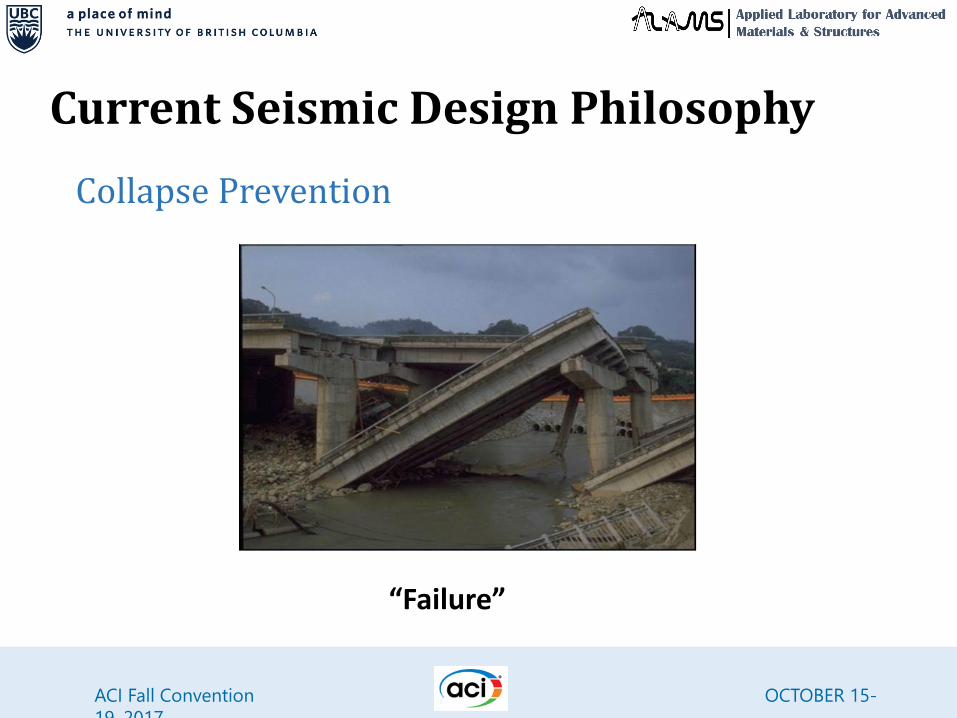
Current Seismic Design Philosophy
Collapse Prevention
“Failure”
ACI Fall Convention OCTOBER 15-
19, 2017
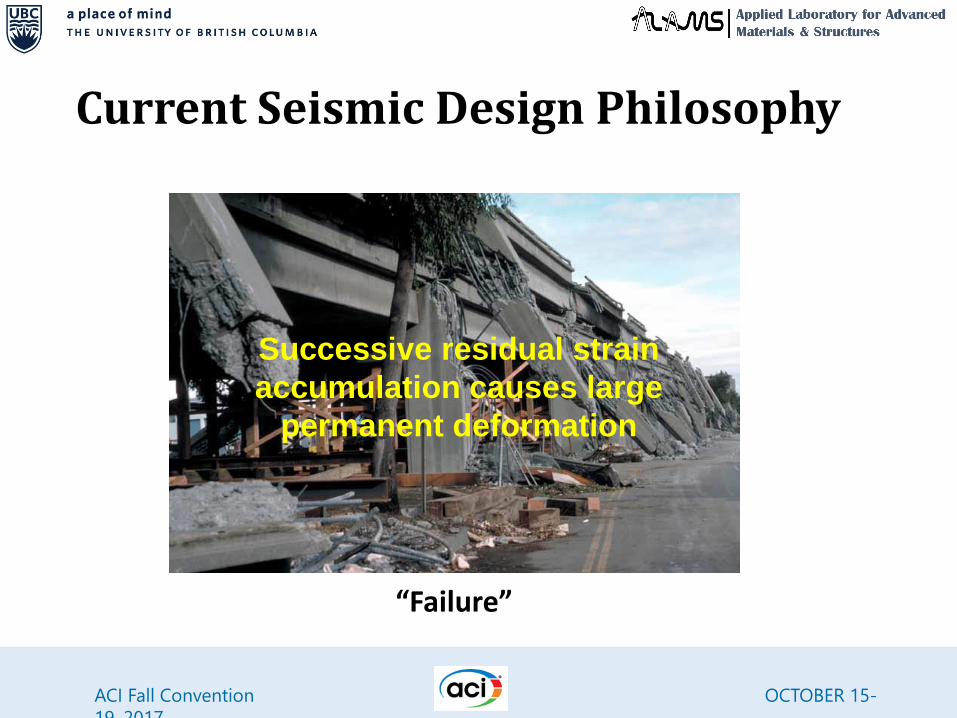
Current Seismic Design Philosophy
“Failure”
Successive residual strain
accumulation causes large
permanent deformation

ACI Fall Convention OCTOBER 15-
19, 2017
Current Seismic Design Philosophy
“Success -- ?”
ACI Fall Convention OCTOBER 15-
19, 2017
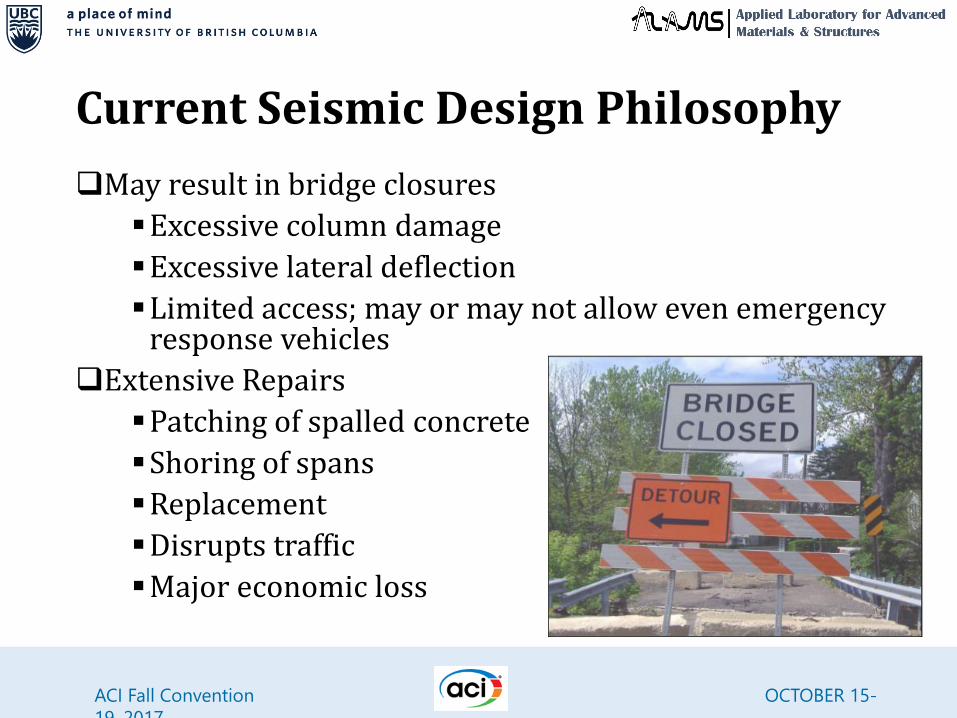
Current Seismic Design Philosophy
May result in bridge closures
▪Excessive column damage
▪Excessive lateral deflection
▪Limited access; may or may not allow even emergency response vehicles
Extensive Repairs
▪Patching of spalled concrete
▪Shoring of spans
▪Replacement
▪Disrupts traffic
▪Major economic loss
ACI Fall Convention OCTOBER 15-
19, 2017
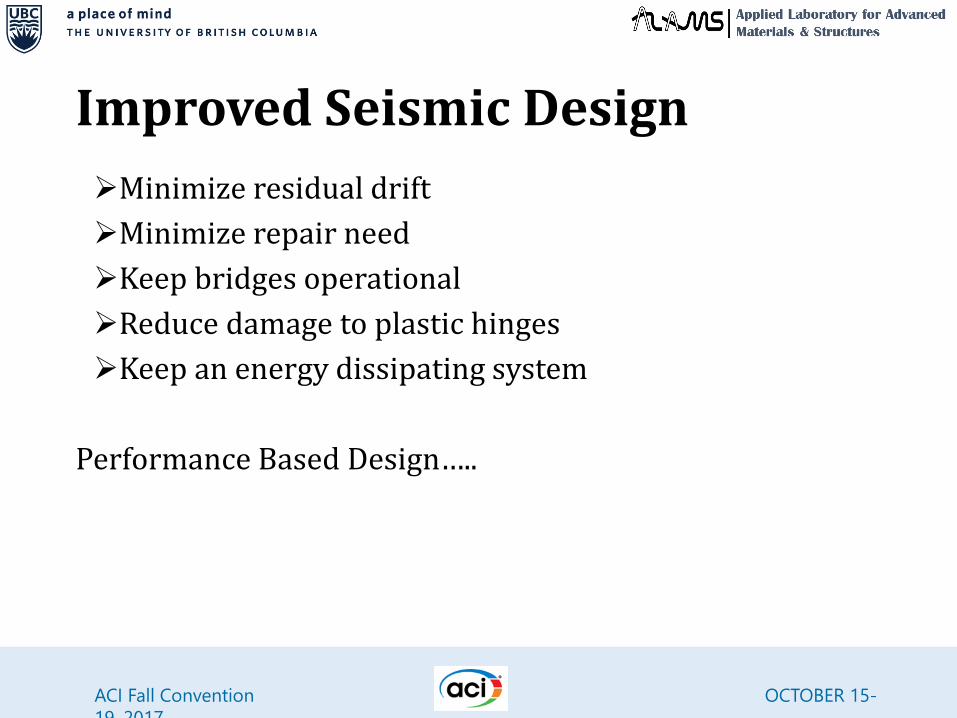
Improved Seismic Design
➢Minimize residual drift
➢Minimize repair need
➢Keep bridges operational
➢Reduce damage to plastic hinges
➢Keep an energy dissipating system
Performance Based Design…..
ACI Fall Convention OCTOBER 15-
19, 2017
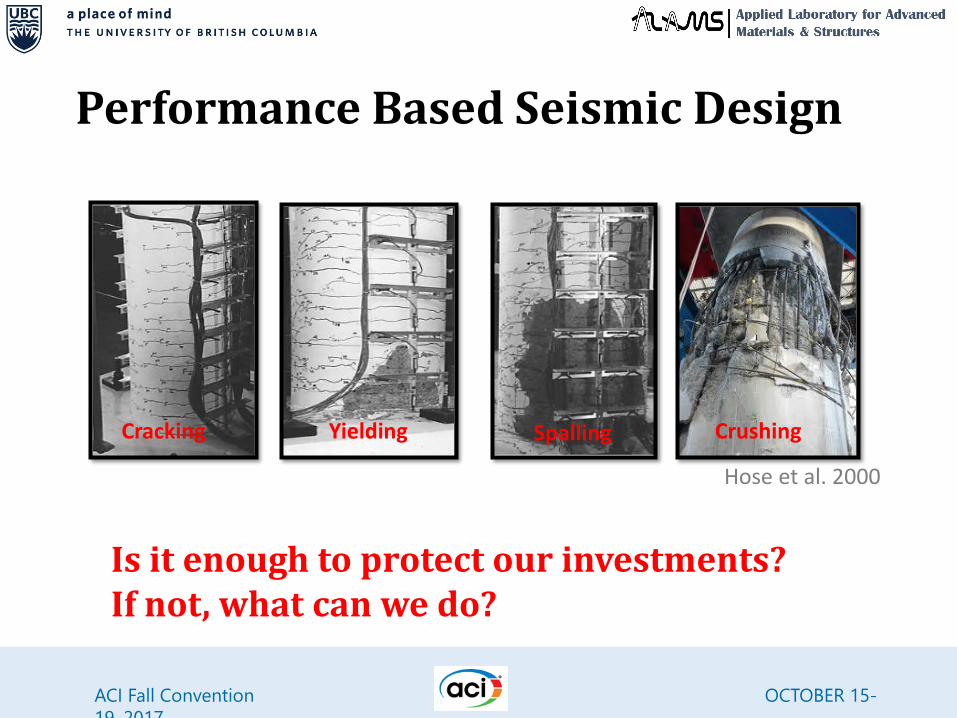
Performance Based Seismic Design
Cracking Yielding Spalling Crushing
Is it enough to protect our investments?If not, what can we do?
Hose et al. 2000
ACI Fall Convention OCTOBER 15-
19, 2017
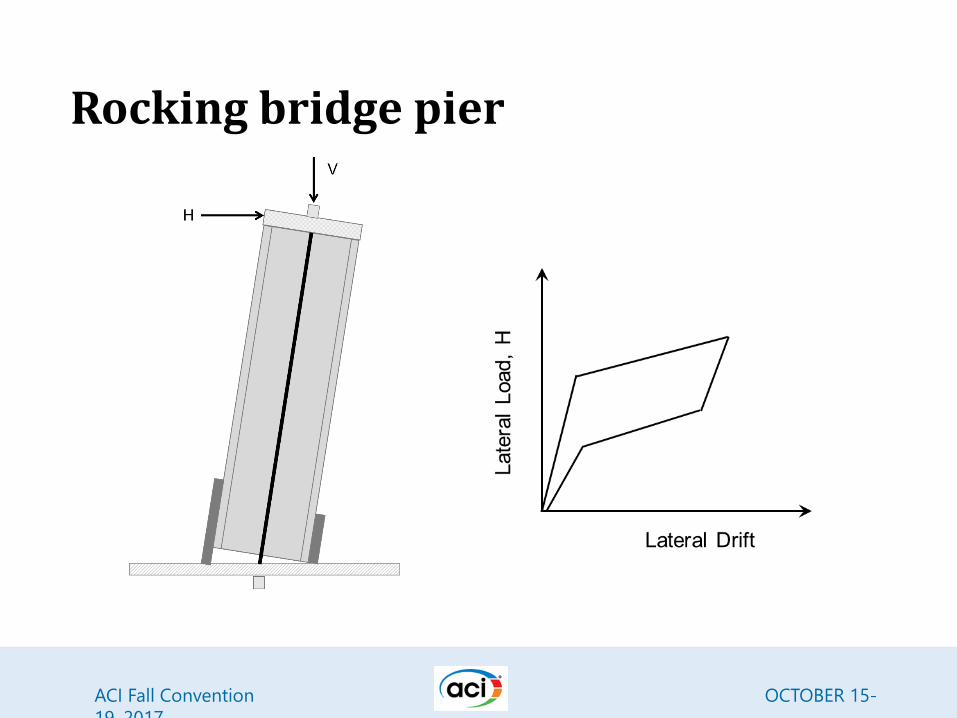
Rocking bridge pier
ACI Fall Convention OCTOBER 15-
19, 2017
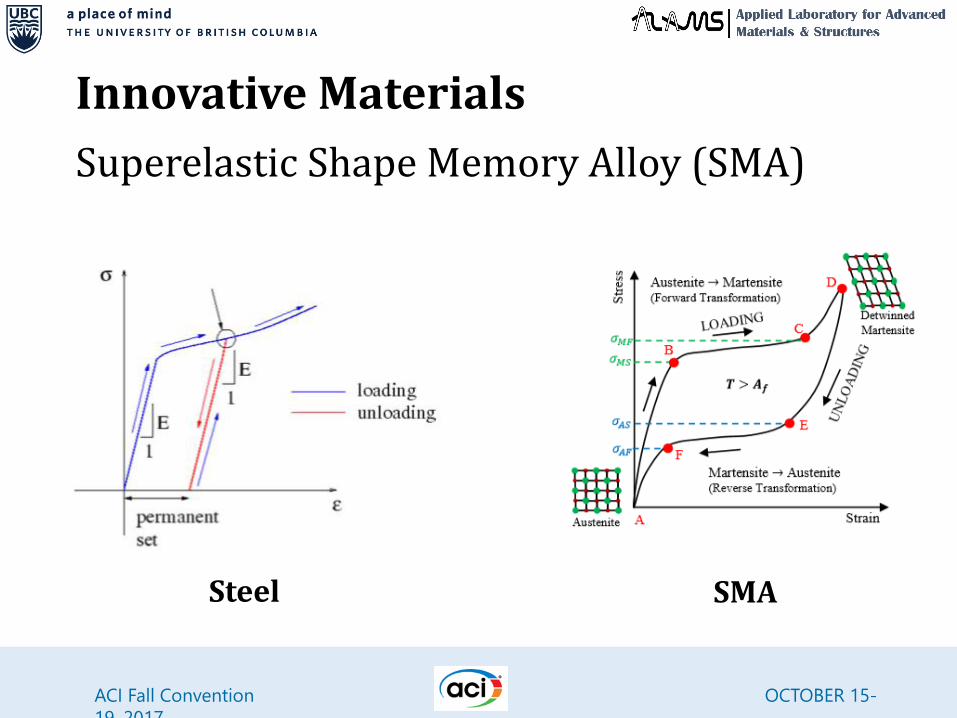
Innovative Materials
Superelastic Shape Memory Alloy (SMA)
Steel SMA
ACI Fall Convention OCTOBER 15-
19, 2017
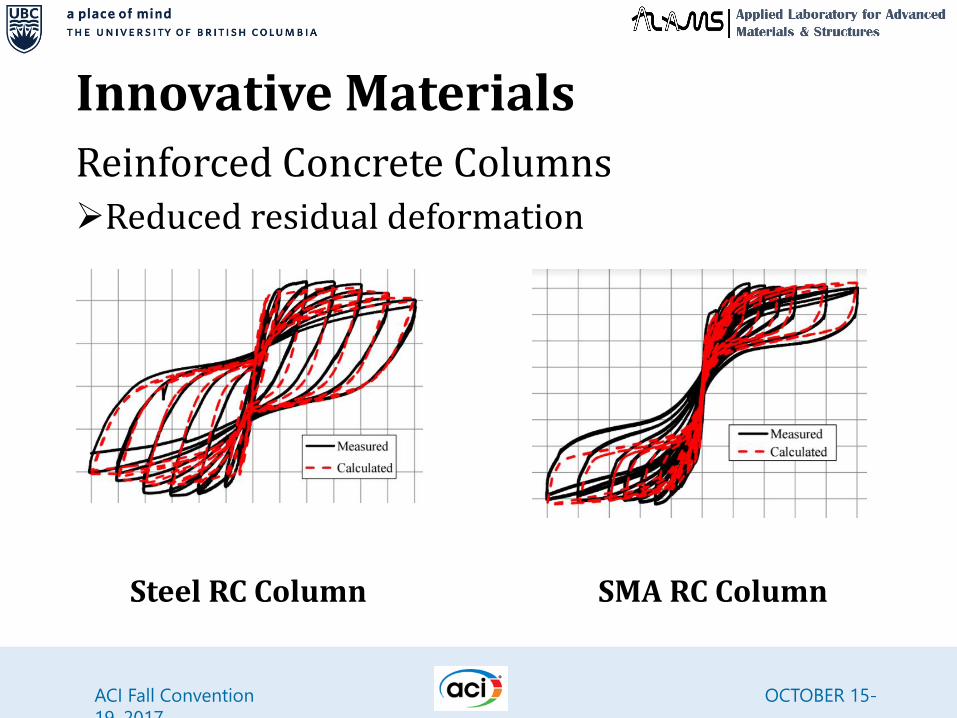
Innovative MaterialsReinforced Concrete Columns➢Reduced residual deformation
Steel RC Column SMA RC Column
ACI Fall Convention OCTOBER 15-
19, 2017
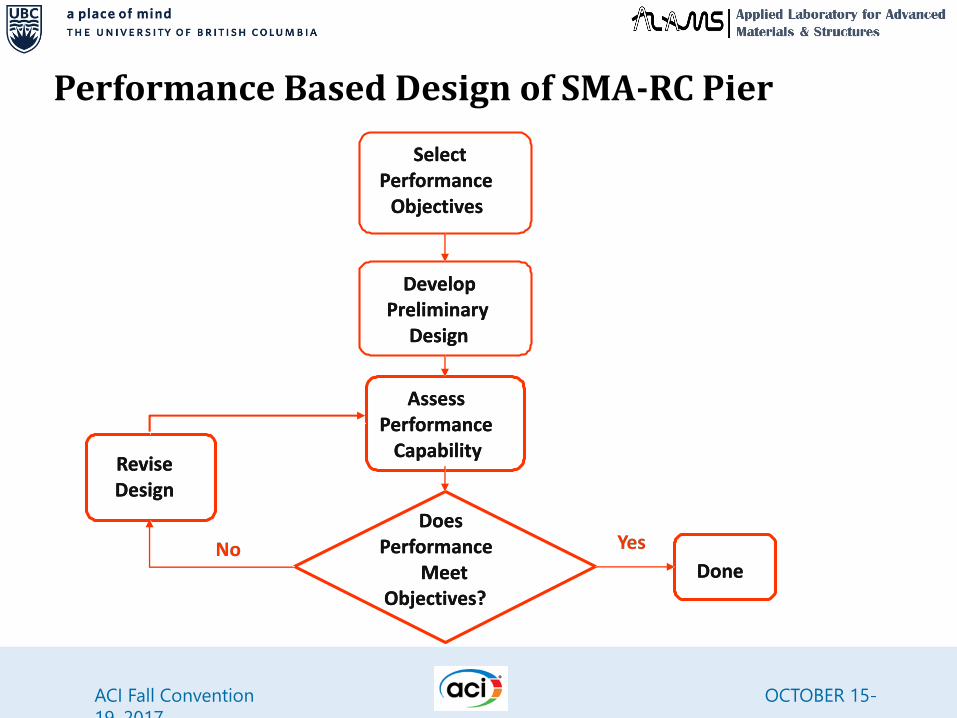
Performance Based Design of SMA-RC Pier
SelectPerformance
Objectives
SelectPerformance
Objectives
DevelopPreliminary
Design
DevelopPreliminary
Design
AssessPerformance
Capability
AssessPerformance
Capability
DoesPerformance
MeetObjectives?
DoesPerformance
MeetObjectives?
DoneDone
ReviseDesign
No
ReviseDesign
No YesYes
18
ACI Fall Convention OCTOBER 15-
19, 2017
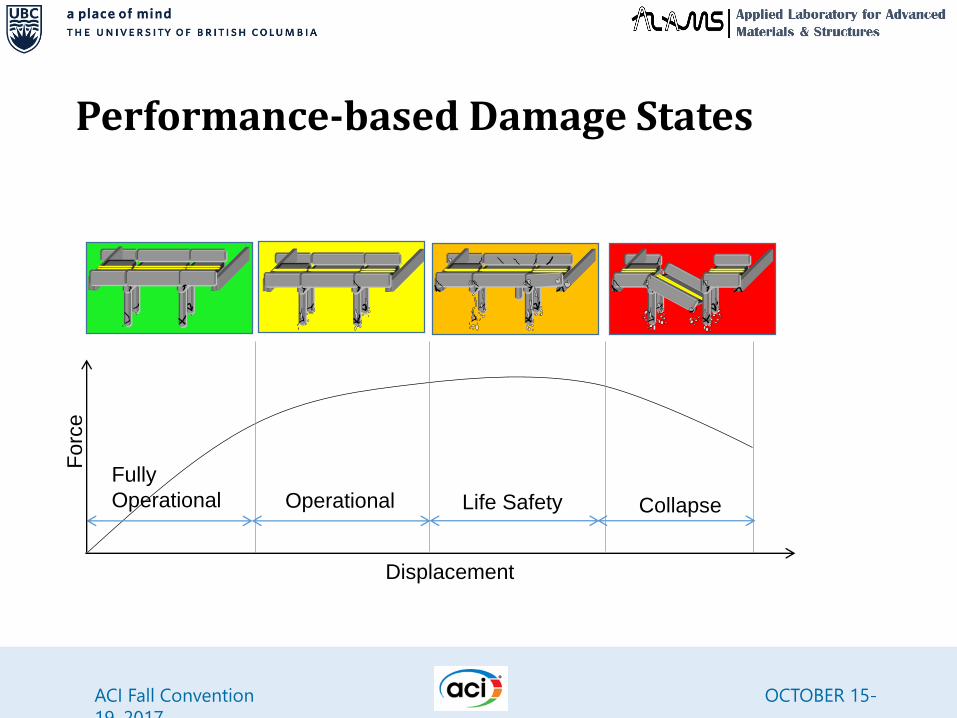
Performance-based Damage States
Fully
Operational Operational Life Safety Collapse
Forc
e
Displacement
ACI Fall Convention OCTOBER 15-
19, 2017
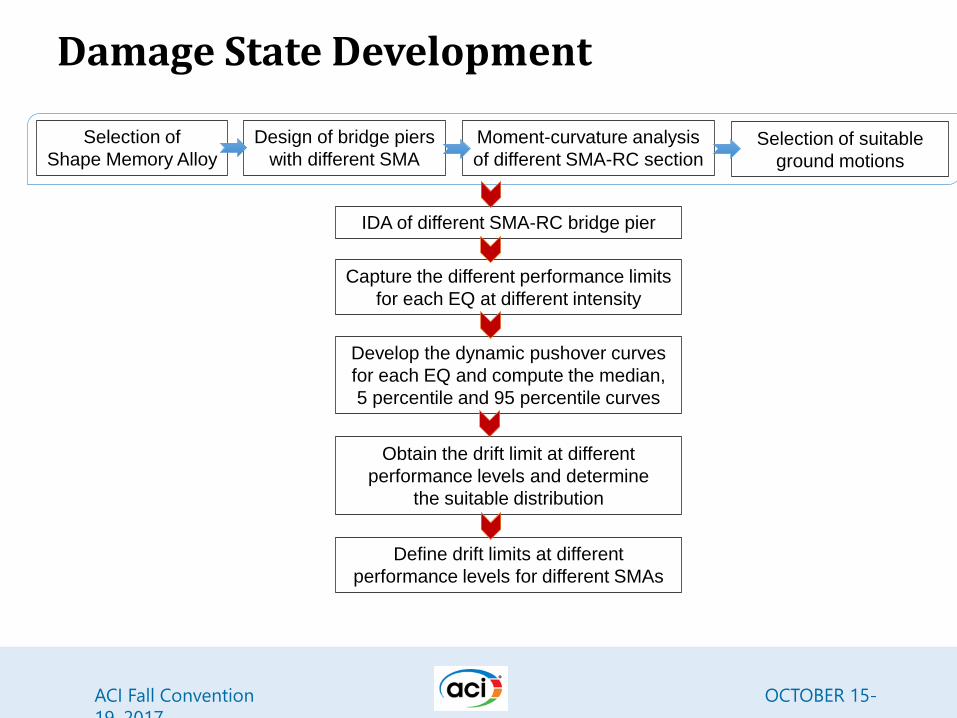
Selection of
Shape Memory Alloy
Design of bridge piers
with different SMA
Moment-curvature analysis
of different SMA-RC sectionSelection of suitable
ground motions
IDA of different SMA-RC bridge pier
Capture the different performance limits
for each EQ at different intensity
Obtain the drift limit at different
performance levels and determine
the suitable distribution
Develop the dynamic pushover curves
for each EQ and compute the median,
5 percentile and 95 percentile curves
Define drift limits at different
performance levels for different SMAs
Damage State Development
ACI Fall Convention OCTOBER 15-
19, 2017
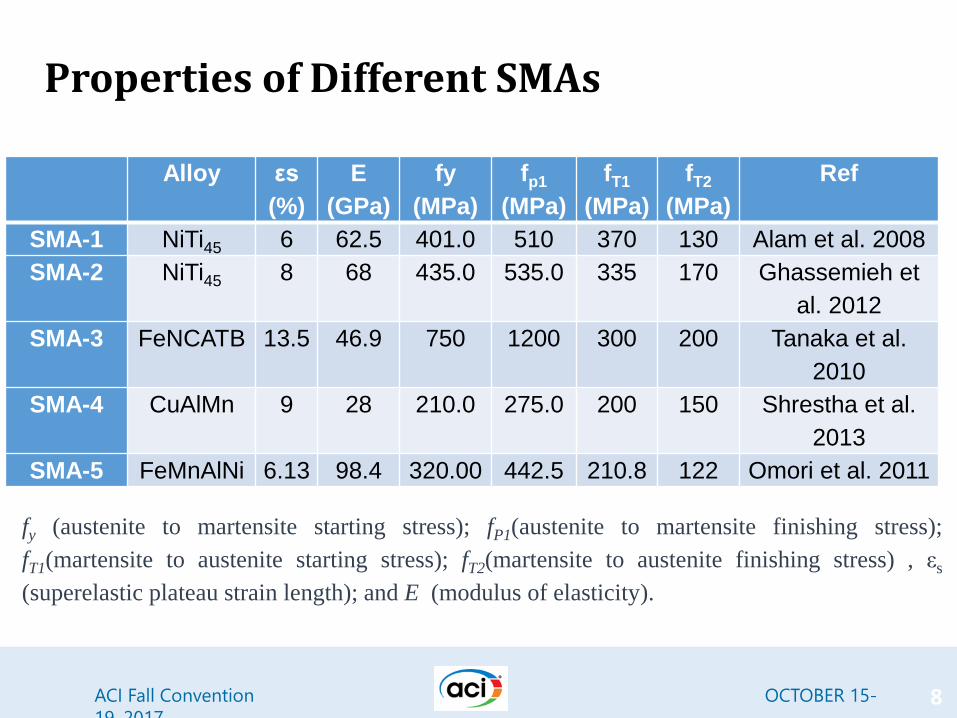
Properties of Different SMAs
8
Alloy εs
(%)
E
(GPa)
fy
(MPa)
fp1
(MPa)
fT1
(MPa)
fT2
(MPa)
Ref
SMA-1 NiTi45 6 62.5 401.0 510 370 130 Alam et al. 2008
SMA-2 NiTi45 8 68 435.0 535.0 335 170 Ghassemieh et
al. 2012
SMA-3 FeNCATB 13.5 46.9 750 1200 300 200 Tanaka et al.
2010
SMA-4 CuAlMn 9 28 210.0 275.0 200 150 Shrestha et al.
2013
SMA-5 FeMnAlNi 6.13 98.4 320.00 442.5 210.8 122 Omori et al. 2011
fy (austenite to martensite starting stress); fP1(austenite to martensite finishing stress);
fT1(martensite to austenite starting stress); fT2(martensite to austenite finishing stress) , εs
(superelastic plateau strain length); and E (modulus of elasticity).

ACI Fall Convention OCTOBER 15-
19, 2017
Design and Geometry of Bridge Piers
ACI Fall Convention OCTOBER 15-
19, 2017
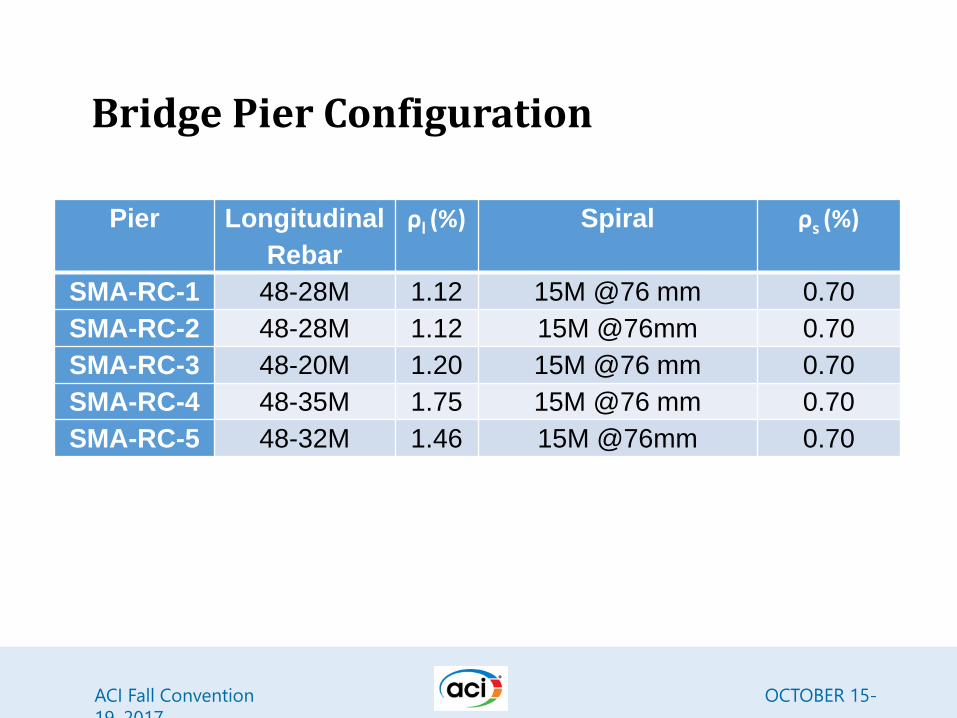
Bridge Pier Configuration
Pier Longitudinal
Rebar
ρl (%) Spiral ρs (%)
SMA-RC-1 48-28M 1.12 15M @76 mm 0.70
SMA-RC-2 48-28M 1.12 15M @76mm 0.70
SMA-RC-3 48-20M 1.20 15M @76 mm 0.70
SMA-RC-4 48-35M 1.75 15M @76 mm 0.70
SMA-RC-5 48-32M 1.46 15M @76mm 0.70
ACI Fall Convention OCTOBER 15-
19, 2017
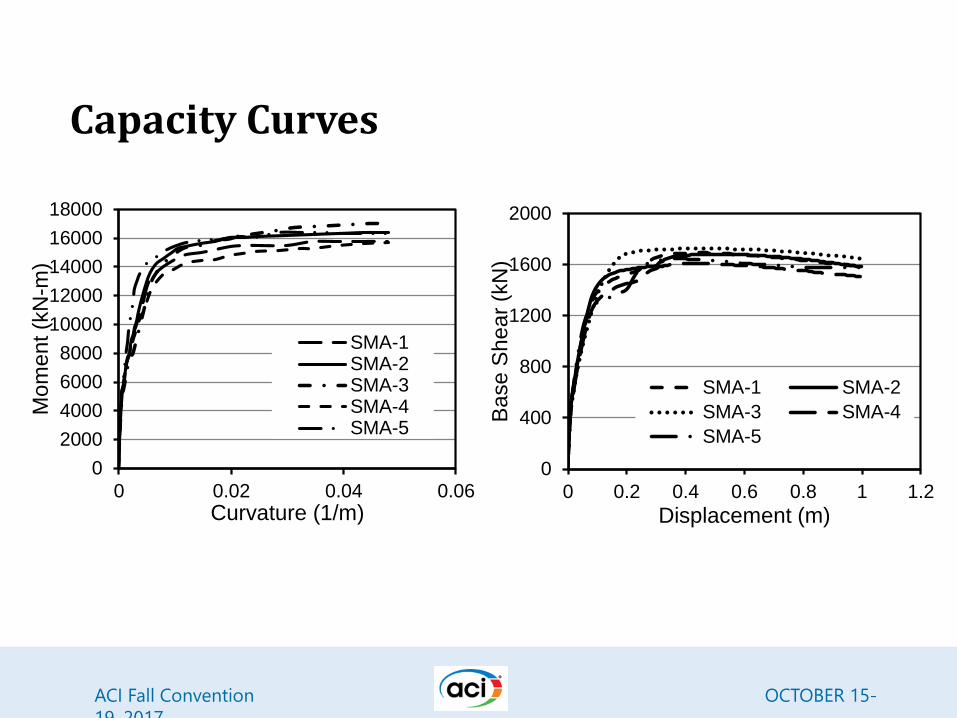
Capacity Curves
0
2000
4000
6000
8000
10000
12000
14000
16000
18000
0 0.02 0.04 0.06
Mo
me
nt (k
N-m
)
Curvature (1/m)
SMA-1SMA-2SMA-3SMA-4SMA-5
0
400
800
1200
1600
2000
0 0.2 0.4 0.6 0.8 1 1.2B
ase
Sh
ea
r (k
N)
Displacement (m)
SMA-1 SMA-2
SMA-3 SMA-4
SMA-5
ACI Fall Convention OCTOBER 15-
19, 2017
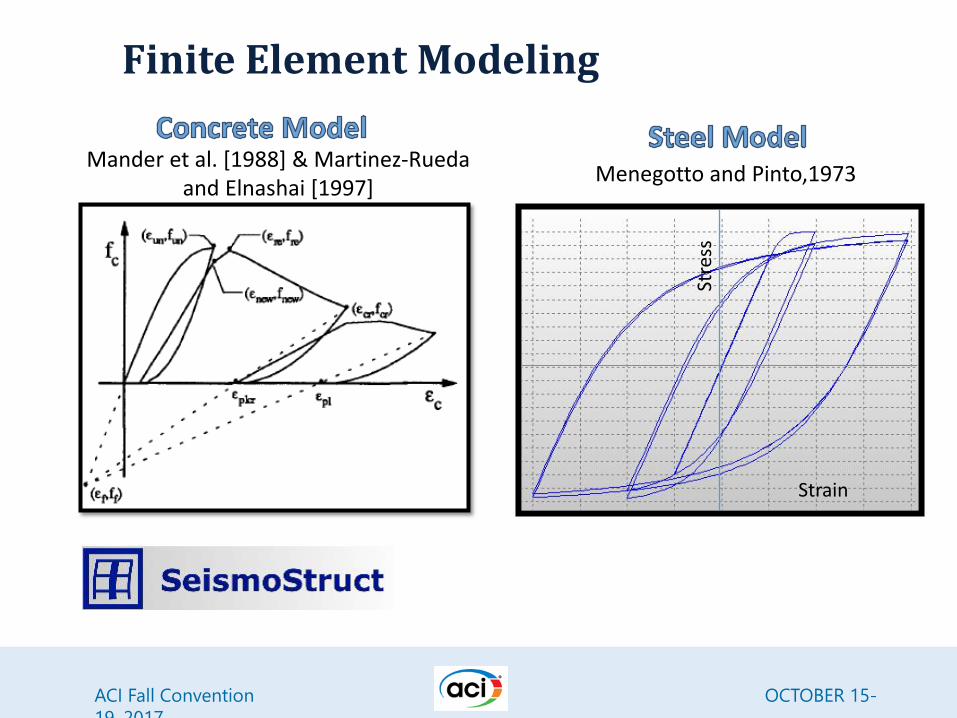
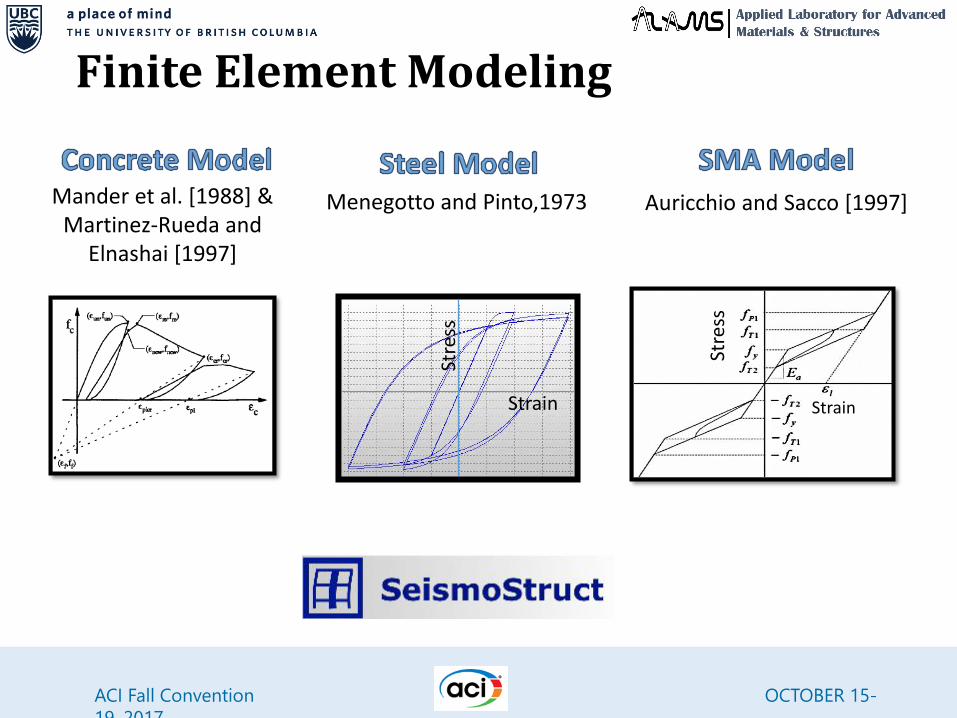
Finite Element Modeling
Mander et al. [1988] & Martinez-Rueda and Elnashai [1997]
Menegotto and Pinto,1973
Stre
ss
Strain
ACI Fall Convention OCTOBER 15-
19, 2017
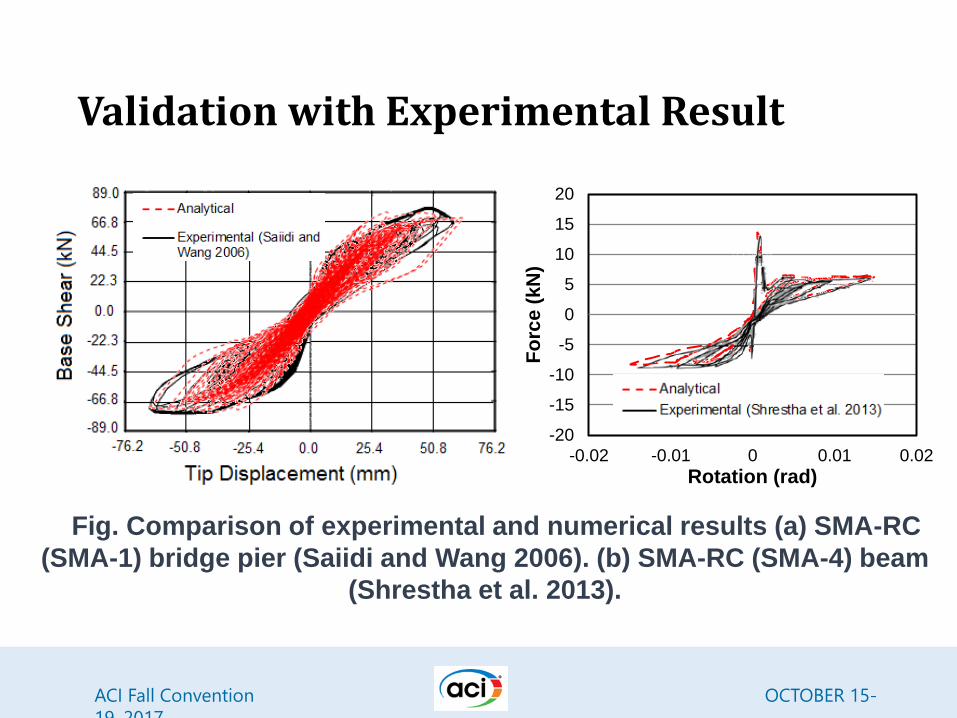
Validation with Experimental Result
Fig. Comparison of experimental and numerical results (a) SMA-RC
(SMA-1) bridge pier (Saiidi and Wang 2006). (b) SMA-RC (SMA-4) beam
(Shrestha et al. 2013).
-20
-15
-10
-5
0
5
10
15
20
-0.02 -0.01 0 0.01 0.02
Fo
rce
(k
N)
Rotation (rad)
ACI Fall Convention OCTOBER 15-
19, 2017
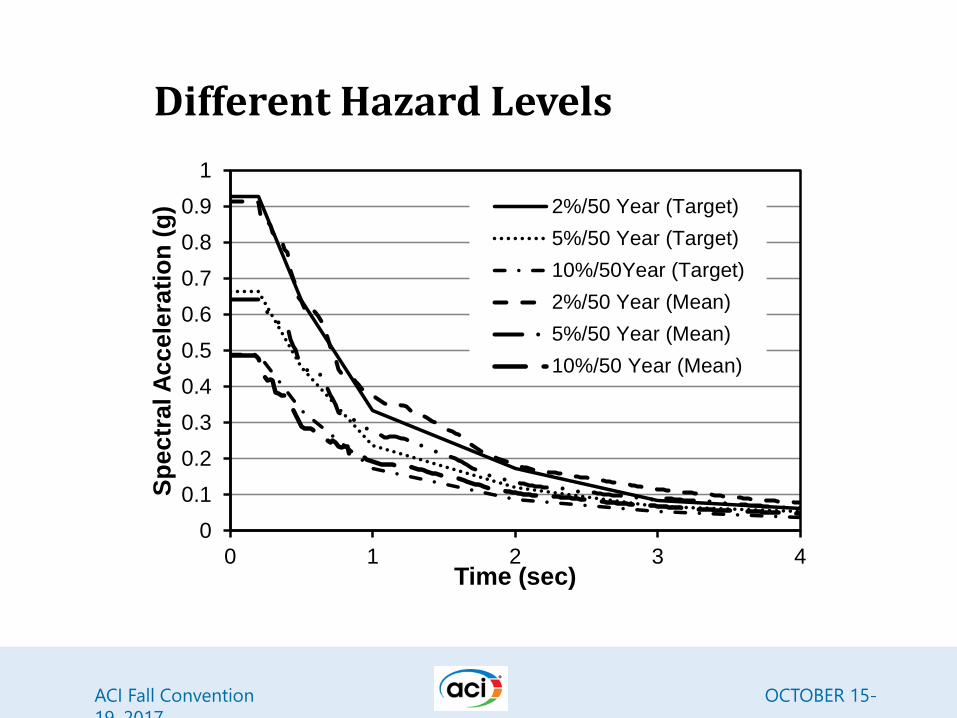
Different Hazard Levels
0
0.1
0.2
0.3
0.4
0.5
0.6
0.7
0.8
0.9
1
0 1 2 3 4
Sp
ec
tra
l A
cc
ele
rati
on
(g
)
Time (sec)
2%/50 Year (Target)
5%/50 Year (Target)
10%/50Year (Target)
2%/50 Year (Mean)
5%/50 Year (Mean)
10%/50 Year (Mean)
ACI Fall Convention OCTOBER 15-
19, 2017
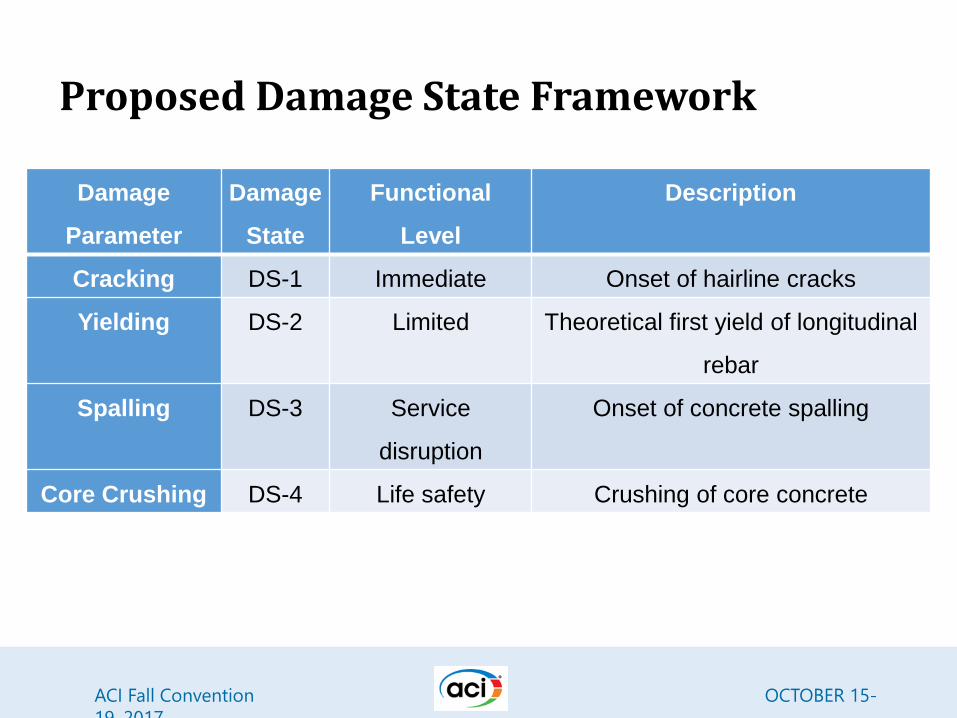
Proposed Damage State Framework
Damage
Parameter
Damage
State
Functional
Level
Description
Cracking DS-1 Immediate Onset of hairline cracks
Yielding DS-2 Limited Theoretical first yield of longitudinal
rebar
Spalling DS-3 Service
disruption
Onset of concrete spalling
Core Crushing DS-4 Life safety Crushing of core concrete

ACI Fall Convention OCTOBER 15-
19, 2017
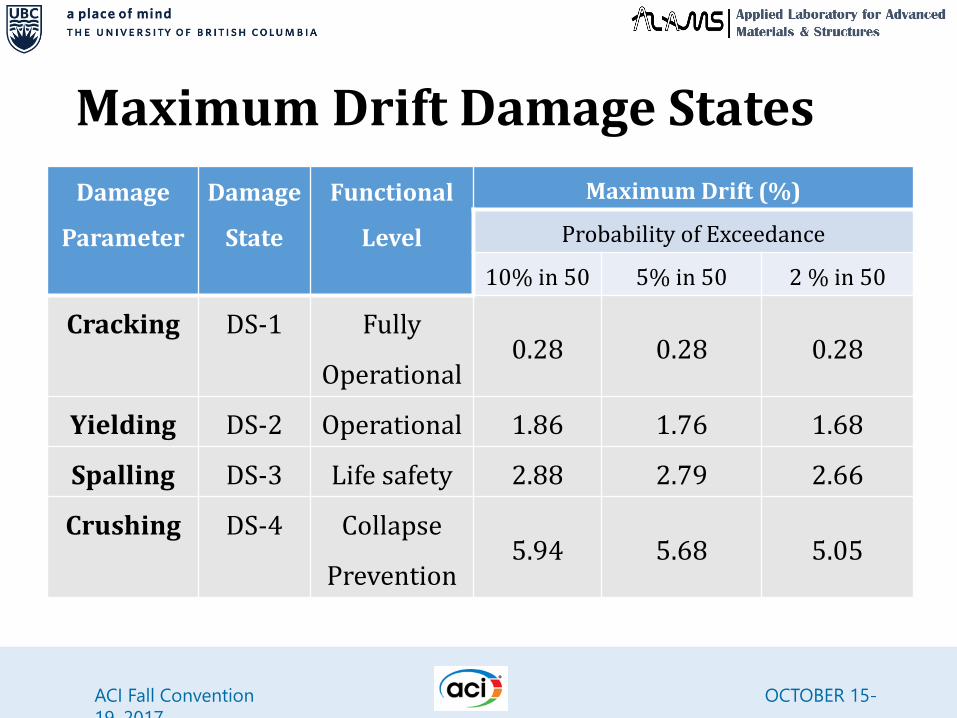
Maximum Drift Damage States
Figure . Dynamic pushover response and different damage states with distribution for
SMA-RC-1 for (a) 2% in 50 years (b) 5% in 50 years and (c) 10% in 50 years probability of
exceedance
ACI Fall Convention OCTOBER 15-
19, 2017
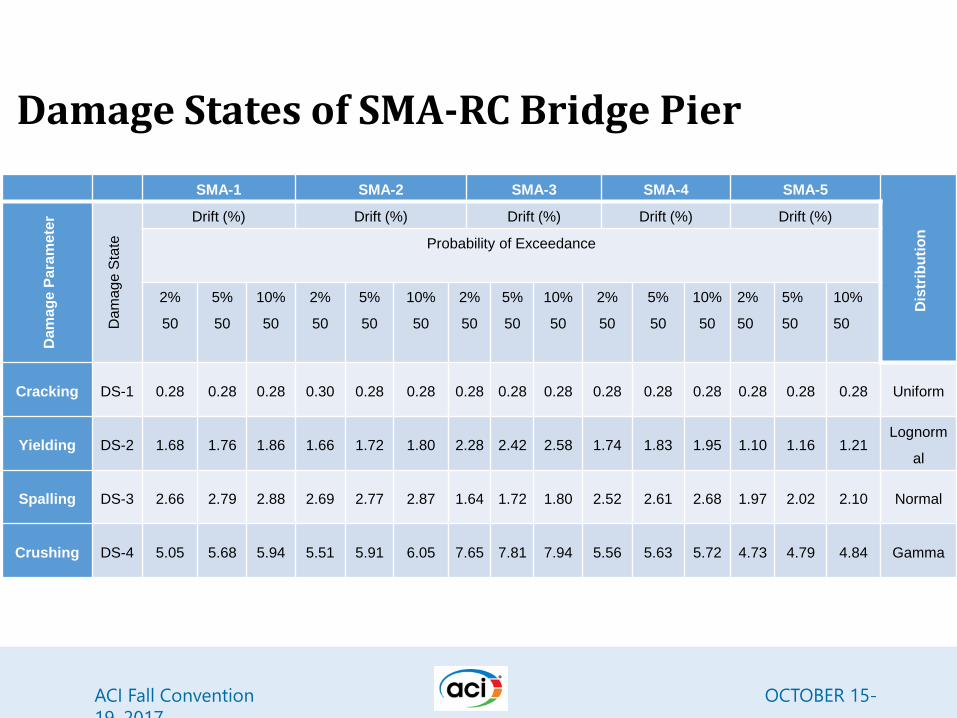
Damage States of SMA-RC Bridge Pier
SMA-1 SMA-2 SMA-3 SMA-4 SMA-5
Dis
trib
uti
on
Da
ma
ge
Pa
ram
ete
r
Da
ma
ge
Sta
te
Drift (%) Drift (%) Drift (%) Drift (%) Drift (%)
Probability of Exceedance
2%
50
5%
50
10%
50
2%
50
5%
50
10%
50
2%
50
5%
50
10%
50
2%
50
5%
50
10%
50
2%
50
5%
50
10%
50
Cracking DS-1 0.28 0.28 0.28 0.30 0.28 0.28 0.28 0.28 0.28 0.28 0.28 0.28 0.28 0.28 0.28 Uniform
Yielding DS-2 1.68 1.76 1.86 1.66 1.72 1.80 2.28 2.42 2.58 1.74 1.83 1.95 1.10 1.16 1.21Lognorm
al
Spalling DS-3 2.66 2.79 2.88 2.69 2.77 2.87 1.64 1.72 1.80 2.52 2.61 2.68 1.97 2.02 2.10 Normal
Crushing DS-4 5.05 5.68 5.94 5.51 5.91 6.05 7.65 7.81 7.94 5.56 5.63 5.72 4.73 4.79 4.84 Gamma
ACI Fall Convention OCTOBER 15-
19, 2017
Maximum Drift Damage States
Damage
Parameter
Damage
State
Functional
Level
Maximum Drift (%)
Probability of Exceedance
10% in 50 5% in 50 2 % in 50
Cracking DS-1 Fully
Operational0.28 0.28 0.28
Yielding DS-2 Operational 1.86 1.76 1.68
Spalling DS-3 Life safety 2.88 2.79 2.66
Crushing DS-4 Collapse
Prevention5.94 5.68 5.05
ACI Fall Convention OCTOBER 15-
19, 2017
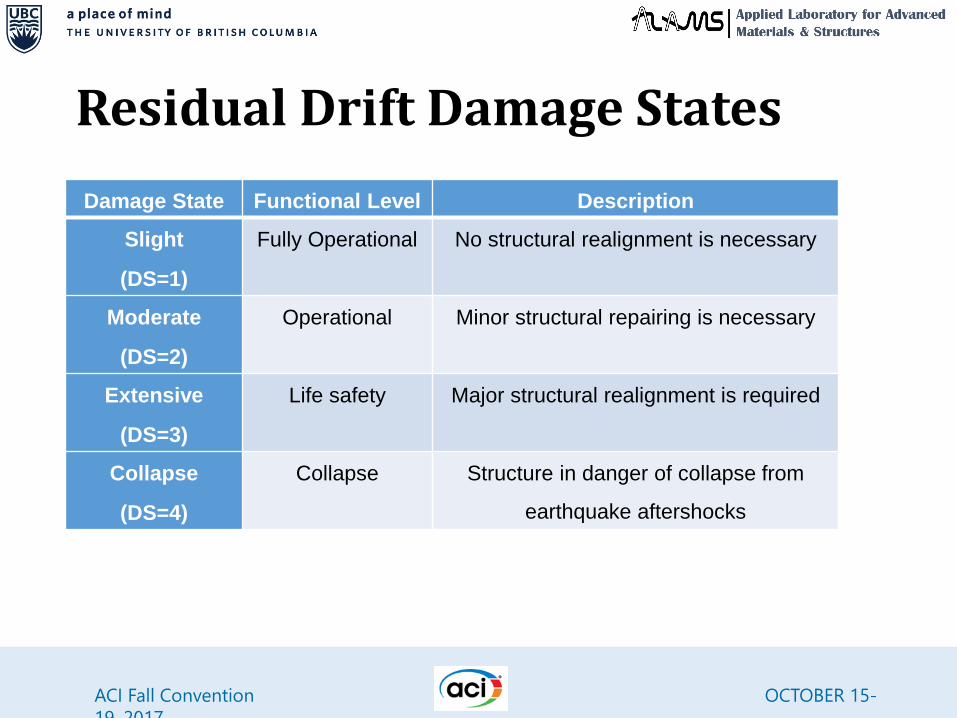
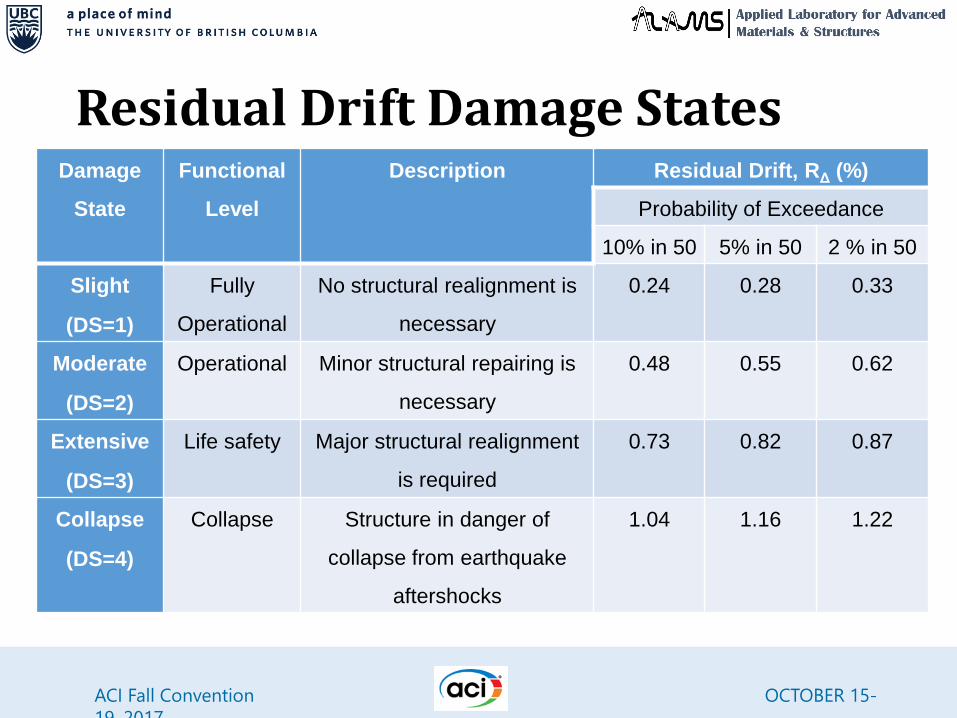
Residual Drift Damage States
Damage State Functional Level Description
Slight
(DS=1)
Fully Operational No structural realignment is necessary
Moderate
(DS=2)
Operational Minor structural repairing is necessary
Extensive
(DS=3)
Life safety Major structural realignment is required
Collapse
(DS=4)
Collapse Structure in danger of collapse from
earthquake aftershocks
ACI Fall Convention OCTOBER 15-
19, 2017
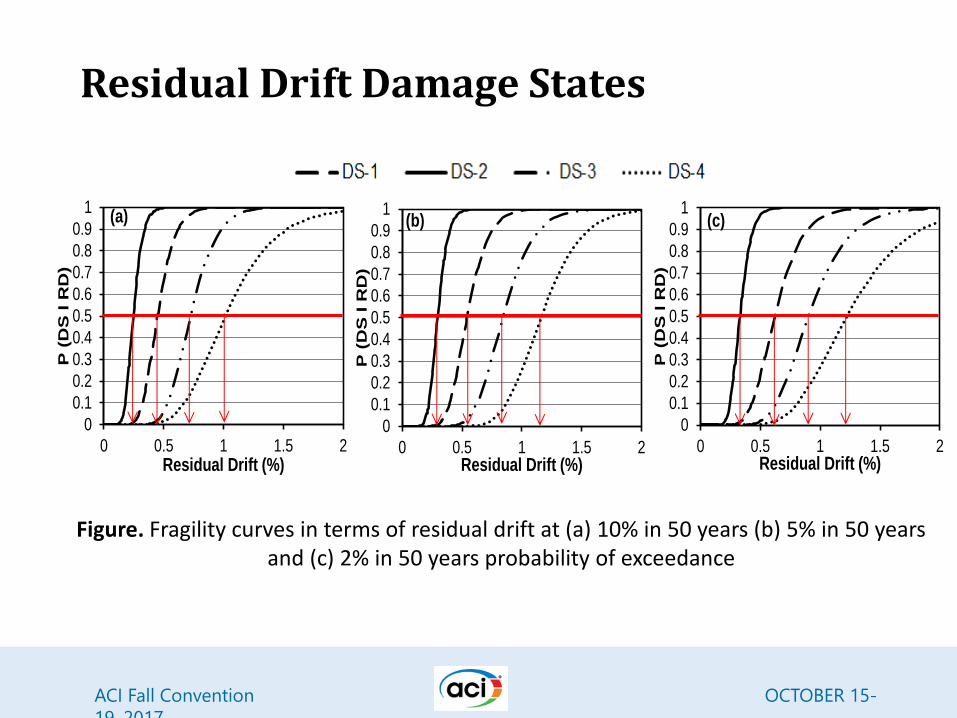
Residual Drift Damage States
Figure. Fragility curves in terms of residual drift at (a) 10% in 50 years (b) 5% in 50 years and (c) 2% in 50 years probability of exceedance
0
0.1
0.2
0.3
0.4
0.5
0.6
0.7
0.8
0.9
1
0 0.5 1 1.5 2
P (
DS
I R
D)
Residual Drift (%)
(a)
0
0.1
0.2
0.3
0.4
0.5
0.6
0.7
0.8
0.9
1
0 0.5 1 1.5 2
P (
DS
I R
D)
Residual Drift (%)
(b)
0
0.1
0.2
0.3
0.4
0.5
0.6
0.7
0.8
0.9
1
0 0.5 1 1.5 2
P (
DS
I R
D)
Residual Drift (%)
(c)
ACI Fall Convention OCTOBER 15-
19, 2017
Residual Drift Damage StatesDamage
State
Functional
Level
Description Residual Drift, RΔ (%)
Probability of Exceedance
10% in 50 5% in 50 2 % in 50
Slight
(DS=1)
Fully
Operational
No structural realignment is
necessary
0.24 0.28 0.33
Moderate
(DS=2)
Operational Minor structural repairing is
necessary
0.48 0.55 0.62
Extensive
(DS=3)
Life safety Major structural realignment
is required
0.73 0.82 0.87
Collapse
(DS=4)
Collapse Structure in danger of
collapse from earthquake
aftershocks
1.04 1.16 1.22
ACI Fall Convention OCTOBER 15-
19, 2017
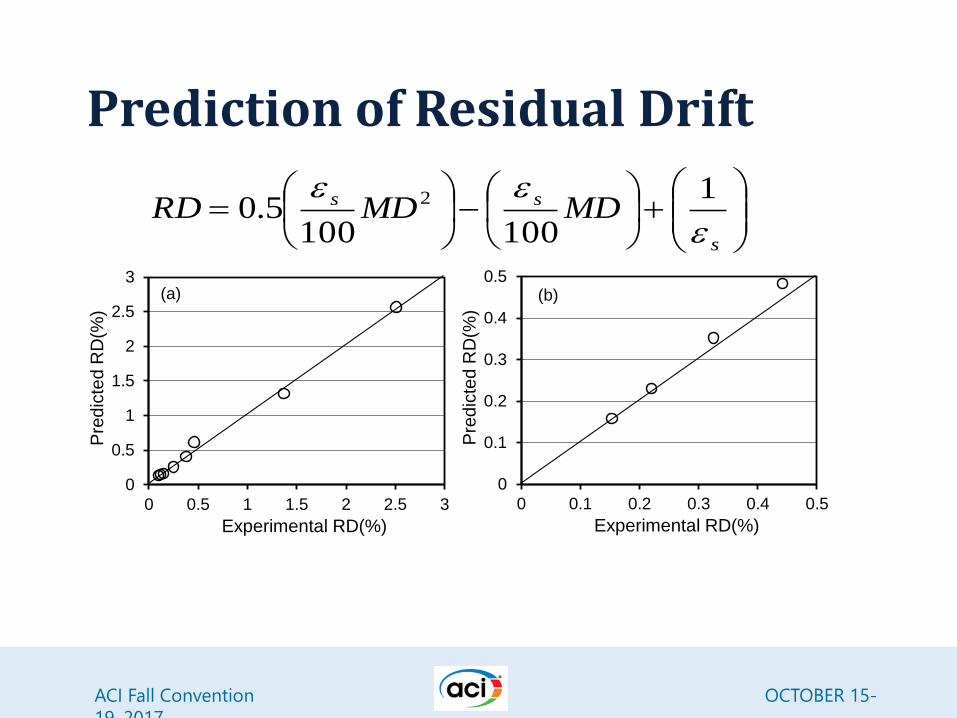
Prediction of Residual Drift
0
0.5
1
1.5
2
2.5
3
0 0.5 1 1.5 2 2.5 3
Pre
dic
ted
RD
(%)
Experimental RD(%)
(a)
0
0.1
0.2
0.3
0.4
0.5
0 0.1 0.2 0.3 0.4 0.5
Pre
dic
ted
RD
(%)
Experimental RD(%)
(b)
s
ss MDMDRD
1
1001005.0 2
ACI Fall Convention OCTOBER 15-
19, 2017
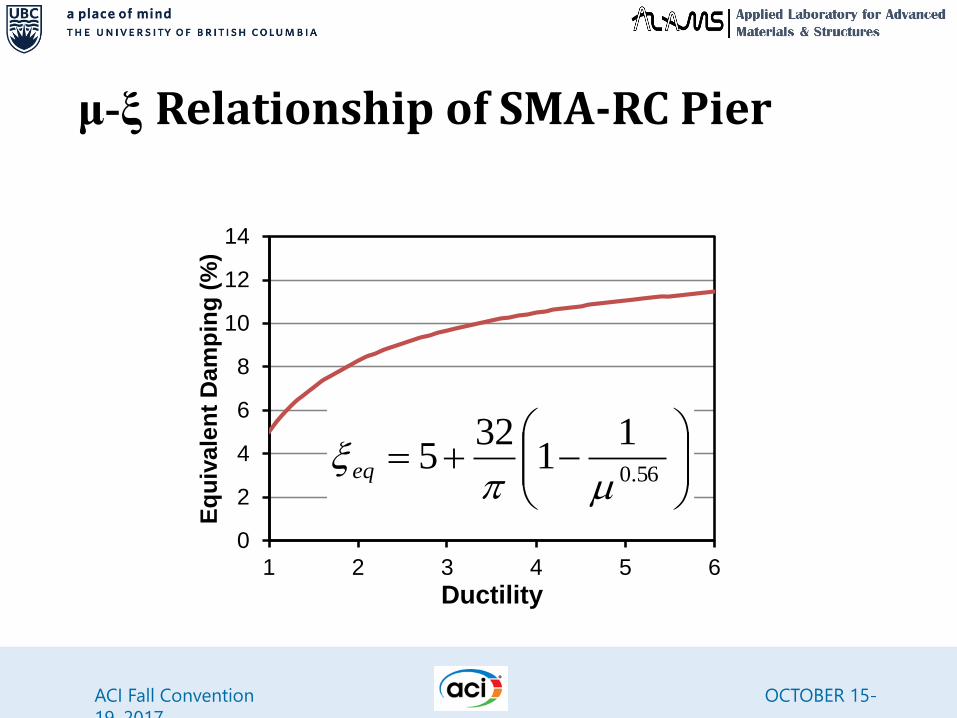
μ-ξ Relationship of SMA-RC Pier
0
2
4
6
8
10
12
14
1 2 3 4 5 6
Eq
uiv
ale
nt
Da
mp
ing
(%
)
Ductility
56.0
11
325
eq
ACI Fall Convention OCTOBER 15-
19, 2017
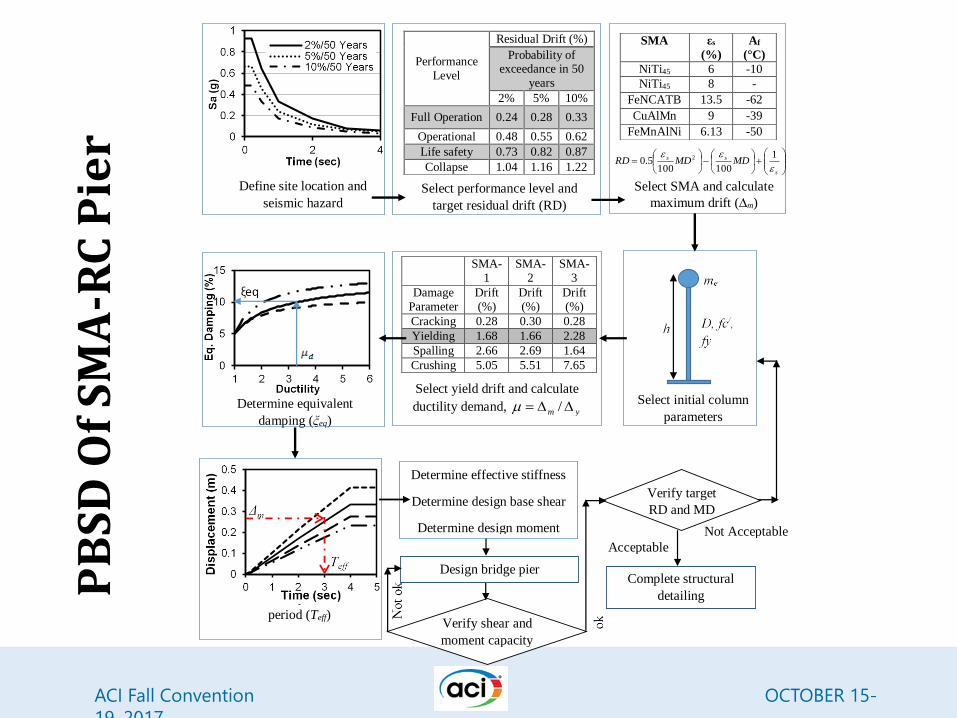
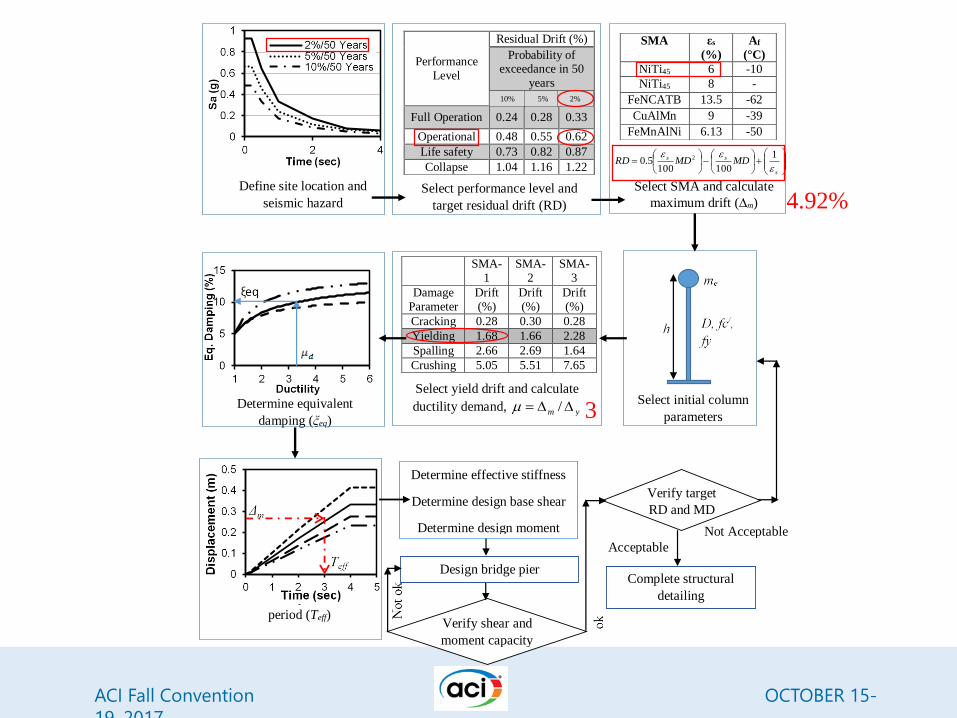
Fig. 1. Flow diagram for PBSD of SMA-RC bridge pier
SMA εs
(%)
Af
(°C)
NiTi45 6 -10
NiTi45 8 -
FeNCATB 13.5 -62
CuAlMn 9 -39
FeMnAlNi 6.13 -50
Performance
Level
Residual Drift (%)
Probability of exceedance in 50
years
2% 5% 10%
Full Operation 0.24 0.28 0.33
Operational 0.48 0.55 0.62
Life safety 0.73 0.82 0.87
Collapse 1.04 1.16 1.22
SMA-
1
SMA-
2
SMA-
3
Damage
Parameter
Drift
(%)
Drift
(%)
Drift
(%)
Cracking 0.28 0.30 0.28
Yielding 1.68 1.66 2.28
Spalling 2.66 2.69 1.64
Crushing 5.05 5.51 7.65
Define site location and
seismic hazard Select performance level and
target residual drift (RD)
Select SMA and calculate
maximum drift (∆m)
residual drift
Select initial column
parameters Determine equivalent
damping (ξeq)
Determine equivalent time
period (Teff)
Determine effective stiffness
Determine design base shear
Determine design moment
Verify target
RD and MD
and design
drift Acceptable
Complete structural
detailing
Not Acceptable
Design bridge pier
Verify shear and
moment capacity
Select yield drift and calculate
ductility demand, ym /
s
ss MDMDRD
1
1001005.0 2
PB
SD
Of
SM
A-R
C P
ier
ACI Fall Convention OCTOBER 15-
19, 2017
Design of SMA-RC Pier
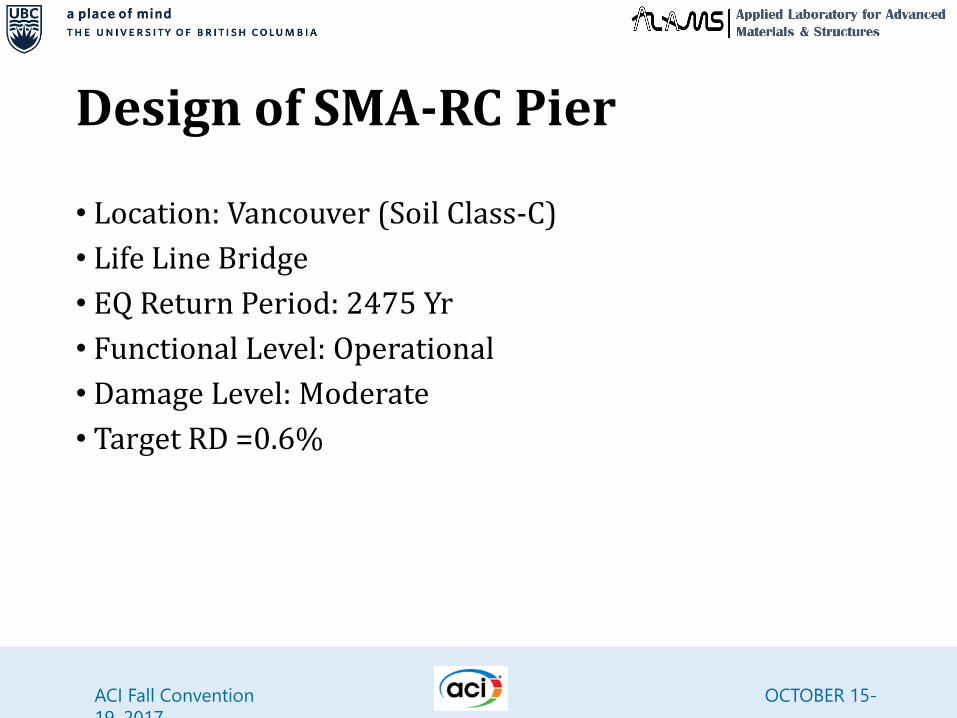
• Location: Vancouver (Soil Class-C)
• Life Line Bridge
• EQ Return Period: 2475 Yr
• Functional Level: Operational
• Damage Level: Moderate
• Target RD =0.6%
ACI Fall Convention OCTOBER 15-
19, 2017
Fig. 1. Flow diagram for PBSD of SMA-RC bridge pier
SMA εs
(%)
Af
(°C)
NiTi45 6 -10
NiTi45 8 -
FeNCATB 13.5 -62
CuAlMn 9 -39
FeMnAlNi 6.13 -50
Performance
Level
Residual Drift (%)
Probability of exceedance in 50
years
2% 5% 10%
Full Operation 0.24 0.28 0.33
Operational 0.48 0.55 0.62
Life safety 0.73 0.82 0.87
Collapse 1.04 1.16 1.22
SMA-
1
SMA-
2
SMA-
3
Damage
Parameter
Drift
(%)
Drift
(%)
Drift
(%)
Cracking 0.28 0.30 0.28
Yielding 1.68 1.66 2.28
Spalling 2.66 2.69 1.64
Crushing 5.05 5.51 7.65
Define site location and
seismic hazard Select performance level and
target residual drift (RD)
Select SMA and calculate
maximum drift (∆m)
residual drift
Select initial column
parameters Determine equivalent
damping (ξeq)
Determine equivalent time
period (Teff)
Determine effective stiffness
Determine design base shear
Determine design moment
Verify target
RD and MD
and design
drift Acceptable
Complete structural
detailing
Not Acceptable
Design bridge pier
Verify shear and
moment capacity
Select yield drift and calculate
ductility demand, ym /
s
ss MDMDRD
1
1001005.0 2
10% 5% 2%
4.92%
3
ACI Fall Convention OCTOBER 15-
19, 2017
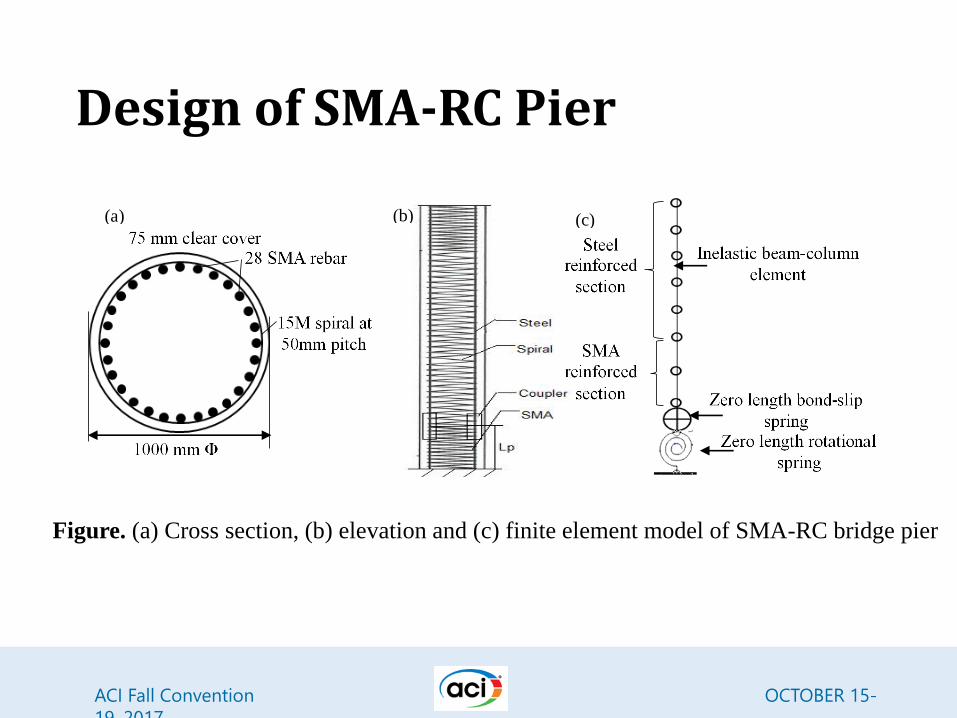
Design of SMA-RC Pier
(a) (b) (c)
Figure. (a) Cross section, (b) elevation and (c) finite element model of SMA-RC bridge pier
ACI Fall Convention OCTOBER 15-
19, 2017
Mander et al. [1988] & Martinez-Rueda and
Elnashai [1997]
Menegotto and Pinto,1973
Stre
ss
Strain
Finite Element Modeling
Stre
ss
Strain
Auricchio and Sacco [1997]
ACI Fall Convention OCTOBER 15-
19, 2017
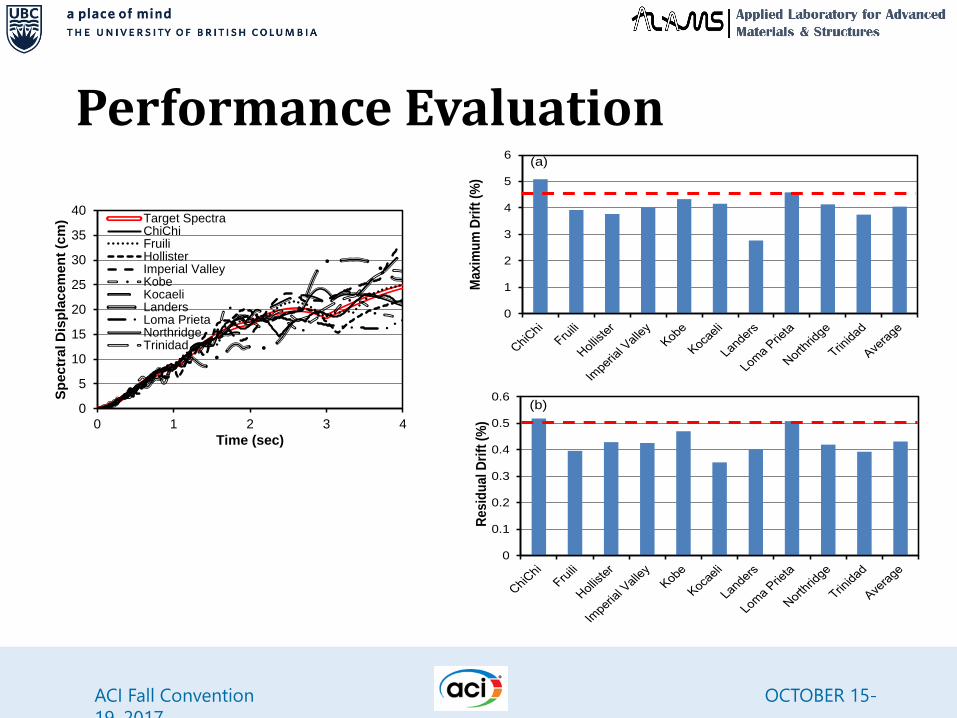
Performance Evaluation
0
1
2
3
4
5
6
Maxim
um
Dri
ft (
%)
(a)
0
0.1
0.2
0.3
0.4
0.5
0.6
Resid
ual D
rift
(%
)
(b)0
5
10
15
20
25
30
35
40
0 1 2 3 4
Sp
ec
tra
l D
isp
lace
me
nt
(cm
)
Time (sec)
Target SpectraChiChiFruiliHollisterImperial ValleyKobeKocaeliLandersLoma PrietaNorthridgeTrinidad
ACI Fall Convention OCTOBER 15-
19, 2017
Conclusions• A new residual drift–based design method
• A comprehensive approach for PBSD of SMA-RC bridge piers
• Meets performance expectations
• Lower residual drift
• Less maintenance cost
ACI Fall Convention OCTOBER 15-
19, 2017
AcknowledgementNatural Sciences and Engineering Research Council of Canada (NSERC)• Discovery Grant• Industrial Postgraduate StudiesBourcet Engineering, Vernon, BCUniversity of British Columbia (UBC)• University Graduate Fellowship (UGF)
ACI Fall Convention OCTOBER 15-
19, 2017
[email protected]@ubc.ca
Questions/Comments
Source:http://www.wsdot.wa.gov/publications/fulltext/Bridge/Shape_Memory.pdf