seismic characterization and evaluation of an old …rbento/tmp/severes/se-50eee_placa_mm_rb.pdf ·...
TRANSCRIPT
Seismic Characterization and Evaluation of an Old Masonry Building M. Monteiro, R. Bento ICIST, Instituto Superior Técnico, Technical University of Lisbon, Portugal
ABSTRACT:
This paper describes the ‘Placa’ buildings and assesses the seismic performance of one of the typologies. These buildings are characteristic of the urban expansion of Lisbon on the decade between 40 and 60 of the twentieth century. This period began after the end of the period of ‘Gaioleiro’ buildings (built between the late nineteenth and the early twentieth century) and it is characterized to be the last type of construction in Lisbon using the masonry as a structural element. This ‘Placa’ buildings still represents an important part of the Lisbon building stock, justifying the assessment of their seismic behavior and the propose of strengthen solutions. In this work a typology of ‘Placa’ buildings was chosen, the so-called ‘Rabo de Bacalhau’ building. Based on data available from the original project and on data defined from on-site visits, it was developed a three-dimensional model of the building using the computer program SAP2000. To validate the model, field ambient vibration tests were performed and experimental and analytical dynamic characteristics of the building were defined and compared. The seismic assessment of the building was performed by means of a linear dynamic response spectrum analysis and the results obtained were discussed. Keywords: Old Masonry Buildings, ‘Placa’ Buildigns, Linear Dynamic Analysis, Response Spectrum
1. INTRODUCTION The ‘Placa’ Buildings coincide with the transition period between the masonry buildings and reinforced concrete ones. This period is characterized by the gradual introduction of reinforced concrete in construction, first by means of slabs (instead of the wooden floor) and later as including complete reinforced concrete frames. It is believed that this type of buildings are considerable vulnerable to the seismic action, essential because the introduction of reinforced concrete slabs represents a significant increase of mass without the increase structural resistance of vertical elements. Nevertheless, this typology still represents an important part of the Lisbon building stock, justifying the development of studies that first assess their seismic behavior and afterwards propose strengthen solutions. The main purpose of work herein present is the study the seismic vulnerability of one typology of ‘Placa’ buildings in Lisbon. Thus, for this paper the ‘Rabo de Bacalhau’ buildings type was chosen (in English ‘Tails of Cod’), which is the most representative of this period (1940-1960). These buildings have a particular plant design with a salient body in the back intended for the service areas: kitchen and bathroom (Figure 1.1). 2. CHARACTERIZATION OF “PLACA” BUILDINGS This typology of buildings built in 1940-1960 is located in different areas of Lisbon: ‘Bairro de Alvalade’ but also in ‘Bairro dos Actores’, and in general have four to six storeys. The ‘Placa’ buildings identify the period of construction characterized by the abandonment of traditional techniques and materials and by the progressive adaptation to effective reinforced concrete structural solutions of construction.
Figure 1.1. Different Plants of ‘Placa’ Buildings – type of “Rabo de Bacalhau
(Costa, 1997).

Usually the foundation of this typology is made by stone masonry very stiff and with a hydraulic mortar. However, in this period, the first reinforced concrete foundations appear in some buildings (RGCU, 1930). The façade walls continue in general to be constituted by rubble stone or brick masonry, usually with wall thicknesses between 0.40m to 0.70m. In some buildings the wall thickness decreases in height (RGCU, 1930). The gabble walls are made with the same materials of the façade walls (with lower thickness) or with concrete blocks. The interior walls were built by brick masonry or by concrete blocks with 0.15m to 0.25m thicknesses. Figure 2.1 represents photos of the different walls that one can find in ‘Placa’ Buildings.
Figure 2.1. Photos of the different walls in the ‘Placa’ Buildings (rubble masonry, concrete blocks and solid and hollow brickwork).
It is during this period that significant differences in the floor level of the buildings arise. The reinforced concrete solutions, firstly introduced as ring beams at the floor level (to ensure the locking of the exterior masonry walls), were progressively replacing other structural elements. Later, it was observed the introduction of reinforced concrete slabs at the level of upper floors just on the back balconies and the service rooms of the houses (kitchens and bathrooms) which was initially applied due to the inadequate behavior of wood in contact with moisture in those humid zones. After, the solution was extended to the whole floor supporting the name ‘Placa’ (meaning concrete slab) given to this typology of buildings. These concrete slabs have approximately 0.1m thickness and are simply supported on masonry walls. Besides that, the slab was barely reinforced by steel rods, generally with only one layer of reinforcement for positive bending moments (Alegre, 1999). At the same time, in this type of buildings the reinforced concrete frame structure (constituted by beams and columns) started to appear to support the concrete slabs. However these elements were designed with minimum dimensions and only for the vertical loads. In addition to the traditional coverage with sloping wooden structure covered with ceramic tile, appeared the first flat roofs built in reinforced concrete forming the terraces (Nereu, 2001). 3. NUMERICAL MODEL OF THE CASE STUDY The ‘Placa’ building used for this study was completed in 1940 and is located in the ‘Bairro dos Actores’, in Lisbon. This building is inserted into a block, where all buildings have the same characteristics and almost the same date of construction. The building chosen has four floors, as depicted in Figure 2.2. The story height of the upper floors is constant with 3.0 m, while the ground floor has a story height of 3.25m. The façade of the building has a length of 14.5m and has 20.5m in depth. For the study of this building, it was possible to access all the information available from the original design, which include plants, façade designs, some calculations for the design of reinforced concrete structure and other elements. Moreover, to complement this information, some visits and some tests to the building were made. At the front, the building has a wooden floor. On the back of the building, supported by the reinforced concrete frame, there is a concrete slab (0.1m thickness) according with the Descriptive Memory (1939).

Figure 2.2. Building façade and Plant of the Case Study (Descriptive Memory, 1939)
The model was performed using SAP 2000 computer program (SAP2000, 2008), which is based on the finite element method. 2.1. Mechanical Properties of Materials The modelling of the building studied began with the definition for the mechanical properties of materials (Table 2.1). Preferably, these values should be based on tests performed in the elements of own building. However the building is still habitable, so intrusive tests were not possible to performed, which is why the values assumed in the model were defined based on data available on some literature, related to studies in buildings with similar properties (Cardoso et.al., 2005; Costa and Oliveira, 1989). Table 2.1. The properties of the materials used in the model.
Materials (and thickness) Local
Weight density γ (kN/m3)
Modulus of Elasticity E
(GPa)
Poisson’s ratio ν
Strength of Materials
σc [MPa] σt [MPa] 𝝉 [MPa]
Rubble Masonry (0.7m)
Front façade 22 3 0.2 4 0.4 0.2
Concrete Block (0.2m) Gable Wall 14 2 0.2 4 0.5 0.3
Brick Masonry (0.2m)
Interior walls and exterior walls on
the back 14.6 1 0.2 5 0.1 0.2
Reinforced Concrete Frame and Floor 24 29 0.2 Concrete
fcd = 10.7 Steel
fyd = 204 1 Assumed value of the pull-out strength for the connections between the timber elements and the façade - timber beams attached to masonry walls (Lopes et. al, 2004)
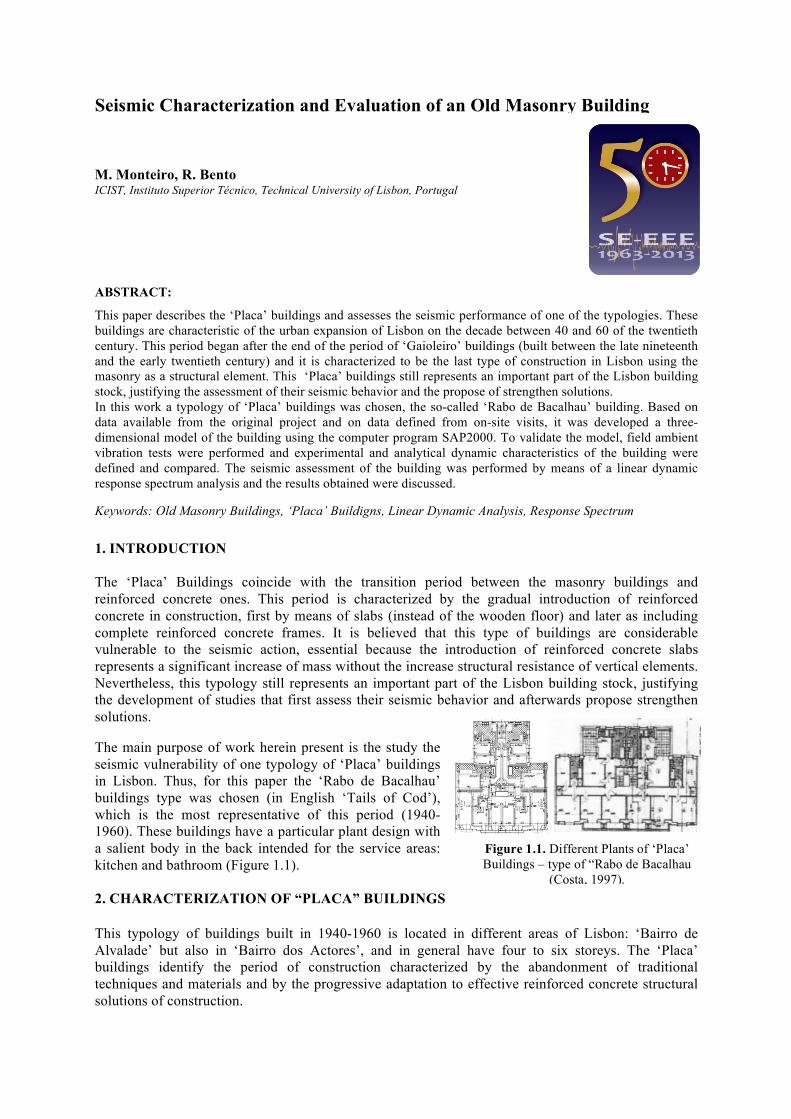
The value of the modulus of elasticity E adopted in this work is an average value of the overall wall behaviour instead than a single masonry element. This parameter is model adequately the behaviour of the structure. Afterwards, some adjustments were made based on the experimental values obtained for the dynamic characteristics of structure, by means of the in-situ ambient vibration tests. 2.2. Structural Elements for the Building Model For modelling the masonry walls were adopted two-dimensional finite elements (shell) of four nodes. So, as shown in Figure 2.3, all the walls were represented in the model for the dynamic analysis, with the exception some of the partition walls, since they have a reduced thickness and thus a small influence on the seismic response of the building. To model the wooden floor a mesh of bar elements was used. For the concrete slab on the back of the building it was chosen to model a rigid diaphragm. The frame elements were also used to model the concrete frame, i.e. the beams and columns, as shown in Figure 2.3. The foundations were considered fully restrained and the structure of the roof was not considered in the model, however it was considered the influence of its mass in the dynamic analysis.
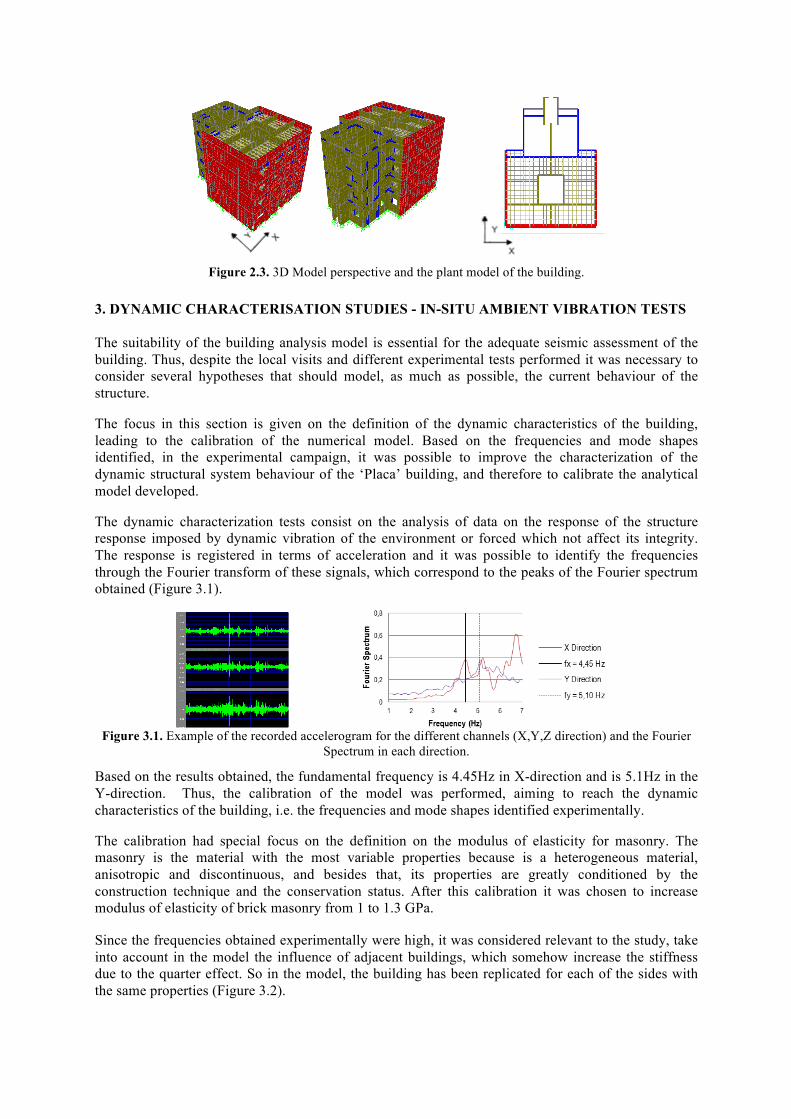
Figure 2.3. 3D Model perspective and the plant model of the building.
3. DYNAMIC CHARACTERISATION STUDIES - IN-SITU AMBIENT VIBRATION TESTS The suitability of the building analysis model is essential for the adequate seismic assessment of the building. Thus, despite the local visits and different experimental tests performed it was necessary to consider several hypotheses that should model, as much as possible, the current behaviour of the structure. The focus in this section is given on the definition of the dynamic characteristics of the building, leading to the calibration of the numerical model. Based on the frequencies and mode shapes identified, in the experimental campaign, it was possible to improve the characterization of the dynamic structural system behaviour of the ‘Placa’ building, and therefore to calibrate the analytical model developed. The dynamic characterization tests consist on the analysis of data on the response of the structure response imposed by dynamic vibration of the environment or forced which not affect its integrity. The response is registered in terms of acceleration and it was possible to identify the frequencies through the Fourier transform of these signals, which correspond to the peaks of the Fourier spectrum obtained (Figure 3.1).
Figure 3.1. Example of the recorded accelerogram for the different channels (X,Y,Z direction) and the Fourier
Spectrum in each direction.
Based on the results obtained, the fundamental frequency is 4.45Hz in X-direction and is 5.1Hz in the Y-direction. Thus, the calibration of the model was performed, aiming to reach the dynamic characteristics of the building, i.e. the frequencies and mode shapes identified experimentally. The calibration had special focus on the definition on the modulus of elasticity for masonry. The masonry is the material with the most variable properties because is a heterogeneous material, anisotropic and discontinuous, and besides that, its properties are greatly conditioned by the construction technique and the conservation status. After this calibration it was chosen to increase modulus of elasticity of brick masonry from 1 to 1.3 GPa. Since the frequencies obtained experimentally were high, it was considered relevant to the study, take into account in the model the influence of adjacent buildings, which somehow increase the stiffness due to the quarter effect. So in the model, the building has been replicated for each of the sides with the same properties (Figure 3.2).
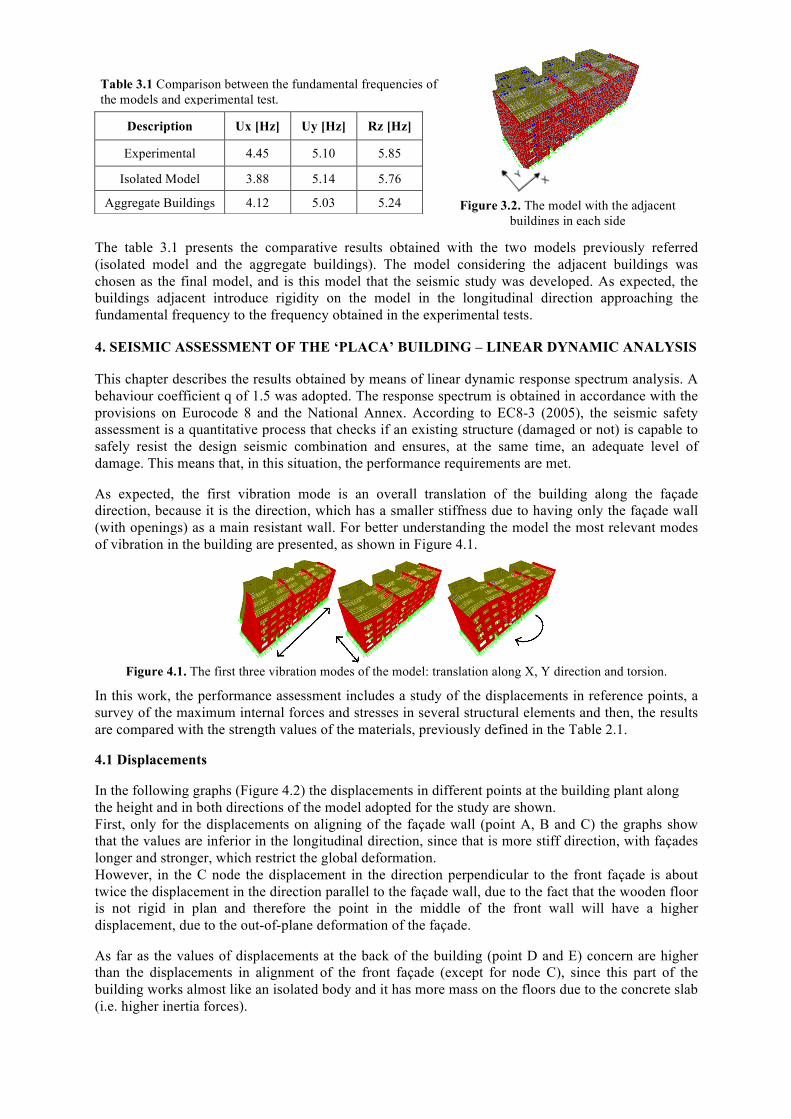
The table 3.1 presents the comparative results obtained with the two models previously referred (isolated model and the aggregate buildings). The model considering the adjacent buildings was chosen as the final model, and is this model that the seismic study was developed. As expected, the buildings adjacent introduce rigidity on the model in the longitudinal direction approaching the fundamental frequency to the frequency obtained in the experimental tests. 4. SEISMIC ASSESSMENT OF THE ‘PLACA’ BUILDING – LINEAR DYNAMIC ANALYSIS This chapter describes the results obtained by means of linear dynamic response spectrum analysis. A behaviour coefficient q of 1.5 was adopted. The response spectrum is obtained in accordance with the provisions on Eurocode 8 and the National Annex. According to EC8-3 (2005), the seismic safety assessment is a quantitative process that checks if an existing structure (damaged or not) is capable to safely resist the design seismic combination and ensures, at the same time, an adequate level of damage. This means that, in this situation, the performance requirements are met. As expected, the first vibration mode is an overall translation of the building along the façade direction, because it is the direction, which has a smaller stiffness due to having only the façade wall (with openings) as a main resistant wall. For better understanding the model the most relevant modes of vibration in the building are presented, as shown in Figure 4.1.
Figure 4.1. The first three vibration modes of the model: translation along X, Y direction and torsion.
In this work, the performance assessment includes a study of the displacements in reference points, a survey of the maximum internal forces and stresses in several structural elements and then, the results are compared with the strength values of the materials, previously defined in the Table 2.1. 4.1 Displacements In the following graphs (Figure 4.2) the displacements in different points at the building plant along the height and in both directions of the model adopted for the study are shown. First, only for the displacements on aligning of the façade wall (point A, B and C) the graphs show that the values are inferior in the longitudinal direction, since that is more stiff direction, with façades longer and stronger, which restrict the global deformation. However, in the C node the displacement in the direction perpendicular to the front façade is about twice the displacement in the direction parallel to the façade wall, due to the fact that the wooden floor is not rigid in plan and therefore the point in the middle of the front wall will have a higher displacement, due to the out-of-plane deformation of the façade. As far as the values of displacements at the back of the building (point D and E) concern are higher than the displacements in alignment of the front façade (except for node C), since this part of the building works almost like an isolated body and it has more mass on the floors due to the concrete slab (i.e. higher inertia forces).
Description Ux [Hz] Uy [Hz] Rz [Hz]
Experimental 4.45 5.10 5.85
Isolated Model 3.88 5.14 5.76
Aggregate Buildings 4.12 5.03 5.24 Figure 3.2. The model with the adjacent buildings in each side
Table 3.1 Comparison between the fundamental frequencies of the models and experimental test.

Figure 4.2. Displacements in X and Y direction for the model adopted. One the other hand, by analysing the interstory drift in each type of floor and in each direction, it is observed that the limits imposed by the different regulation are not exceeded (always less than 0.1%). This is mainly due to the high stiffness of the building, with displacements values very small. 4.2 Stresses and Internal Forces in Structural Elements In this section the values of the stresses obtained for the walls and the values of internal forces for the reinforced concrete frame are presented. Then the main seismic demand values obtained are compared with the capacity values. 4.2.1 Walls In this section and for each wall is presented the stress distribution corresponding to the seismic load combination. In the following, the distribution of vertical and shear stresses in the façade wall is depicted. The stresses values shown in all figures are in kPa.
Figure 4.3. Diagram for the masonry of the façade due to the seismic load combination: a) and b) Vertical stress
(maximum compression and tensile stress), c) Shear stress
Analysing the distribution of stresses, it is clear higher values of compression stresses, particularly at level of the vertical elements on the ground floor façade. However, in this case the maximum stress corresponds to approximately 35% of the compressive stress capacity. The use of masonry as a structural element is essentially based on its compression behaviour. In general, there is a stress concentration close to the openings, due to the discontinuities in the façade. This zones corresponding to the areas where the main cracking is expected. In the vertical elements of the façades at the level of the ground floor there are considerable axial tensile stresses. Nevertheless, these values do not exceed the resistance values. The analysis of the shear stresses distribution in the façade (Figure 4.3.c) shows that the stress resistance values are exceeded in the ground floor level, between the openings and in the zone corresponding to the ground floor piers. These values are three times higher than the maximum limits, so these elements reach their resistance values by more than half, for the seismic design load expected. Other elements with great importance to support horizontal loads are also the gable walls of buildings, made of concrete blocks without openings. The analysis of shear stresses in these elements is presented in the following figure.
X Direction Y Direction
a) b) c)
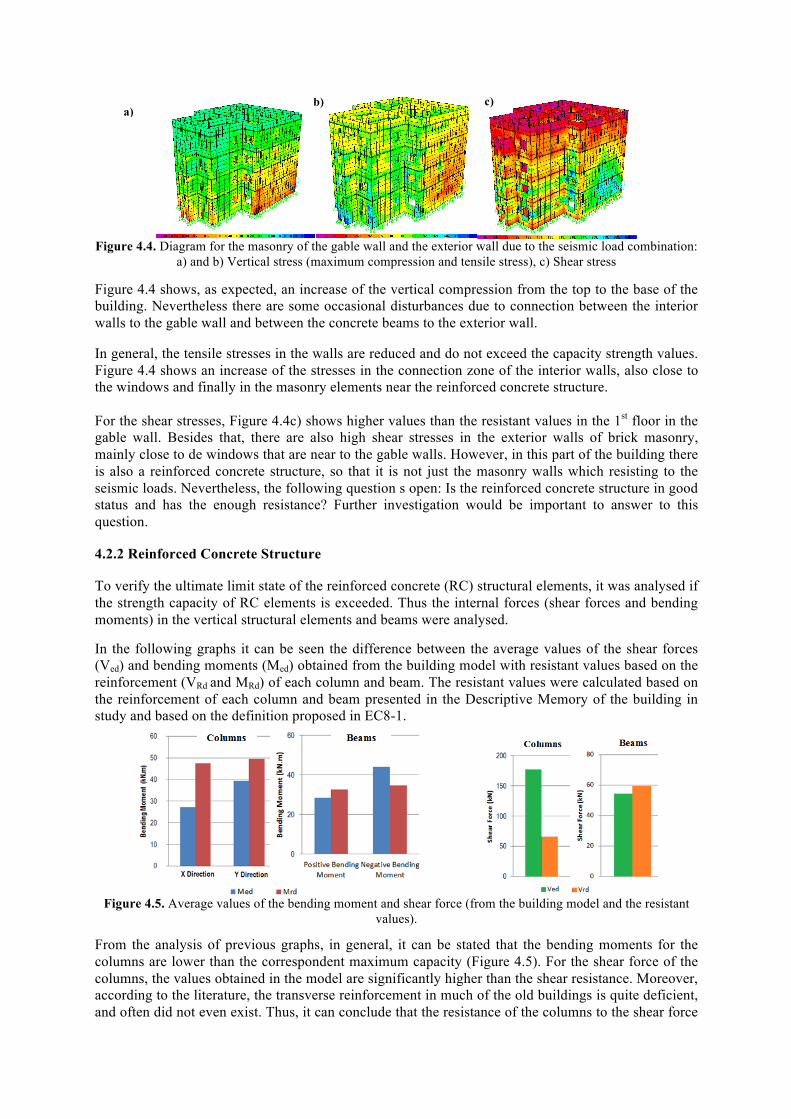
Figure 4.4. Diagram for the masonry of the gable wall and the exterior wall due to the seismic load combination:
a) and b) Vertical stress (maximum compression and tensile stress), c) Shear stress
Figure 4.4 shows, as expected, an increase of the vertical compression from the top to the base of the building. Nevertheless there are some occasional disturbances due to connection between the interior walls to the gable wall and between the concrete beams to the exterior wall. In general, the tensile stresses in the walls are reduced and do not exceed the capacity strength values. Figure 4.4 shows an increase of the stresses in the connection zone of the interior walls, also close to the windows and finally in the masonry elements near the reinforced concrete structure. For the shear stresses, Figure 4.4c) shows higher values than the resistant values in the 1st floor in the gable wall. Besides that, there are also high shear stresses in the exterior walls of brick masonry, mainly close to de windows that are near to the gable walls. However, in this part of the building there is also a reinforced concrete structure, so that it is not just the masonry walls which resisting to the seismic loads. Nevertheless, the following question s open: Is the reinforced concrete structure in good status and has the enough resistance? Further investigation would be important to answer to this question. 4.2.2 Reinforced Concrete Structure To verify the ultimate limit state of the reinforced concrete (RC) structural elements, it was analysed if the strength capacity of RC elements is exceeded. Thus the internal forces (shear forces and bending moments) in the vertical structural elements and beams were analysed. In the following graphs it can be seen the difference between the average values of the shear forces (Ved) and bending moments (Med) obtained from the building model with resistant values based on the reinforcement (VRd and MRd) of each column and beam. The resistant values were calculated based on the reinforcement of each column and beam presented in the Descriptive Memory of the building in study and based on the definition proposed in EC8-1.
Figure 4.5. Average values of the bending moment and shear force (from the building model and the resistant
values).
From the analysis of previous graphs, in general, it can be stated that the bending moments for the columns are lower than the correspondent maximum capacity (Figure 4.5). For the shear force of the columns, the values obtained in the model are significantly higher than the shear resistance. Moreover, according to the literature, the transverse reinforcement in much of the old buildings is quite deficient, and often did not even exist. Thus, it can conclude that the resistance of the columns to the shear force
a) b) c)

will be a serious problem and will certainly contribute to the possible collapse of the structure on the back part of the building. In general for the beams, the shear forces and bending moments between the values observed from the building model and the resistant values based on the reinforcement are almost the same. 5. CONCLUSION The three-dimensional dynamic response spectrum modal analysis of the ‘Placa’ building presented in this paper allows reaching some conclusions in relation to the seismic performance of the existent structure studied. In particular, it can be listed the following overall conclusions: • First, it was possible to know more about the structure of the 'Placa' buildings and their materials,
because no other identical studies was found in relation to this type of buildings. • The stiffest direction of the building corresponding to the transverse direction due to the gable
walls, while in the other direction only the wall of the façade behaves as a resistance element. Besides that, the salient body on the back works almost likes an isolated body, so it is more flexible and therefore presents higher values of displacements.
• In the façades, the resistance values of shear stresses for the seismic load combination are exceeded, especially in the vertical elements of the first floor. The results obtained showed that the first damage by shear in the façade elements should occur at lower levels of seismic intensity.
• For the vertical stress, tensile values in the base of the façade at the ground floor was obtained, signifying opening of tensile cracks in the joints accompanied by a reduction in the overall stiffness of the columns. However, the maximum values were not exceeded. On the other hand, the compression stresses in the piers of the façades are still far from the values of resistance adopted.
• In general the gable walls and the exterior walls are not subjected to high stress values. Only some higher values than the allowable stresses can be seen in localized areas, corresponding to the connection between the interior walls (parallel to the façade) to the gable walls. This happens essentially due to the weak connection between these walls; there are a lot of openings in these zones and the area of masonry that connects both walls are minimal.
• Finally, in relation to the reinforced concrete structure, existing in the back of the building, the main problem corresponds to the shear resistance of the columns.
6. AKCNOWLEDGEMENT The authors would like to acknowledge the financial support of the Portuguese Foundation for Science and Technology (Ministry of Science and Technology of the Republic of Portugal) through the research project PTDC/ECM/100872/2008 named ‘Seismic Vulnerability of Old Masonry Buildings’. REFERENCES
Alegre, A. (1999). Study Diagnostic Consultation and Support for the Rehabilitation of the Economic Rents of the Houses in Cells I and II in the Alvalade District, M.Sc. Thesis in Construção, Instituto Superior Técnico, Universidade Técnica de Lisboa, May 1999, Lisbon, Portugal (in Portuguese). Cardoso, R, Lopes M, Bento R, (2005). Seismic evaluation of old masonry buildings. Part I: Method Description and application to a case-study, Engineering Structures 27, 2024–2035. Costa, M. G.; Oliveira, C. S. (1989). Seismic Behavior of Old Buildings Deployed in Quarter: Meeting on Seismology and Earthquake Engineering, Lisbon, November 1989 (in Portuguese). Costa, J. (1997). Alvalade neighborhood: considerations on urban housing. M.Sc. Thesis in Cultura Arquitectónica Contemporânea e Construção da Sociedade Moderna, Faculdade de Arquitectura, Universidade Técnica de Lisboa, 1997, Lisbon, Portugal (in Portuguese). Descriptive Memory of the building design (1939). Arquivo Municipal de Lisboa: Obra 52869, Processo 28208/DSC/PG/1939 – Rua Actor Isidoro, 13 EC8.3 Eurocode 8 (2005): Design of structures for earthquake resistance - Part 3: Assessment and retrofitting of buildings, CEN (ENV 1998-3), 2005; Lopes, M. S., Bento, R., Monteiro, M. (2004). Seismic Analysis of a ‘Pombalino’ Quarter, Instituto Superior Técnico, Universidade Técnica de Lisboa, 2004 (in Portuguese). RGCU General Regulation of Urban Construction for the City of Lisbon (1930). Lisbon City Hall, 1930, Lisbon, Portugal (in Portuguese). SAP 2000 (2008). Analysis Reference – Computers and Structures Inc, Berkeley USA, 2008.