seismic attribute analysis of the 3-d depth …...seismic attributes enhance subtle amplitude and...
TRANSCRIPT
Proceedings World Geothermal Congress 2010 Bali, Indonesia, 25-29 April 2010
1
Seismic Attribute Analysis of the 3-D Depth Migrated Image and Its Correlation with the Induced Microseismicity
Jaya, M. S. (1,2), Buske, S. (2), Kummerow, J. (2), Reshetnikov, A. (2) and Shapiro, S. (2) (1) ITS Surabaya, Indonesia (2) Geophysics Dept., FU Berlin, Germany
E-mail: [email protected]
Keywords: Microseismicity, seismic migration image, seismic attribute analysis
ABSTRACT
In this paper the use of seismic attributes calculated from depth-migrated seismic data has been employed. The goal applying seismic attribute analysis is to enhance subtle amplitudes resulted from 3-D depth seismic migration and to obtain a clear mutual correlation with microseismic events. The interpretation of fault geometries associated with microseismic events calculated in the region proved to be more feasible using seismic attributes. In the data set investigated in this work, features of particular interest are two dominant fault systems encountered at about 7.2 and 4.0 km depths. Both, strong (hereafter called SE1, at 7.2 km depth) and weak (hereafter called SE2, at 4.0 km depth) faults are more evident in the seismic attribute representation. In addition, using such a representation, it is possible to develop the further interpretation of complex fault systems encountered at about 3.5-7.2 km depths which probably constitutes the regional tectonics. The joint representation of seismic attributes and microseismic events has proven to be able to provide further evidence of this correlation.
1. INTRODUCTION
Among a variety of geophysical experiments that have been carried out at the German Deep Drilling Site, KTB, during the last 20 years, there stand out a 3-D steep-angle seismic experiment and three fluid injection experiments which triggered microseismicity (e.g., Harjes et al., 1997; Buske, 1999; Baisch et al., 2002; Shapiro et al., 2006).
Combination of 3-D image and microseismic location showed a mutual relationship between seismic reflectivity, hypocenters of induced earthquakes and hydraulic diffusivity (Rothert et al., 2003; Shapiro, et al., 2006). So far, those studies have been performed using different velocity models without taking any consideration which model fit best the observed data.
This is the motivation in the present study to quantify the effect of different velocity models, to select the best model and then to reprocess the seismic data using a uniform velocity model. We relocate the induced micro-earthquakes from the long-term KTB2004/05 injection experiment (Shapiro et al., 2006), and then apply seismic attributes to the depth-migrated reflection seismic data.
Theoretically, migrated seismic data should represent the impedance contrast in the subsurface. Here, we refer to the amplitudes of migrated seismic data as seismic reflectivity. Conventional migrated seismic data are band limited and therefore provide limited geological information. This is particularly important when the migrated seismic data are taken as the base for the physical interpretation of
subsurface geologic architecture. Hence, interpreting geological structures using only the original seismic reflectivity image can –in some cases- deteriorate specific geological structure features, e.g. reflectors, faults, etc.
In this paper the use of seismic attributes calculated from depth-migrated seismic data has been employed. The seismic attributes are represented in the form of absolute energy values calculated using the Hilbert transform of migrated seismic data. In this work, the seismic data analysis using seismic attributes is encouraging due to its capability to enhance specific geological features which were we not able to obtain using only the original migrated seismic data. The interpretation of fault geometries associated with microseismic events calculated in the region proved to be more feasible using seismic attributes.
In the data set investigated in this work, features of particular interest are two dominant fault systems encountered at about 7.2 and 4.0 km depths. Both, strong (hereafter called SE1, at 7.2 km depth) and weak (hereafter called SE2, at 4.0 km depth) faults are more evident in the seismic attribute representation. In addition, using such a representation, it is possible to develop the further interpretation of complex fault systems encountered at about 3.5-7.2 km depths which probably constitutes the regional tectonics. Recently, an effort has been made to investigate the correlation of seismic reflectivity and microseismic events (Shapiro et al., 2006), in particular to those related to the SE2 fault. The joint representation of seismic attributes and microseismic events has proven to be able to provide further evidence of this correlation.
2. SEISMIC DATA
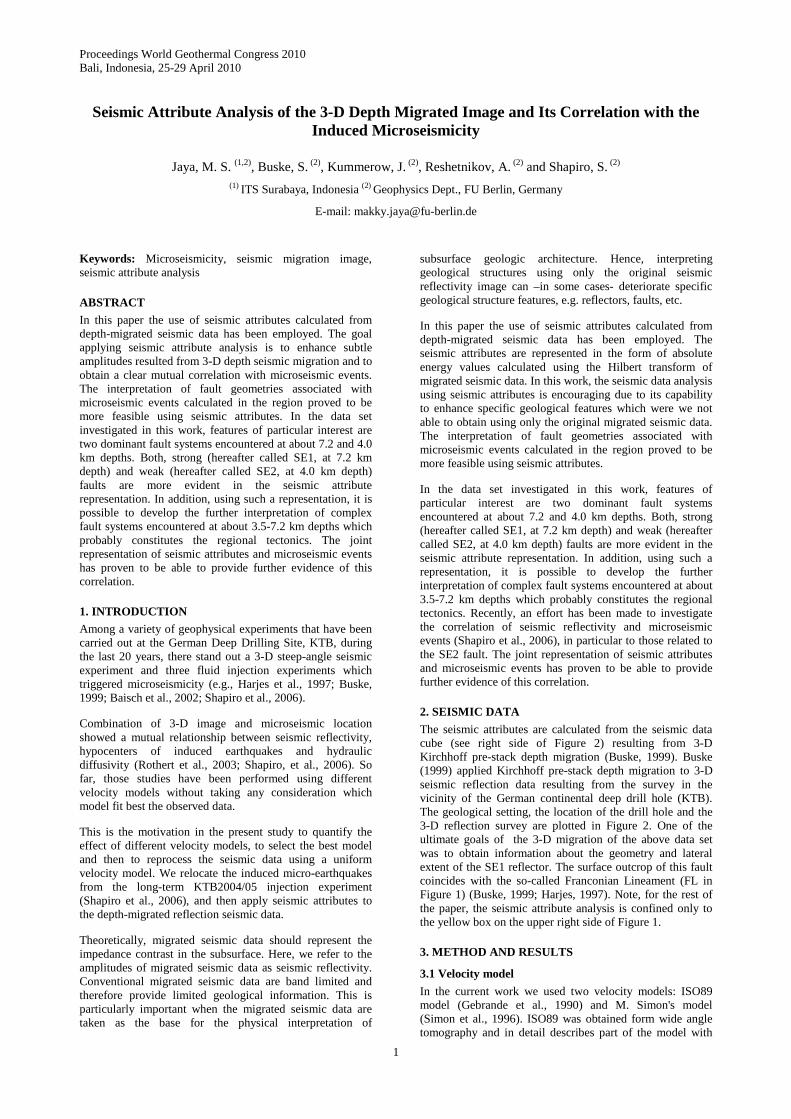
The seismic attributes are calculated from the seismic data cube (see right side of Figure 2) resulting from 3-D Kirchhoff pre-stack depth migration (Buske, 1999). Buske (1999) applied Kirchhoff pre-stack depth migration to 3-D seismic reflection data resulting from the survey in the vicinity of the German continental deep drill hole (KTB). The geological setting, the location of the drill hole and the 3-D reflection survey are plotted in Figure 2. One of the ultimate goals of the 3-D migration of the above data set was to obtain information about the geometry and lateral extent of the SE1 reflector. The surface outcrop of this fault coincides with the so-called Franconian Lineament (FL in Figure 1) (Buske, 1999; Harjes, 1997). Note, for the rest of the paper, the seismic attribute analysis is confined only to the yellow box on the upper right side of Figure 1.
3. METHOD AND RESULTS
3.1 Velocity model
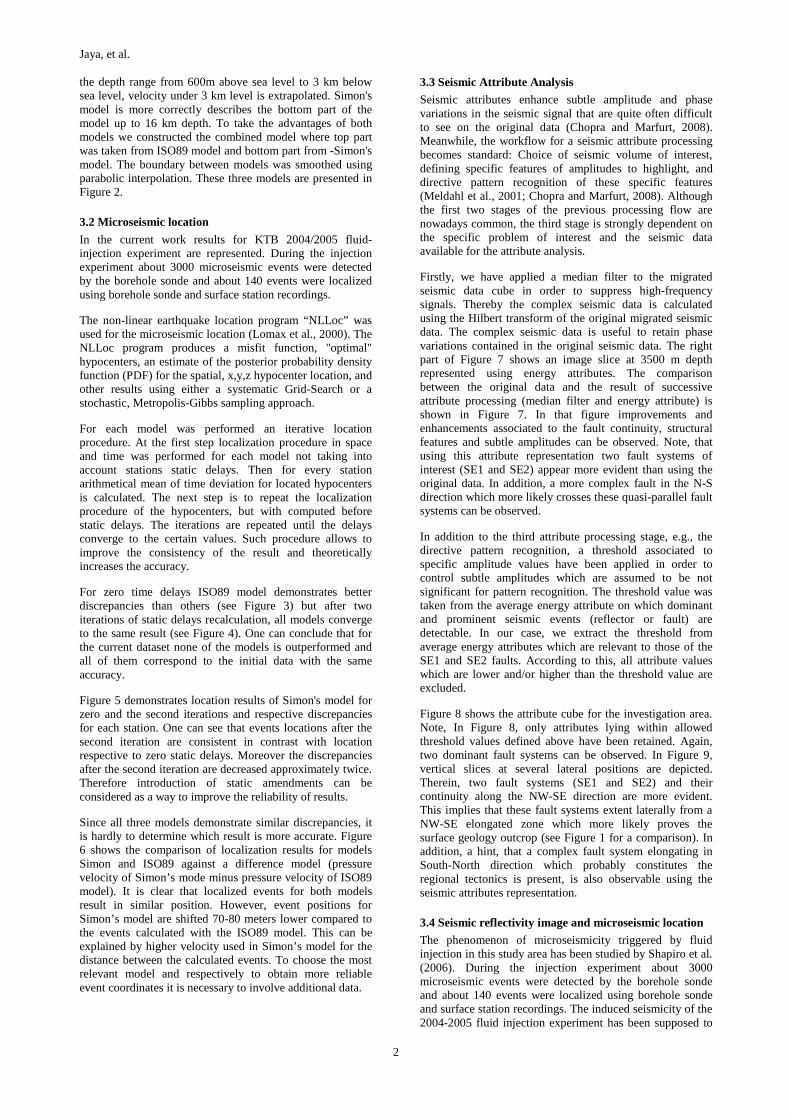
In the current work we used two velocity models: ISO89 model (Gebrande et al., 1990) and M. Simon's model (Simon et al., 1996). ISO89 was obtained form wide angle tomography and in detail describes part of the model with
Jaya, et al.
2
the depth range from 600m above sea level to 3 km below sea level, velocity under 3 km level is extrapolated. Simon's model is more correctly describes the bottom part of the model up to 16 km depth. To take the advantages of both models we constructed the combined model where top part was taken from ISO89 model and bottom part from -Simon's model. The boundary between models was smoothed using parabolic interpolation. These three models are presented in Figure 2.
3.2 Microseismic location
In the current work results for KTB 2004/2005 fluid-injection experiment are represented. During the injection experiment about 3000 microseismic events were detected by the borehole sonde and about 140 events were localized using borehole sonde and surface station recordings.
The non-linear earthquake location program “NLLoc” was used for the microseismic location (Lomax et al., 2000). The NLLoc program produces a misfit function, "optimal" hypocenters, an estimate of the posterior probability density function (PDF) for the spatial, x,y,z hypocenter location, and other results using either a systematic Grid-Search or a stochastic, Metropolis-Gibbs sampling approach.
For each model was performed an iterative location procedure. At the first step localization procedure in space and time was performed for each model not taking into account stations static delays. Then for every station arithmetical mean of time deviation for located hypocenters is calculated. The next step is to repeat the localization procedure of the hypocenters, but with computed before static delays. The iterations are repeated until the delays converge to the certain values. Such procedure allows to improve the consistency of the result and theoretically increases the accuracy.
For zero time delays ISO89 model demonstrates better discrepancies than others (see Figure 3) but after two iterations of static delays recalculation, all models converge to the same result (see Figure 4). One can conclude that for the current dataset none of the models is outperformed and all of them correspond to the initial data with the same accuracy.
Figure 5 demonstrates location results of Simon's model for zero and the second iterations and respective discrepancies for each station. One can see that events locations after the second iteration are consistent in contrast with location respective to zero static delays. Moreover the discrepancies after the second iteration are decreased approximately twice. Therefore introduction of static amendments can be considered as a way to improve the reliability of results.
Since all three models demonstrate similar discrepancies, it is hardly to determine which result is more accurate. Figure 6 shows the comparison of localization results for models Simon and ISO89 against a difference model (pressure velocity of Simon’s mode minus pressure velocity of ISO89 model). It is clear that localized events for both models result in similar position. However, event positions for Simon’s model are shifted 70-80 meters lower compared to the events calculated with the ISO89 model. This can be explained by higher velocity used in Simon’s model for the distance between the calculated events. To choose the most relevant model and respectively to obtain more reliable event coordinates it is necessary to involve additional data.
3.3 Seismic Attribute Analysis
Seismic attributes enhance subtle amplitude and phase variations in the seismic signal that are quite often difficult to see on the original data (Chopra and Marfurt, 2008). Meanwhile, the workflow for a seismic attribute processing becomes standard: Choice of seismic volume of interest, defining specific features of amplitudes to highlight, and directive pattern recognition of these specific features (Meldahl et al., 2001; Chopra and Marfurt, 2008). Although the first two stages of the previous processing flow are nowadays common, the third stage is strongly dependent on the specific problem of interest and the seismic data available for the attribute analysis.
Firstly, we have applied a median filter to the migrated seismic data cube in order to suppress high-frequency signals. Thereby the complex seismic data is calculated using the Hilbert transform of the original migrated seismic data. The complex seismic data is useful to retain phase variations contained in the original seismic data. The right part of Figure 7 shows an image slice at 3500 m depth represented using energy attributes. The comparison between the original data and the result of successive attribute processing (median filter and energy attribute) is shown in Figure 7. In that figure improvements and enhancements associated to the fault continuity, structural features and subtle amplitudes can be observed. Note, that using this attribute representation two fault systems of interest (SE1 and SE2) appear more evident than using the original data. In addition, a more complex fault in the N-S direction which more likely crosses these quasi-parallel fault systems can be observed.
In addition to the third attribute processing stage, e.g., the directive pattern recognition, a threshold associated to specific amplitude values have been applied in order to control subtle amplitudes which are assumed to be not significant for pattern recognition. The threshold value was taken from the average energy attribute on which dominant and prominent seismic events (reflector or fault) are detectable. In our case, we extract the threshold from average energy attributes which are relevant to those of the SE1 and SE2 faults. According to this, all attribute values which are lower and/or higher than the threshold value are excluded.
Figure 8 shows the attribute cube for the investigation area. Note, In Figure 8, only attributes lying within allowed threshold values defined above have been retained. Again, two dominant fault systems can be observed. In Figure 9, vertical slices at several lateral positions are depicted. Therein, two fault systems (SE1 and SE2) and their continuity along the NW-SE direction are more evident. This implies that these fault systems extent laterally from a NW-SE elongated zone which more likely proves the surface geology outcrop (see Figure 1 for a comparison). In addition, a hint, that a complex fault system elongating in South-North direction which probably constitutes the regional tectonics is present, is also observable using the seismic attributes representation.
3.4 Seismic reflectivity image and microseismic location
The phenomenon of microseismicity triggered by fluid injection in this study area has been studied by Shapiro et al. (2006). During the injection experiment about 3000 microseismic events were detected by the borehole sonde and about 140 events were localized using borehole sonde and surface station recordings. The induced seismicity of the 2004-2005 fluid injection experiment has been supposed to

Jaya et al.
3
be related to the SE2 fault which was not clearly detected using only the original seismic data cube. Here, we give the evidence that microseismic events from the 2004-2005 monitoring overlaid in Figures 7, 8 and 9 are correlated very well to the SE2 fault and therefore approve the conclusion of Shapiro et al. (2006).
4. CONCLUSIONS
The use of seismic attributes for reflectivity enhancement has been applied to 3-D Kirchhoff pre-stack depth migrated data at the German Continental Deep Drilling Site. The seismic data analysis using seismic attributes is shown to be amenable due to its superiority in enhancing specific geological features which were not able to obtain using only the original migrated seismic data. The interpretation of fault geometries associated with microseismic events proved to be more feasible using seismic attributes. Features of particular interest are two dominant fault systems encountered at about 7.2 and 4.0 km depths. Both, SE1 and SE2 faults are more evident using seismic attributes. In addition, a hint, that a complex fault system elongating in the South-North direction which probably constitutes the regional tectonics, is also observable using the seismic attributes representation. Recently, an effort has been made to investigate the correlation of seismic reflectivity and microseismic events, in particularly to those related to SE2 fault. The joint representation of seismic attributes and microseismic events has proven to be able to provide evidence of this correlation
ACKNOWLEDGMENTS
The authors are indebted to appreciate the support of the German Ministry for Research and Education for the project: “MeProRisk: Novel Methodds for Prediction and Risk Assessment in Exploration, Development and Utilisation of Geothermal Reservoir” (Project-ID: 03SF0326B). Suggestions and remarks from anonymous reviewers are appreciated for the improvement of the paper.
REFERENCES
Baisch, S., M. Bohnhoff, L. Ceranna, Y. Tu and H.-P. Harjes, Probing the crust to 9-km depth. Fluid-injection experiments and induced seismicity at the KTB superdeep drilling hole, Germany, BSSA, Vol. 92, No. 6, 2369-2380, 2002
Buske, S., 3-D prestack Kirchhoff migration of the ISO89-3D data set, Pure Appl. Geophys., 156, Nos. 1/2, 157-171, 1999.
Chopra, S. and K. J. Marfurt, Emerging and future trends in seismic attributes, The Leading Edge, Vol. 27, No. 3, 298-318, 2008.
Gebrande, H., M. Bopp, M. Meichelböck and P. Neurieder}, 3-D wide-angle investigations in the KTB surroundings as part of the Integrated Seismics Oberpfalz 1989 (ISO 89), In “KTB Report 90-6b, DEKORP Report, Integrated Seismics Oberpfalz 1989”, Niedersächsisches Landesamt für Bodenforschung, Hannover, Editors: H.J. Dürbaum, C. Reichert and K. Bram, 183-208, 1990.
Harjes, H.-P., et al., Origin and nature of crustal reflections: Results from integrated seismic measurements at the KTB superdeep drilling site, J. Geophys. Res., 102(B8), 18,267–18,288, 1997.
Lomax, A., J. Virieux, P. Volant and C. Berge, Probabilistic earthquake location in 3-D and layered models: Introduction of a Metropolis-Gibbs method and comparison with linear locations, In “Advances in Seismic Event Location”, Editors: C. H. Thurber and N. Rabinowitz, 101-134, Kluwer, Amsterdam, 2000.
Meldahl, P., R. Heggland, B. Bril, An iterative method for identifying seismic objects by their texture, orientation and size, Expanded Abstract, 71st SEG Meeting, San Antonio, 2001.
Rothert, E., S.A. Shapiro, S. Buske and M. Bohnhoff, Mutual relationship between microseismicity and seismic reflectivity: Case study at the German Continental Deep Drilling Site (KTB), Geophys. Res. Lett., Vol. 30, No. 17, doi:10.1029/2003GL017848, 2003
Shapiro, S.A., Kummerow, J., Dinske, C., Asch, G., Rothert, E., Erzinger, J., Kümpel, H.-J., Kind, R., Fluid induced seismicity guided by a continental fault: Injection experiment of 2004/2005 at the German Deep Drilling Site (KTB). Geophys. Res. Lett., Vol. 33, No. 1, L01309, doi:10.1029/2005GL024659, 2006.
Simon, M., H. Gebrande and M. Bopp, Prestack Migration and True-amplitude Processing of DEKORP Near-normal Incidence and Wide-angle Reflection Measurements, Tectonophysics, Vol. 264, 381-392}, 1996.
Jaya, et al.
4
21 km
21 km
N
E
Microseismic events:-Red sphere (without static)-Green sphere (with static)
Depth = 3.5 km
Highest reflectivity
Lowest reflectivity
Investigation zone
Figure 1: The location of the German continental deep drill hole overlaid by the regional surface geology (left side). The legend on the lower right side explains the geological characteristics (Harjes, et al., 1997). The 3-D reflection survey area is indicated by the thin black box. A migrated image slice (Buske, 1999) at 3500 m depth is shown on the upper right side.
Figure 2: Three velocity models used for microseismic location and seismic imaging.

Jaya et al.
5
Figure 3. Discrepancies for located events when zero delays are used.
Figure 4. Discrepancies after second iteration for zero static delys and second iteration static delays.

Jaya, et al.
6
Figure 5. Location result for Simon’s model with zero time delays at the second iteration. The data discrepancies are shown in the lower figure.
Figure 6. Comparison of location results for Simon’s and ISO89 models after second iteration. Different model (Simon’s model minus ISO89 model) is presented on the background.

Jaya et al.
7
1 km1 km
NN
Figure 7:The original data (left side) and image resulting from attribute processing (right side) shown for an image slice at 3500 m depth. The box size of these figures corresponds to the size of the yellow box in Figure 1. Circles denote locations of induced microseismic events.
SW
NE
N
Figure 8: The attribute cube resulting from applying successive attribute analysis of the original seismic data cube.
NESW
SE1SE2
Figure 9: Vertical slices at several lateral positions. Note that the view direction is from NW to SE.