seismic a and b-values and crustal parameters of samos
TRANSCRIPT

833
http://journals.tubitak.gov.tr/earth/
Turkish Journal of Earth Sciences Turkish J Earth Sci(2021) 30: 833-850© TÜBİTAKdoi:10.3906/yer-2107-13
Seismic a and b-values and crustal parameters of Samos Island-Aegean Sea, Lesvos Island-Karaburun, Kos Island-Gökova Bay earthquakes
Oya ANKAYA PAMUKÇU1, Fikret DOĞRU2, Ayça ÇIRMIK1,*, Düzgün GÖNEŞ1
1Department of Geophysical Engineering, Faculty of Engineering, Dokuz Eylül University, Buca, İzmir, Turkey2Department of Construction Technology, Atatürk University, Oltu Vocational Collage, Erzurum, Turkey
* Correspondence: [email protected]
1. IntroductionThe Aegean Sea and West Anatolia are the significant active seismic and deformation areas in the world with the effect of the interaction of Anatolian, Eurasian and African tectonic plates since Pliocene (Bozkurt, 2001; Brun et al., 2016; Dewey and Şengor, 1979; Jackson and Mckenzie, 1984; Yilmaz et al., 2000; Jolivet and Brun, 2010; Kaymakci, 2006; Sozbilir et al., 2011). Western Anatolia is defined by a tectonically active N-S directed extensional tectonic system called as West Anatolian Extensional Province where a few E-W trending grabens have been occurred, such as Gediz Graben, Küçük Menderes Graben, Büyük Menderes Graben and Gökova Bay (McKenzie, 1972; Dewey and Şengor, 1979; Jackson and Mckenzie, 1984; Sengor, 1987) (Figure 1).
Several earthquakes have been occurred in the shores of Aegean Sea and West Anatolia both in the historical and instrumental period. From North to South, Lesvos Island, Samos Island and Kos Island which are located
in the seismologically active Aegean Sea, present intensive seismic activity. Lesvos Island includes E-W and approximately N-S trending multiple fault structures (Yildiz et al., 2021). In the southern part of Lesvos Island, offshore of Karaburun (İzmir), Lesvos Island-Karaburun earthquake occurred on 12th June 2017 with a magnitude of 6.2 and affected a wide region (Kandilli Observatory and Earthquake Research Center (KOERI), 2017; Sözbilir et al., 2017; Briole et al., 2018; Papadimitriou et al., 2018). In the north-eastern of Kos Island along western of Gökova Bay, Kos Island-Gökova Bay earthquake ocurred in 21st July 2017 with Mw = 6.6 (Tiryakioğlu et al., 2017). Additionally, on 30th October 2020, an earthquake occurred with a magnitude of 6.9 between Sığacık Bay and the Samos Island along the Samos Fault, which is an east-west striking and north dipping normal fault. 117 human beings were died, 17 buildings were collapsed and more than 5000 buildings were damaged with the effect of the earthquake in Bayraklı and Bornova districts of İzmir city
Abstract: In recent years, seismicity has increased considerably in the Aegean Sea region and there have been earthquakes in which people lost their lives. The major earthquakes, Kos Island-Gökova Bay (Mw = 6.6), Lesvos Island-Karaburun (İzmir) (Mw = 6.2) and Samos Island-Aegean Sea (Mw = 6.9) occurred in the Aegean Sea and affected Aegean region strongly. Within the scope of this study, the seismic b-value of these major earthquakes was calculated in order to perform earthquake statistical analysis. Seismic a and b-values within the first 24 h and 14 days after the mainshock determination of Kos Island-Gökova Bay, Lesvos Island-Karaburun (İzmir) and Samos Island-Aegean Sea earthquakes were evaluated for the first time in this study. The a and b-values were found as 4.134 and 0.5924 for the Samos Island-Aegean Sea earthquake, 4.2026 and 0.8102 for the Lesvos Island-Karaburun (İzmir) earthquake, 4.6624 and 0.8446 for the Kos Island-Gökova Bay earthquake aftershocks in 24 h. The a and b-values were calculated as 4.877 and 0.7432 for the Samos Island-Aegean Sea, 4.770 and 0.8714 for the Lesvos Island-Karaburun (İzmir) earthquake, 4.9586 and 0.8711 for the Kos Island-Gökova Bay earthquake and its aftershocks in 14 days. In addition, the gravity, Moho depth, effective elastic thickness, tensor analysis and b-values were compared together for investigating the crustal features of the regions in and around the epicentres. Furthermore, the connection between the Aegean Sea and Western Anatolia was interpreted by tensors analysis. Consequently, it is found that there is a crustal problem at the lower crust of Samos Island and its surroundings, also the lower crusts of the regions including Lesvos and Kos Islands are stronger than the regions including Samos Island.
Key words: Aegean Region, Lesvos, Samos, Kos, İzmir, earthquake, b-value, tensor analysis
Received: 13.07.2021 Accepted/Published Online: 26.10.2021 Final Version: 30.10.2021
Research Article
This work is licensed under a Creative Commons Attribution 4.0 International License.

ANKAYA PAMUKÇU et al. / Turkish J Earth Sci
834
(Figure 1) which are 70 km far away the epicentre (Sözbilir et al., 2020).
The Aegean region which is seismically active and tectonically complicated area is divided into parts with a shear zone called as Western Anatolia Transfer Zone (WATZ) by Gessner et al. (2013). Gessner et al. (2013) put forward that a shear zone forming with the effect of tectonic erosion in the Menderes Massif by the subduction zone and decomposition in the lithospheric mantle and
the lateral border between the Anatolide and Helenide orogenies is specified by WATZ. Dogru et al. (2017) created the tilt angle maps in the Aegean earthquake regime region and observed an important difference between 27° and 28° longitudes where WATZ was defined.
According to the GNSS and microgravity studies of Pamukçu et al. (2015) carried out in the region between the years 2009–2011 where was near to the epicentre of the 30th October 2020 Samos earthquake (Mw = 6.9), the
Figure 1. The simplified tectonic map of the Western Anatolia. Red stars represent theepicentres of Lesvos Island-Karaburun (İzmir) earthquake, Samos Island-Aegean Sea earthquake Kos Island-Gökova Bay earthquake form North to South. Dark black faults represent the Gediz and Büyük Menderes Detachment faults which locate near to Gediz and Büyük Menderes Grabens, respectively. GF; Gülbahçe Fault, OFZ; Orhanlı Fault Zone. (The figure was modified from Bozkurt (2001, 2007), Gessner et al. (2013), Çırmık et al. (2016), Çırmık and Pamukçu (2017)).

ANKAYA PAMUKÇU et al. / Turkish J Earth Sci
835
engrossing results were obtained in the stations located near to Sığacık Bay. In the station located on the NW side of Sığacık Bay (Figure 1), when its velocity is found as lower concerning respect to other stations, its gravity change is found as negative. Therefore, this case was associated with the result of subsurface density/mass loss, collapse, geothermal effects, and seismic gaps, etc., in the region. On the other hand, in the station located north side of Sığacık Bay when no gravity changes were seen, high vertical velocity was observed and this case was specified with the cavity inside of the structure.
In the study of Kahveci et al. (2019), the Aegean region was divided into seven microplates and three regions according to the GNSS velocities and topographic/bathymetric differences, respectively. The lowest amplitude gravity anomalies were obtained in the Western Anatolia graben system and its southern. Kahveci et al. (2019) were determined a transition zone, which was coherent with WATZ given by Gessner et al. (2013), between the longitudes 27° and 28° according to the GNSS velocities and major earthquake focal depth distributions. Besides, Kahveci et al. (2019) presented that the boundaries obtained from GNSS velocities, bathymetry/topography and gravity had high seismic activities and these boundaries are the borders of the microplates meanwhile.
In this study, the seismic hazard of 3 major earthquakes (Samos Island-Aegean Sea, Lesvos Island-Karaburun, Kos Island-Gökova Bay earthquakes) in the Aegean region was investigated by using the variations of a and b-values and the structural boundaries and parameters attained from gravity anomalies of the study region. Seismic a and b-values are often used as statistical approaches to describe earthquake activity in a region. In this study, depending on whether the seismic b-value is high or low, it is understood how much of the seismic events occur in the environment (Ozturk, 2012; Öztürk, 2015; Maden and Öztürk, 2015). Besides, these findings were interpreted with the previous studies realized in the Aegean Sea and Western Anatolia.
2. Applications2.1. Gravity data analysis The aim of tensor analysis applied to gravity data in a field is to make sense of the change of gravity. For this purpose, the spherical free air and Bouguer anomaly maps were created for the zones including the Lesvos, Samos and Kos earthquakes occurred by using the GOCE gravity field model (DIR Release 4) combined with EGM2008 and the present global topography/bathymetry model [Earth2014 (Rexer et al., 2016)] obtained in the study of Doğru et al. (2018) for the Aegean Sea and Western Anatolia. The free air gravity anomaly was obtained by extracting spherical free air gravity anomaly calculated from Earth2014 model
to the spherical free air gravity anomaly calculated from GOCE DIR R4 plus EGM2008 model. (Figure 2a). Besides, the spherical Bouguer gravity anomaly of the region was obtained (Figure 2b). Accordingly, the Moho depth and elastic thickness changes calculated in the study Doğru et al. (2018) for the Aegean Sea and western Anatolia region were mapped and detailed in this study for the Lesvos, Kos and Samos earthquake zones (Figures 3 and 4). The Parker-Oldenburg inversion method (Parker, 1972; Oldenburg, 1974) was performed to the filtered anomalies and the Moho depths are obtained by the Parker-Oldenburg inversion method using the Bouguer anomalies. The regional Bouguer gravity values in Figure 2c were obtained by applying the 20 km upward analytical extension to Figure 2b and the residual Bouguer gravity values in Figure 2d were obtained by applying the 5 km downward analytical extension to Figure 2b. Regional and residual Bouguer gravity anomalies were used to interpret both shallow and deep structures by many researchers (Ates and Kearey, 2000; Ates et al., 2005; Martín et al., 2011; Mohamed et al., 2013; Saleh, 2013).
In the flexural model, the response of the plate to the loading is described as effective elastic thickness (Watts, 2001). In the estimation studies of effective elastic thickness, the relationship between the topography and the gravity anomaly affected by underground loadings are used. The effective elastic thickness estimation studies were realized by several researchers (e.g., McKenzie and Bowin, 1976; Zuber et al., 1989; Hartley et al., 1996; Watts, 2001; Luis and Neves, 2006; Pamukçu and Yurdakul, 2008; Pamukcu and Akçığ, 2011; Oruç et al., 2019). In the study of Pamukçu and Yurdakul (2008) it was presented that the effective elastic thickness is approximately 6 km for Western Anatolia. Effective elastic thickness is based on the principle of balancing the crustal loads by the long-wavelength rigid region in the crust. As the last step of this application, the gravity tensors values were calculated by using tensor analysis of GOCE DIR R4 and EGM2008 data (Figure 5). The interpretations of gravity tensor maps were realized by using Figure 6. The gravity tensor values are calculated by using the equations of Bucha and Janák (2013);
𝑇𝑇!!(𝑟𝑟, 𝜑𝜑, 𝜆𝜆)
=𝐺𝐺𝐺𝐺𝑟𝑟" + ,
𝑅𝑅𝑟𝑟.
##!"#
#$#!$%
+ ∆𝐶𝐶#̅,&
#
&$'#
𝑄𝑄&(𝜆𝜆) 3𝑎𝑎#,&𝑃𝑃6#,|&|')(𝑠𝑠𝑠𝑠𝑠𝑠𝜑𝜑)
+ ;𝑏𝑏#,& − (𝑠𝑠 + 1)(𝑠𝑠 + 2)@𝑃𝑃6#,|&|(𝑠𝑠𝑠𝑠𝑠𝑠𝜑𝜑)+ 𝑐𝑐#,&𝑃𝑃6#,|&|*)(𝑠𝑠𝑠𝑠𝑠𝑠𝜑𝜑)B 𝑇𝑇!+(𝑟𝑟, 𝜑𝜑, 𝜆𝜆)
=𝐺𝐺𝐺𝐺𝑟𝑟" + ,
𝑅𝑅𝑟𝑟.
##!"#
#$,
+ ∆𝐶𝐶#̅,&
#
&$'#
𝑄𝑄'&(𝜆𝜆) 3𝑑𝑑#,&𝑃𝑃6#'-,|&|')(𝑠𝑠𝑠𝑠𝑠𝑠𝜑𝜑)
+ 𝑔𝑔#,&𝑃𝑃6#'-,|&|(𝑠𝑠𝑠𝑠𝑠𝑠𝜑𝜑)+ ℎ#,&𝑃𝑃6#'-,|&|*)(𝑠𝑠𝑠𝑠𝑠𝑠𝜑𝜑)B ,𝑚𝑚 ≠ 0 𝑇𝑇!.(𝑟𝑟, 𝜑𝜑, 𝜆𝜆)
=𝐺𝐺𝐺𝐺𝑟𝑟" + ,
𝑅𝑅𝑟𝑟.
##!"#
#$,
+ ∆𝐶𝐶#̅,&
#
&$'#
𝑄𝑄&(𝜆𝜆) 3𝛽𝛽#,&𝑃𝑃6#,|&|'-(𝑠𝑠𝑠𝑠𝑠𝑠𝜑𝜑)
+ 𝛾𝛾#,&𝑃𝑃6#,|&|*-(𝑠𝑠𝑠𝑠𝑠𝑠𝜑𝜑)B 𝑇𝑇++(𝑟𝑟, 𝜑𝜑, 𝜆𝜆)
= −𝐺𝐺𝐺𝐺𝑟𝑟" + ,
𝑅𝑅𝑟𝑟.
##!"#
#$#!$%
+ ∆𝐶𝐶#̅,&
#
&$'#
𝑄𝑄&(𝜆𝜆) 3𝑎𝑎#,&𝑃𝑃6#,|&|')(𝑠𝑠𝑠𝑠𝑠𝑠𝜑𝜑)
+ 𝑏𝑏#,&𝑃𝑃6#,|&|(𝑠𝑠𝑠𝑠𝑠𝑠𝜑𝜑) + 𝑐𝑐#,&𝑃𝑃6#,|&|*)(𝑠𝑠𝑠𝑠𝑠𝑠𝜑𝜑)B 𝑇𝑇+.(𝑟𝑟, 𝜑𝜑, 𝜆𝜆)
=𝐺𝐺𝐺𝐺𝑟𝑟" + ,
𝑅𝑅𝑟𝑟.
##!"#
#$,
+ ∆𝐶𝐶#̅,&
#
&$'#
𝑄𝑄'&(𝜆𝜆) 3𝜇𝜇#,&𝑃𝑃6#'-,|&|'-(𝑠𝑠𝑠𝑠𝑠𝑠𝜑𝜑)
+ 𝜗𝜗#,&𝑃𝑃6#'-,|&|*-(𝑠𝑠𝑠𝑠𝑠𝑠𝜑𝜑)B ,𝑚𝑚 ≠ 0 𝑇𝑇..(𝑟𝑟, 𝜑𝜑, 𝜆𝜆)
=𝐺𝐺𝐺𝐺𝑟𝑟" + ,
𝑅𝑅𝑟𝑟.
##!"#
#$#!$%
(𝑠𝑠 + 1)(𝑠𝑠
+ 2) + ∆�̅�𝐶#,&
#
&$'#
𝑄𝑄&(𝜆𝜆)𝑃𝑃6#,|&|(𝑠𝑠𝑠𝑠𝑠𝑠𝜑𝜑)
𝑇𝑇(𝑟𝑟, 𝜑𝜑, 𝜆𝜆) = N𝑇𝑇!! 𝑇𝑇!+ 𝑇𝑇!.𝑇𝑇+! 𝑇𝑇++ 𝑇𝑇+.𝑇𝑇.! 𝑇𝑇.+ 𝑇𝑇..
O.
𝐿𝐿𝐿𝐿𝑔𝑔𝐿𝐿(𝐺𝐺) = −𝑏𝑏𝐺𝐺 + 𝑎𝑎 𝑏𝑏 = 𝐿𝐿𝐿𝐿𝑔𝑔-,𝑒𝑒 (𝐺𝐺 −𝐺𝐺&/#)⁄ .
(1)
𝑇𝑇!!(𝑟𝑟, 𝜑𝜑, 𝜆𝜆)
=𝐺𝐺𝐺𝐺𝑟𝑟" + ,
𝑅𝑅𝑟𝑟.
##!"#
#$#!$%
+ ∆𝐶𝐶#̅,&
#
&$'#
𝑄𝑄&(𝜆𝜆) 3𝑎𝑎#,&𝑃𝑃6#,|&|')(𝑠𝑠𝑠𝑠𝑠𝑠𝜑𝜑)
+ ;𝑏𝑏#,& − (𝑠𝑠 + 1)(𝑠𝑠 + 2)@𝑃𝑃6#,|&|(𝑠𝑠𝑠𝑠𝑠𝑠𝜑𝜑)+ 𝑐𝑐#,&𝑃𝑃6#,|&|*)(𝑠𝑠𝑠𝑠𝑠𝑠𝜑𝜑)B 𝑇𝑇!+(𝑟𝑟, 𝜑𝜑, 𝜆𝜆)
=𝐺𝐺𝐺𝐺𝑟𝑟" + ,
𝑅𝑅𝑟𝑟.
##!"#
#$,
+ ∆𝐶𝐶#̅,&
#
&$'#
𝑄𝑄'&(𝜆𝜆) 3𝑑𝑑#,&𝑃𝑃6#'-,|&|')(𝑠𝑠𝑠𝑠𝑠𝑠𝜑𝜑)
+ 𝑔𝑔#,&𝑃𝑃6#'-,|&|(𝑠𝑠𝑠𝑠𝑠𝑠𝜑𝜑)+ ℎ#,&𝑃𝑃6#'-,|&|*)(𝑠𝑠𝑠𝑠𝑠𝑠𝜑𝜑)B ,𝑚𝑚 ≠ 0 𝑇𝑇!.(𝑟𝑟, 𝜑𝜑, 𝜆𝜆)
=𝐺𝐺𝐺𝐺𝑟𝑟" + ,
𝑅𝑅𝑟𝑟.
##!"#
#$,
+ ∆𝐶𝐶#̅,&
#
&$'#
𝑄𝑄&(𝜆𝜆) 3𝛽𝛽#,&𝑃𝑃6#,|&|'-(𝑠𝑠𝑠𝑠𝑠𝑠𝜑𝜑)
+ 𝛾𝛾#,&𝑃𝑃6#,|&|*-(𝑠𝑠𝑠𝑠𝑠𝑠𝜑𝜑)B 𝑇𝑇++(𝑟𝑟, 𝜑𝜑, 𝜆𝜆)
= −𝐺𝐺𝐺𝐺𝑟𝑟" + ,
𝑅𝑅𝑟𝑟.
##!"#
#$#!$%
+ ∆𝐶𝐶#̅,&
#
&$'#
𝑄𝑄&(𝜆𝜆) 3𝑎𝑎#,&𝑃𝑃6#,|&|')(𝑠𝑠𝑠𝑠𝑠𝑠𝜑𝜑)
+ 𝑏𝑏#,&𝑃𝑃6#,|&|(𝑠𝑠𝑠𝑠𝑠𝑠𝜑𝜑) + 𝑐𝑐#,&𝑃𝑃6#,|&|*)(𝑠𝑠𝑠𝑠𝑠𝑠𝜑𝜑)B 𝑇𝑇+.(𝑟𝑟, 𝜑𝜑, 𝜆𝜆)
=𝐺𝐺𝐺𝐺𝑟𝑟" + ,
𝑅𝑅𝑟𝑟.
##!"#
#$,
+ ∆𝐶𝐶#̅,&
#
&$'#
𝑄𝑄'&(𝜆𝜆) 3𝜇𝜇#,&𝑃𝑃6#'-,|&|'-(𝑠𝑠𝑠𝑠𝑠𝑠𝜑𝜑)
+ 𝜗𝜗#,&𝑃𝑃6#'-,|&|*-(𝑠𝑠𝑠𝑠𝑠𝑠𝜑𝜑)B ,𝑚𝑚 ≠ 0 𝑇𝑇..(𝑟𝑟, 𝜑𝜑, 𝜆𝜆)
=𝐺𝐺𝐺𝐺𝑟𝑟" + ,
𝑅𝑅𝑟𝑟.
##!"#
#$#!$%
(𝑠𝑠 + 1)(𝑠𝑠
+ 2) + ∆�̅�𝐶#,&
#
&$'#
𝑄𝑄&(𝜆𝜆)𝑃𝑃6#,|&|(𝑠𝑠𝑠𝑠𝑠𝑠𝜑𝜑)
𝑇𝑇(𝑟𝑟, 𝜑𝜑, 𝜆𝜆) = N𝑇𝑇!! 𝑇𝑇!+ 𝑇𝑇!.𝑇𝑇+! 𝑇𝑇++ 𝑇𝑇+.𝑇𝑇.! 𝑇𝑇.+ 𝑇𝑇..
O.
𝐿𝐿𝐿𝐿𝑔𝑔𝐿𝐿(𝐺𝐺) = −𝑏𝑏𝐺𝐺 + 𝑎𝑎 𝑏𝑏 = 𝐿𝐿𝐿𝐿𝑔𝑔-,𝑒𝑒 (𝐺𝐺 −𝐺𝐺&/#)⁄ .
(2)

ANKAYA PAMUKÇU et al. / Turkish J Earth Sci
836
(a) (b)
(c) (d)
Figure 2. a) Spherical free air gravity anomaly. b) the spherical Bouguer gravity anomaly of the region. c) the regional Bouguer gravity anomaly (20 km upward). d) the residual Bouguer gravity anomaly of the region (5 km downward).
ANKAYA PAMUKÇU et al. / Turkish J Earth Sci
837
𝑇𝑇!!(𝑟𝑟, 𝜑𝜑, 𝜆𝜆)
=𝐺𝐺𝐺𝐺𝑟𝑟" + ,
𝑅𝑅𝑟𝑟.
##!"#
#$#!$%
+ ∆𝐶𝐶#̅,&
#
&$'#
𝑄𝑄&(𝜆𝜆) 3𝑎𝑎#,&𝑃𝑃6#,|&|')(𝑠𝑠𝑠𝑠𝑠𝑠𝜑𝜑)
+ ;𝑏𝑏#,& − (𝑠𝑠 + 1)(𝑠𝑠 + 2)@𝑃𝑃6#,|&|(𝑠𝑠𝑠𝑠𝑠𝑠𝜑𝜑)+ 𝑐𝑐#,&𝑃𝑃6#,|&|*)(𝑠𝑠𝑠𝑠𝑠𝑠𝜑𝜑)B 𝑇𝑇!+(𝑟𝑟, 𝜑𝜑, 𝜆𝜆)
=𝐺𝐺𝐺𝐺𝑟𝑟" + ,
𝑅𝑅𝑟𝑟.
##!"#
#$,
+ ∆𝐶𝐶#̅,&
#
&$'#
𝑄𝑄'&(𝜆𝜆) 3𝑑𝑑#,&𝑃𝑃6#'-,|&|')(𝑠𝑠𝑠𝑠𝑠𝑠𝜑𝜑)
+ 𝑔𝑔#,&𝑃𝑃6#'-,|&|(𝑠𝑠𝑠𝑠𝑠𝑠𝜑𝜑)+ ℎ#,&𝑃𝑃6#'-,|&|*)(𝑠𝑠𝑠𝑠𝑠𝑠𝜑𝜑)B ,𝑚𝑚 ≠ 0 𝑇𝑇!.(𝑟𝑟, 𝜑𝜑, 𝜆𝜆)
=𝐺𝐺𝐺𝐺𝑟𝑟" + ,
𝑅𝑅𝑟𝑟.
##!"#
#$,
+ ∆𝐶𝐶#̅,&
#
&$'#
𝑄𝑄&(𝜆𝜆) 3𝛽𝛽#,&𝑃𝑃6#,|&|'-(𝑠𝑠𝑠𝑠𝑠𝑠𝜑𝜑)
+ 𝛾𝛾#,&𝑃𝑃6#,|&|*-(𝑠𝑠𝑠𝑠𝑠𝑠𝜑𝜑)B 𝑇𝑇++(𝑟𝑟, 𝜑𝜑, 𝜆𝜆)
= −𝐺𝐺𝐺𝐺𝑟𝑟" + ,
𝑅𝑅𝑟𝑟.
##!"#
#$#!$%
+ ∆𝐶𝐶#̅,&
#
&$'#
𝑄𝑄&(𝜆𝜆) 3𝑎𝑎#,&𝑃𝑃6#,|&|')(𝑠𝑠𝑠𝑠𝑠𝑠𝜑𝜑)
+ 𝑏𝑏#,&𝑃𝑃6#,|&|(𝑠𝑠𝑠𝑠𝑠𝑠𝜑𝜑) + 𝑐𝑐#,&𝑃𝑃6#,|&|*)(𝑠𝑠𝑠𝑠𝑠𝑠𝜑𝜑)B 𝑇𝑇+.(𝑟𝑟, 𝜑𝜑, 𝜆𝜆)
=𝐺𝐺𝐺𝐺𝑟𝑟" + ,
𝑅𝑅𝑟𝑟.
##!"#
#$,
+ ∆𝐶𝐶#̅,&
#
&$'#
𝑄𝑄'&(𝜆𝜆) 3𝜇𝜇#,&𝑃𝑃6#'-,|&|'-(𝑠𝑠𝑠𝑠𝑠𝑠𝜑𝜑)
+ 𝜗𝜗#,&𝑃𝑃6#'-,|&|*-(𝑠𝑠𝑠𝑠𝑠𝑠𝜑𝜑)B ,𝑚𝑚 ≠ 0 𝑇𝑇..(𝑟𝑟, 𝜑𝜑, 𝜆𝜆)
=𝐺𝐺𝐺𝐺𝑟𝑟" + ,
𝑅𝑅𝑟𝑟.
##!"#
#$#!$%
(𝑠𝑠 + 1)(𝑠𝑠
+ 2) + ∆�̅�𝐶#,&
#
&$'#
𝑄𝑄&(𝜆𝜆)𝑃𝑃6#,|&|(𝑠𝑠𝑠𝑠𝑠𝑠𝜑𝜑)
𝑇𝑇(𝑟𝑟, 𝜑𝜑, 𝜆𝜆) = N𝑇𝑇!! 𝑇𝑇!+ 𝑇𝑇!.𝑇𝑇+! 𝑇𝑇++ 𝑇𝑇+.𝑇𝑇.! 𝑇𝑇.+ 𝑇𝑇..
O.
𝐿𝐿𝐿𝐿𝑔𝑔𝐿𝐿(𝐺𝐺) = −𝑏𝑏𝐺𝐺 + 𝑎𝑎 𝑏𝑏 = 𝐿𝐿𝐿𝐿𝑔𝑔-,𝑒𝑒 (𝐺𝐺 −𝐺𝐺&/#)⁄ .
(3)
𝑇𝑇!!(𝑟𝑟, 𝜑𝜑, 𝜆𝜆)
=𝐺𝐺𝐺𝐺𝑟𝑟" + ,
𝑅𝑅𝑟𝑟.
##!"#
#$#!$%
+ ∆𝐶𝐶#̅,&
#
&$'#
𝑄𝑄&(𝜆𝜆) 3𝑎𝑎#,&𝑃𝑃6#,|&|')(𝑠𝑠𝑠𝑠𝑠𝑠𝜑𝜑)
+ ;𝑏𝑏#,& − (𝑠𝑠 + 1)(𝑠𝑠 + 2)@𝑃𝑃6#,|&|(𝑠𝑠𝑠𝑠𝑠𝑠𝜑𝜑)+ 𝑐𝑐#,&𝑃𝑃6#,|&|*)(𝑠𝑠𝑠𝑠𝑠𝑠𝜑𝜑)B 𝑇𝑇!+(𝑟𝑟, 𝜑𝜑, 𝜆𝜆)
=𝐺𝐺𝐺𝐺𝑟𝑟" + ,
𝑅𝑅𝑟𝑟.
##!"#
#$,
+ ∆𝐶𝐶#̅,&
#
&$'#
𝑄𝑄'&(𝜆𝜆) 3𝑑𝑑#,&𝑃𝑃6#'-,|&|')(𝑠𝑠𝑠𝑠𝑠𝑠𝜑𝜑)
+ 𝑔𝑔#,&𝑃𝑃6#'-,|&|(𝑠𝑠𝑠𝑠𝑠𝑠𝜑𝜑)+ ℎ#,&𝑃𝑃6#'-,|&|*)(𝑠𝑠𝑠𝑠𝑠𝑠𝜑𝜑)B ,𝑚𝑚 ≠ 0 𝑇𝑇!.(𝑟𝑟, 𝜑𝜑, 𝜆𝜆)
=𝐺𝐺𝐺𝐺𝑟𝑟" + ,
𝑅𝑅𝑟𝑟.
##!"#
#$,
+ ∆𝐶𝐶#̅,&
#
&$'#
𝑄𝑄&(𝜆𝜆) 3𝛽𝛽#,&𝑃𝑃6#,|&|'-(𝑠𝑠𝑠𝑠𝑠𝑠𝜑𝜑)
+ 𝛾𝛾#,&𝑃𝑃6#,|&|*-(𝑠𝑠𝑠𝑠𝑠𝑠𝜑𝜑)B 𝑇𝑇++(𝑟𝑟, 𝜑𝜑, 𝜆𝜆)
= −𝐺𝐺𝐺𝐺𝑟𝑟" + ,
𝑅𝑅𝑟𝑟.
##!"#
#$#!$%
+ ∆𝐶𝐶#̅,&
#
&$'#
𝑄𝑄&(𝜆𝜆) 3𝑎𝑎#,&𝑃𝑃6#,|&|')(𝑠𝑠𝑠𝑠𝑠𝑠𝜑𝜑)
+ 𝑏𝑏#,&𝑃𝑃6#,|&|(𝑠𝑠𝑠𝑠𝑠𝑠𝜑𝜑) + 𝑐𝑐#,&𝑃𝑃6#,|&|*)(𝑠𝑠𝑠𝑠𝑠𝑠𝜑𝜑)B 𝑇𝑇+.(𝑟𝑟, 𝜑𝜑, 𝜆𝜆)
=𝐺𝐺𝐺𝐺𝑟𝑟" + ,
𝑅𝑅𝑟𝑟.
##!"#
#$,
+ ∆𝐶𝐶#̅,&
#
&$'#
𝑄𝑄'&(𝜆𝜆) 3𝜇𝜇#,&𝑃𝑃6#'-,|&|'-(𝑠𝑠𝑠𝑠𝑠𝑠𝜑𝜑)
+ 𝜗𝜗#,&𝑃𝑃6#'-,|&|*-(𝑠𝑠𝑠𝑠𝑠𝑠𝜑𝜑)B ,𝑚𝑚 ≠ 0 𝑇𝑇..(𝑟𝑟, 𝜑𝜑, 𝜆𝜆)
=𝐺𝐺𝐺𝐺𝑟𝑟" + ,
𝑅𝑅𝑟𝑟.
##!"#
#$#!$%
(𝑠𝑠 + 1)(𝑠𝑠
+ 2) + ∆�̅�𝐶#,&
#
&$'#
𝑄𝑄&(𝜆𝜆)𝑃𝑃6#,|&|(𝑠𝑠𝑠𝑠𝑠𝑠𝜑𝜑)
𝑇𝑇(𝑟𝑟, 𝜑𝜑, 𝜆𝜆) = N𝑇𝑇!! 𝑇𝑇!+ 𝑇𝑇!.𝑇𝑇+! 𝑇𝑇++ 𝑇𝑇+.𝑇𝑇.! 𝑇𝑇.+ 𝑇𝑇..
O.
𝐿𝐿𝐿𝐿𝑔𝑔𝐿𝐿(𝐺𝐺) = −𝑏𝑏𝐺𝐺 + 𝑎𝑎 𝑏𝑏 = 𝐿𝐿𝐿𝐿𝑔𝑔-,𝑒𝑒 (𝐺𝐺 −𝐺𝐺&/#)⁄ .
(4)
𝑇𝑇!!(𝑟𝑟, 𝜑𝜑, 𝜆𝜆)
=𝐺𝐺𝐺𝐺𝑟𝑟" + ,
𝑅𝑅𝑟𝑟.
##!"#
#$#!$%
+ ∆𝐶𝐶#̅,&
#
&$'#
𝑄𝑄&(𝜆𝜆) 3𝑎𝑎#,&𝑃𝑃6#,|&|')(𝑠𝑠𝑠𝑠𝑠𝑠𝜑𝜑)
+ ;𝑏𝑏#,& − (𝑠𝑠 + 1)(𝑠𝑠 + 2)@𝑃𝑃6#,|&|(𝑠𝑠𝑠𝑠𝑠𝑠𝜑𝜑)+ 𝑐𝑐#,&𝑃𝑃6#,|&|*)(𝑠𝑠𝑠𝑠𝑠𝑠𝜑𝜑)B 𝑇𝑇!+(𝑟𝑟, 𝜑𝜑, 𝜆𝜆)
=𝐺𝐺𝐺𝐺𝑟𝑟" + ,
𝑅𝑅𝑟𝑟.
##!"#
#$,
+ ∆𝐶𝐶#̅,&
#
&$'#
𝑄𝑄'&(𝜆𝜆) 3𝑑𝑑#,&𝑃𝑃6#'-,|&|')(𝑠𝑠𝑠𝑠𝑠𝑠𝜑𝜑)
+ 𝑔𝑔#,&𝑃𝑃6#'-,|&|(𝑠𝑠𝑠𝑠𝑠𝑠𝜑𝜑)+ ℎ#,&𝑃𝑃6#'-,|&|*)(𝑠𝑠𝑠𝑠𝑠𝑠𝜑𝜑)B ,𝑚𝑚 ≠ 0 𝑇𝑇!.(𝑟𝑟, 𝜑𝜑, 𝜆𝜆)
=𝐺𝐺𝐺𝐺𝑟𝑟" + ,
𝑅𝑅𝑟𝑟.
##!"#
#$,
+ ∆𝐶𝐶#̅,&
#
&$'#
𝑄𝑄&(𝜆𝜆) 3𝛽𝛽#,&𝑃𝑃6#,|&|'-(𝑠𝑠𝑠𝑠𝑠𝑠𝜑𝜑)
+ 𝛾𝛾#,&𝑃𝑃6#,|&|*-(𝑠𝑠𝑠𝑠𝑠𝑠𝜑𝜑)B 𝑇𝑇++(𝑟𝑟, 𝜑𝜑, 𝜆𝜆)
= −𝐺𝐺𝐺𝐺𝑟𝑟" + ,
𝑅𝑅𝑟𝑟.
##!"#
#$#!$%
+ ∆𝐶𝐶#̅,&
#
&$'#
𝑄𝑄&(𝜆𝜆) 3𝑎𝑎#,&𝑃𝑃6#,|&|')(𝑠𝑠𝑠𝑠𝑠𝑠𝜑𝜑)
+ 𝑏𝑏#,&𝑃𝑃6#,|&|(𝑠𝑠𝑠𝑠𝑠𝑠𝜑𝜑) + 𝑐𝑐#,&𝑃𝑃6#,|&|*)(𝑠𝑠𝑠𝑠𝑠𝑠𝜑𝜑)B 𝑇𝑇+.(𝑟𝑟, 𝜑𝜑, 𝜆𝜆)
=𝐺𝐺𝐺𝐺𝑟𝑟" + ,
𝑅𝑅𝑟𝑟.
##!"#
#$,
+ ∆𝐶𝐶#̅,&
#
&$'#
𝑄𝑄'&(𝜆𝜆) 3𝜇𝜇#,&𝑃𝑃6#'-,|&|'-(𝑠𝑠𝑠𝑠𝑠𝑠𝜑𝜑)
+ 𝜗𝜗#,&𝑃𝑃6#'-,|&|*-(𝑠𝑠𝑠𝑠𝑠𝑠𝜑𝜑)B ,𝑚𝑚 ≠ 0 𝑇𝑇..(𝑟𝑟, 𝜑𝜑, 𝜆𝜆)
=𝐺𝐺𝐺𝐺𝑟𝑟" + ,
𝑅𝑅𝑟𝑟.
##!"#
#$#!$%
(𝑠𝑠 + 1)(𝑠𝑠
+ 2) + ∆�̅�𝐶#,&
#
&$'#
𝑄𝑄&(𝜆𝜆)𝑃𝑃6#,|&|(𝑠𝑠𝑠𝑠𝑠𝑠𝜑𝜑)
𝑇𝑇(𝑟𝑟, 𝜑𝜑, 𝜆𝜆) = N𝑇𝑇!! 𝑇𝑇!+ 𝑇𝑇!.𝑇𝑇+! 𝑇𝑇++ 𝑇𝑇+.𝑇𝑇.! 𝑇𝑇.+ 𝑇𝑇..
O.
𝐿𝐿𝐿𝐿𝑔𝑔𝐿𝐿(𝐺𝐺) = −𝑏𝑏𝐺𝐺 + 𝑎𝑎 𝑏𝑏 = 𝐿𝐿𝐿𝐿𝑔𝑔-,𝑒𝑒 (𝐺𝐺 −𝐺𝐺&/#)⁄ .
(5)
𝑇𝑇!!(𝑟𝑟, 𝜑𝜑, 𝜆𝜆)
=𝐺𝐺𝐺𝐺𝑟𝑟" + ,
𝑅𝑅𝑟𝑟.
##!"#
#$#!$%
+ ∆𝐶𝐶#̅,&
#
&$'#
𝑄𝑄&(𝜆𝜆) 3𝑎𝑎#,&𝑃𝑃6#,|&|')(𝑠𝑠𝑠𝑠𝑠𝑠𝜑𝜑)
+ ;𝑏𝑏#,& − (𝑠𝑠 + 1)(𝑠𝑠 + 2)@𝑃𝑃6#,|&|(𝑠𝑠𝑠𝑠𝑠𝑠𝜑𝜑)+ 𝑐𝑐#,&𝑃𝑃6#,|&|*)(𝑠𝑠𝑠𝑠𝑠𝑠𝜑𝜑)B 𝑇𝑇!+(𝑟𝑟, 𝜑𝜑, 𝜆𝜆)
=𝐺𝐺𝐺𝐺𝑟𝑟" + ,
𝑅𝑅𝑟𝑟.
##!"#
#$,
+ ∆𝐶𝐶#̅,&
#
&$'#
𝑄𝑄'&(𝜆𝜆) 3𝑑𝑑#,&𝑃𝑃6#'-,|&|')(𝑠𝑠𝑠𝑠𝑠𝑠𝜑𝜑)
+ 𝑔𝑔#,&𝑃𝑃6#'-,|&|(𝑠𝑠𝑠𝑠𝑠𝑠𝜑𝜑)+ ℎ#,&𝑃𝑃6#'-,|&|*)(𝑠𝑠𝑠𝑠𝑠𝑠𝜑𝜑)B ,𝑚𝑚 ≠ 0 𝑇𝑇!.(𝑟𝑟, 𝜑𝜑, 𝜆𝜆)
=𝐺𝐺𝐺𝐺𝑟𝑟" + ,
𝑅𝑅𝑟𝑟.
##!"#
#$,
+ ∆𝐶𝐶#̅,&
#
&$'#
𝑄𝑄&(𝜆𝜆) 3𝛽𝛽#,&𝑃𝑃6#,|&|'-(𝑠𝑠𝑠𝑠𝑠𝑠𝜑𝜑)
+ 𝛾𝛾#,&𝑃𝑃6#,|&|*-(𝑠𝑠𝑠𝑠𝑠𝑠𝜑𝜑)B 𝑇𝑇++(𝑟𝑟, 𝜑𝜑, 𝜆𝜆)
= −𝐺𝐺𝐺𝐺𝑟𝑟" + ,
𝑅𝑅𝑟𝑟.
##!"#
#$#!$%
+ ∆𝐶𝐶#̅,&
#
&$'#
𝑄𝑄&(𝜆𝜆) 3𝑎𝑎#,&𝑃𝑃6#,|&|')(𝑠𝑠𝑠𝑠𝑠𝑠𝜑𝜑)
+ 𝑏𝑏#,&𝑃𝑃6#,|&|(𝑠𝑠𝑠𝑠𝑠𝑠𝜑𝜑) + 𝑐𝑐#,&𝑃𝑃6#,|&|*)(𝑠𝑠𝑠𝑠𝑠𝑠𝜑𝜑)B 𝑇𝑇+.(𝑟𝑟, 𝜑𝜑, 𝜆𝜆)
=𝐺𝐺𝐺𝐺𝑟𝑟" + ,
𝑅𝑅𝑟𝑟.
##!"#
#$,
+ ∆𝐶𝐶#̅,&
#
&$'#
𝑄𝑄'&(𝜆𝜆) 3𝜇𝜇#,&𝑃𝑃6#'-,|&|'-(𝑠𝑠𝑠𝑠𝑠𝑠𝜑𝜑)
+ 𝜗𝜗#,&𝑃𝑃6#'-,|&|*-(𝑠𝑠𝑠𝑠𝑠𝑠𝜑𝜑)B ,𝑚𝑚 ≠ 0 𝑇𝑇..(𝑟𝑟, 𝜑𝜑, 𝜆𝜆)
=𝐺𝐺𝐺𝐺𝑟𝑟" + ,
𝑅𝑅𝑟𝑟.
##!"#
#$#!$%
(𝑠𝑠 + 1)(𝑠𝑠
+ 2) + ∆�̅�𝐶#,&
#
&$'#
𝑄𝑄&(𝜆𝜆)𝑃𝑃6#,|&|(𝑠𝑠𝑠𝑠𝑠𝑠𝜑𝜑)
𝑇𝑇(𝑟𝑟, 𝜑𝜑, 𝜆𝜆) = N𝑇𝑇!! 𝑇𝑇!+ 𝑇𝑇!.𝑇𝑇+! 𝑇𝑇++ 𝑇𝑇+.𝑇𝑇.! 𝑇𝑇.+ 𝑇𝑇..
O.
𝐿𝐿𝐿𝐿𝑔𝑔𝐿𝐿(𝐺𝐺) = −𝑏𝑏𝐺𝐺 + 𝑎𝑎 𝑏𝑏 = 𝐿𝐿𝐿𝐿𝑔𝑔-,𝑒𝑒 (𝐺𝐺 −𝐺𝐺&/#)⁄ .
(6)
𝑇𝑇!!(𝑟𝑟, 𝜑𝜑, 𝜆𝜆)
=𝐺𝐺𝐺𝐺𝑟𝑟" + ,
𝑅𝑅𝑟𝑟.
##!"#
#$#!$%
+ ∆𝐶𝐶#̅,&
#
&$'#
𝑄𝑄&(𝜆𝜆) 3𝑎𝑎#,&𝑃𝑃6#,|&|')(𝑠𝑠𝑠𝑠𝑠𝑠𝜑𝜑)
+ ;𝑏𝑏#,& − (𝑠𝑠 + 1)(𝑠𝑠 + 2)@𝑃𝑃6#,|&|(𝑠𝑠𝑠𝑠𝑠𝑠𝜑𝜑)+ 𝑐𝑐#,&𝑃𝑃6#,|&|*)(𝑠𝑠𝑠𝑠𝑠𝑠𝜑𝜑)B 𝑇𝑇!+(𝑟𝑟, 𝜑𝜑, 𝜆𝜆)
=𝐺𝐺𝐺𝐺𝑟𝑟" + ,
𝑅𝑅𝑟𝑟.
##!"#
#$,
+ ∆𝐶𝐶#̅,&
#
&$'#
𝑄𝑄'&(𝜆𝜆) 3𝑑𝑑#,&𝑃𝑃6#'-,|&|')(𝑠𝑠𝑠𝑠𝑠𝑠𝜑𝜑)
+ 𝑔𝑔#,&𝑃𝑃6#'-,|&|(𝑠𝑠𝑠𝑠𝑠𝑠𝜑𝜑)+ ℎ#,&𝑃𝑃6#'-,|&|*)(𝑠𝑠𝑠𝑠𝑠𝑠𝜑𝜑)B ,𝑚𝑚 ≠ 0 𝑇𝑇!.(𝑟𝑟, 𝜑𝜑, 𝜆𝜆)
=𝐺𝐺𝐺𝐺𝑟𝑟" + ,
𝑅𝑅𝑟𝑟.
##!"#
#$,
+ ∆𝐶𝐶#̅,&
#
&$'#
𝑄𝑄&(𝜆𝜆) 3𝛽𝛽#,&𝑃𝑃6#,|&|'-(𝑠𝑠𝑠𝑠𝑠𝑠𝜑𝜑)
+ 𝛾𝛾#,&𝑃𝑃6#,|&|*-(𝑠𝑠𝑠𝑠𝑠𝑠𝜑𝜑)B 𝑇𝑇++(𝑟𝑟, 𝜑𝜑, 𝜆𝜆)
= −𝐺𝐺𝐺𝐺𝑟𝑟" + ,
𝑅𝑅𝑟𝑟.
##!"#
#$#!$%
+ ∆𝐶𝐶#̅,&
#
&$'#
𝑄𝑄&(𝜆𝜆) 3𝑎𝑎#,&𝑃𝑃6#,|&|')(𝑠𝑠𝑠𝑠𝑠𝑠𝜑𝜑)
+ 𝑏𝑏#,&𝑃𝑃6#,|&|(𝑠𝑠𝑠𝑠𝑠𝑠𝜑𝜑) + 𝑐𝑐#,&𝑃𝑃6#,|&|*)(𝑠𝑠𝑠𝑠𝑠𝑠𝜑𝜑)B 𝑇𝑇+.(𝑟𝑟, 𝜑𝜑, 𝜆𝜆)
=𝐺𝐺𝐺𝐺𝑟𝑟" + ,
𝑅𝑅𝑟𝑟.
##!"#
#$,
+ ∆𝐶𝐶#̅,&
#
&$'#
𝑄𝑄'&(𝜆𝜆) 3𝜇𝜇#,&𝑃𝑃6#'-,|&|'-(𝑠𝑠𝑠𝑠𝑠𝑠𝜑𝜑)
+ 𝜗𝜗#,&𝑃𝑃6#'-,|&|*-(𝑠𝑠𝑠𝑠𝑠𝑠𝜑𝜑)B ,𝑚𝑚 ≠ 0 𝑇𝑇..(𝑟𝑟, 𝜑𝜑, 𝜆𝜆)
=𝐺𝐺𝐺𝐺𝑟𝑟" + ,
𝑅𝑅𝑟𝑟.
##!"#
#$#!$%
(𝑠𝑠 + 1)(𝑠𝑠
+ 2) + ∆�̅�𝐶#,&
#
&$'#
𝑄𝑄&(𝜆𝜆)𝑃𝑃6#,|&|(𝑠𝑠𝑠𝑠𝑠𝑠𝜑𝜑)
𝑇𝑇(𝑟𝑟, 𝜑𝜑, 𝜆𝜆) = N𝑇𝑇!! 𝑇𝑇!+ 𝑇𝑇!.𝑇𝑇+! 𝑇𝑇++ 𝑇𝑇+.𝑇𝑇.! 𝑇𝑇.+ 𝑇𝑇..
O.
𝐿𝐿𝐿𝐿𝑔𝑔𝐿𝐿(𝐺𝐺) = −𝑏𝑏𝐺𝐺 + 𝑎𝑎 𝑏𝑏 = 𝐿𝐿𝐿𝐿𝑔𝑔-,𝑒𝑒 (𝐺𝐺 −𝐺𝐺&/#)⁄ .
(7)
2.2. Seismic b-value analysisIn the second application of the study, the seismic a and b-values were obtained by using Gutenberg-Richter law for 30th October 2020 (Mw = 6.9) Samos Island-Aegean Sea earthquake (KOERI, 2020), 12th June 2017 (Mw = 6.2) Lesvos Island-Karaburun earthquake (KOERI, 2017a), 21st July 2017 (Mw = 6.6) Kos Island-Gökova Bay (KOERI, 2017b) earthquake. The data within the scope of the study were taken from the catalogue of Boğaziçi University Kandilli Observatory and Earthquake Research Institute. The a and b-values were calculated for the earthquakes that occurred for the first 24 h and for 14 days after the main shock and then, the changes of the values and the seismicity were evaluated for each earthquake.
Earthquake statistical analysis is an important subject for researchers for a long time (Utku, 2011). In the mid-1950s, Gutenberg and Richter (1954) realized that the dimensional distribution of regional earthquakes could
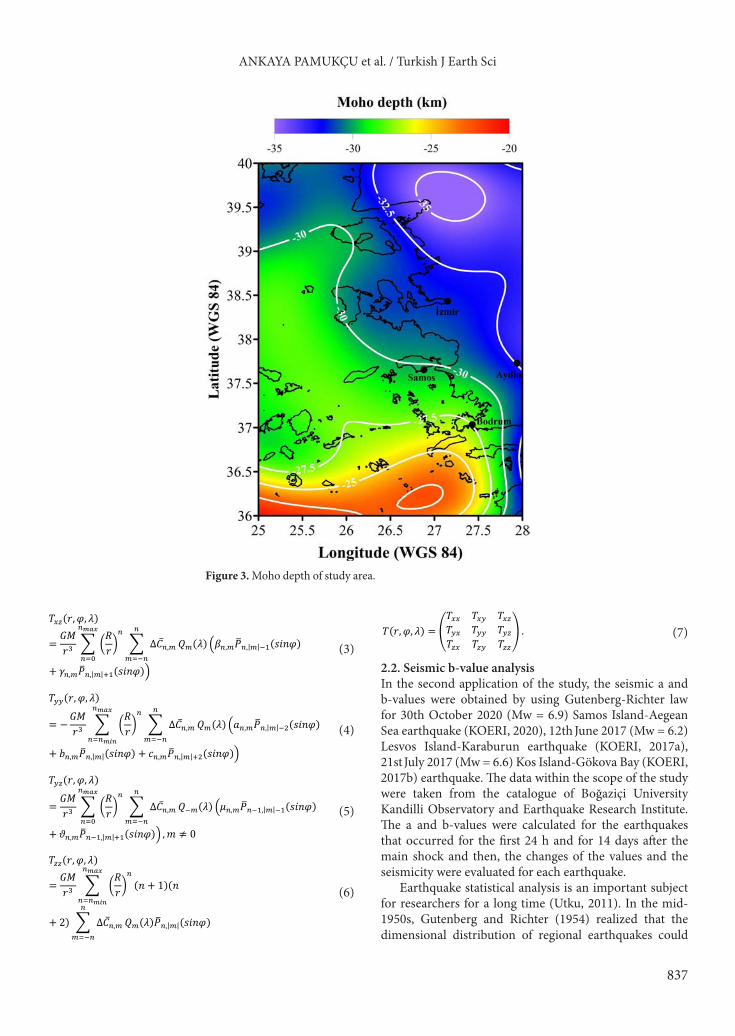
Figure 3. Moho depth of study area.

ANKAYA PAMUKÇU et al. / Turkish J Earth Sci
838
be observed around a power law over the entire observed sequence of events. This type of power law was called as “the Gutenberg-Richter frequency-magnitude distribution” and was developed a widely accepted empirical formula that decodes a relationship between the probability of an earthquake occurring and the two important a and b-values, as well as magnitudes (Gutenberg and Richter, 1954). In the equation given below; M is the magnitude, N is the number of events (earthquakes) occurred in the region with magnitude M and greater than M (Juárez, 2003);
𝑇𝑇!!(𝑟𝑟, 𝜑𝜑, 𝜆𝜆)
=𝐺𝐺𝐺𝐺𝑟𝑟" + ,
𝑅𝑅𝑟𝑟.
##!"#
#$#!$%
+ ∆𝐶𝐶#̅,&
#
&$'#
𝑄𝑄&(𝜆𝜆) 3𝑎𝑎#,&𝑃𝑃6#,|&|')(𝑠𝑠𝑠𝑠𝑠𝑠𝜑𝜑)
+ ;𝑏𝑏#,& − (𝑠𝑠 + 1)(𝑠𝑠 + 2)@𝑃𝑃6#,|&|(𝑠𝑠𝑠𝑠𝑠𝑠𝜑𝜑)+ 𝑐𝑐#,&𝑃𝑃6#,|&|*)(𝑠𝑠𝑠𝑠𝑠𝑠𝜑𝜑)B 𝑇𝑇!+(𝑟𝑟, 𝜑𝜑, 𝜆𝜆)
=𝐺𝐺𝐺𝐺𝑟𝑟" + ,
𝑅𝑅𝑟𝑟.
##!"#
#$,
+ ∆𝐶𝐶#̅,&
#
&$'#
𝑄𝑄'&(𝜆𝜆) 3𝑑𝑑#,&𝑃𝑃6#'-,|&|')(𝑠𝑠𝑠𝑠𝑠𝑠𝜑𝜑)
+ 𝑔𝑔#,&𝑃𝑃6#'-,|&|(𝑠𝑠𝑠𝑠𝑠𝑠𝜑𝜑)+ ℎ#,&𝑃𝑃6#'-,|&|*)(𝑠𝑠𝑠𝑠𝑠𝑠𝜑𝜑)B ,𝑚𝑚 ≠ 0 𝑇𝑇!.(𝑟𝑟, 𝜑𝜑, 𝜆𝜆)
=𝐺𝐺𝐺𝐺𝑟𝑟" + ,
𝑅𝑅𝑟𝑟.
##!"#
#$,
+ ∆𝐶𝐶#̅,&
#
&$'#
𝑄𝑄&(𝜆𝜆) 3𝛽𝛽#,&𝑃𝑃6#,|&|'-(𝑠𝑠𝑠𝑠𝑠𝑠𝜑𝜑)
+ 𝛾𝛾#,&𝑃𝑃6#,|&|*-(𝑠𝑠𝑠𝑠𝑠𝑠𝜑𝜑)B 𝑇𝑇++(𝑟𝑟, 𝜑𝜑, 𝜆𝜆)
= −𝐺𝐺𝐺𝐺𝑟𝑟" + ,
𝑅𝑅𝑟𝑟.
##!"#
#$#!$%
+ ∆𝐶𝐶#̅,&
#
&$'#
𝑄𝑄&(𝜆𝜆) 3𝑎𝑎#,&𝑃𝑃6#,|&|')(𝑠𝑠𝑠𝑠𝑠𝑠𝜑𝜑)
+ 𝑏𝑏#,&𝑃𝑃6#,|&|(𝑠𝑠𝑠𝑠𝑠𝑠𝜑𝜑) + 𝑐𝑐#,&𝑃𝑃6#,|&|*)(𝑠𝑠𝑠𝑠𝑠𝑠𝜑𝜑)B 𝑇𝑇+.(𝑟𝑟, 𝜑𝜑, 𝜆𝜆)
=𝐺𝐺𝐺𝐺𝑟𝑟" + ,
𝑅𝑅𝑟𝑟.
##!"#
#$,
+ ∆𝐶𝐶#̅,&
#
&$'#
𝑄𝑄'&(𝜆𝜆) 3𝜇𝜇#,&𝑃𝑃6#'-,|&|'-(𝑠𝑠𝑠𝑠𝑠𝑠𝜑𝜑)
+ 𝜗𝜗#,&𝑃𝑃6#'-,|&|*-(𝑠𝑠𝑠𝑠𝑠𝑠𝜑𝜑)B ,𝑚𝑚 ≠ 0 𝑇𝑇..(𝑟𝑟, 𝜑𝜑, 𝜆𝜆)
=𝐺𝐺𝐺𝐺𝑟𝑟" + ,
𝑅𝑅𝑟𝑟.
##!"#
#$#!$%
(𝑠𝑠 + 1)(𝑠𝑠
+ 2) + ∆�̅�𝐶#,&
#
&$'#
𝑄𝑄&(𝜆𝜆)𝑃𝑃6#,|&|(𝑠𝑠𝑠𝑠𝑠𝑠𝜑𝜑)
𝑇𝑇(𝑟𝑟, 𝜑𝜑, 𝜆𝜆) = N𝑇𝑇!! 𝑇𝑇!+ 𝑇𝑇!.𝑇𝑇+! 𝑇𝑇++ 𝑇𝑇+.𝑇𝑇.! 𝑇𝑇.+ 𝑇𝑇..
O.
𝐿𝐿𝐿𝐿𝑔𝑔𝐿𝐿(𝐺𝐺) = −𝑏𝑏𝐺𝐺 + 𝑎𝑎 𝑏𝑏 = 𝐿𝐿𝐿𝐿𝑔𝑔-,𝑒𝑒 (𝐺𝐺 −𝐺𝐺&/#)⁄ .
(8)Eq. (8) is often used to describe earthquake activity in
a particular region. The geometric interpretation of the b-value is the slope of the line representing the equation. The a-value, also called the seismic activity parameter by many seismologists, is proportional to seismicity for a given region and is an index of seismicity (Juárez, 2003). As it is known, coefficient a can be interpreted as the seismicity value. Since the high coefficient is proportional
to the earthquake activity in the region, the high coefficient expresses the earthquake intensity. The b-value can be determined by the least squares’ method. Evaluation is also possible through other statistical predictive applications. It was proposed for a group of earthquakes by Utsu (1965), with the equation;
𝑇𝑇!!(𝑟𝑟, 𝜑𝜑, 𝜆𝜆)
=𝐺𝐺𝐺𝐺𝑟𝑟" + ,
𝑅𝑅𝑟𝑟.
##!"#
#$#!$%
+ ∆𝐶𝐶#̅,&
#
&$'#
𝑄𝑄&(𝜆𝜆) 3𝑎𝑎#,&𝑃𝑃6#,|&|')(𝑠𝑠𝑠𝑠𝑠𝑠𝜑𝜑)
+ ;𝑏𝑏#,& − (𝑠𝑠 + 1)(𝑠𝑠 + 2)@𝑃𝑃6#,|&|(𝑠𝑠𝑠𝑠𝑠𝑠𝜑𝜑)+ 𝑐𝑐#,&𝑃𝑃6#,|&|*)(𝑠𝑠𝑠𝑠𝑠𝑠𝜑𝜑)B 𝑇𝑇!+(𝑟𝑟, 𝜑𝜑, 𝜆𝜆)
=𝐺𝐺𝐺𝐺𝑟𝑟" + ,
𝑅𝑅𝑟𝑟.
##!"#
#$,
+ ∆𝐶𝐶#̅,&
#
&$'#
𝑄𝑄'&(𝜆𝜆) 3𝑑𝑑#,&𝑃𝑃6#'-,|&|')(𝑠𝑠𝑠𝑠𝑠𝑠𝜑𝜑)
+ 𝑔𝑔#,&𝑃𝑃6#'-,|&|(𝑠𝑠𝑠𝑠𝑠𝑠𝜑𝜑)+ ℎ#,&𝑃𝑃6#'-,|&|*)(𝑠𝑠𝑠𝑠𝑠𝑠𝜑𝜑)B ,𝑚𝑚 ≠ 0 𝑇𝑇!.(𝑟𝑟, 𝜑𝜑, 𝜆𝜆)
=𝐺𝐺𝐺𝐺𝑟𝑟" + ,
𝑅𝑅𝑟𝑟.
##!"#
#$,
+ ∆𝐶𝐶#̅,&
#
&$'#
𝑄𝑄&(𝜆𝜆) 3𝛽𝛽#,&𝑃𝑃6#,|&|'-(𝑠𝑠𝑠𝑠𝑠𝑠𝜑𝜑)
+ 𝛾𝛾#,&𝑃𝑃6#,|&|*-(𝑠𝑠𝑠𝑠𝑠𝑠𝜑𝜑)B 𝑇𝑇++(𝑟𝑟, 𝜑𝜑, 𝜆𝜆)
= −𝐺𝐺𝐺𝐺𝑟𝑟" + ,
𝑅𝑅𝑟𝑟.
##!"#
#$#!$%
+ ∆𝐶𝐶#̅,&
#
&$'#
𝑄𝑄&(𝜆𝜆) 3𝑎𝑎#,&𝑃𝑃6#,|&|')(𝑠𝑠𝑠𝑠𝑠𝑠𝜑𝜑)
+ 𝑏𝑏#,&𝑃𝑃6#,|&|(𝑠𝑠𝑠𝑠𝑠𝑠𝜑𝜑) + 𝑐𝑐#,&𝑃𝑃6#,|&|*)(𝑠𝑠𝑠𝑠𝑠𝑠𝜑𝜑)B 𝑇𝑇+.(𝑟𝑟, 𝜑𝜑, 𝜆𝜆)
=𝐺𝐺𝐺𝐺𝑟𝑟" + ,
𝑅𝑅𝑟𝑟.
##!"#
#$,
+ ∆𝐶𝐶#̅,&
#
&$'#
𝑄𝑄'&(𝜆𝜆) 3𝜇𝜇#,&𝑃𝑃6#'-,|&|'-(𝑠𝑠𝑠𝑠𝑠𝑠𝜑𝜑)
+ 𝜗𝜗#,&𝑃𝑃6#'-,|&|*-(𝑠𝑠𝑠𝑠𝑠𝑠𝜑𝜑)B ,𝑚𝑚 ≠ 0 𝑇𝑇..(𝑟𝑟, 𝜑𝜑, 𝜆𝜆)
=𝐺𝐺𝐺𝐺𝑟𝑟" + ,
𝑅𝑅𝑟𝑟.
##!"#
#$#!$%
(𝑠𝑠 + 1)(𝑠𝑠
+ 2) + ∆�̅�𝐶#,&
#
&$'#
𝑄𝑄&(𝜆𝜆)𝑃𝑃6#,|&|(𝑠𝑠𝑠𝑠𝑠𝑠𝜑𝜑)
𝑇𝑇(𝑟𝑟, 𝜑𝜑, 𝜆𝜆) = N𝑇𝑇!! 𝑇𝑇!+ 𝑇𝑇!.𝑇𝑇+! 𝑇𝑇++ 𝑇𝑇+.𝑇𝑇.! 𝑇𝑇.+ 𝑇𝑇..
O.
𝐿𝐿𝐿𝐿𝑔𝑔𝐿𝐿(𝐺𝐺) = −𝑏𝑏𝐺𝐺 + 𝑎𝑎 𝑏𝑏 = 𝐿𝐿𝐿𝐿𝑔𝑔-,𝑒𝑒 (𝐺𝐺 −𝐺𝐺&/#)⁄ . (9)Here M is the average magnitude and Mmin is the
minimum magnitude in the events group. Aki (1965) proved the accuracy of Utsu’s prediction equation (Eq. 9) and it has become possible to follow the statistical distribution with this equation.
Imoto (1991) reported declining b-values calculated based on microearthquakes prior to moderate-magnitude earthquakes in central and southwestern Japan. Jaumé and Sykes (1999) proposed that the b-value declines before major earthquakes can be interpreted as the accelerating seismic moment/energy release hypothesis. The b-value in a region is a tectonic parameter that allows the definition of stress or material (structural) conditions in the focus
Figure 4. Elastic thickness of study area.

ANKAYA PAMUKÇU et al. / Turkish J Earth Sci
839
Figure 5. Gravity tensors calculated from the satellite model, respectively Txx, Txy, Txz, Tyy, Tyz, Tzz.

ANKAYA PAMUKÇU et al. / Turkish J Earth Sci
840
Figure 6. The interpretations of gravity tensors, respectively Txx, Txy, Txz, Tyy, Tyz, Tzz.

ANKAYA PAMUKÇU et al. / Turkish J Earth Sci
841
region (Mogi, 1962). High b-values are thought to be an indicator of low-stress levels in a seismogenic region (Scholz, 1968; Wyss, 1973) and increased material heterogeneity or increased thermal gradient cause to high b-values (Mogi,1962). Conversely, low b-values are associated with high-stress conditions (Gibowitz, 1974).
In this application, b-values of the Samos Island-Aegean Sea earthquake, Lesvos Island-Karaburun earthquake and Kos Island-Gökova Bay earthquake were examined. Samos Island-Aegean Sea earthquake occurred on 30th October 2020 with Mw = 6.9 in the Aegean Sea between the north of the Samos Island and the offshore of İzmir. The focal depth of the earthquake is shallow and about 12 km. The earthquake was felt in a wide area, including the Aegean and Marmara regions, especially in the İzmir province and districts (KOERI, 2020). Lesvos Island-Karaburun (İzmir) earthquake occurred on 12th June 2017 in the Aegean Sea, South of Lesvos Island and offshore of Karaburun (İzmir) with the magnitude Mw = 6.2 (KOERI, 2017a). The focal depth of the earthquake is about 20 km and is a shallow earthquake. Kos Island-Gökova Bay earthquake occurred on 21st July 2017 with Mw = 6.6 and its focal depth is 5 km (KOERI, 2017b).
In this step of the application, for the earthquakes (1.5 < M) occurred for the first 24 h (Figures 7–9) and for 14 days (Figures 10–12) after the main shocks, the a and b-values were calculated by using Gutenberg-Richter law (Figures 13–18, respectively).
3. Results and DiscussionFree air gravity anomaly values present the gravitational gravity effect including the topographic effect. In this context, negative free air gravity anomalies contain the mass effects belonging to the collapsed region, positive free air gravity anomalies are related to the mass effects of the rising areas. Therefore, in this study spherical free air gravity anomaly of Earth2014 model was removed from the spherical free air gravity anomaly computed from GOCE DIR R4 plus EGM2008 model at the same topographic elevation. In the study area, negative amplitudes reaching –40 mgal are seen in the free air gravity anomaly map (Figure 2a) along 38°, 39° and 39.5° latitudes on the Aegean Sea side. Moreover, negative free air gravity anomalies reaching –40 mgal are monitored in the land-sea interference area and on the land side at 38° latitude along 27° and 27.5° longitudes. Here, the notable issue is that the negative amplitude free air gravity anomaly south of the Lesvos Island along 39° latitude is associated with the negative amplitude free air gravity anomaly at 27.5° longitude on land. The alternate of positive and negative values in the free air gravity anomaly in Küçük Menderes and Büyük Menderes basins (Figure 1) between 37.5° and 38.5° latitudes reflect the horst graben property very well (Figure 2a).
When the regional Bouguer values in Figure 2c were examined, it was determined that the regional variation was between 100 and 240 mgal. It was also determined that this change (Figure 2c) showed a regional extension in the NW-SE direction. When the residual Bouguer gravity values in Figure 2d were examined, anomaly changes were found between 80 and 240 mgal. The residual Bouguer gravity values (Figure 2d) started from relatively high amplitude values in Lesvos in the south and decreased around Samos as it progressed towards the north, with the lowest value around Midilli. As a result, it is thought that there are differences in physical properties from south to north, especially in the upper crust of the marine part.
In the study field, the structural condition of the part including the border with the Samos Island, where the volcanic arc begins south of 37.5° latitude, represents quite differences. In other words, the North and south of the Aegean Sea coast, including 37.5° latitude as the border, show great crustal and structurally different characteristics. Besides, the negative amplitude free air gravity anomalies are remarkable seen at 36° latitude and in the north and south of Datça Peninsula (at 37° and 36.5° latitudes).
The zones, where Lesvos and Samos Island earthquakes occurred, have a regional and dominant-negative amplitude free air gravity anomaly in the Aegean Sea with a dominant normal sense character include including a wide collapsed mass effect. According to Lesvos and Samos earthquake zones, the region where the Kos Island earthquake occurred shows a different character. Although the Kos Island earthquake zone and its surroundings are regionally under the influence of a volcanic arc, the region residually shows a mass collapse character.
Additionally, Bayraklı, Bornova districts and İzmir Bay (Figure 1), which experienced a high mortality rate due to the impact of the 30th October 2020 Samos Island earthquake have high negative amplitude free air gravity anomalies (Figure 2a). This means that the area affected by the earthquake present a collapse basin character.
The spherical Bouguer gravity anomaly values calculated for the study region are presented in Figure 2b. Bouguer anomaly contains the effect of underground masses that have been removed from the topography effect. Factors that cause the amplitude of the Bouguer anomaly to decrease are the thickness of the alluvium in the region and the physical conditions such as the pressure, temperature, etc., which affect the density of the underground structure. Bouguer anomaly values were evaluated regionally within the scope of this study. Bouguer anomaly values, which are high in the volcanic arc region in the South, decrease in the north or even though the east from the land initiative (Figure 2b). Low Bouguer anomaly values are observed in connection with the sea and land in the region between 38°–39° latitudes

ANKAYA PAMUKÇU et al. / Turkish J Earth Sci
842
and 27.5°–28° longitudes. Bouguer anomalies in Figure 2b represent decreasing in anomaly amplitude values reflecting the physical properties of underground masses in the Lesvos, Samos and Kos earthquake regions and the existence of their terrestrial continuity. However, unlike Lesvos and Kos Island earthquakes in the region where the Samos earthquake was located, an increase in Bouguer gravity anomaly values along the Seferihisar Coast is observed on the land side in a residual sense. For the same region, in the study of Kahveci et al. (2019), the rising of the amplitudes of GNSS vectors and rationing the vectors to S and SW was related to the differentiation in underground loads and their elongations from North to South.
When the Moho depth map in Figure 3 is examined, the depths in the study area show a decrease from 35 km to 25 km towards the southwest. The zones where Lesvos, Samos and Kos earthquake occurred have similar Moho depths on average.In the volcanic zone beginning at 37.5° latitude, relative to the region to the north, although the
Moho is shallow (Figure 3), the high amplitude of Bouguer anomaly (Figure 2b) means that there is no temperature effect on the underground masses in this region.
In Figure 4, the elastic thickness value of the study area is calculated regionally. The parts in the crust where the elastic thickness (Te) is relatively thick is related to the high rigid property. These rigid parts are seismically active parts (Watts, 2001; Pamukçu and Yurdakul, 2008; Pamukçu and Akçığ, 2011). When the distribution of Te values in Figure 4 is examined, it is clear that seismicity in and around Lesvos Island, Kos Island and Datça Peninsula will be greater than in and around Samos Island. Considering the crustal rigidity characteristics in and around İzmir, it is observed that this region is the seismic activity border within the scope of the Lesvos and Samos earthquakes.
The gravity tensor values of the study region were calculated for the first time in the scope of this study (Figure 5). The results were interpreted in Figure 6 depending on the changes in the amplitudes of the tensors.
Figure 7. The epicentre of Samos Island-Aegean Sea earthquake and the distributions of the aftershocks (1.5 < M)occurred in 24 h.

ANKAYA PAMUKÇU et al. / Turkish J Earth Sci
843
In Figure 6, Txx, Txz, Tzz tensor values show the structure borders which represent changes in the W-E directions and their alternation of positive-negative amplitude from North to South. The tensors confirm the W-E directional regional horst-graben tectonic mechanism. In addition, tensors show the continuity of the mechanism or extensions of underground structures in the marine part. In particular, the observation of the same amplitude direction and changes in the Tzz verifies that the mass and tectonic features in the region continue not only in the lateral direction, but also in the vertical direction. Figure 6 shows that although the Tyx directional changes cannot make much sense, there is an important mechanism in this direction around Bayraklı, Bornova and the İzmir Bay, where the Samos earthquake caused destruction. Tyy (Figure 6) amplitude changes are compatible with the N-S extension of structural elements especially in the south of İzmir such as Çeşme, Gülbahçe, Seferihisar, Orhanlı fault zone in the region. The amplitude extension of the Tyz anomaly is at the location of the N-S trending Gülbahçe fault. In addition, Tyz shows anomalies around Bayraklı,
Bornova and İzmir Bay, where the Samos earthquake caused destruction. This means that these structural elements have a N-S directional changing character, also there is mass continuity in the vertical direction. The fact that the anomaly around Bayraklı, Bornova and the İzmir Bay, where the Samos earthquake caused destruction, is not monitored in x-directional tensors means that there is no W-E directional change of the structural element in the region. In the results of tensor analysis (Figures 5 and 6), it is observed that structural elements south of 37° latitude become different with respect to North. As a result, these underground structures and boundaries with structural continuity may have the ability to transmit seismic movement along lines where rigidity (thickness of Te) increases.
According to the frequency-magnitude relation (Gutenberg–Richter law) a-value is found as 4.134 and b-value is 0.5924 for the Samos Island-Aegean Sea earthquake and its aftershocks in 24 h (Figure 13), a-value is 4.2026 and b-value is 0.8102 for the Lesvos Island-Karaburun (İzmir) earthquake and its aftershocks in 24
Figure 8. The epicentre of Lesvos Island-Karaburun (İzmir) earthquake and the distributions of the aftershocks (1.5 < M) occurred in 24 h.

ANKAYA PAMUKÇU et al. / Turkish J Earth Sci
844
Figure 9. The epicentre of Kos Island-Gökova Bay earthquake and the distributions of the aftershocks (1.5 < M) occurred in 24 h.
Figure 10. The epicentre of Samos Island-Aegean Sea earthquake and the distributions of the aftershocks (1.5 < M) occurred in 14 days.

ANKAYA PAMUKÇU et al. / Turkish J Earth Sci
845
Figure 11. The epicentre of Lesvos Island-Karaburun (İzmir) earthquake and the distributions of the aftershocks (1.5 < M)occurred in 14 days.
Figure 12. The epicentre of Kos Island-Gökova Bay earthquake and the distributions of the aftershocks (1.5 < M) occurred in 14 days.

ANKAYA PAMUKÇU et al. / Turkish J Earth Sci
846
h (Figure 14), a-value is 4.6624 and b-value is 0.8446 for the Kos Island-Gökova Bay earthquake and its aftershocks in 24 h (Figure 15). Additionally, the a-value is 4.877 and b-value is 0.7432 for the Samos Island-Aegean Sea earthquake and its aftershocks in 14 days (Figure 16), a-value is 4.770 and b-value is 0.8714 for the Lesvos Island-Karaburun (İzmir) earthquake and its aftershocks in 14 days (Figure 17), a-value is 4.9586 and b-value is 0.8711 for the Kos Island-Gökova Bay earthquake and its aftershocks in 14 days (Figure 18).
Considering the b-values obtained from the aftershocks that occurred within the first 24 h and 14 days after the main shock, the b-values of the Lesvos Island (0.8102 and 0.8714, respectively) and Kos Island (0.8446 and 0.8711,
respectively) earthquakes are close to each other. But the b-values (0.5924 and 0.7432, respectively) of the first 24-h and first 14-day earthquakes after the main shock on the Samos Island (Figures 13 and 16) are not close to each other. This means that seismic energy in the Lesvos Island and Kos Island regions is discharged within the first 24 h of the main shock, while in the Samos Island earthquake, energy in the region cannot discharge all its energy within 24 h.
If the b-values of the earthquakes occurred within the first 24-h and 14-day (Figures 13–18) compared with the Moho (Figure 3) and effective elastic thickness (Figure 4) values, it was found that the effective elastic thickness values were thicker in the areas where the Lesvos and Kos
y = -0.5924x + 4.135 R² = 0.9849
0
0.5
1
1.5
2
2.5
3
3.5
0 1 2 3 4 5 6 7 8
Log
(Num
ber o
f Eve
nts)
, N
Magnitude (M)
y = -0.8102x + 4.2026
0
0.5
1
1.5
2
2.5
3
0 1 4 5 6 7
Log
(Num
ber o
f Eve
nts)
, N
2 3
Magnitude
Figure 13. The frequency-magnitude relation (Gutenberg–Richter law) for the Samos Island-Aegean Sea earthquake and its aftershocks in 24 h.
Figure 14. The frequency-magnitude relation (Gutenberg–Richter law) for the Lesvos Island-Karaburun (İzmir) earthquake and its aftershocks in 24 h.

ANKAYA PAMUKÇU et al. / Turkish J Earth Sci
847
Island earthquakes occurred with higher b-values and the effective elastic thickness value was lower in the area where the Samos Island earthquake occurred with lower b-values. The lower b-values of Samos Island earthquakes (Figures 13 and 16) point to a crustal problem at the lower crust (Khan and Chakraborty, 2007; Pamukçu, 2016) of the region where Samos Island earthquakes occurred. When examining the effective elastic thickness values (Figure 4), the low effective elastic thickness value in and around Samos Island confirms that there is a problem in the lower crust in this region and is not supported by the strong lithosphere. Thus, it can be said that the high Bouguer anomaly value (Figure 2b) in this region originates from a residual source. It is pointed out that lower crusts of Lesvos and Kos Islands are stronger than
Samos Island’s crust according to b-values and effective elastic thickness values.
4. ConclusionThe high seismic activity in and around the Aegean Sea is an important condition. Questions such as the probability of an earthquake occurring in any region and the effect it will create when an earthquake occurs contain an important parallel with the seismic activity of that region. The seismic a and b-values calculated in the study area and the seismic activity of the region constitute the main source for possible earthquakes. In addition, regions where earthquakes can be intense and the character of the earthquake’s path on the possible fault/fault line can be determined. The a and b values were obtained as 4.134
y = -0.8446x + 4.6624
0
0.5
1
1.5
2
2.5
3
3.5
0 1 2 3 5 6 7 8
Log
(Num
ber o
f Eve
nts)
, N
4Magnitude (M)
Figure 15. The frequency magnitude relation (Gutenberg–Richter law) for the Kos Island-Gökova Bay earthquake and its aftershocks in 24 h.
y = -0.7432x + 4.877
0
0.5
1
1.5
2
2.5
3
3.5
4
0 1 2 3 5 6 7 8
Log
(Num
ber o
f Eve
nts )
, N
4Magnitude (M)
Figure 16. The frequency magnitude relation (Gutenberg–Richter law) for the Samos Island-Aegean Sea earthquake and its aftershocks in 14 days.

ANKAYA PAMUKÇU et al. / Turkish J Earth Sci
848
and 0.5924 for the Samos Island-Aegean Sea earthquake, 4.2026 and 0.8102 for the Lesvos Island-Karaburun (İzmir) earthquake, 4.6624 and 0.8446 for the Kos Island-Gökova Bay earthquake aftershocks in 24 h. In addition, the a and b-values were calculated as 4.877 and 0.7432 for the Samos Island-Aegean Sea, 4.770 and 0.8714 for the Lesvos Island-Karaburun (İzmir) earthquake, 4.9586 and 0.8711 for the Kos Island-Gökova Bay earthquake and its aftershocks in 14 days. When the seismic a and b-values and graphs are examined within the scope of this study, it is seen that the character of the Samos earthquake is different from the others. Similarly, the fact that Te is 8 km and below in the Samos earthquake region suggests that there are effective crustal factors in the compensation
mechanism in regional isostasy. This means that the geodynamic activity in and around Samos will continue over a long geological time scale.
AcknowledgmentThe ground data were collected from No 108Y285 and No 106G159 Scientific and Technological Research Council of Turkey (TÜBİTAK) Project. We would like to thank Dr. Recep Çakır for his advices related with the seismic risk. Some figures are created with the Global Mapping Tools (GMT) Version 6.0 (Wessel et al., 2019). We thank the anonymous reviewers for their valuable time and comments in the development of the publication.
y = -0.8714x + 4.770
0
0.5
1
1.5
2
2.5
3
3.5
0 1 2 5 6 7
Log
(Num
er o
f Eve
nt),
N
3 4 Magnitude (M)
y = -0.8711x + 4.9586
0
0.5
1
1.5
2
2.5
3
3.5
4
0 1 2 3 5 6 7 8
Log
(Num
er o
f Eve
nts)
, N
4Magnitude (M)
Figure 17. The frequency magnitude relation (Gutenberg–Richter law) for the Lesvos Island-Karaburun (İzmir) earthquake and its aftershocks in 14 days.
Figure18. The frequency-magnitude relation (Gutenberg–Richter law) for the Kos Island-ökova Bay earthquake and its aftershocks in 14 days.

ANKAYA PAMUKÇU et al. / Turkish J Earth Sci
849
References
Aki K (1965). Maximum likelihood estimate of b in the formula logN=a-bM and its confidence limits. Earth Research Institute 43: 232-239.
Ates A, Kearey P (2000). Interpretation of gravity and aeromagnetic anomalies of the Konya Region, South Central Turkey. Journal of the Balkan Geophysical Society 3(3): 37-44.
Ates A, Bilim F, Buyuksarac A (2005). Curie point depth investigation of Central Anatolia, Turkey. Pure and Applied Geophysics 162(2): 357-371.
Bozkurt E (2001). Neotectonics of Turkey—a synthesis. Geodinamica Acta 14: 3–30.
Bozkurt E (2007). Extensional vs contractional origin for the Southern Menderes ShearZone, Southwest Turkey: tectonic and metamorphic implications. Geological Magazine 144: 191–201.
Bucha B, Janák J (2013). A MATLAB-based graphical user interface program for computing functionals of the geopotential up to ultra-high degrees and orders. Computers and Geosciences 56: 186-196.
Çırmık A, Pamukçu O, Akçığ Z (2016). Mass and stress changes in the Menderes Massif (Western Anatolia, Turkey). Journal of Asian Earth Sciences 131: 109–122.
Çırmık A, Pamukçu O (2017). Clarifying the interplate main tectonic elements of Western Anatolia, Turkey by using GNSS velocities and Bouguer gravity anomalies. Journal of Asian Earth Sciences 148: 294-304.
Deprem Ana Şok ve Artçıların Qgis Programında Kullanma Amaçlı Verileri (Erişim Tarihi: 17 Aralık 2020), http://www.koeri.boun.edu.tr/sismo/zeqdb/.
Dewey JF, Şengör AMC (1979). Aegean and surrounding regions: Complex multiplate and continuum tectonics in a convergent zone. Geological Society of America Bulletin 90 (1): 84-92.
Dogru F, Pamukcu O, Ozsoz I (2017). Application of tilt angle method to the Bouguer gravity data of Western Anatolia. Bulletin of the Mineral Research and Exploration 155(155): 213-222.
Dogru F, Pamukcu O, Gonenc T, Yildiz H (2018). Lithospheric structure of western Anatolia and the Aegean Sea using GOCE-based gravity field models. Bollettino di Geofisica Teorica ed Applicata 59(2): 135-160.
Gessner K, Gallardo LA, Markwitz V, Ring U, Thomso SN (2013). What caused the denudation of the Menderes Massif: Review of crustal evolution, lithosphere structure, and dynamic topography in southwest Turkey. Gondwana Research24(1): 243-274.
Gibowitz SJ (1974). Frequency-magnitude depth and time relations for earthquakes in Island Arc: North Island, New Zealand. Tectonophysics 23: 283-297.
Gutenberg B, Richter CF(1954). Seismicity of the Earth, second ed., Princeton Press.
Hartley R, Watts AB, Fairhead JD (1996). Isostasy of Africa. Earth and Planetary Science Letters 137(1-4): 1-18.
Jackson J, McKenzie D (1984) Active tectonics of the Alpine—Himalayan Belt between western Turkey and Pakistan. Geophysical Journal International 77(1): 185-264.
Jaumé SC, Sykes LR (1999). Evolving towards a critical point: A review of accelerating seismic moment/energy release prior to larger and great earthquakes. Pure and Applied Geophysics 155: 276-306.
Juárez DAM (2003). Statistical Seismology Studies in Central America b-value seismic hazard and seismic quiescence, Faculty of Science and Technology, Uppsala University.
Imoto M (1991). Changes in the magnitude–frequency b-value prior to large (M=6.0) earthquakes in Japan. Tectonophysics 193: 311–325.
Kahveci M, Çırmık A, Doğru F, Pamukçu O, Gönenç T (2019). Subdividing the tectonic elements of Aegean and Eastern Mediterranean with gravity and GPS data. Acta Geophysica 67(2): 491-500.
Khan PK, Chakraborty PP (2007). The seismic b-value and its correlation with Bouguer gravity anomaly over the Shillong Plateau area: tectonic implications. Journal of Asian Earth Sciences 29(1): 136-147.
KOERI (Kandilli Observatory and Earthquake Research Center) (2017a). 12 Haziran 2017 Karaburun Açıkları - Ege Denizi Depremi [online]. Website http://www.koeri.boun.edu.tr/sismo/2/wp/content/uploads/2017/06/12_HAZIRAN_2017_EGE_DENIZI_DEPREMI.pdf [accessed 13 July 2021] (in Turkish).
KOERI (Kandilli Observatory and Earthquake Research Center) (2017b). 21 Temmuz 2017 Kos Adasi-GÖkova Körfezi Depremi İvme Kayitlari Ve Özellikleri [online]. Websitehttp://www.koeri.boun.edu.tr/depremmuh/raporlar/Bodrum-Depremi_On_Rapor2.pdf[accessed 13 July 2021] (in Turkish).
KOERI (Kandilli Observatory and Earthquake Research Center) (2017).30 Ekim 2020 Ege Denizi Depremi[online].Website http://www.koeri .boun.edu.tr/sismo/2/wp-content/uploads/2020/10/20201030_İzmir_V1.pdf http://koeri.boun.edu.tr. [accessed 13 July 2021] [accessed 13 July 2021] (in Turkish).
Maden N, Öztürk S (2015). Seismic b-values, bouguer gravity and heat flow data beneath Eastern Anatolia, Turkey: Tectonic implications. Surveys in Geophysics 36(4): 549-570.
Martín A, Núñez MA, Gili JA, Anquela AB (2011). A comparison of robust polynomial fitting, global geopotential model and spectral analysis for regional–residual gravity field separation in the Doñana National Park (Spain). Journal of Applied Geophysics, 75(2): 327-337.
McKenzie DP (1972). Active tectonics of the Mediterranean region. Geophysical Journal of the Royal Astronomical Society 30: 109– 185.
McKenzie D, Bowin C (1976). The relationship between bathymetry and gravity in the Atlantic Ocean. Journal of Geophysical Research 81(11): 1903-1915.

ANKAYA PAMUKÇU et al. / Turkish J Earth Sci
850
Mogi K (1962). Magnitude-frequency relationship for elastic shocks accompanying fractures of various materials and some related problems in earthquakes. Bull. Earthquake Res. Inst. Univ. Tokyo. 40: 831-883.
Mohamed EB, Brimich L, Saleh A, Saleh S. (2012). Comparative study between the structural and tectonic situation of the Southern Sinai and the Red Sea, Egypt, as deduced from magnetic, gravity and seismic data. Contributions to Geophysics and Geodesy 42(4): 357-388.
Oldenburg DW (1974). The inversion and interpretation of gravity anomalies. Geophysic, 39: 526-536.
Oruç B, Ulutaş E, PamukçuO, Selim HH,Sönmez T (2019). Rheological stratification and spatial variations in the effective elastic thickness of the lithosphere underneath the central Anatolian region, Turkey. Journal of Asian Earth Sciences176: 1-7.
Ozturk S(2012). Statistical correlation between b-value and fractal dimension regarding Turkish epicentre distribution. Earth Sciences Research Journal 16(2): 103-108.
Öztürk S (2015). A study on the correlations between seismotectonic b-value and Dcvalue, and seismic quiescence Z-value in the Western Anatolian region of Turkey. Austrian Journal of Earth Sciences 108(2).
Pamukcu O, Yurdakul A (2008). Isostatic compensation in western Anatolia with estimate of the effective elastic thickness. Turkish Journal of Earth Sciences 17(3): 545-557.
Pamukçu OA, Akçığ Z (2011). Isostasy of the Eastern Anatolia (Turkey) and discontinuities of its crust. Pure and Applied Geophysics 168(5): 901-917.
Pamukçu O (2016). Geodynamic assessment of Eastern Mediterranean region: a joint gravity and seismic b value approach. Arabian Journal of Geosciences 9(5): 360.
Pamukçu O, Gönenç T, Cirmik A, Sindirgi P, Kaftan I et al. (2015). Investigation of vertical mass changes in the south of İzmir (Turkey) by monitoring microgravity and GPS/GNSS methods. Journal of Earth System Science 124(1): 137-148.
Parker RL (1972). The rapid calculation of potential anomalies. Geophys. J. Int. 31: 447-455.
Rexer M, Hirt C, Claessens S, Tenzer R (2016). Layer-Based modelling of the Earth’s gravitational potential up to 10-km scale in spherical harmonics in spherical and ellipsoidal approximation. Surveys in Geophysics 37: 1035-1074.
Saleh S (2013). 3D crustal and lithospheric structures in the southeastern Mediterranean and northeastern Egypt. Pure and Applied Geophysics170(12): 2037-2074.
Scholz H (1968). The frequency-magnitude relation of microfracturing in rock and its relation to earthquakes. Bulletin of the Seismological Society of America 58: 399-415.
Sözbilir H, Sarı B, Uzel B, Sümer Ö, Akkiraz S (2011). Tectonic implications of transtensional supradetachment basin development in an extension-parallel transfer zone: the Kocaçay Basin, Western Anatolia. Turkey. Basin Research 23 (4): 423–448.
Sözbilir H, Softa M, Eski S, Tepe Ç, Akgün M et al. (2020). Ekim 2020 Sisam (Samos) Depremi (Mw: 6, 9) Değerlendirme Raporu. DEÜ Deprem Araştırma ve Uygulama Merkezi.
Tiryakioğlu İ, Aktuğ B, Yiğit CÖ, Yavaşoğlu HH, Sözbilir H et al. (2018). Slip distribution and source parameters of the 20 July 2017 Bodrum-Kos earthquake (Mw6.6) from GPS observations. Geodinamica Acta 30 (1): 1-14.
Utku M (2011). Resolving a complex seismic moment tensor into a series of simple double couple sources: A case of Turkey. International Journal of Physical Sciences 6(10): 2550-2564.
Utsu T (1965). A method for determining the value of b in the formula logN=a-bM showing the magnitude-frequency relation for earthquakes. Geophys. Bull. Hokkaido Univ. 13: 99-103 (In Japanese with English abstract).
Watts AB (2001). Isostasy and Flexure of the Lithosphere. Cambridge University Press.
Wessel P, Luis JF, Uieda L, Scharroo R, Wobbe F et al. (2019). The Generic Mapping Tools version 6. Geochemistry, Geophysics, Geosystems 20: 5556–5564.
Wyss M (1973). Towards a physical understanding of the earthquake frequency distribution. Geophys. J. R. Astr. Soc. 31: 341-359.
Yılmaz Y, Genç C, Gürer F, Bozcu M, Yılmaz K et al. (2000). When did the western Anatolian grabens begin to develop? In: Bozkurt E, Winchester JA, Piper JDA (eds) Tectonics and magmatism in Turkey and surrounding area,173. Geological Society of London, London: 353–384.
Yildiz H, Cirmik A, Pamukcu O, Özdağ ÖC, Gönenç T et al. (2021). 12th June 2017 offshore Karaburun-Lesvos Island earthquake coseismic deformation analysis using continuous GPS and seismological data. Turkish Journal of Earth Sciences 30(3): 341-358.
Zuber MT, Bechtel TD, Forsyth DW (1989). Effective elastic thicknesses of the lithosphere and mechanisms of isostatic compensation in Australia. Journal of Geophysical Research: Solid Earth 94(B7): 9353-9367.