seiqr-sis epidemic network model and its · pdf fileabstract—in this paper, we propose...
TRANSCRIPT

Abstract—In this paper, we propose an SEIQR-SIS epidemic network model to study pandemic influenza and derive the approximate threshold condition (basis reproductive number) to examine the stability of the model. The numerical simulation of the disease transmission in the adaptive social network with people nodes and hub nodes is presented. The network parameters including visiting probability, hub radius and contact radius are used to investigate their impacts on the disease transmission. Our results show that these network parameters have a significant effect on the disease spread.
Keywords—Adaptive network, Stability analysis, SEIQR-SIS epidemic model, Pandemic influenza, Reproductive number
I. INTRODUCTION OWADAYS, new human cases of an influenza
A(H1N1) virus infection have been continuously announced in many countries around the world. Geographic spread of the H1N1 virus continues to evolve. The highest number of cases is in Mexico, the United States, and Canada. There are also reports of cases in Europe, Asia, and in Latin America. Currently, such outbreaks are taking place only in North America. The WHO is now keeping the pandemic alert level at phase 5. Whenever community-level transmission occurs in more than 1 WHO region, the pandemic alert level will increase to phase 6.
In Thailand, the situation of influenza is quite anxious. As it just happened that 470 people became sick and 2 among those died in January 2011. For the moment, there is no tool accessible for simulating and predicting the spread of influenza.
Manuscript received May 31, 2011. This work was supported by Centre of
Excellence in Mathematics, PERDO, CHE and Faculty of science, Mahidol University, THAILAND.
Wannika Jumpen is with Department of Mathematics, Faculty of Science, Mahidol University, and Centre of Excellence in Mathematics, PERDO, CHE, Thailand. (e-mail: [email protected]).
Somsak Orankitchareon is with Department of Mathematics, Faculty of Science, Mahidol University, and Centre of Excellence in Mathematics, PERDO, CHE, Thailand. (corresponding author to provide phone: +66 2201 5340 ; fax: +66 22015343; e-mail: [email protected]).
Pichit Boonkrong is with Department of Mathematics, Faculty of Science, Mahidol University, and Centre of Excellence in Mathematics, PERDO, CHE, Thailand. (e-mail: [email protected]).
Benchawan Wiwatanapataphee is with Department of Mathematics, Faculty of Science, Mahidol University, and Centre of Excellence in Mathematics, PERDO, CHE, Thailand. (e-mail: [email protected]).
Over the last thirty years, a number of influenza models have been proposed to study spreading behavior of the disease [1,2,5,6]. Flahault et al. (1994) proposed an epidemic model reckoning with regular air transport between cities of consideration to study the geographical spread of influenza in Europe. They simulated an epidemic within a network of a city including Amsterdam, Berlin, Budapest, Copenhagen, London, Madrid, Milano, Paris and Stockholm. The results showed that the time lag for action is less than one month after the first outbreak. Casagrandi et al. (2006) developed the SIRC model to study the epidemic of the influenza A viruses taking into account the class C for the cross-immune individuals in the population, and the seasonality effect on the epidemiological regimes. They found that as the cross-immunity increase, the SIRC model displays more complexity to the system dynamics. Iwami and Hara (2010) constructed a generalized SIRS epidemic model with n-strain and derived the basic reproduction number of each viral strain. The local and global stabilities of equilibria were also analyzed. Recently, many researchers have proposed epidemic models involving a network of nodes in a discrete space domain [9,10,12,13,14,15,17]. Mishra and Saini (2007) formulated SEIRS model of malicious objects in the situation of the computer network with the emphasis on the constant of latent and immune periods. With their models, it is found that the longer latent period is, the lesser chance of the system is endemic. Santorros and Vespignani (2008) employed a simulation technique and analytical method to study a dynamical model for the spreading of epidemic in complex networks. It is observed that many scale-free networks are inclined to the epidemic spreading with the persistence of infections no matter what the values of spreading rates are. Yuan and Chen (2008) focused their investigation on the virus-epidemic model on computer network called e-SEIR model with the point-to-group information propagation. They analyzed long term behavior of virus propagation equilibrium and discovered that it was crucial but difficult to impose the immunization of susceptible nodes for controlling long term propagation of such equilibrium. Li et al. (2010) used SIR model in homogeneous and heterogeneous networks of disease transmission to study the role of effective contact between individuals to the epidemic threshold and the incidence of infection. They found that the epidemic is a monotone decreasing function of epidemic threshold and increasing function of the number of effective contact. Lucas (2011) studied how network topology affects the long term distribution of infected and susceptible populations in the SIS
SEIQR-SIS Epidemic Network Model and Its Stability
Wannika Jumpen, Somsak Orankitjaroen, Pichit Boonkrong, Benchawan Wiwatanapataphee
N
INTERNATIONAL JOURNAL OF MATHEMATICS AND COMPUTERS IN SIMULATION
Issue 4, Volume 5, 2011 326

model. Mathematical analysis of SIS model in epidemiology on top of a one parameter family of networks ranging from scale free to exponential connectivity distribution is more resistant to the spread of a deadly disease. It has been recognized that mathematical model solely may cause the uncertainty in prediction of the spreading and public health responses. More details can be seen from the review papers of Keeling and Eames (2005), and Meyer (2006). Keeling and Eames (2005) reviewed the basis of epidemiological and network theory, and discussed a wide range of the most popular network types and their implications for epidemic transmission. Meyers (2006) provided a brief overview of the compartment SIR model and the contact network epidemiology. The important epidemiological quantities were derived by using bond percolation on random graphs to model the transmission of infectious disease though heterogeneous populations. He illustrated his method with two practical applications, namely, controlling walking pneumonia outbreaks in closed settings and optimal distribution of influenza vaccines.
It is evident that the existing epidemic models considering the disease transmission only among the people in a particular contact radius, ignoring the disease spread through public places. Therefore, the epidemic network model taking into account the features of public places in the human community is more reasonable and it can be used to capture the disease transmission in biological network.
The main aim of this paper is the study of the disease transmission using the SEIQR-SIS network model. The rest of the paper is organized as follows. The network model and its approximate threshold values for its stability are presented in section II. Section III presents a numerical example of pandemic influenza. Finally, discussion and conclusion are given in section IV.
II. EPIDEMIC MODEL AND STABILITY ANALYSIS
A. Epidemic Model Our model contains two populations representing people and public places which hereafter called people nodes and hub nodes. We require an epidemic system for each population. Both systems are coupled into a larger system through infection of susceptible people nodes by infectious hub nodes, and susceptible hub nodes by infectious people nodes. Similar to the SIS-SEIQR model discussed more elaborate in [7], we have a model with 7 coupled people differential equations. A diagrammatic flow chart of the epidemic model for an infection between people nodes and hub nodes is shown in Figure 1.
Figure 1: The flow diagram of the infection dynamics of SEIQR-SIS model where the dash line represents interaction between people nodes and hub nodes and the arrow line represents transfer flow of the system (1).
*1 2
*1 2
1
1
1
** * * *
2 1 2
**
2 1
( ) /
( ) / ( )
( )
(1)
( )
( ) /
(
dS SI SI NdtdE SI SI N EdtdI E IdtdQ I QdtdR E I QdtdS S I S I M Idt
dI S Idt
β β
β β α κ
α γ δ
δ γ
κ γ
β β γ
β β
= − +
= + − +
= − +
= −
= + +
= − + +
= +
% %
% % * * *2) /S I M Iγ−
where S, E, I, Q and R are five compartments of people populations, S* and I* are two compartments of hub populations. The letters S, E, I, Q and R represent respectively the numbers of susceptible, exposed, infectious, quarantine and recovered individuals of people nodes whereas S* and I* denote respectively the numbers of susceptible and infectious individuals of hub nodes. Table 1 presents the nomenclature of parameters used in the system.
Table 1: Nomenclature of parameters used in the model.
Parameters Descriptions 1β Transmission rate between people nodes
2β Transmission rate between susceptible people nodes and infectious hub nodes
α Transfer rate at which E becomes I κ Transfer rate at which E becomes R
1γ Transfer rate at which I and Q becomes R δ Transfer rate at which I becomes Q
1β% Transmission rate between hub nodes
2β% Transmission rate between susceptible hub nodes and infectious people nodes
2γ Transfer rate at which I* becomes S*
INTERNATIONAL JOURNAL OF MATHEMATICS AND COMPUTERS IN SIMULATION
Issue 4, Volume 5, 2011 327
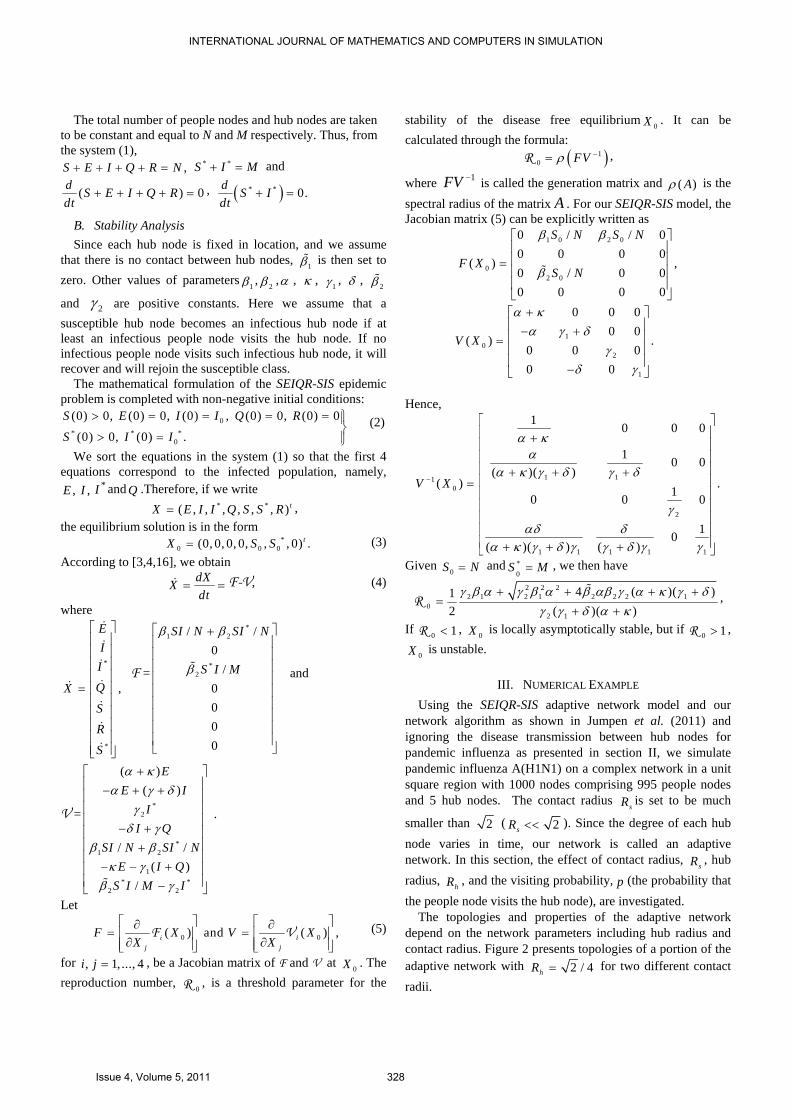
The total number of people nodes and hub nodes are taken to be constant and equal to N and M respectively. Thus, from the system (1),
,S E I Q R N+ + + + = * *S I M+ = and
( ) 0d S E I Q Rdt
+ + + + = , ( )* * 0.d S Idt
+ =
B. Stability Analysis Since each hub node is fixed in location, and we assume that there is no contact between hub nodes, 1β% is then set to zero. Other values of parameters 1β , 2β ,α , κ , 1γ , δ , 2β%
and 2γ are positive constants. Here we assume that a susceptible hub node becomes an infectious hub node if at least an infectious people node visits the hub node. If no infectious people node visits such infectious hub node, it will recover and will rejoin the susceptible class. The mathematical formulation of the SEIQR-SIS epidemic problem is completed with non-negative initial conditions:
0
* * *0
(0) 0, (0) 0, (0) , (0) 0, (0) 0
(0) 0, (0) .
S E I I Q R
S I I
> = = = = ⎫⎪⎬
> = ⎪⎭ (2)
We sort the equations in the system (1) so that the first 4 equations correspond to the infected population, namely,
,E ,I *I and Q .Therefore, if we write * *( , , , , , , ) tX E I I Q S S R= ,
the equilibrium solution is in the form *
0 0 0(0, 0, 0, 0, , , 0) .tX S S= (3) According to [3,4,16], we obtain
dXXdt
= =& F-V, (4)
where
*
*
,
EII
QXSR
S
⎡ ⎤⎢ ⎥⎢ ⎥⎢ ⎥⎢ ⎥
= ⎢ ⎥⎢ ⎥⎢ ⎥⎢ ⎥⎢ ⎥⎢ ⎥⎣ ⎦
&
&
&
&&
&
&
&
F =
*1 2
*2
/ /0
/ 0
000
SI N SI N
S I M
β β
β
⎡ ⎤+⎢ ⎥⎢ ⎥⎢ ⎥⎢ ⎥⎢ ⎥⎢ ⎥⎢ ⎥⎢ ⎥⎢ ⎥⎣ ⎦
% and
V =*
2
*1 2
1* *
2 2
( )( )
/ /( )
/
α κα γ δ
γδ γ
β βκ γ
β γ
+⎡ ⎤⎢ ⎥− + +⎢ ⎥⎢ ⎥⎢ ⎥− +⎢ ⎥⎢ ⎥+⎢ ⎥
− − +⎢ ⎥⎢ ⎥−⎣ ⎦%
EE I
II Q
SI N SI NE I Q
S I M I
.
Let
0 0( ) and ( ) ,ij j
F X V XX X
⎡ ⎤ ⎡ ⎤∂ ∂= =⎢ ⎥ ⎢ ⎥
∂ ∂⎢ ⎥ ⎢ ⎥⎣ ⎦ ⎣ ⎦iF V (5)
for , 1, ..., 4i j = , be a Jacobian matrix of F and V at 0X . The reproduction number, 0R , is a threshold parameter for the
stability of the disease free equilibrium 0X . It can be calculated through the formula:
( )10 FVρ −=R ,
where 1−FV is called the generation matrix and ( )Aρ is the spectral radius of the matrix A . For our SEIQR-SIS model, the Jacobian matrix (5) can be explicitly written as
1 0 2 0
02 0
0 / / 00 0 0 0
( ) ,0 / 0 00 0 0 0
S N S N
F XS N
β β
β
⎡ ⎤⎢ ⎥⎢ ⎥=⎢ ⎥⎢ ⎥⎣ ⎦
%
10
2
1
0 0 00 0
( ) .0 0 00 0
V X
α κα γ δ
γδ γ
+⎡ ⎤⎢ ⎥− +⎢ ⎥=⎢ ⎥⎢ ⎥−⎣ ⎦
Hence,
1 110
2
1 1 1 1 1
1 0 0 0
1 0 0( )( )
( ) .10 0 0
10( )( ) ( )
V X
α κα
α κ γ δ γ δ
γαδ δ
α κ γ δ γ γ δ γ γ
−
⎡ ⎤⎢ ⎥+⎢ ⎥⎢ ⎥⎢ ⎥+ + +⎢ ⎥=⎢ ⎥⎢ ⎥⎢ ⎥⎢ ⎥⎢ ⎥+ + +⎣ ⎦
Given 0S N= and *0
S M= , we then have 2 2 2
2 1 2 1 2 2 2 10
2 1
4 ( )( )12 ( )( )
γ β α γ β α β αβ γ α κ γ δγ γ δ α κ
+ + + +=
+ +
%R ,
If 0 1<R , 0X is locally asymptotically stable, but if 0 1>R ,
0X is unstable.
III. NUMERICAL EXAMPLE Using the SEIQR-SIS adaptive network model and our
network algorithm as shown in Jumpen et al. (2011) and ignoring the disease transmission between hub nodes for pandemic influenza as presented in section II, we simulate pandemic influenza A(H1N1) on a complex network in a unit square region with 1000 nodes comprising 995 people nodes and 5 hub nodes. The contact radius sR is set to be much
smaller than 2 ( 2sR << ). Since the degree of each hub node varies in time, our network is called an adaptive network. In this section, the effect of contact radius, sR , hub radius, hR , and the visiting probability, p (the probability that the people node visits the hub node), are investigated.
The topologies and properties of the adaptive network depend on the network parameters including hub radius and contact radius. Figure 2 presents topologies of a portion of the adaptive network with 2 / 4hR = for two different contact radii.
INTERNATIONAL JOURNAL OF MATHEMATICS AND COMPUTERS IN SIMULATION
Issue 4, Volume 5, 2011 328

(a)
(b)
Figure 2: Topologies of a part of the adaptive network with 2 / 4hR = for two different contact radii (a) 0.05sR = and
(b) 0.07sR = . To investigate the effect of contact radius on the network properties including number of edges, average vertex-vertex distance, average degree and clustering coefficient, we fix the hub radius hR of 2 / 4 and vary contact radius. The results are presented in Table 2 and Figure 3. Table 2: Properties of the adaptive network for 5 different contact radii Rs.
sR 0.05 0.07 0.09 0.11 0.13
E 3670 6572 10473 15914 21155 k 7.3400 13.1440 20.9460 31.8280 42.3100 d 10.6935 7.2713 5.5451 4.45898 3.8723 C 0.4900 0.5554 0.5807 0.6011 0.6127
(a)
(b)
(c)
(d)
Figure 3: Dependence of the network properties with contact radius for the adaptive network with hR of 2 / 4 .
From Table 2 and Figure 3, we can see that as the contact radius increases, the number of edges (|E|), the average degree ( k ), the clustering coefficient (C) increase but the average vertex-vertex distance ( d ) decreases.
Next, we investigate the effect of hub radius on the network properties by varying the sizes of hub radius with the particular contact radius, Rs, of 0.07. The results are shown in Table 3 and Figure 4.
INTERNATIONAL JOURNAL OF MATHEMATICS AND COMPUTERS IN SIMULATION
Issue 4, Volume 5, 2011 329

Table 3: Properties of the adaptive network for 3 different hub radii Rh.
hR 2 / 5 2 / 4 2 / 3 E 6450 6572 6921 k 12.8990 13.1440 13.8420 d 7.3066 7.2713 7.2458 C 0.5560 0.5558 0.5561
(a)
(b)
(c)
(d)
Figure 4: Dependence of network properties with hub radius for adaptive network with sR of 0.07.
From Table 3 and Figure 4, the results indicate that increasing the hub radius gives the higher number of edges (|E|) and the average degree ( k ) but the lower average vertex-vertex distance ( d ); however, the clustering coefficient (C) remains indifferent. To study how the disease spreads in the population network, we still use the same adaptive social network. In the simulation, we use the parameter values as shown in Table 4. Table 4: Parameter values used in the simulation.
Parameters Values 1β 1/20
2β 1 α 1/4 κ 1/50
1γ 1/6 δ 1/5
1β% 0
2β% 1
2γ 1
In real situation, people in each community do not visit public places at the same time, we then apply the visiting probability p of the people nodes to determine the change of the people node-hub node links of network over the time. Figure 5 presents topologies of the adaptive network with the hub radius Rh of 0.25, the contact radius Rs of 0.07 and the visiting probability p of 0.5 at four different times including 5, 10, 15 and 20 days.
(a)
(b)
(c)
INTERNATIONAL JOURNAL OF MATHEMATICS AND COMPUTERS IN SIMULATION
Issue 4, Volume 5, 2011 330

(d)
Figure 5: Topologies of a portion of the adaptive network (Nh = 5) corresponding to the neighborhood contact radius Rs of 0.07, the hub radius Rh of 0.25 and the visiting probability p of 0.5 at four different times: (a) t = 5 day, (b) t = 10 days, (c) t = 15 days, (d) t = 20 days. As displayed in Figure 5, the visiting probability affects the change of the connection between hub nodes and surrounding people nodes over the time.
To investigate the impact of hub radius on the disease transmission, we simulate the results on our network with three different hub radii: Rh of 2 / 3 , 2 / 4 and 2 / 5 .
(a)
(b)
(c)
(d)
(e)
Figure 6: The variation in the proportion of S, E, I, Q and R from 30 runs of simulation.
In Figure 6, the S, E, I, Q and R profiles are presented corresponding to Rh of 2 / 4 . The dark line represents the average proportion of each individual and a number of light blue lines illustrate the proportion of each individual obtained from 30 runs.
(a)
(b)
INTERNATIONAL JOURNAL OF MATHEMATICS AND COMPUTERS IN SIMULATION
Issue 4, Volume 5, 2011 331
(c)
(d)
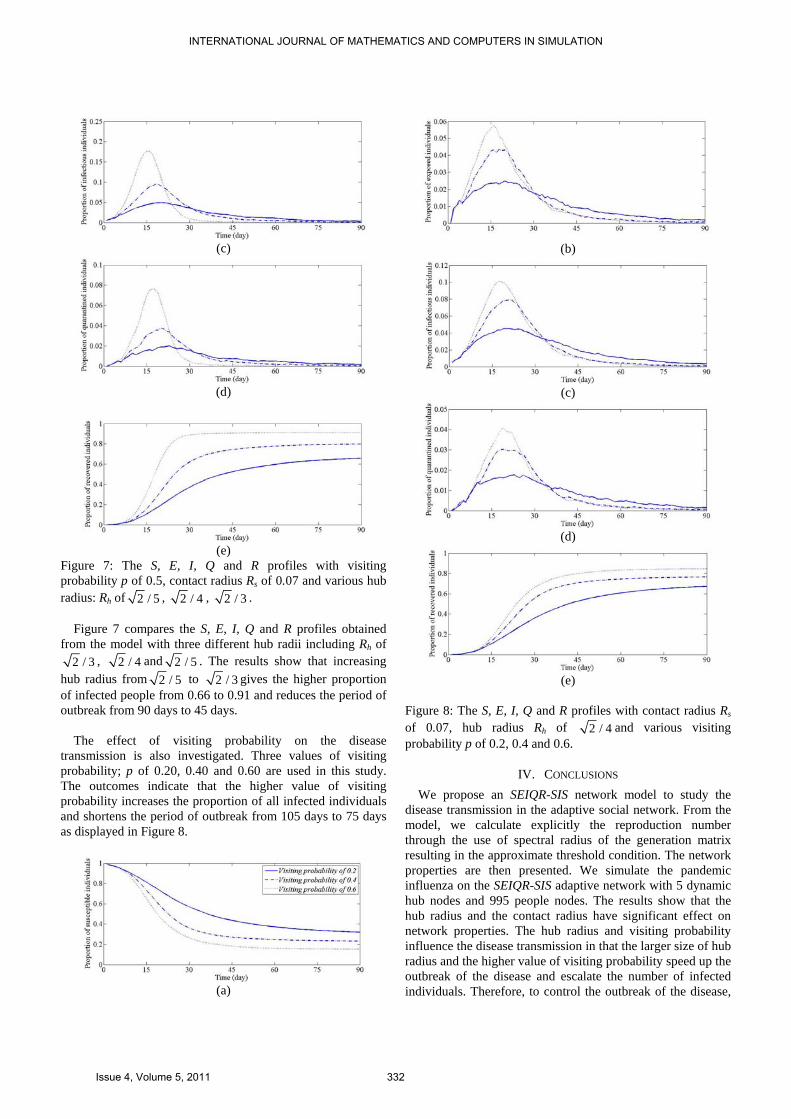
(e)
Figure 7: The S, E, I, Q and R profiles with visiting probability p of 0.5, contact radius Rs of 0.07 and various hub radius: Rh of 2 / 5 , 2 / 4 , 2 / 3 .
Figure 7 compares the S, E, I, Q and R profiles obtained
from the model with three different hub radii including Rh of 2 / 3 , 2 / 4 and 2 / 5 . The results show that increasing
hub radius from 2 / 5 to 2 / 3 gives the higher proportion of infected people from 0.66 to 0.91 and reduces the period of outbreak from 90 days to 45 days.
The effect of visiting probability on the disease transmission is also investigated. Three values of visiting probability; p of 0.20, 0.40 and 0.60 are used in this study. The outcomes indicate that the higher value of visiting probability increases the proportion of all infected individuals and shortens the period of outbreak from 105 days to 75 days as displayed in Figure 8.
(a)
(b)
(c)
(d)
(e)
Figure 8: The S, E, I, Q and R profiles with contact radius Rs of 0.07, hub radius Rh of 2 / 4 and various visiting probability p of 0.2, 0.4 and 0.6.
IV. CONCLUSIONS We propose an SEIQR-SIS network model to study the disease transmission in the adaptive social network. From the model, we calculate explicitly the reproduction number through the use of spectral radius of the generation matrix resulting in the approximate threshold condition. The network properties are then presented. We simulate the pandemic influenza on the SEIQR-SIS adaptive network with 5 dynamic hub nodes and 995 people nodes. The results show that the hub radius and the contact radius have significant effect on network properties. The hub radius and visiting probability influence the disease transmission in that the larger size of hub radius and the higher value of visiting probability speed up the outbreak of the disease and escalate the number of infected individuals. Therefore, to control the outbreak of the disease,
INTERNATIONAL JOURNAL OF MATHEMATICS AND COMPUTERS IN SIMULATION
Issue 4, Volume 5, 2011 332
certain actions should be imposed like closing public places such as schools and theaters, and warning risk people to avoid such public places.
ACKNOWLEDGMENT This research was supported by Centre of Excellence in Mathematics,
PERDO, CHE and Faculty of science, Mahidol University, THAILAND.
REFERENCES [1] R. Casagrandi, L. Bolzoni, SA. Levin and V. Andreasen, “The SIRC
model and influenza A,” Math. Biosci., vol. 200, pp. 152–169, 2006. [2] M. De la Sen and S. Alonso-Quesada, “About some properties of some
elementary epidemic models,” in Proceedings of the International Conference on Applied Computer Science, Melta, 2010, pp. 185–191.
[3] O. Diekman and J.A.P. Heesterbeek, Mathematical of Infectious Disease. New York: Wiley, 2000.
[4] O. Diekman, J.A.P. Heesterbeek and J.A.J. Metz, “On the definition and the computation of the basic reproduction ratio R0 in the models for infectious disease in heterogeneous populations,” J Math. Biol. Vol. 28, pp. 365–382, 1990.
[5] A. Flahault, S. Deguen and AJ. Valleron, “A mathematical model for the European spread of influenza,” Eur. J. Epidemiol., vol. 10, pp. 471–474, 1994.
[6] S. Iwami and T. Hara, “Global stability of a generalized epidemic model,” J. Math. Anal. Appl., vol. 362, pp. 286–300, 2010.
[7] W. Jumpen, S. Orankitcharoen, P. Boonkrong, B. Wattananon, B. Wiwatanapataphee, “SIS-SEIQR adaptive network model for pandemic influenza,” in Proceedings of the European Computing Conference (ECC’11), Paris, France, 2011, pp. 147-151.
[8] M.J. Keeling and K.T.D. Eames, “Networks and epidemic models," J. R. Soc. Interface., vol. 2, pp. 295–307, 2005.
[9] K. Li, M. Small, H. Zhange and X. Fu, “Epidemic outbreaks on networks with effective contacts,” Nonlinear Analysis: Real World Applications, vol. 11, pp. 1017–1025, 2010.
[10] A.R. Lucas, “A one-parameter family of stationary solutions in the Susceptible-Infected-Susceptible epidemic model,” J. Math. Anal. Appl., vol. 374, pp. 258–371, 2011.
[11] L.A. Meyers, “Contact network epidemiology: bond percolation applied to infectious disease prediction and control,” Bulletin (New Series) of the AMS., vol. 44, pp. 63–86, 2007.
[12] B.K. Mishra and D.K. Saini, “SEIRS epidemic model with delay for transmission of malicious objects in computer network,” Appl. Math. Comput., vol. 188, pp. 1476–1482, 2007.
[13] S. Mocanu, S. Taralunga, “Immunization strategies for networks with scale-free topology,” in Proc. of the 5th WSEAS Int. Conf. on Non-Linear Analysis, Non-Linear Systems and Chaos, Bucharest, Romania, 2006, pp. 45–50.
[14] R. Pastor-Satorras and A. Vespignani, “Epidemic dynamics and endemic states in complex networks,” Phys. Rev. E., vol. 63, pp. 066117-1–066117-8, 2001.
[15] Y.S. Tsai1, C.Y. Huang, T.H. Wen and C.T. Sun, “A Multilayer epidemiological Model Integrating Daily Commuting Network,” in Proceedings of the 9th WSEAS international conference on System science and simulation in engineering, Iwate, Japan, 2010, pp. 77-83.
[16] P. van den Driesscheand and J. Watmough, “Reproduction numbers and sub-threshold endemic equilibria for compartmental models of disease transmission,” Math. Biosci. Vol. 180, pp. 29–48, 2002.
[17] H. Yuan and G. Chen, “Network virus-epidemic model with the point-to-group information propagation,” Appl. Math. Comput., vol. 206, pp. 357–367, 2008.
INTERNATIONAL JOURNAL OF MATHEMATICS AND COMPUTERS IN SIMULATION
Issue 4, Volume 5, 2011 333