sei global investments fund plc unaudited ... global investments fund plc unaudited condensed...
TRANSCRIPT

SEI GLOBAL INVESTMENTS FUND PLC
Unaudited Condensed Financial Statements for the financial half year ended 31 December 2017

SEI Global Investments Fund plc Unaudited Condensed Financial Statements for the half year ended 31 December 2017
CONTENTS PAGE Directory 3 General Information 4 Investment Adviser’s Report The SEI Global Select Equity Fund 6 Portfolio of Investments The SEI Global Select Equity Fund 9 Condensed Income Statement 33 Condensed Statement of Financial Position 34 Condensed Statement of Changes in Net Assets Attributable to Redeemable Participating Shareholders 36 Notes to the Condensed Financial Statements 38 Appendix I – Remuneration Disclosures 46 Appendix II – Statement of Changes in Composition of Portfolio 47 Appendix III – Securities Financing Transactions Regulation 48
2

SEI Global Investments Fund plc Unaudited Condensed Financial Statements for the half year ended 31 December 2017 DIRECTORY
Board of Directors at 31 December 2017
Michael Jackson (Chairman) (Irish)
Kevin Barr (American) Robert A. Nesher (American) Desmond Murray* (Irish) Jeffrey Klauder (American)
*Director, independent of the Investment Adviser Manager SEI Investments Global, Limited 2nd Floor Styne House Upper Hatch Street Dublin 2 Ireland Investment Adviser SEI Investments Management Corporation 1 Freedom Valley Drive Oaks, Pennsylvania 19456 U.S.A. Depositary Brown Brothers Harriman Trustee Services (Ireland) Limited 30 Herbert Street Dublin 2 Ireland Administrator SEI Investments – Global Fund Services Limited 2nd Floor Styne House Upper Hatch Street Dublin 2 Ireland Distributor SEI Investments (Europe) Limited 1st Floor Alphabeta 14-18 Finsbury Square London EC2A 1BR England Independent Auditors PricewaterhouseCoopers One Spencer Dock North Wall Quay Dublin 1 Ireland Legal Advisers as to Irish Law Matheson 70 Sir John Rogerson’s Quay Dublin 2 Ireland Company Secretary Matsack Trust Limited 70 Sir John Rogerson’s Quay Dublin 2 Ireland Registered Office 2nd Floor Styne House Upper Hatch Street Dublin 2 Ireland
CRO Number 343752
3

SEI Global Investments Fund plc Unaudited Condensed Financial Statements for the half year ended 31 December 2017
GENERAL INFORMATION Structure The following information is derived from and should be read in conjunction with the full text and definitions section of the Prospectus. SEI Global Investments Fund plc (the “Company”) was incorporated on 30 May 2001 and is an umbrella fund established as an open-ended investment company with variable capital under the laws of Ireland as a public limited company pursuant to the Companies Act 2014 (as amended). It operates pursuant to the European Communities (Undertaking for Collective Investment in Transferable Securities) Regulation, 2011 (as amended) (the “UCITS Regulations”). Its share capital is divided into a number of classes, each representing interests in a fund, except for the Subscriber Shares that will not entitle the holders to participate in the assets of any fund. At 31 December 2017, the Company comprised of one separate portfolio of investment (“Fund”), which is represented by a separate series of Redeemable Participating Shares. This Fund is The SEI Global Select Equity Fund. As the Company is availing of the provisions of the Companies Act 2014 (as amended), the Fund has segregated liability from any other Fund and the Company is not liable as a whole to third parties for the liability of each Fund. A copy of the Prospectus, Addendum and Key Investor Information Document (“KIID”) can be obtained by contacting the Administrator at its registered office. Distribution Policy The Articles of Association empower the Company in General Meetings to declare dividends in respect of any Shares provided that no dividend shall exceed the amount recommended by the Directors. The Articles of Association also empower the Directors to declare interim dividends. The Directors have determined to reinvest all net income and net realised capital gains of the Company attributable to the Accumulating Class Shares. Accordingly, no dividends will be paid in respect of such Shares and all net income and net realised capital gains of the Company attributable to such Shares will be reflected in the Net Asset Value per Share of those Shares. The U.S.$ Institutional Class, Sterling Institutional Class, Hedged Euro Institutional Class, U.S.$ Institutional C Class, Euro Institutional Class, Hedged Sterling Institutional Class and Hedged U.S.$ Institutional Class are designated as accumulating Share Classes. The Directors expect that all or substantially all of the net investment income of the relevant Funds attributable to the Sterling Institutional Distributing Class will be calculated as of the last Dealing Day of each calendar quarter and declared as a dividend to eligible Shareholders on the Fund’s register of Shareholders on the Record Date. Any such dividend will be distributed to the relevant Shareholders normally within ten Dealing Days from the last calendar Dealing Day of the relevant calendar quarter. The Articles of Association empower the Directors to declare dividends in respect of any Shares out of net income (including interest income) and the excess of realised and unrealised capital gains over realised and unrealised losses in respect of investments of the Company. Net realised and unrealised capital gains of the relevant Funds attributable to the Distributing Class Shares are expected to be retained by the relevant Fund which will result in an increase in the Net Asset Value per Share. The Directors, nevertheless, reserve the right to declare dividends in respect of such realised and unrealised capital gains less realised and unrealised capital losses at their sole discretion. The Directors may from time to time, and in their sole discretion, determine that the Company shall, on behalf of one or more Funds, apply an equalisation formula in respect to any Distributing Class Shares for any period in which it is expected that significant subscriptions or redemptions of Shares in the relevant Fund during that period might have a significant impact on the net investment income of the relevant Fund which could otherwise be available for distribution on the last Dealing Day of the relevant period. Prices There is currently a single price for buying and selling Shares in the Company and/or switching Shares between Funds. This is represented by the Net Asset Value per Share. The Company reserves the right to impose, or to authorise the Manager to impose a redemption charge on the redemption of Shares to a maximum of 3% of the Net Asset Value of the Shares to be redeemed in circumstances where the value of the Shares being redeemed equals 5% or more of the Net Asset Value of the relevant Fund, or where the value of the Shares being redeemed on a Dealing Day, when aggregated with the value of any Shares redeemed by the Shareholder from the same Fund within the prior two month period from the relevant Dealing Day equals 5% or more of the Net Asset Value of the relevant Fund of the Company. The Company reserves the right to impose, or to authorise the Manager to impose a sales charge and a switching charge in such an amount as may be specified in the Prospectus.
During the financial half year ended 31 December 2017 (referred to herein as the “half year end”, “half year ended”, “period end” or “period ended”) and year ended 30 June 2017, no charges have been imposed on subscription monies, the redemption of Shares or Shares acquired as a result of switching between Funds. Minimum Subscription The minimum initial subscription to the Company in respect of any Fund or Share Class will be specified in the Prospectus and may be varied or waived by the Directors at their absolute discretion.
4

SEI Global Investments Fund plc Unaudited Condensed Financial Statements for the half year ended 31 December 2017
GENERAL INFORMATION (continued) Dealing A Dealing Day is in the case of The SEI Global Select Equity Fund every Business Day on which the New York Stock Exchange is open for business except 24 December. A Business Day is defined as any day on which banks in Dublin or London are open for normal banking business, excluding Saturdays and Sundays and such other day or days as may be determined by the Directors. If the aggregate redemption requests on any Dealing Day equal or exceed 10% or more of the outstanding Shares of any Series in issue or deemed to be in issue, the Directors may elect to restrict the total number of Shares to be redeemed to 10% of the outstanding Shares in issue in that Series on that Dealing Day, in which case all redemption requests will be reduced pro rata to the size of the request. The balance of the Shares in respect of which redemption requests have been received shall be redeemed on the next succeeding Dealing Day, subject to the same 10% restriction, and in priority to redemption requests received in respect of the next Dealing Day.
5

SEI Global Investments Fund plc Unaudited Condensed Financial Statements for the half year ended 31 December 2017 THE SEI GLOBAL SELECT EQUITY FUND – INVESTMENT ADVISER’S REPORT
The SEI Global Select Equity Fund is comprised of eight classes of Shares. The Fund was launched on 06 August 2008. The functional currency of The SEI Global Select Equity Fund is US Dollar (US$).
Objective
The investment objective of The SEI Global Select Equity Fund is capital appreciation through investment in equity markets globally.
Investment Approach Statement
The Fund uses a multi-manager approach, relying on a number of sub-advisers with differing investment approaches to manage portions of the Fund’s portfolio, under the general supervision of SEI Investments Management Corporation (SIMC). The Fund utilised the following sub-advisers as of 31 December 2017:
AS Trigon Asset Management INTECH Investment Management LLC Jackson Square Partners, LLC Jupiter Asset Management Ltd Lazard Asset Management LLC LSV Asset Management* Metropole Gestion Rhicon Currency Management Towle & Co
*LSV Asset Management is a partially-owned indirect subsidiary of SEI Investments Company. For this service, LSV Asset Management is entitled to receive a fee from SIMC.
The following manager was hired during the period:
Lazard Asset Management LLC (October 2017)
The following manager was terminated during the period:
Ardevora Asset Management LLP (October 2017)
Fund Attribution
Beta:
The six-month period ending 31 December 2017 was a strong period for global equity markets, as equities posted positive returns in all six months. A strong corporate earnings season, continued economic growth, hawkish tones from the Federal Reserve and US tax reform were the main economic themes that drove markets over the six-month period. In the “risk-on” environment, high-volatility sectors, particularly information technology, financials, consumer discretionary, energy and materials rallied and outpaced their defensive bond-proxy peers, namely healthcare, utilities, consumer staples and telecommunications. High-risk equities were synonymous with value stocks, which outperformed the broad market and rebounded from the preceding reversal of the “Trumpflation” bounce. Momentum stocks, particularly those enjoying positive earnings upgrades, benefitted from persistent trends in sectors such as information technology, industrials and materials. Semiconductors were the highest-momentum industry and were the top performer during the period. Stability-alpha source results were mixed as the “risk-on” rally, amid an improving US economy and rising bond yields, hampered low-volatility stocks throughout the period, whereas high-quality companies with solid balance sheets and cash flows did well and outperformed the market.
Alpha:
The Fund outperformed its benchmark, the MSCI World Index (Net) (USD), during the period. Our tactical positioning to overweight value and momentum at the expense of rich low-volatility stocks provided the Fund with a tailwind during the six-month period.
At the sector level, this translated into an overweight to more cyclical and cheap areas of the market, such as materials, industrials and consumer discretionary, and underweights to more interest-rate sensitive and highly-valued areas, particularly consumer staples and healthcare.
Managers:
LSV, Jupiter, and Trigon’s focus on value helped each of them outperform over the last six months. Value rallied, as market sentiment turned favourable, the economy continued growing and US tax cuts were successfully implemented. The results were particularly strong for our US Value managers, but the theme was transferred to all corners of the world. Metropole was the only exception and did not participate in the value rally due to poor selection effects in consumer discretionary, healthcare and financials.
Jackson Square’s strategic growth-oriented style paid off well. Its focus on information technology explained most of its outperformance, in a period when the high-momentum information technology sector rallied the most.
Intech, the Fund’s momentum-oriented manager, underperformed as momentum experienced significant drawdowns in the first six months.
Our momentum-oriented manager, Intech, benefitted from the established trends during the first three months of the period. Their performance reversed in the last three months due to negative selection effects in information technology and overweights to low-beta stocks. Nonetheless, the net effect was positive for the whole six-month period. Our newly-introduced momentum manager, Lazard, had a neutral effect on performance.
6

SEI Global Investments Fund plc Unaudited Condensed Financial Statements for the half year ended 31 December 2017 THE SEI GLOBAL SELECT EQUITY FUND – INVESTMENT ADVISER’S REPORT (continued) Fund Attribution (continued) Managers: (continued) Ardevora outperformed and benefitted from its process of favouring companies with strong earnings upgrades before its termination from the Fund due to the expectation that its replacement, Lazard, should provide a stronger exposure to the momentum alpha source. Market volatility, including foreign-currency volatility, continued to decline and resulted in a tough environment for the volatility-oriented Rhicon. Still, the manager’s performance was fully within the Fund’s expectations given the current market conditions. Derivatives: The Fund used derivatives in order to equitise cash and to market-neutralise its country exposure. This is done through the use of index and currency futures at the Fund level.
January 2018
7

SEI Global Investments Fund plc Unaudited Condensed Financial Statements for the half year ended 31 December 2017 INVESTMENT ADVISER’S REPORT (continued)
Important Information: The opinions and views contained in this document are solely those of SEI and are subject to change; descriptions relating to organizational structure, teams and investment processes herein may differ significantly from those prescribed by underlying managers regarding their own investment houses and investments. Past performance is not a guarantee of future performance. Investment in the range of SEI’s Funds is intended as a long-term investment. The value of an investment and any income from it can go down as well as up. Investors may not get back the original amount invested. Additionally, this investment may not be suitable for everyone. If you should have any doubt whether it is suitable for you, you should obtain expert advice. No offer of any security is made hereby. Recipients of this information who intend to apply for Shares in any SEI Fund are reminded that any such application may be made solely on the basis of the information contained in the Prospectus and the most recent Key Investor Information Document (“KIID”). This material represents an assessment of the market environment at a specific point in time and is not intended to be a forecast of future events, or a guarantee of future results. This information should not be relied upon by the reader as research or investment advice regarding the Funds or any stock in particular, nor should it be construed as a recommendation to purchase or sell a security, including futures contracts. If the investment is withdrawn in the early years it may not return the full amount invested. In addition to the normal risks associated with equity investing, international investments may involve risk of capital loss from unfavourable fluctuation in currency values, from differences in generally accepted accounting principles or from economic or political instability in other nations. Narrowly focused investments and smaller companies typically exhibit higher volatility. Products of companies in which technology funds invest may be subject to severe competition and rapid obsolescence. SEI Funds may use derivative instruments such as futures, forward currency contracts, options, swaps, contracts for differences, credit derivatives, caps and floors. These instruments may be used for hedging purposes and/or investment purposes. While considerable care has been taken to ensure the information contained within this document is accurate and up-to-date, no warranty is given as to the accuracy or completeness of any information and no liability is accepted for any errors or omissions in such information or any action taken on the basis of this information. This information is issued by SEI Investments (Europe) Limited, 4th Floor, Time & Life Building, 1 Bruton Street, London W1J 6TL which is authorised and regulated by the Financial Services Authority. Please refer to our latest Full Prospectus (which includes information in relation to the use of derivatives and the risks associated with the use of derivative instruments), Key Investor Information Document (“KIID”) and latest Annual or Interim Short Reports for more information on our Funds. This information can be obtained by contacting your Financial Adviser or using the contact details shown above.
8

SEI Global Investments Fund plc
Unaudited Condensed Financial Statements for the half year ended 31 December 2017
THE SEI GLOBAL SELECT EQUITY FUND
PORTFOLIO OF INVESTMENTS AS AT 31 DECEMBER 2017
Nominal Security
Currency
Code Value US$ Fund %
EQUITIES
Argentina - 0.02% (30 June 2017: 0.00%)
1,400 MERCADOLIBRE INC* USD 440,524 0.02%
Australia - 0.74% (30 June 2017: 0.60%)
69,873 AGL ENERGY LTD* AUD 1,331,302 0.07% 65,523 ARISTOCRAT LEISURE LTD* AUD 1,214,597 0.07%
16,968 BHP BILLITON LTD* AUD 392,439 0.02%
35,924 CARSALES.COM LTD* AUD 407,139 0.02% 7,185 CHALLENGER LTD/AUSTRALIA* AUD 78,845 0.00%
2,360 COCHLEAR LTD* AUD 316,069 0.02%
2,404 CSL LTD* AUD 265,685 0.01% 64,036 IOOF HOLDINGS LTD* AUD 536,919 0.03%
26,845 LENDLEASE GROUP* AUD 343,298 0.02%
17,536 MONADELPHOUS GROUP LTD* AUD 238,243 0.01% 19,671 NEWCREST MINING LTD* AUD 351,101 0.02%
91,843 NIB HOLDINGS LTD/AUSTRALIA* AUD 485,605 0.03%
20,748 ORICA LTD* AUD 293,728 0.02% 72,075 ORORA LTD* AUD 191,106 0.01%
67,205 PLATINUM ASSET MANAGEMENT LTD* AUD 405,271 0.02%
4,899 REA GROUP LTD* AUD 293,704 0.02% 1,647,192 SOUTH32 LTD* GBP 4,517,754 0.25%
100,436 SYDNEY AIRPORT* AUD 553,820 0.03%
69,398 TRANSURBAN GROUP* AUD 674,696 0.04% 5,626 TRANSURBAN GROUP RIGHTS* AUD 4,466 0.00%
43,401 TREASURY WINE ESTATES LTD* AUD 541,780 0.03%
Austria - 0.19% (30 June 2017: 0.06%)
2,222 AMS AG* CHF 201,679 0.01% 19,058 ERSTE GROUP BANK AG* EUR 826,257 0.05%
460,000 IMMOFINANZ AG* EUR 1,185,934 0.07%
16,833 OMV AG* EUR 1,067,856 0.06%
Belgium - 0.05% (30 June 2017: 0.10%)
9,281 CELYAD SA* EUR 385,715 0.02% 5,789 KBC GROUP NV* EUR 494,316 0.03%
Bermuda - 0.24% (30 June 2017: 0.59%) 9,100 ARCH CAPITAL GROUP LTD* USD 826,007 0.05%
19,677 AXIS CAPITAL HOLDINGS LTD* USD 988,966 0.06%
8,288 EVEREST RE GROUP LTD* USD 1,833,743 0.10% 4,681 TRITON INTERNATIONAL LTD/BERMUDA* USD 175,303 0.01%
7,600 XL GROUP LTD* USD 267,216 0.02%
Canada - 1.06% (30 June 2017: 0.55%)
5,600 BARRICK GOLD CORP* CAD 81,255 0.00%
8,759 BRP INC/CA* CAD 325,138 0.02% 1,900 CAE INC* CAD 35,408 0.00%
16,400 CANADIAN NATIONAL RAILWAY CO* CAD 1,356,686 0.08%
14,600 CANADIAN UTILITIES LTD CLASS A* CAD 435,920 0.02% 9,180 CANFOR CORP* CAD 181,556 0.01%
500 CONSTELLATION SOFTWARE INC/CANADA* CAD 304,090 0.02%
3,696 DOLLARAMA INC* CAD 463,272 0.03% 6,900 FORTIS INC/CANADA* CAD 253,928 0.01%
20,500 FRANCO-NEVADA CORP* CAD 1,643,665 0.09%
29,361 GENWORTH MI CANADA INC* CAD 1,019,357 0.06% 8,900 GILDAN ACTIVEWEAR INC CLASS A* CAD 288,462 0.02%
19,608 HUSKY ENERGY INC* CAD 277,778 0.02%
2,300 INTACT FINANCIAL CORP CLASS COMMON S* CAD 192,727 0.01% 102,700 KINROSS GOLD CORP* CAD 444,259 0.02%
9,150 LAURENTIAN BANK OF CANADA* CAD 412,825 0.02%
34,464 NORBORD INC* CAD 1,170,392 0.07% 7,500 ONEX CORP* CAD 551,838 0.03%
21,353 PRAIRIESKY ROYALTY LTD* CAD 546,372 0.03%
9

SEI Global Investments Fund plc
Unaudited Condensed Financial Statements for the half year ended 31 December 2017
THE SEI GLOBAL SELECT EQUITY FUND
PORTFOLIO OF INVESTMENTS AS AT 31 DECEMBER 2017 (continued)
Nominal Security
Currency
Code Value US$ Fund %
Canada - 1.06% (30 June 2017: 0.55%) (continued) 7,200 RESTAURANT BRANDS INTERNATIONAL INC* CAD 444,027 0.02%
23,600 ROGERS COMMUNICATIONS INC CLASS B* CAD 1,206,417 0.07% 10,776 SHOPIFY INC - CLASS A* CAD 1,093,210 0.06%
8,600 STARS GROUP INC* CAD 200,766 0.01%
38,019 SUNCOR ENERGY INC* CAD 1,400,357 0.08% 29,407 TORONTO-DOMINION BANK* CAD 1,728,581 0.10%
53,126 TRICAN WELL SERVICE LTD* CAD 172,995 0.01%
29,432 WASTE CONNECTIONS INC* USD 2,087,906 0.12% 7,300 WEST FRASER TIMBER CO LTD* CAD 451,942 0.03%
Chile - 0.01% (30 June 2017: 0.17%)
17,809 ANTOFAGASTA PLC* GBP 242,116 0.01%
China - 0.05% (30 June 2017: 0.00%) 733,800 YANGZIJIANG SHIPBUILDING HOLDINGS LTD* SGD 807,158 0.05%
Croatia - 0.11% (30 June 2017: 0.06%) 9,072 ADRIS GRUPA DD PFD* HRK 627,775 0.04%
43,500 HRVATSKI TELEKOM DD* HRK 1,160,561 0.07%
1,700 LEDO DD* HRK 78,700 0.00%
Czech Republic - 0.12% (30 June 2017: 0.24%)
49,786 KOMERCNI BANKA A/S* CZK 2,142,718 0.12%
Denmark - 0.83% (30 June 2017: 0.81%)
85,600 CARLSBERG A/S CLASS B* DKK 10,285,184 0.58% 9,241 CHR HANSEN HOLDING A/S* DKK 867,406 0.05%
12,836 DANSKE BANK A/S* DKK 500,158 0.03%
13,518 DSV A/S* DKK 1,065,237 0.06% 9,693 H LUNDBECK A/S* DKK 492,435 0.03%
12,522 ORSTED A/S 144A* DKK 684,021 0.04%
15,484 TOPDANMARK A/S* DKK 669,515 0.04% 1,099 VESTAS WIND SYSTEMS A/S* DKK 76,003 0.00%
Estonia - 0.21% (30 June 2017: 0.19%) 878,451 OLYMPIC ENTERTAINMENT GROUP A/S* EUR 1,909,268 0.11%
1,144,277 TALLINK GROUP A/S* EUR 1,717,560 0.10%
Finland - 0.06% (30 June 2017: 0.08%)
16,013 ELISA OYJ* EUR 629,154 0.04%
25,006 FINNAIR OYJ* EUR 384,949 0.02% 1,093 WARTSILA OYJ ABP* EUR 69,036 0.00%
France - 7.19% (30 June 2017: 5.84%) 3,167 AEROPORTS DE PARIS* EUR 602,765 0.03%
70,156 ATOS SE* EUR 10,222,910 0.57%
125,146 BNP PARIBAS SA* EUR 9,354,638 0.53% 108,484 CAPGEMINI SE* EUR 12,882,114 0.72%
294,940 CARREFOUR SA* EUR 6,389,113 0.36%
113,535 CIE DE SAINT-GOBAIN* EUR 6,268,576 0.35% 67,802 CIE GENERALE DES ETABLISSEMENTS MICHELIN CLASS B* EUR 9,733,395 0.55%
3,010 CNP ASSURANCES* EUR 69,595 0.00% 13,679 CREDIT AGRICOLE SA* EUR 226,675 0.01%
225 DASSAULT AVIATION SA* EUR 350,667 0.02%
3,050 EIFFAGE SA* EUR 334,527 0.02% 5,209 EURAZEO SA* EUR 481,632 0.03%
21,438 EUTELSAT COMMUNICATIONS SA* EUR 496,706 0.03%
3,718 HERMES INTERNATIONAL* EUR 1,992,316 0.11% 1,418 ILIAD SA* EUR 340,121 0.02%
4,616 IPSEN SA* EUR 551,906 0.03%
8,661 KERING* EUR 4,087,251 0.23% 6,433 LVMH MOET HENNESSY LOUIS VUITTON SE* EUR 1,895,653 0.11%
508,517 ORANGE SA* EUR 8,838,827 0.50%
135,910 PUBLICIS GROUPE SA* EUR 9,245,295 0.52% 3,477 SAFRAN SA* EUR 358,690 0.02%
128,824 SANOFI* EUR 11,114,634 0.63%
10

SEI Global Investments Fund plc
Unaudited Condensed Financial Statements for the half year ended 31 December 2017
THE SEI GLOBAL SELECT EQUITY FUND
PORTFOLIO OF INVESTMENTS AS AT 31 DECEMBER 2017 (continued)
Nominal Security
Currency
Code Value US$ Fund %
France - 7.19% (30 June 2017: 5.84%) (continued) 57,734 SCHNEIDER ELECTRIC SE* EUR 4,912,478 0.28%
2,331 SEB SA* EUR 432,316 0.02% 84,753 SOCIETE GENERALE SA* EUR 4,381,249 0.25%
936 THALES SA* EUR 101,021 0.01%
237,308 TOTAL SA* EUR 13,120,950 0.74% 345,435 VEOLIA ENVIRONNEMENT SA* EUR 8,824,834 0.50%
357 WENDEL SA* EUR 61,902 0.00%
Germany - 1.81% (30 June 2017: 3.60%)
17,116 ADIDAS AG* EUR 3,435,416 0.19%
24,690 AIXTRON SE* EUR 343,321 0.02%
3,580 BASF SE* EUR 394,378 0.02%
86,448 BAYERISCHE MOTOREN WERKE AG* EUR 9,013,527 0.51%
443 COVESTRO AG 144A* EUR 45,764 0.00% 23,717 DEUTSCHE LUFTHANSA AG* EUR 874,886 0.05%
113,275 E.ON SE* EUR 1,232,483 0.07%
45,987 EVOTEC AG* EUR 745,486 0.04% 5,972 FINTECH GROUP AG* EUR 219,761 0.01%
4,570 FRAPORT AG FRANKFURT AIRPORT SERVICES WORLDWIDE* EUR 504,096 0.03%
2,679 FUCHS PETROLUB SE PFD* EUR 142,350 0.01% 2,684 GRENKE AG* EUR 255,129 0.01%
13,690 HAMBURGER HAFEN UND LOGISTIK AG* EUR 389,110 0.02%
715 HOCHTIEF AG* EUR 126,725 0.01% 17,635 INNOGY SE 144A* EUR 691,929 0.04%
7,278 KION GROUP AG* EUR 629,064 0.04%
5,154 OSRAM LICHT AG* EUR 463,736 0.03% 76,174 RWE AG* EUR 1,554,986 0.09%
3,446 SILTRONIC AG* EUR 501,934 0.03%
35,551 TAG IMMOBILIEN AG* EUR 676,204 0.04% 138,143 TELEFONICA DEUTSCHLAND HOLDING AG* EUR 694,383 0.04%
261,039 THYSSENKRUPP AG* EUR 7,590,318 0.43%
6,399 VONOVIA SE* EUR 318,037 0.02% 6,697 WACKER NEUSON SE* EUR 241,856 0.01%
7,655 WIRECARD AG* EUR 855,511 0.05%
Hong Kong - 0.51% (30 June 2017: 0.28%)
618,500 BOC HONG KONG HOLDINGS LTD* HKD 3,133,128 0.18%
36,000 CK ASSET HOLDINGS LTD* HKD 314,533 0.02% 254,000 GALAXY ENTERTAINMENT GROUP LTD* HKD 2,037,251 0.11%
100,000 HENDERSON LAND DEVELOPMENT CO LTD* HKD 658,795 0.04%
4,900 JARDINE MATHESON HOLDINGS LTD* USD 297,675 0.02% 11,900 JARDINE STRATEGIC HOLDINGS LTD* USD 471,002 0.03%
24,300 MELCO RESORTS & ENTERTAINMENT LTD SPONSORED ADR* USD 705,672 0.04%
86,500 MTR CORP LTD* HKD 506,786 0.03% 99,000 TECHTRONIC INDUSTRIES CO LTD* HKD 645,242 0.04%
Hungary - 0.23% (30 June 2017: 0.14%) 1,020,342 MAGYAR TELEKOM TELECOMMUNICATIONS PLC* HUF 1,808,977 0.10%
202,784 MOL HUNGARIAN OIL & GAS PLC* HUF 2,358,848 0.13%
Ireland - 0.39% (30 June 2017: 0.74%)
203,407 SMURFIT KAPPA GROUP PLC* EUR 6,885,431 0.39%
Israel - 0.12% (30 June 2017: 0.13%)
1,234 AZRIELI GROUP LTD* ILS 69,064 0.00% 14,600 CHECK POINT SOFTWARE TECHNOLOGIES LTD* USD 1,512,852 0.09%
677 ELBIT SYSTEMS LTD* ILS 90,679 0.01%
2,811 SODASTREAM INTERNATIONAL LTD* USD 197,726 0.01% 5,930 TOWER SEMICONDUCTOR LTD* ILS 204,121 0.01%
Italy - 1.95% (30 June 2017: 2.15%) 16,951 ASTM SPA* EUR 493,196 0.03%
41,176 ATLANTIA SPA* EUR 1,301,370 0.07%
116,718 ENEL SPA* EUR 718,995 0.04% 14,412 FERRARI NV* EUR 1,513,404 0.09%
689,849 FINCANTIERI SPA* EUR 1,037,120 0.06%
11

SEI Global Investments Fund plc
Unaudited Condensed Financial Statements for the half year ended 31 December 2017
THE SEI GLOBAL SELECT EQUITY FUND
PORTFOLIO OF INVESTMENTS AS AT 31 DECEMBER 2017 (continued)
Nominal Security
Currency
Code Value US$ Fund %
Italy - 1.95% (30 June 2017: 2.15%) (continued) 3,633,116 INTESA SANPAOLO SPA* EUR 12,084,528 0.68%
20,252 INTESA SANPAOLO SPA - RSP* EUR 64,688 0.00% 215,136 JUVENTUS FOOTBALL CLUB SPA* EUR 197,497 0.01%
55,648 MAIRE TECNIMONT SPA* EUR 288,538 0.02%
11,482 RECORDATI SPA* EUR 510,968 0.03% 6,102,202 TELECOM ITALIA SPA/MILANO* EUR 5,279,481 0.30%
52,349 TERNA RETE ELETTRICA NAZIONALE SPA* EUR 304,497 0.02%
566,149 UNICREDIT SPA* EUR 10,591,774 0.60%
Japan - 2.75% (30 June 2017: 2.90%)
17,700 ALCONIX CORP* JPY 372,541 0.02%
8,400 ANA HOLDINGS INC* JPY 350,913 0.02%
10,700 ASAHI GROUP HOLDINGS LTD* JPY 530,963 0.03%
113,000 ASAHI KASEI CORP* JPY 1,458,016 0.08% 3,700 BANDAI NAMCO HOLDINGS INC* JPY 121,034 0.01%
8,500 BROTHER INDUSTRIES LTD* JPY 209,765 0.01%
8,400 CANON INC* JPY 313,182 0.02% 35,400 COMSYS HOLDINGS CORP* JPY 1,026,019 0.06%
15,000 DAIFUKU CO LTD* JPY 817,577 0.05%
2,500 DAITO TRUST CONSTRUCTION CO LTD* JPY 509,876 0.03% 8,600 DENKA CO LTD* JPY 344,687 0.02%
2,300 DISCO CORP* JPY 511,860 0.03%
2,200 HIKARI TSUSHIN INC* JPY 316,378 0.02% 31,300 HOYA CORP* JPY 1,563,750 0.09%
21,000 KAJIMA CORP* JPY 202,077 0.01%
39,500 KAMIGUMI CO LTD* JPY 874,154 0.05% 67,400 KANSAI ELECTRIC POWER CO INC* JPY 825,672 0.05%
1,900 KEYENCE CORP* JPY 1,064,607 0.06%
88,000 KIRIN HOLDINGS CO LTD* JPY 2,218,944 0.12% 7,100 KONAMI HOLDINGS CORP* JPY 390,768 0.02%
1,400 KOSE CORP* JPY 218,606 0.01%
86,200 LION CORP* JPY 1,633,706 0.09% 69,300 MARUBENI CORP* JPY 502,048 0.03%
7,300 MCDONALD'S HOLDINGS CO JAPAN LTD* JPY 321,096 0.02%
26,600 MINEBEA MITSUMI INC* JPY 557,974 0.03% 22,200 MISUMI GROUP INC* JPY 646,391 0.04%
50,200 MITSUBISHI CHEMICAL HOLDINGS CORP* JPY 551,019 0.03%
3,000 MITSUBISHI GAS CHEMICAL CO INC* JPY 86,152 0.00% 42,700 MITSUBISHI MOTORS CORP* JPY 308,547 0.02%
5,700 MITSUBISHI TANABE PHARMA CORP* JPY 117,997 0.01%
103,400 MITSUBISHI UFJ FINANCIAL GROUP INC* JPY 758,542 0.04% 2,000 MITSUI CHEMICALS INC* JPY 64,359 0.00%
8,900 MITSUI MINING & SMELTING CO LTD* JPY 520,648 0.03%
4,200 MIXI INC* JPY 188,655 0.01% 13,200 NABTESCO CORP* JPY 506,205 0.03%
11,000 NAGASE & CO LTD* JPY 198,420 0.01%
19,000 NEXON CO LTD* JPY 553,218 0.03% 1,400 NIDEC CORP* JPY 196,485 0.01%
4,800 NINTENDO CO LTD* JPY 1,755,100 0.10%
9,200 NIPPON EXPRESS CO LTD* JPY 611,700 0.03% 56,800 NISSAN MOTOR CO LTD* JPY 566,487 0.03%
5,700 NISSHIN OILLIO GROUP LTD* JPY 172,796 0.01% 8,400 NITORI HOLDINGS CO LTD* JPY 1,197,923 0.07%
5,800 NITTO BOSEKI CO LTD* JPY 167,332 0.01%
24,200 NOK CORP* JPY 565,204 0.03% 6,500 OBIC CO LTD* JPY 477,763 0.03%
14,800 ORACLE CORP JAPAN* JPY 1,227,093 0.07%
900 ORIENTAL LAND CO LTD/JAPAN* JPY 82,051 0.00% 5,000 OTSUKA CORP* JPY 383,489 0.02%
6,000 POLA ORBIS HOLDINGS INC* JPY 210,652 0.01%
147,800 RECRUIT HOLDINGS CO LTD* JPY 3,673,680 0.21% 17,500 RENESAS ELECTRONICS CORP* JPY 203,972 0.01%
2,500 RYOHIN KEIKAKU CO LTD* JPY 778,961 0.04%
9,400 SANDEN HOLDINGS CORP* JPY 188,751 0.01% 13,900 SANKYU INC* JPY 600,297 0.03%
18,200 SANTEN PHARMACEUTICAL CO LTD* JPY 286,127 0.02%
12

SEI Global Investments Fund plc
Unaudited Condensed Financial Statements for the half year ended 31 December 2017
THE SEI GLOBAL SELECT EQUITY FUND
PORTFOLIO OF INVESTMENTS AS AT 31 DECEMBER 2017 (continued)
Nominal Security
Currency
Code Value US$ Fund %
Japan - 2.75% (30 June 2017: 2.90%) (continued) 12,700 SEIKO EPSON CORP* JPY 299,772 0.02%
6,000 SHARP CORP/JAPAN* JPY 206,125 0.01% 4,600 SHISEIDO CO LTD* JPY 222,384 0.01%
20,500 SOMPO HOLDINGS INC* JPY 794,159 0.04%
19,100 START TODAY CO LTD* JPY 580,715 0.03% 9,100 SUBARU CORP* JPY 289,439 0.02%
30,200 SUMITOMO CORP* JPY 513,387 0.03%
29,100 SUMITOMO METAL MINING CO LTD* JPY 1,337,593 0.08% 33,400 SUZUKI MOTOR CORP* JPY 1,937,289 0.11%
25,400 TAISEI CORP* JPY 1,264,927 0.07%
15,400 TEIJIN LTD* JPY 343,134 0.02%
10,300 THK CO LTD* JPY 386,764 0.02%
4,100 TOHO ZINC CO LTD* JPY 222,743 0.01%
10,600 TOKYO ELECTRON LTD* JPY 1,919,574 0.11% 32,700 TOSOH CORP* JPY 741,374 0.04%
17,300 TOYOBO CO LTD* JPY 314,364 0.02%
3,200 TOYOTA INDUSTRIES CORP* JPY 205,664 0.01% 3,200 TOYOTA MOTOR CORP* JPY 204,897 0.01%
13,200 YAKULT HONSHA CO LTD* JPY 996,005 0.06%
24,600 YASKAWA ELECTRIC CORP* JPY 1,084,234 0.06%
Jersey - 0.06% (30 June 2017: 0.00%)
7,844 NOVOCURE LTD* USD 158,449 0.01% 8,336 RANDGOLD RESOURCES LTD* GBP 835,590 0.05%
Kazakhstan - 0.07% (30 June 2017: 0.06%) 101,162 KAZMUNAIGAS EXPLORATION PRODUCTION JSC SPONSORED GDR* USD 1,315,106 0.07%
Luxembourg - 0.07% (30 June 2017: 0.00%) 1,209 EUROFINS SCIENTIFIC SE* EUR 736,917 0.04%
6,277 MILLICOM INTERNATIONAL CELLULAR SA* SEK 424,728 0.02%
1,948 STABILUS SA* EUR 175,320 0.01%
Mexico - 0.02% (30 June 2017: 0.00%)
15,949 FRESNILLO PLC* GBP 308,307 0.02%
Netherlands - 1.75% (30 June 2017: 1.24%)
4,089 AMG ADVANCED METALLURGICAL GROUP NV* EUR 205,806 0.01% 5,365 ASML HOLDING NV* EUR 935,099 0.05%
5,814 ASML HOLDING NV CLASS REG* USD 1,010,619 0.06%
144,867 CHICAGO BRIDGE & IRON CO NV CLASS NY* USD 2,338,156 0.13% 14,708 FORFARMERS NV* EUR 184,385 0.01%
9,339 HEINEKEN HOLDING NV* EUR 925,065 0.05%
7,354 HEINEKEN NV* EUR 767,651 0.04% 10,636 ING GROEP NV* EUR 195,726 0.01%
371,217 KONINKLIJKE AHOLD DELHAIZE NV* EUR 8,172,968 0.46%
395,152 ROYAL DUTCH SHELL PLC CLASS A* EUR 13,183,936 0.74% 66,330 WOLTERS KLUWER NV* EUR 3,463,135 0.19%
New Zealand - 0.05% (30 June 2017: 0.01%) 59,937 FISHER & PAYKEL HEALTHCARE CORP LTD* NZD 611,700 0.03%
7,473 MERIDIAN ENERGY LTD* NZD 15,546 0.00% 17,309 XERO LTD* NZD 387,770 0.02%
Norway - 0.10% (30 June 2017: 0.02%) 254,529 DNO ASA* NOK 295,626 0.02%
62,104 NORSK HYDRO ASA* NOK 473,410 0.03%
18,121 SPAREBANK 1 SR-BANK ASA* NOK 192,745 0.01% 31,216 STATOIL ASA* NOK 668,640 0.04%
Poland - 0.75% (30 June 2017: 0.79%) 183,741 AGORA SA* PLN 763,561 0.04%
110,277 ASSECO POLAND SA* PLN 1,395,759 0.08%
108,092 BANK PEKAO SA* PLN 4,028,409 0.23% 692,962 BORYSZEW SA* PLN 1,838,699 0.10%
248,534 GETBACK SA* PLN 1,315,339 0.07%
13

SEI Global Investments Fund plc
Unaudited Condensed Financial Statements for the half year ended 31 December 2017
THE SEI GLOBAL SELECT EQUITY FUND
PORTFOLIO OF INVESTMENTS AS AT 31 DECEMBER 2017 (continued)
Nominal Security
Currency
Code Value US$ Fund %
Poland - 0.75% (30 June 2017: 0.79%) (continued) 1,604,873 MOSTOSTAL ZABRZE SA* PLN 295,591 0.02%
711,085 ORANGE POLSKA SA* PLN 1,184,869 0.07% 179,751 POWSZECHNY ZAKLAD UBEZPIECZEN SA* PLN 2,180,932 0.12%
185,719 TORPOL SA* PLN 422,234 0.02%
Portugal - 0.02% (30 June 2017: 0.00%)
25,196 ALTRI SGPS SA* EUR 156,450 0.01%
5,489 JERONIMO MARTINS SGPS SA* EUR 106,744 0.01%
Romania - 0.82% (30 June 2017: 0.83%)
2,066,684 BRD-GROUPE SOCIETE GENERALE SA* RON 6,857,053 0.39%
33,559,228 OMV PETROM SA* RON 2,468,606 0.14%
354,049 SOCIETATEA NATIONALA DE GAZE NATURALE ROMGAZ SA* RON 2,850,240 0.16%
492,145 SOCIETATEA NATIONALA NUCLEARELECTRICA SA* RON 911,380 0.05% 14,577 TRANSGAZ SA MEDIAS* RON 1,439,704 0.08%
Russia - 0.52% (30 June 2017: 0.27%) 1,215,000 ALROSA PJSC* USD 1,584,117 0.09%
97,020 GLOBALTRANS INVESTMENT PLC SPONSORED GDR* USD 911,018 0.05%
700,232 PROTEK PJSC* USD 1,334,292 0.08% 570,000 SBERBANK OF RUSSIA PJSC* USD 2,229,669 0.13%
5,218,200 SISTEMA PJSC FC* USD 1,095,822 0.06%
2,500,000,000 TGC-1 PJSC CLASS 1* USD 500,000 0.03% 35,727 X5 RETAIL GROUP NV SPONSORED GDR* USD 1,349,409 0.08%
Singapore - 0.10% (30 June 2017: 0.06%) 179,300 BEST WORLD INTERNATIONAL LTD* SGD 177,100 0.01%
61,100 CAPITALAND LTD* SGD 161,391 0.01%
19,500 CITY DEVELOPMENTS LTD* SGD 182,247 0.01% 8,400 DBS GROUP HOLDINGS LTD* SGD 156,196 0.01%
208,200 GENTING SINGAPORE PLC* SGD 204,087 0.01%
9,400 OVERSEA-CHINESE BANKING CORP LTD* SGD 87,149 0.00% 54,200 UOL GROUP LTD* SGD 359,738 0.02%
37,800 VENTURE CORP LTD* SGD 578,993 0.03%
Slovenia - 0.58% (30 June 2017: 0.54%)
59,614 KRKA DD NOVO MESTO* EUR 4,116,108 0.23%
102,392 LUKA KOPER* EUR 3,737,750 0.21% 16,539 TELEKOM SLOVENIJE DD* EUR 1,645,999 0.09%
27,084 ZAVAROVALNICA TRIGLAV DD* EUR 939,899 0.05%
South Korea - 0.11% (30 June 2017: 0.00%)
110,229 KOREA ELECTRIC POWER CORP SPONSORED ADR* USD 1,952,149 0.11%
Spain - 1.51% (30 June 2017: 1.13%)
27,312 ABERTIS INFRAESTRUCTURAS SA* EUR 608,370 0.03%
5,415 AENA SME SA 144A* EUR 1,098,894 0.06% 1,008 AMADEUS IT GROUP SA CLASS A* EUR 72,758 0.00%
486,892 BANCO DE SABADELL SA* EUR 968,197 0.05%
1,389,946 BANCO SANTANDER SA* EUR 9,144,710 0.51% 426,840 CAIXABANK SA* EUR 1,993,305 0.11%
867,428 DISTRIBUIDORA INTERNACIONAL DE ALIMENTACION SA* EUR 4,482,038 0.25% 75,084 ENCE ENERGIA Y CELULOSA SA* EUR 495,885 0.03%
12,384 ENDESA SA* EUR 265,516 0.01%
5,539 GAS NATURAL SDG SA* EUR 128,036 0.01% 29,627 GRIFOLS SA* EUR 868,946 0.05%
106,134 IBERDROLA SA* EUR 823,299 0.05%
644,121 TELEFONICA SA* EUR 6,284,370 0.35%
Sweden - 0.82% (30 June 2017: 1.23%)
253,699 ALFA LAVAL AB* SEK 6,005,115 0.34% 27,760 ELECTROLUX AB SERIES B* SEK 896,118 0.05%
2,860 EVOLUTION GAMING GROUP AB 144A* SEK 202,776 0.01%
8,044 ICA GRUPPEN AB* SEK 292,679 0.02% 9,810 INDUSTRIVARDEN AB CLASS C* SEK 242,629 0.01%
5,705 NOLATO AB CLASS B* SEK 375,572 0.02%
14

SEI Global Investments Fund plc
Unaudited Condensed Financial Statements for the half year ended 31 December 2017
THE SEI GLOBAL SELECT EQUITY FUND
PORTFOLIO OF INVESTMENTS AS AT 31 DECEMBER 2017 (continued)
Nominal Security
Currency
Code Value US$ Fund %
Sweden - 0.82% (30 June 2017: 1.23%) (continued) 61,405 SANDVIK AB* SEK 1,077,728 0.06%
24,569 SWEDBANK AB CLASS A* SEK 593,857 0.03% 547,222 TELEFONAKTIEBOLAGET LM ERICSSON CLASS B* SEK 3,599,130 0.20%
80,057 VOLVO AB CLASS B* SEK 1,493,094 0.08%
Switzerland - 2.44% (30 June 2017: 2.72%)
300,432 ABB LTD* CHF 8,052,619 0.45%
5,895 BALOISE HOLDING AG* CHF 917,672 0.05% 3,749 CIE FINANCIERE RICHEMONT SA* CHF 339,699 0.02%
22,687 COCA-COLA HBC AG* GBP 742,694 0.04%
961 EMS-CHEMIE HOLDING AG* CHF 641,488 0.04%
91,458 GLENCORE PLC* GBP 482,507 0.03%
604 INFICON HOLDING AG* CHF 377,151 0.02%
3,331 JULIUS BAER GROUP LTD* CHF 203,723 0.01% 5,763 KUEHNE + NAGEL INTERNATIONAL AG* CHF 1,020,131 0.06%
11,518 LANDIS+GYR GROUP AG* CHF 917,185 0.05%
4,636 LONZA GROUP AG* CHF 1,252,600 0.07% 9,227 NESTLE SA* CHF 793,456 0.04%
113,569 NOVARTIS AG* CHF 9,602,941 0.54%
41,913 OC OERLIKON CORP AG* CHF 707,510 0.04% 1,502 PARGESA HOLDING SA* CHF 130,240 0.01%
2,093 PARTNERS GROUP HOLDING AG* CHF 1,434,709 0.08%
3,616 ROCHE HOLDING AG* CHF 914,668 0.05% 98 SGS SA* CHF 255,534 0.01%
232 SIKA AG* CHF 1,842,668 0.10%
6,432 SONOVA HOLDING AG* CHF 1,004,567 0.06% 62,609 STMICROELECTRONICS NV* EUR 1,368,668 0.08%
3,268 STRAUMANN HOLDING AG* CHF 2,308,895 0.13%
16,951 SWATCH GROUP AG* CHF 6,912,420 0.39% 3,332 SWISS LIFE HOLDING AG* CHF 1,179,620 0.07%
247 ZURICH INSURANCE GROUP AG* CHF 75,177 0.00%
Turkey - 0.53% (30 June 2017: 0.66%)
1,141,823 KORDSA TEKNIK TEKSTIL A/S* TRY 2,309,785 0.13%
282,024 KOZA ALTIN ISLETMELERI A/S* TRY 2,841,364 0.16% 463,772 LOKMAN HEKIM ENGURUSAG SAGLIK TURIZM EGITIM HIZMETLERI VE
INSAAT TAAHHUT A/S*
TRY 753,464 0.04%
974,531 SELCUK ECZA DEPOSU TICARET VE SANAYI A/S* TRY 925,285 0.05% 348,000 TAV HAVALIMANLARI HOLDING A/S* TRY 2,061,420 0.12%
98,389 ULUSOY ELEKTRIK IMALAT TAAHHUT VE TICARET A/S* TRY 484,212 0.03%
United Kingdom - 8.82% (30 June 2017: 8.09%)
114,701 3I GROUP PLC* GBP 1,417,403 0.08%
226,627 AGGREKO PLC* GBP 2,449,493 0.14% 198,990 ANGLO AMERICAN PLC* GBP 4,170,994 0.23%
5,100 AON PLC* USD 683,400 0.04%
1,500 APTIV PLC* USD 127,245 0.01% 642,847 ASHMORE GROUP PLC* GBP 3,522,796 0.20%
1,956 ASSOCIATED BRITISH FOODS PLC* GBP 74,617 0.00%
42,009 ASTRAZENECA PLC* GBP 2,910,140 0.16% 730,181 AVIVA PLC* GBP 5,002,968 0.28%
38,408 BAE SYSTEMS PLC* GBP 297,710 0.02% 734,051 BALFOUR BEATTY PLC* GBP 2,949,171 0.17%
1,326,598 BARCLAYS PLC* GBP 3,644,741 0.20%
114,379 BARRATT DEVELOPMENTS PLC* GBP 1,001,852 0.06% 13,368 BERKELEY GROUP HOLDINGS PLC* GBP 758,967 0.04%
994,948 BP PLC* GBP 7,035,104 0.40%
28,059 BURBERRY GROUP PLC* GBP 680,186 0.04% 386,924 CAPITA PLC* GBP 2,098,358 0.12%
1,658,247 CENTRICA PLC* GBP 3,079,905 0.17%
455,970 CNH INDUSTRIAL NV* EUR 6,115,898 0.34% 1,033,641 COBHAM PLC* GBP 1,765,999 0.10%
32,435 COCA-COLA EUROPEAN PARTNERS PLC* EUR 1,294,240 0.07%
134,483 COMPASS GROUP PLC* GBP 2,910,750 0.16% 221,100 DAILY MAIL & GENERAL TRUST PLC* GBP 1,784,087 0.10%
5,017 EASYJET PLC* GBP 99,358 0.01%
15

SEI Global Investments Fund plc
Unaudited Condensed Financial Statements for the half year ended 31 December 2017
THE SEI GLOBAL SELECT EQUITY FUND
PORTFOLIO OF INVESTMENTS AS AT 31 DECEMBER 2017 (continued)
Nominal Security
Currency
Code Value US$ Fund %
United Kingdom - 8.82% (30 June 2017: 8.09%) (continued) 230,175 FIAT CHRYSLER AUTOMOBILES NV* USD 4,106,314 0.23%
27,448 FIAT CHRYSLER AUTOMOBILES NV* EUR 491,427 0.03% 1,879,347 FIRSTGROUP PLC* GBP 2,809,226 0.16%
21,144 G4S PLC* GBP 76,369 0.00%
1,103,312 GKN PLC* GBP 4,767,062 0.27% 400,033 GLAXOSMITHKLINE PLC* GBP 7,156,642 0.40%
375,869 HALFORDS GROUP PLC* GBP 1,778,583 0.10%
390,015 HSBC HOLDINGS PLC* GBP 4,046,109 0.23% 98,000 HSBC HOLDINGS PLC HK* HKD 1,002,277 0.06%
17,900 IHS MARKIT LTD* USD 808,185 0.05%
74,068 IMPERIAL BRANDS PLC* GBP 3,172,205 0.18%
7,600 INTERNATIONAL CONSOLIDATED AIRLINES GROUP SA* EUR 66,036 0.00%
15,782 INTERTEK GROUP PLC* GBP 1,108,018 0.06%
1,403,358 LADBROKES CORAL GROUP PLC* GBP 3,453,175 0.19% 10,763 LIBERTY GLOBAL PLC CLASS A* USD 385,730 0.02%
46,845 LIBERTY GLOBAL PLC CLASS C* USD 1,585,249 0.09%
4,746,835 LLOYDS BANKING GROUP PLC* GBP 4,370,324 0.25% 10,306 LONDON STOCK EXCHANGE GROUP PLC* GBP 528,799 0.03%
884,398 MARKS & SPENCER GROUP PLC* GBP 3,766,172 0.21%
1,011,518 PEARSON PLC* GBP 10,070,920 0.57% 39,232 PERSIMMON PLC* GBP 1,453,086 0.08%
731,840 QINETIQ GROUP PLC* GBP 2,287,881 0.13%
55,229 RELX PLC* GBP 1,299,225 0.07% 326,375 RENTOKIL INITIAL PLC* GBP 1,403,982 0.08%
1,105,498 ROYAL BANK OF SCOTLAND GROUP PLC* GBP 4,157,385 0.23%
204,296 SMITHS GROUP PLC* GBP 4,117,786 0.23% 458,782 STANDARD CHARTERED PLC* GBP 4,841,432 0.27%
216,855 TAYLOR WIMPEY PLC* GBP 605,476 0.03%
195,830 TECHNIPFMC PLC* EUR 6,078,692 0.34% 1,735,632 TESCO PLC* GBP 4,912,930 0.28%
493,972 TP ICAP PLC* GBP 3,554,934 0.20%
15,794 UNILEVER NV* EUR 890,522 0.05% 5,841 UNILEVER PLC* GBP 325,973 0.02%
1,982,131 VODAFONE GROUP PLC* GBP 6,301,120 0.35%
187,935 WPP PLC* GBP 3,409,206 0.19%
United States - 40.87% (30 June 2017: 43.38%)
14,309 ABBOTT LABORATORIES* USD 816,615 0.05% 34,066 ABBVIE INC* USD 3,294,535 0.19%
38,574 ACTIVISION BLIZZARD INC* USD 2,442,506 0.14%
19,463 ADAMAS PHARMACEUTICALS INC* USD 659,601 0.04% 37,448 ADIENT PLC* USD 2,947,156 0.17%
4,300 ADOBE SYSTEMS INC* USD 753,532 0.04%
16,437 AETNA INC* USD 2,964,997 0.17% 24,914 AFLAC INC* USD 2,186,954 0.12%
16,677 AGCO CORP* USD 1,191,249 0.07%
1,938 ALBEMARLE CORP* USD 247,851 0.01% 10,115 ALCOA CORP* USD 544,895 0.03%
9,798 ALIGN TECHNOLOGY INC* USD 2,177,018 0.12%
4,849 ALLERGAN PLC* USD 793,184 0.04% 24,500 ALLIANT ENERGY CORP* USD 1,043,945 0.06%
62,973 ALLSTATE CORP* USD 6,593,907 0.37% 115,153 ALLY FINANCIAL INC* USD 3,357,872 0.19%
2,860 ALNYLAM PHARMACEUTICALS INC* USD 363,363 0.02%
1,835 ALPHABET INC CLASS A* USD 1,933,206 0.11% 1,272 ALPHABET INC CLASS C* USD 1,331,053 0.07%
35,951 ALTRIA GROUP INC* USD 2,567,261 0.14%
28,100 AMEREN CORP* USD 1,657,619 0.09% 45,811 AMERICAN AIRLINES GROUP INC* USD 2,383,563 0.13%
112,215 AMERICAN EAGLE OUTFITTERS INC* USD 2,109,639 0.12%
7,000 AMERICAN ELECTRIC POWER CO INC* USD 514,990 0.03% 2,019 AMERICAN EXPRESS CO* USD 200,507 0.01%
33,914 AMERICAN INTERNATIONAL GROUP INC* USD 2,020,572 0.11%
11,253 AMERICAN STATES WATER CO* USD 651,661 0.04% 22,473 AMERIPRISE FINANCIAL INC* USD 3,808,580 0.21%
29,236 AMGEN INC* USD 5,084,116 0.29%
16

SEI Global Investments Fund plc
Unaudited Condensed Financial Statements for the half year ended 31 December 2017
THE SEI GLOBAL SELECT EQUITY FUND
PORTFOLIO OF INVESTMENTS AS AT 31 DECEMBER 2017 (continued)
Nominal Security
Currency
Code Value US$ Fund %
United States - 40.87% (30 June 2017: 43.38%) (continued) 25,300 AMPHENOL CORP CLASS A* USD 2,221,340 0.12%
3,871 ANADARKO PETROLEUM CORP* USD 207,640 0.01% 800 ANDEAVOR* USD 91,472 0.01%
2,800 ANSYS INC* USD 413,252 0.02%
13,589 ANTHEM INC* USD 3,057,722 0.17% 11,156 APPFOLIO INC CLASS A* USD 462,974 0.03%
46,990 APPLE INC* USD 7,952,114 0.45%
140,017 APPLIED MATERIALS INC* USD 7,157,685 0.40% 57,345 ARCBEST CORP* USD 2,050,095 0.12%
36,608 ARCHER-DANIELS-MIDLAND CO* USD 1,467,264 0.08%
8,945 ARISTA NETWORKS INC* USD 2,107,361 0.12%
537,856 ASCENA RETAIL GROUP INC* USD 1,263,962 0.07%
18,824 ASSURANT INC* USD 1,898,259 0.11%
104,690 AT&T INC* USD 4,070,339 0.23% 50,140 ATLAS AIR WORLDWIDE HOLDINGS INC* USD 2,940,710 0.17%
4,900 AVERY DENNISON CORP* USD 562,814 0.03%
13,665 AXOGEN INC* USD 386,720 0.02% 18,966 BAKER HUGHES A GE CO* USD 600,084 0.03%
431,227 BANK OF AMERICA CORP* USD 12,729,813 0.72%
27,400 BAXTER INTERNATIONAL INC* USD 1,771,136 0.10% 855 BECTON DICKINSON AND CO* USD 183,021 0.01%
75,359 BED BATH & BEYOND INC* USD 1,657,138 0.09%
38,148 BEST BUY CO INC* USD 2,612,007 0.15% 26,397 BGC PARTNERS INC CLASS A* USD 398,859 0.02%
12,451 BIOGEN INC* USD 3,966,397 0.22%
23,745 BOEING CO* USD 7,002,737 0.39% 4,118 BRIGHTHOUSE FINANCIAL INC* USD 241,505 0.01%
8,036 BRINK'S CO* USD 632,433 0.04%
1,800 BROADCOM LTD* USD 462,420 0.03% 49,726 CA INC* USD 1,654,894 0.09%
22,779 CABOT CORP* USD 1,402,931 0.08%
23,300 CADENCE DESIGN SYSTEMS INC* USD 974,406 0.05% 26,825 CAESARS ENTERTAINMENT CORP* USD 339,336 0.02%
11,711 CALITHERA BIOSCIENCES INC* USD 97,787 0.01%
37,930 CAPITAL ONE FINANCIAL CORP* USD 3,777,104 0.21% 28,016 CARDINAL HEALTH INC* USD 1,716,514 0.10%
37,200 CARNIVAL CORP* USD 2,468,964 0.14%
22,289 CARNIVAL PLC* GBP 1,475,009 0.08% 9,400 CBOE GLOBAL MARKETS INC* USD 1,171,146 0.07%
17,694 CELANESE CORP CLASS A* USD 1,894,679 0.11%
20,354 CELGENE CORP* USD 2,124,183 0.12% 26,901 CENTENE CORP* USD 2,713,773 0.15%
48,900 CENTERPOINT ENERGY INC* USD 1,386,804 0.08%
12,210 CENTURY ALUMINUM CO* USD 239,804 0.01% 7,600 CERNER CORP* USD 512,164 0.03%
33,883 CHARLES SCHWAB CORP* USD 1,740,589 0.10%
1,903 CHARTER COMMUNICATIONS INC CLASS A* USD 639,332 0.04% 6,483 CHEMOURS CO* USD 324,539 0.02%
56,946 CHEVRON CORP* USD 7,129,116 0.40%
18,032 CIGNA CORP* USD 3,662,110 0.21% 27,253 CIRRUS LOGIC INC* USD 1,413,336 0.08%
339,123 CISCO SYSTEMS INC* USD 12,988,413 0.73% 36,507 CIT GROUP INC* USD 1,797,224 0.10%
136,875 CITIGROUP INC* USD 10,184,843 0.57%
1,200 CITIZENS FINANCIAL GROUP INC* USD 50,376 0.00% 32,954 CME GROUP INC CLASS A* USD 4,812,977 0.27%
16,600 CMS ENERGY CORP CLASS REIT* USD 785,180 0.04%
49,096 CNA FINANCIAL CORP* USD 2,604,517 0.15% 28,871 COCA-COLA CO* USD 1,324,602 0.07%
8,458 COGNEX CORP* USD 517,291 0.03%
58,949 COMCAST CORP CLASS A* USD 2,360,907 0.13% 8,649 COMMERCEHUB INC* USD 178,083 0.01%
17,100 CONSOLIDATED EDISON INC* USD 1,452,645 0.08%
1,200 CONSTELLATION BRANDS INC CLASS A* USD 274,284 0.02% 42,710 CONVERGYS CORP* USD 1,003,680 0.06%
5,800 COOPER COS INC* USD 1,263,704 0.07%
17

SEI Global Investments Fund plc
Unaudited Condensed Financial Statements for the half year ended 31 December 2017
THE SEI GLOBAL SELECT EQUITY FUND
PORTFOLIO OF INVESTMENTS AS AT 31 DECEMBER 2017 (continued)
Nominal Security
Currency
Code Value US$ Fund %
United States - 40.87% (30 June 2017: 43.38%) (continued) 10,173 CORCEPT THERAPEUTICS INC* USD 183,724 0.01%
138,696 CORNING INC* USD 4,436,898 0.25% 2,500 COSTAR GROUP INC* USD 742,375 0.04%
80,800 CSX CORP* USD 4,444,808 0.25%
10,322 CUMMINS INC* USD 1,823,195 0.10% 4,881 CUTERA INC* USD 221,353 0.01%
11,970 CVR ENERGY INC* USD 445,763 0.03%
1,200 DARDEN RESTAURANTS INC* USD 115,224 0.01% 61,980 DEAN FOODS CO* USD 716,489 0.04%
26,429 DELL TECHNOLOGIES INC CLASS V* USD 2,148,149 0.12%
53,641 DELTA AIR LINES INC* USD 3,003,921 0.17%
18,406 DELUXE CORP* USD 1,414,308 0.08%
23,036 DENTSPLY SIRONA INC* USD 1,516,436 0.09%
17,948 DILLARD'S INC CLASS A* USD 1,077,794 0.06% 58,878 DISCOVER FINANCIAL SERVICES* USD 4,528,932 0.25%
12,592 DOLLAR GENERAL CORP* USD 1,171,203 0.07%
3,260 DOLLAR TREE INC* USD 349,831 0.02% 12,400 DOMINION ENERGY INC* USD 1,005,144 0.06%
5,639 DOMINO'S PIZZA INC* USD 1,065,603 0.06%
28,016 DOMTAR CORP* USD 1,387,331 0.08% 21,200 DTE ENERGY CO* USD 2,320,552 0.13%
11,150 DXC TECHNOLOGY CO* USD 1,058,154 0.06%
10,702 DYNAVAX TECHNOLOGIES CORP* USD 200,127 0.01% 6,835 EAGLE BANCORP INC* USD 395,747 0.02%
40,778 EASTMAN CHEMICAL CO* USD 3,777,643 0.21%
45,898 EBAY INC* USD 1,732,177 0.10% 26,599 EDISON INTERNATIONAL* USD 1,682,121 0.09%
20,667 ELECTRO SCIENTIFIC INDUSTRIES INC* USD 442,894 0.02%
16,176 ELECTRONIC ARTS INC* USD 1,699,434 0.10% 7,047 ENANTA PHARMACEUTICALS INC* USD 413,518 0.02%
37,778 ENTERGY CORP* USD 3,074,736 0.17%
3,506 ENVESTNET INC* USD 174,774 0.01% 8,023 EOG RESOURCES INC* USD 865,762 0.05%
20,999 ESSENDANT INC* USD 194,660 0.01%
21,486 ESTEE LAUDER COS INC CLASS A* USD 2,733,879 0.15% 41,497 EVERSOURCE ENERGY* USD 2,621,780 0.15%
119,587 EXELON CORP* USD 4,712,938 0.27%
2,300 EXPEDIA INC* USD 275,471 0.02% 1,300 EXPEDITORS INTERNATIONAL OF WASHINGTON INC* USD 84,097 0.00%
51,353 EXPRESS SCRIPTS HOLDING CO* USD 3,833,019 0.22%
6,190 EXTERRAN CORP* USD 194,614 0.01% 78,962 EXXON MOBIL CORP* USD 6,604,402 0.37%
21,239 FACEBOOK INC CLASS A* USD 3,747,876 0.21%
4,876 FB FINANCIAL CORP* USD 204,743 0.01% 16,131 FEDEX CORP* USD 4,025,262 0.23%
4,914 FIBROGEN INC* USD 232,924 0.01%
107,080 FIFTH THIRD BANCORP* USD 3,248,792 0.18% 6,988 FIRST REPUBLIC BANK/CA* USD 605,440 0.03%
137,078 FIRSTENERGY CORP* USD 4,197,330 0.24%
4,600 FISERV INC* USD 603,198 0.03% 151,709 FLEX LTD* USD 2,729,244 0.15%
7,400 FMC CORP* USD 700,484 0.04% 26,900 FNF GROUP* USD 1,055,556 0.06%
332,014 FORD MOTOR CO* USD 4,146,851 0.23%
1,300 FORTIVE CORP* USD 94,055 0.01% 6,236 FOX FACTORY HOLDING CORP* USD 242,269 0.01%
53,722 FRANKLIN RESOURCES INC* USD 2,327,774 0.13%
159,519 GAMESTOP CORP CLASS A* USD 2,863,360 0.16% 20,135 GANNETT CO INC* USD 233,360 0.01%
19,729 GAP INC* USD 671,970 0.04%
8,500 GARTNER INC* USD 1,046,775 0.06% 102,858 GENERAL CABLE CORP* USD 3,044,597 0.17%
32,304 GENERAL DYNAMICS CORP* USD 6,572,249 0.37%
93,392 GENERAL MOTORS CO* USD 3,828,123 0.22% 7,014 G-III APPAREL GROUP LTD* USD 258,746 0.01%
45,005 GILEAD SCIENCES INC* USD 3,224,172 0.18%
18

SEI Global Investments Fund plc
Unaudited Condensed Financial Statements for the half year ended 31 December 2017
THE SEI GLOBAL SELECT EQUITY FUND
PORTFOLIO OF INVESTMENTS AS AT 31 DECEMBER 2017 (continued)
Nominal Security
Currency
Code Value US$ Fund %
United States - 40.87% (30 June 2017: 43.38%) (continued) 5,385 GMS INC* USD 202,691 0.01%
7,983 GOLDMAN SACHS GROUP INC* USD 2,033,663 0.11% 178,676 GOODYEAR TIRE & RUBBER CO* USD 5,773,026 0.32%
9,190 GRAND CANYON EDUCATION INC* USD 822,781 0.05%
11,555 GREEN DOT CORP CLASS A* USD 696,304 0.04% 25,252 GROUP 1 AUTOMOTIVE INC* USD 1,792,118 0.10%
20,200 HANESBRANDS INC* USD 422,382 0.02%
36,100 HARLEY-DAVIDSON INC* USD 1,836,764 0.10% 6,900 HARRIS CORP* USD 977,385 0.05%
21,257 HARSCO CORP* USD 396,443 0.02%
48,099 HARTFORD FINANCIAL SERVICES GROUP INC* USD 2,707,031 0.15%
34,422 HCA HEALTHCARE INC* USD 3,023,632 0.17%
5,087 HEICO CORP* USD 479,958 0.03%
105,249 HEWLETT PACKARD ENTERPRISE CO* USD 1,511,377 0.09% 23,100 HOME DEPOT INC* USD 4,378,143 0.25%
101,080 HP INC* USD 2,123,687 0.12%
4,100 HUMANA INC* USD 1,017,087 0.06% 5,309 HUNTINGTON INGALLS INDUSTRIES INC* USD 1,251,331 0.07%
99,961 HUNTSMAN CORP* USD 3,327,709 0.19%
4,200 IDEXX LABORATORIES INC* USD 656,796 0.04% 1,800 ILLINOIS TOOL WORKS INC* USD 300,330 0.02%
2,857 ILLUMINA INC* USD 624,151 0.04%
33,918 IMMUNOGEN INC* USD 217,414 0.01% 15,659 INDEPENDENT BANK CORP/MI* USD 349,979 0.02%
7,627 INGREDION INC* USD 1,066,219 0.06%
196,558 INTEL CORP* USD 9,073,132 0.51% 29,670 INTERCONTINENTAL EXCHANGE INC* USD 2,093,481 0.12%
14,440 INTERNATIONAL BUSINESS MACHINES CORP* USD 2,215,380 0.12%
35,998 INTERNATIONAL PAPER CO* USD 2,085,738 0.12% 9,000 INTUITIVE SURGICAL INC* USD 3,284,460 0.18%
11,800 INVESTMENT TECHNOLOGY GROUP INC* USD 227,150 0.01%
2,232 IPG PHOTONICS CORP* USD 477,938 0.03% 17,330 IQVIA HOLDINGS INC* USD 1,696,576 0.10%
19,163 JAGGED PEAK ENERGY INC* USD 302,392 0.02%
48,048 JOHNSON & JOHNSON* USD 6,713,336 0.38% 124,438 JPMORGAN CHASE & CO* USD 13,307,352 0.75%
68,641 JUNIPER NETWORKS INC* USD 1,956,260 0.11%
2,359 KADANT INC* USD 236,844 0.01% 8,900 KANSAS CITY SOUTHERN* USD 936,458 0.05%
65,743 KB HOME* USD 2,100,474 0.12%
87,860 KEYCORP* USD 1,772,138 0.10% 7,694 KINSALE CAPITAL GROUP INC* USD 346,230 0.02%
11,600 KLA-TENCOR CORP* USD 1,218,812 0.07%
53,184 KOHL'S CORP* USD 2,884,160 0.16% 97,877 KROGER CO* USD 2,686,712 0.15%
20,478 KURA ONCOLOGY INC* USD 313,313 0.02%
4,500 L3 TECHNOLOGIES INC* USD 890,325 0.05% 34,389 LAM RESEARCH CORP* USD 6,330,006 0.36%
7,700 LAS VEGAS SANDS CORP* USD 535,073 0.03%
28,117 LAZARD LTD CLASS A* USD 1,476,157 0.08% 19,779 LEAR CORP* USD 3,494,104 0.20%
7,138 LIBERTY BROADBAND CORP CLASS C* USD 607,872 0.03% 55,127 LIBERTY INTERACTIVE CORP QVC GROUP CLASS A* USD 1,346,192 0.08%
41,289 LIMELIGHT NETWORKS INC* USD 182,085 0.01%
44,032 LINCOLN NATIONAL CORP* USD 3,384,720 0.19% 6,073 LOCKHEED MARTIN CORP* USD 1,949,737 0.11%
7,757 LOUISIANA-PACIFIC CORP* USD 203,699 0.01%
23,185 LOWE'S COS INC* USD 2,154,842 0.12% 2,087 LOXO ONCOLOGY INC* USD 175,684 0.01%
6,552 LSC COMMUNICATIONS INC* USD 99,269 0.01%
29,185 LYONDELLBASELL INDUSTRIES NV CLASS A* USD 3,219,691 0.18% 48,608 MACY'S INC* USD 1,224,430 0.07%
25,016 MALLINCKRODT PLC* USD 564,355 0.03%
20,393 MANPOWERGROUP INC* USD 2,571,699 0.14% 38,744 MARATHON PETROLEUM CORP* USD 2,556,320 0.14%
4,700 MARRIOTT INTERNATIONAL INC/MD CLASS A* USD 637,931 0.04%
19

SEI Global Investments Fund plc
Unaudited Condensed Financial Statements for the half year ended 31 December 2017
THE SEI GLOBAL SELECT EQUITY FUND
PORTFOLIO OF INVESTMENTS AS AT 31 DECEMBER 2017 (continued)
Nominal Security
Currency
Code Value US$ Fund %
United States - 40.87% (30 June 2017: 43.38%) (continued) 2,433 MARRIOTT VACATIONS WORLDWIDE CORP* USD 328,966 0.02%
13,881 MARSH & MCLENNAN COS INC* USD 1,129,775 0.06% 25,275 MASTERCARD INC CLASS A* USD 3,825,627 0.22%
6,711 MCCORMICK & CO INC/MD CLASS VTG* USD 683,918 0.04%
156,985 MCDERMOTT INTERNATIONAL INC* USD 1,032,960 0.06% 3,900 MCDONALD'S CORP* USD 671,268 0.04%
23,999 MCKESSON CORP* USD 3,742,617 0.21%
79,166 MERCK & CO INC* USD 4,454,649 0.25% 116,591 MERITOR INC* USD 2,735,214 0.15%
38,032 METLIFE INC* USD 1,922,900 0.11%
2,000 METTLER-TOLEDO INTERNATIONAL INC* USD 1,239,040 0.07%
20,800 MICROCHIP TECHNOLOGY INC* USD 1,827,904 0.10%
86,900 MICRON TECHNOLOGY INC* USD 3,573,328 0.20%
38,358 MICROSOFT CORP* USD 3,281,155 0.18% 11,892 MIRATI THERAPEUTICS INC* USD 217,029 0.01%
7,000 MOODY'S CORP* USD 1,033,270 0.06%
14,135 MOOG INC CLASS A* USD 1,227,616 0.07% 128,544 MORGAN STANLEY* USD 6,744,697 0.38%
4,400 MSCI INC CLASS A* USD 556,776 0.03%
3,576 NATIONAL BEVERAGE CORP* USD 348,445 0.02% 4,358 NAVISTAR INTERNATIONAL CORP* USD 186,871 0.01%
28,829 NCR CORP* USD 979,901 0.06%
6,900 NETFLIX INC* USD 1,324,524 0.07% 50,481 NEW YORK TIMES CO CLASS A* USD 933,899 0.05%
28,697 NEXTERA ENERGY INC* USD 4,482,184 0.25%
19,600 NISOURCE INC* USD 503,132 0.03% 11,202 NMI HOLDINGS INC CLASS A* USD 190,434 0.01%
2,300 NORFOLK SOUTHERN CORP* USD 333,270 0.02%
18,393 NORTHROP GRUMMAN CORP* USD 5,644,996 0.32% 13,991 NORWEGIAN CRUISE LINE HOLDINGS LTD* USD 745,021 0.04%
5,929 NOVANTA INC* USD 296,450 0.02%
21,177 NVIDIA CORP* USD 4,097,750 0.23% 400 NVR INC* USD 1,403,288 0.08%
7,768 ONEOK INC* USD 415,200 0.02%
5,195 OVERSTOCK.COM INC* USD 331,961 0.02% 13,271 PACKAGING CORP OF AMERICA* USD 1,599,781 0.09%
18,257 PARATEK PHARMACEUTICALS INC* USD 326,800 0.02%
77,884 PAYPAL HOLDINGS INC* USD 5,733,845 0.32% 70,037 PBF ENERGY INC CLASS A* USD 2,482,823 0.14%
208,414 PFIZER INC* USD 7,548,738 0.42%
7,068 PG&E CORP* USD 316,858 0.02% 21,300 PHILIP MORRIS INTERNATIONAL INC* USD 2,250,345 0.13%
236,692 PIER 1 IMPORTS INC* USD 979,907 0.06%
70,776 PILGRIM'S PRIDE CORP* USD 2,198,309 0.12% 13,000 PINNACLE WEST CAPITAL CORP* USD 1,107,340 0.06%
51,964 PITNEY BOWES INC* USD 580,953 0.03%
50,578 PNC FINANCIAL SERVICES GROUP INC* USD 7,297,957 0.41% 3,846 PORTOLA PHARMACEUTICALS INC* USD 187,223 0.01%
30,500 PPL CORP* USD 943,975 0.05%
110,276 PROGRESSIVE CORP* USD 6,210,744 0.35% 37,750 PRUDENTIAL FINANCIAL INC* USD 4,340,491 0.24%
93,148 PUBLIC SERVICE ENTERPRISE GROUP INC* USD 4,797,121 0.27% 18,600 PULTEGROUP INC* USD 618,450 0.03%
1,435 PVH CORP* USD 196,896 0.01%
10,600 QUEST DIAGNOSTICS INC* USD 1,043,994 0.06% 8,407 QUIDEL CORP* USD 364,443 0.02%
78,149 RADIAN GROUP INC* USD 1,610,645 0.09%
34,270 RALPH LAUREN CORP CLASS A* USD 3,553,502 0.20% 16,730 RAYTHEON CO* USD 3,142,731 0.18%
1,000 RED HAT INC* USD 120,100 0.01%
227,379 REGIONS FINANCIAL CORP* USD 3,929,104 0.22% 9,305 REINSURANCE GROUP OF AMERICA INC CLASS A* USD 1,450,871 0.08%
18,101 RELIANCE STEEL & ALUMINUM CO* USD 1,552,868 0.09%
27,400 REPUBLIC SERVICES INC CLASS A* USD 1,852,514 0.10% 600 ROCKWELL COLLINS INC* USD 81,372 0.00%
10,700 ROLLINS INC* USD 497,871 0.03%
20

SEI Global Investments Fund plc
Unaudited Condensed Financial Statements for the half year ended 31 December 2017
THE SEI GLOBAL SELECT EQUITY FUND
PORTFOLIO OF INVESTMENTS AS AT 31 DECEMBER 2017 (continued)
Nominal Security
Currency
Code Value US$ Fund %
United States - 40.87% (30 June 2017: 43.38%) (continued) 2,000 ROPER TECHNOLOGIES INC* USD 518,000 0.03%
12,541 ROSS STORES INC* USD 1,006,415 0.06% 63,505 ROWAN COS PLC CLASS A* USD 994,494 0.06%
238,814 RR DONNELLEY & SONS CO* USD 2,220,974 0.12%
6,900 S&P GLOBAL INC* USD 1,168,860 0.07% 2,363 SAFEWAY CASA LEY CVR† USD 2,398 0.00%
2,363 SAFEWAY PDC LLC CVR† USD 1 0.00%
2,068 SAGE THERAPEUTICS INC* USD 340,620 0.02% 5,500 SALESFORCE.COM INC* USD 562,265 0.03%
2,350 SANDERSON FARMS INC* USD 326,133 0.02%
25,749 SCHLUMBERGER LTD* USD 1,735,225 0.10%
51,455 SEAGATE TECHNOLOGY PLC* USD 2,152,882 0.12%
2,200 SEMPRA ENERGY* USD 235,224 0.01%
8,300 SERVICENOW INC* USD 1,082,237 0.06% 83,642 SKYWEST INC* USD 4,441,366 0.25%
48,223 SONIC AUTOMOTIVE INC CLASS A* USD 889,714 0.05%
32,185 SOUTHWEST AIRLINES CO* USD 2,106,499 0.12% 4,655 SP PLUS CORP* USD 172,701 0.01%
28,987 SPECTRUM PHARMACEUTICALS INC* USD 549,304 0.03%
29,643 SPIRIT AEROSYSTEMS HOLDINGS INC CLASS A* USD 2,586,318 0.15% 11,255 SQUARE INC - CLASS A* USD 390,211 0.02%
25,016 STATE STREET CORP* USD 2,441,785 0.14%
29,062 STERLING CONSTRUCTION CO INC* USD 473,129 0.03% 58,268 SUNTRUST BANKS INC* USD 3,763,552 0.21%
122,015 SUPERVALU INC* USD 2,635,524 0.15%
105,145 SYMANTEC CORP* USD 2,950,370 0.17% 15,700 SYNOPSYS INC* USD 1,338,268 0.08%
6,634 SYSTEMAX INC* USD 220,713 0.01%
11,831 TACTILE SYSTEMS TECHNOLOGY INC* USD 342,862 0.02% 13,616 TAKE-TWO INTERACTIVE SOFTWARE INC* USD 1,494,763 0.08%
57,099 TARGET CORP* USD 3,725,703 0.21%
14,898 TECH DATA CORP* USD 1,459,516 0.08% 64,776 TEGNA INC* USD 912,053 0.05%
3,000 TELEFLEX INC* USD 746,460 0.04%
8,100 TESLA INC* USD 2,521,935 0.14% 4,800 TEXAS INSTRUMENTS INC* USD 501,312 0.03%
10,800 TIFFANY & CO* USD 1,122,660 0.06%
23,236 TIMKEN CO* USD 1,142,057 0.06% 16,677 TJX COS INC* USD 1,275,123 0.07%
7,685 TORO CO* USD 501,293 0.03%
4,935 TOTAL SYSTEM SERVICES INC* USD 390,309 0.02% 16,525 TRAVELERS COS INC* USD 2,241,399 0.13%
43,015 TRINITY INDUSTRIES INC* USD 1,611,336 0.09%
65,807 TRINSEO SA* USD 4,777,563 0.27% 28,271 TRIPADVISOR INC* USD 974,216 0.05%
88,778 TRIUMPH GROUP INC* USD 2,414,757 0.14%
69,178 TUTOR PERINI CORP* USD 1,753,661 0.10% 46,015 TYSON FOODS INC CLASS A* USD 3,730,412 0.21%
1,100 UNION PACIFIC CORP* USD 147,510 0.01%
218,249 UNISYS CORP* USD 1,778,732 0.10% 34,981 UNITED CONTINENTAL HOLDINGS INC* USD 2,357,742 0.13%
3,874 UNITEDHEALTH GROUP INC* USD 854,062 0.05% 38,591 UNUM GROUP* USD 2,118,278 0.12%
18,600 US BANCORP* USD 996,588 0.06%
4,700 VAIL RESORTS INC* USD 998,609 0.06% 58,828 VALERO ENERGY CORP* USD 5,406,847 0.30%
25,771 VANTIV INC CLASS A* USD 1,895,457 0.11%
9,100 VARIAN MEDICAL SYSTEMS INC* USD 1,011,465 0.06% 3,484 VECTREN CORP* USD 226,530 0.01%
6,800 VEEVA SYSTEMS INC CLASS A* USD 375,904 0.02%
8,900 VERISIGN INC* USD 1,018,516 0.06% 132,509 VERIZON COMMUNICATIONS INC* USD 7,013,678 0.39%
10,912 VERTEX PHARMACEUTICALS INC* USD 1,635,272 0.09%
24,456 VIACOM INC CLASS B* USD 753,503 0.04% 36,340 VISA INC CLASS A* USD 4,143,533 0.23%
18,600 VISTRA ENERGY CORP* USD 340,752 0.02%
21

SEI Global Investments Fund plc
Unaudited Condensed Financial Statements for the half year ended 31 December 2017
THE SEI GLOBAL SELECT EQUITY FUND
PORTFOLIO OF INVESTMENTS AS AT 31 DECEMBER 2017 (continued)
Nominal Security
Currency
Code Value US$ Fund %
United States - 40.87% (30 June 2017: 43.38%) (continued) 2,200 VMWARE INC CLASS A* USD 275,704 0.02%
37,320 VOYA FINANCIAL INC* USD 1,846,231 0.10% 11,783 VOYAGER THERAPEUTICS INC* USD 195,598 0.01%
87,633 W&T OFFSHORE INC* USD 290,065 0.02%
1,100 WABCO HOLDINGS INC* USD 157,850 0.01% 68,598 WALGREENS BOOTS ALLIANCE INC* USD 4,981,608 0.28%
43,243 WAL-MART STORES INC* USD 4,270,281 0.24%
38,600 WASTE MANAGEMENT INC* USD 3,331,180 0.19% 2,100 WATERS CORP* USD 405,699 0.02%
4,610 WEIGHT WATCHERS INTERNATIONAL INC* USD 204,131 0.01%
30,761 WELLS FARGO & CO* USD 1,866,282 0.10%
23,672 WESTERN DIGITAL CORP* USD 1,882,629 0.11%
81,708 WESTERN UNION CO* USD 1,553,267 0.09%
3,874 WESTLAKE CHEMICAL CORP* USD 412,697 0.02% 16,982 WESTROCK CO* USD 1,073,446 0.06%
13,830 WHIRLPOOL CORP* USD 2,332,263 0.13%
3,700 WORKDAY INC CLASS A* USD 376,438 0.02% 24,650 WYNDHAM WORLDWIDE CORP* USD 2,856,191 0.16%
8,000 WYNN RESORTS LTD* USD 1,348,720 0.08%
62,613 XCEL ENERGY INC* USD 3,012,311 0.17% 91,025 XEROX CORP* USD 2,653,385 0.15%
10,702 ZAGG INC* USD 197,452 0.01%
Total Equities 1,398,498,061 78.65%
Financial Equity Assets at Fair Value Through Profit or Loss 1,398,498,061 78.65%
Financial Equity Liabilities at Fair Value Through Profit or Loss – –
INVESTMENT FUNDS
Australia - 0.22% (30 June 2017: 0.00%) 585,971 GOODMAN GROUP AUD 3,859,031 0.22%
Canada - 0.01% (30 June 2017: 0.00%) 11,281 DREAM OFFICE REAL ESTATE INVESTMENT TRUST CAD 199,519 0.01%
Estonia - 0.31% (30 June 2017: 0.31%) 133,644 TRIGON NEW EUROPE FUND CLASS C EUR 5,533,162 0.31%
Luxembourg - 13.35% (30 June 2017: 12.96%) 1,148,961 ARCUS JAPAN FUND JPY 237,455,714 13.35%
Romania - 0.20% (30 June 2017: 0.14%) 15,957,897 FONDUL PROPRIETATEA SA/FUND RON 3,546,199 0.20%
Singapore - 0.01% (30 June 2017: 0.01%) 142,200 CAPITALAND COMMERCIAL TRUST SGD 205,362 0.01%
United Kingdom - 0.05% (30 June 2017: 0.02%)
103,172 SEGRO PLC GBP 819,252 0.05%
United States - 1.35% (30 June 2017: 0.82%)
43,400 AGNC INVESTMENT CORP USD 876,246 0.05%
15,922 AMERICAN TOWER CORP CLASS A USD 2,271,592 0.13% 334,710 ANNALY CAPITAL MANAGEMENT INC USD 3,979,705 0.22%
1,814 AVALONBAY COMMUNITIES INC USD 323,636 0.02%
20,245 CROWN CASTLE INTERNATIONAL CORP USD 2,247,429 0.13% 3,300 DIGITAL REALTY TRUST INC USD 375,870 0.02%
2,491 EQUINIX INC USD 1,129,059 0.06%
3,700 ESSEX PROPERTY TRUST INC USD 893,069 0.05% 57,048 HOSPITALITY PROPERTIES TRUST USD 1,702,885 0.10%
145,569 LEXINGTON REALTY TRUST CLASS REIT USD 1,404,742 0.08%
2,400 MID-AMERICA APARTMENT COMMUNITIES INC USD 241,344 0.01% 10,337 OUTFRONT MEDIA INC USD 239,818 0.01%
15,783 PREFERRED APARTMENT COMMUNITIES INC CLASS A USD 319,606 0.02%
22,519 REXFORD INDUSTRIAL REALTY INC USD 656,654 0.04%
22
SEI Global Investments Fund plc
Unaudited Condensed Financial Statements for the half year ended 31 December 2017
THE SEI GLOBAL SELECT EQUITY FUND
PORTFOLIO OF INVESTMENTS AS AT 31 DECEMBER 2017 (continued)
Nominal Security
Currency
Code Value US$ Fund %
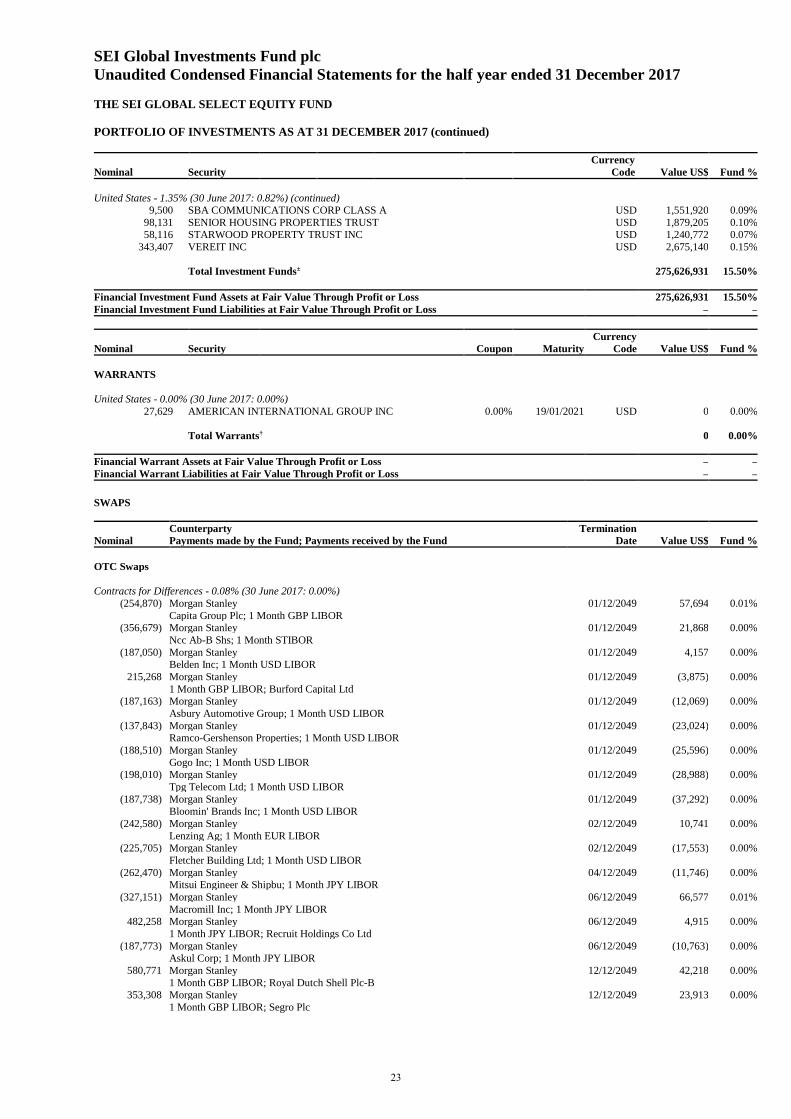
United States - 1.35% (30 June 2017: 0.82%) (continued) 9,500 SBA COMMUNICATIONS CORP CLASS A USD 1,551,920 0.09%
98,131 SENIOR HOUSING PROPERTIES TRUST USD 1,879,205 0.10% 58,116 STARWOOD PROPERTY TRUST INC USD 1,240,772 0.07%
343,407 VEREIT INC USD 2,675,140 0.15%
Total Investment Funds± 275,626,931 15.50%
Financial Investment Fund Assets at Fair Value Through Profit or Loss 275,626,931 15.50%
Financial Investment Fund Liabilities at Fair Value Through Profit or Loss – –
Nominal Security Coupon Maturity
Currency
Code Value US$ Fund %
WARRANTS
United States - 0.00% (30 June 2017: 0.00%)
27,629 AMERICAN INTERNATIONAL GROUP INC 0.00% 19/01/2021 USD 0 0.00%
Total Warrants† 0 0.00%
Financial Warrant Assets at Fair Value Through Profit or Loss – –
Financial Warrant Liabilities at Fair Value Through Profit or Loss – –
SWAPS
Nominal
Counterparty Payments made by the Fund; Payments received by the Fund
Termination
Date Value US$ Fund %
OTC Swaps
Contracts for Differences - 0.08% (30 June 2017: 0.00%)
(254,870) Morgan Stanley 01/12/2049 57,694 0.01%
Capita Group Plc; 1 Month GBP LIBOR (356,679) Morgan Stanley 01/12/2049 21,868 0.00%
Ncc Ab-B Shs; 1 Month STIBOR
(187,050) Morgan Stanley 01/12/2049 4,157 0.00% Belden Inc; 1 Month USD LIBOR
215,268 Morgan Stanley 01/12/2049 (3,875) 0.00%
1 Month GBP LIBOR; Burford Capital Ltd (187,163) Morgan Stanley 01/12/2049 (12,069) 0.00%
Asbury Automotive Group; 1 Month USD LIBOR
(137,843) Morgan Stanley 01/12/2049 (23,024) 0.00% Ramco-Gershenson Properties; 1 Month USD LIBOR
(188,510) Morgan Stanley 01/12/2049 (25,596) 0.00%
Gogo Inc; 1 Month USD LIBOR (198,010) Morgan Stanley 01/12/2049 (28,988) 0.00%
Tpg Telecom Ltd; 1 Month USD LIBOR
(187,738) Morgan Stanley 01/12/2049 (37,292) 0.00%
Bloomin' Brands Inc; 1 Month USD LIBOR
(242,580) Morgan Stanley 02/12/2049 10,741 0.00%
Lenzing Ag; 1 Month EUR LIBOR (225,705) Morgan Stanley 02/12/2049 (17,553) 0.00%
Fletcher Building Ltd; 1 Month USD LIBOR
(262,470) Morgan Stanley 04/12/2049 (11,746) 0.00% Mitsui Engineer & Shipbu; 1 Month JPY LIBOR
(327,151) Morgan Stanley 06/12/2049 66,577 0.01%
Macromill Inc; 1 Month JPY LIBOR 482,258 Morgan Stanley 06/12/2049 4,915 0.00%
1 Month JPY LIBOR; Recruit Holdings Co Ltd
(187,773) Morgan Stanley 06/12/2049 (10,763) 0.00% Askul Corp; 1 Month JPY LIBOR
580,771 Morgan Stanley 12/12/2049 42,218 0.00%
1 Month GBP LIBOR; Royal Dutch Shell Plc-B 353,308 Morgan Stanley 12/12/2049 23,913 0.00%
1 Month GBP LIBOR; Segro Plc
23

SEI Global Investments Fund plc
Unaudited Condensed Financial Statements for the half year ended 31 December 2017
THE SEI GLOBAL SELECT EQUITY FUND
PORTFOLIO OF INVESTMENTS AS AT 31 DECEMBER 2017 (continued)
Nominal
Counterparty Payments made by the Fund; Payments received by the Fund
Termination
Date Value US$ Fund %
Contracts for Differences - 0.08% (30 June 2017: 0.00%) (continued) 191,136 Morgan Stanley 12/12/2049 753 0.00%
1 Month USD LIBOR; Icon Plc (186,307) Morgan Stanley 12/12/2049 (7,154) 0.00%
Bank Of The Ozarks; 1 Month USD LIBOR
(190,462) Morgan Stanley 12/12/2049 (11,903) 0.00% Enlink Midstream Llc; 1 Month USD LIBOR
(188,718) Morgan Stanley 12/12/2049 (17,968) 0.00%
Flsmidth & Co A; 1 Month USD LIBOR (311,185) Morgan Stanley 12/12/2049 (28,903) 0.00%
Coeur Mining Inc; 1 Month USD LIBOR
907,943 Morgan Stanley 13/12/2049 57,672 0.01%
1 Month GBP LIBOR; Astrazeneca Plc
646,369 Morgan Stanley 13/12/2049 35,163 0.00%
1 Month USD LIBOR; Honeywell International Inc (633,676) Morgan Stanley 13/12/2049 34,517 0.00%
Macom Technology Solutions; 1 Month USD LIBOR
1,020,285 Morgan Stanley 13/12/2049 32,174 0.00% 1 Month USD LIBOR; Moody'S Corp
(192,540) Morgan Stanley 13/12/2049 12,065 0.00%
Swire Pacific Ltd - Cl A; 1 Month HKD LIBOR (189,902) Morgan Stanley 13/12/2049 3,405 0.00%
Lasalle Hotel Properties; 1 Month USD LIBOR
(184,143) Morgan Stanley 13/12/2049 (1,279) 0.00% Haitong Intl Sec Grp Ltd; 1 Month HKD LIBOR
(397,287) Morgan Stanley 13/12/2049 (7,197) 0.00%
Rent-A-Center Inc; 1 Month USD LIBOR (472,166) Morgan Stanley 13/12/2049 (32,986) 0.00%
Athenahealth Inc; 1 Month USD LIBOR
(354,649) Morgan Stanley 13/12/2049 (41,485) 0.00% Wabash National Corp; 1 Month USD LIBOR
(513,215) Morgan Stanley 13/12/2049 (95,846) (0.01%)
Netgear Inc; 1 Month USD LIBOR (186,477) Morgan Stanley 14/12/2049 7,984 0.00%
Gree Inc; 1 Month JPY LIBOR
(188,781) Morgan Stanley 14/12/2049 6,267 0.00% Raging River Exploration; 1 Month CAD LIBOR
(84,668) Morgan Stanley 14/12/2049 65 0.00%
Ai Holdings Corp; 1 Month JPY LIBOR (183,409) Morgan Stanley 14/12/2049 (10,998) 0.00%
Towa Corp; 1 Month JPY LIBOR
(333,952) Morgan Stanley 14/12/2049 (30,042) 0.00% Colopl Inc; 1 Month JPY LIBOR
330,987 Morgan Stanley 15/12/2049 14,267 0.00%
1 Month USD LIBOR; Buckle Inc/The (211,444) Morgan Stanley 15/12/2049 11,554 0.00%
Rhi Magnesita Nv; 1 Month GBP LIBOR
(347,360) Morgan Stanley 15/12/2049 8,010 0.00% Brighthouse Financial Inc; 1 Month USD LIBOR
(208,654) Morgan Stanley 15/12/2049 1,939 0.00%
Enbridge Energy Management L; 1 Month USD LIBOR (197,142) Morgan Stanley 15/12/2049 (5,897) 0.00%
Jd Sports Fashion Plc; 1 Month GBP LIBOR (218,196) Morgan Stanley 15/12/2049 (6,825) 0.00%
Heartland Express Inc; 1 Month USD LIBOR
(199,013) Morgan Stanley 15/12/2049 (12,098) 0.00% Crest Nicholson Holdings; 1 Month GBP LIBOR
(272,155) Morgan Stanley 15/12/2049 (17,975) 0.00%
Nextera Energy Partners Lp; 1 Month USD LIBOR (523,473) Morgan Stanley 15/12/2049 (36,129) 0.00%
Melrose Industries Plc; 1 Month GBP LIBOR
(197,504) Morgan Stanley 18/12/2049 (7,004) 0.00% Norwegian Finance Holdin; 1 Month USD LIBOR
(194,561) Morgan Stanley 18/12/2049 (13,977) 0.00%
Li & Fung Ltd; 1 Month HKD LIBOR (224,699) Morgan Stanley 18/12/2049 (19,433) 0.00%
Vocus Group Ltd; 1 Month USD LIBOR
24

SEI Global Investments Fund plc
Unaudited Condensed Financial Statements for the half year ended 31 December 2017
THE SEI GLOBAL SELECT EQUITY FUND
PORTFOLIO OF INVESTMENTS AS AT 31 DECEMBER 2017 (continued)
Nominal
Counterparty Payments made by the Fund; Payments received by the Fund
Termination
Date Value US$ Fund %
Contracts for Differences - 0.08% (30 June 2017: 0.00%) (continued) 362,948 Morgan Stanley 19/12/2049 27,283 0.00%
1 Month JPY LIBOR; Denso Corp (229,205) Morgan Stanley 19/12/2049 6,746 0.00%
Japan Prime Realty Inves; 1 Month JPY LIBOR
(193,270) Morgan Stanley 21/12/2049 36,675 0.00% Hecla Mining Co; 1 Month CAD LIBOR
371,264 Morgan Stanley 23/12/2049 29,503 0.00%
1 Month GBP LIBOR; Bp Plc (190,059) Morgan Stanley 23/12/2049 (3,646) 0.00%
Meggitt Plc; 1 Month GBP LIBOR
(237,830) Morgan Stanley 24/12/2049 (517) 0.00%
First Midwest Bancorp Inc/Il; 1 Month USD LIBOR
(190,321) Morgan Stanley 24/12/2049 (12,637) 0.00%
Fiesta Restaurant Group; 1 Month USD LIBOR (368,400) Morgan Stanley 24/12/2049 (37,338) 0.00%
Pacira Pharmaceuticals Inc; 1 Month USD LIBOR
(193,993) Morgan Stanley 25/12/2049 (5,209) 0.00% Cyberagent Inc; 1 Month JPY LIBOR
2,367,872 Morgan Stanley 26/12/2049 371,769 0.02%
1 Month USD LIBOR; At&T Inc 1,713,052 Morgan Stanley 26/12/2049 324,600 0.02%
1 Month JPY LIBOR; Nippon Yusen Kk
2,324,337 Morgan Stanley 26/12/2049 315,402 0.02% 1 Month USD LIBOR; Boeing Co/The
1,542,913 Morgan Stanley 26/12/2049 227,646 0.01%
1 Month USD LIBOR; Costco Wholesale Corp 2,625,783 Morgan Stanley 26/12/2049 136,915 0.01%
1 Month USD LIBOR; Mcdonald'S Corp
1,340,883 Morgan Stanley 26/12/2049 125,732 0.01% 1 Month USD LIBOR; Anthem Inc
(539,084) Morgan Stanley 26/12/2049 117,998 0.01%
Fabrinet; 1 Month USD LIBOR 1,816,742 Morgan Stanley 26/12/2049 102,554 0.01%
1 Month GBP LIBOR; Hsbc Holdings Plc
(507,751) Morgan Stanley 26/12/2049 100,530 0.01% Pitney Bowes Inc; 1 Month USD LIBOR
1,537,806 Morgan Stanley 26/12/2049 94,298 0.01%
1 Month USD LIBOR; Air Products & Chemicals Inc 2,073,763 Morgan Stanley 26/12/2049 87,608 0.01%
1 Month USD LIBOR; Abbvie Inc
(322,619) Morgan Stanley 26/12/2049 86,497 0.01% 3D Systems Corp; 1 Month USD LIBOR
1,005,196 Morgan Stanley 26/12/2049 82,026 0.01%
1 Month GBP LIBOR; Fevertree Drinks Plc (309,071) Morgan Stanley 26/12/2049 81,676 0.01%
Opko Health Inc; 1 Month USD LIBOR
(429,583) Morgan Stanley 26/12/2049 80,793 0.01% Elior Group; 1 Month EUR LIBOR
(507,893) Morgan Stanley 26/12/2049 74,733 0.01%
Triumph Group Inc; 1 Month USD LIBOR (524,382) Morgan Stanley 26/12/2049 63,051 0.01%
Babcock Intl Group Plc; 1 Month GBP LIBOR (250,330) Morgan Stanley 26/12/2049 61,341 0.01%
Twilio Inc - A; 1 Month USD LIBOR
546,548 Morgan Stanley 26/12/2049 61,249 0.01% 1 Month GBP LIBOR; Victrex Plc
(255,666) Morgan Stanley 26/12/2049 49,543 0.00%
Oclaro Inc; 1 Month USD LIBOR 1,097,631 Morgan Stanley 26/12/2049 49,428 0.00%
1 Month USD LIBOR; Broadcom Ltd
641,431 Morgan Stanley 26/12/2049 48,539 0.00% 1 Month EUR LIBOR; Vinci Sa
(202,928) Morgan Stanley 26/12/2049 45,175 0.00%
Maiden Holdings Ltd; 1 Month USD LIBOR 639,948 Morgan Stanley 26/12/2049 44,867 0.00%
1 Month USD LIBOR; Aerovironment Inc
25

SEI Global Investments Fund plc
Unaudited Condensed Financial Statements for the half year ended 31 December 2017
THE SEI GLOBAL SELECT EQUITY FUND
PORTFOLIO OF INVESTMENTS AS AT 31 DECEMBER 2017 (continued)
Nominal
Counterparty Payments made by the Fund; Payments received by the Fund
Termination
Date Value US$ Fund %
Contracts for Differences - 0.08% (30 June 2017: 0.00%) (continued) (260,521) Morgan Stanley 26/12/2049 43,993 0.00%
Papa John'S Intl Inc; 1 Month USD LIBOR (375,101) Morgan Stanley 26/12/2049 43,226 0.00%
Nevro Corp; 1 Month USD LIBOR
(297,219) Morgan Stanley 26/12/2049 40,319 0.00% Peyto Exploration & Dev Corp; 1 Month USD LIBOR
173,342 Morgan Stanley 26/12/2049 39,852 0.00%
1 Month GBP LIBOR; Purplebricks Group Plc 3,572,601 Morgan Stanley 26/12/2049 37,846 0.00%
1 Month USD LIBOR; Citigroup Inc
245,068 Morgan Stanley 26/12/2049 34,222 0.00%
1 Month EUR LIBOR; Trigano Sa
863,711 Morgan Stanley 26/12/2049 32,800 0.00%
1 Month JPY LIBOR; Keyence Corp 309,394 Morgan Stanley 26/12/2049 29,101 0.00%
1 Month GBP LIBOR; Kaz Minerals Plc
645,353 Morgan Stanley 26/12/2049 28,805 0.00% 1 Month EUR LIBOR; Stmicroelectronics Nv
1,758,036 Morgan Stanley 26/12/2049 27,157 0.00%
1 Month USD LIBOR; Fmc Corp (256,155) Morgan Stanley 26/12/2049 27,074 0.00%
Mixi Inc; 1 Month JPY LIBOR
(576,855) Morgan Stanley 26/12/2049 26,610 0.00% Inphi Corp; 1 Month USD LIBOR
2,100,489 Morgan Stanley 26/12/2049 26,429 0.00%
1 Month EUR LIBOR; Kering (618,436) Morgan Stanley 26/12/2049 25,864 0.00%
Cooper Tire & Rubber; 1 Month USD LIBOR
(294,792) Morgan Stanley 26/12/2049 24,610 0.00% Arris International Plc; 1 Month USD LIBOR
3,293,403 Morgan Stanley 26/12/2049 23,777 0.00%
1 Month USD LIBOR; Automatic Data Processing 183,646 Morgan Stanley 26/12/2049 21,351 0.00%
1 Month USD LIBOR; Smart Global Holdings Inc
(251,682) Morgan Stanley 26/12/2049 20,795 0.00% Hachijuni Bank Ltd; 1 Month JPY LIBOR
(537,868) Morgan Stanley 26/12/2049 20,747 0.00%
Azimut Holding Spa; 1 Month EUR LIBOR (238,189) Morgan Stanley 26/12/2049 19,582 0.00%
Cathay Pacific Airways; 1 Month HKD LIBOR
(202,920) Morgan Stanley 26/12/2049 18,305 0.00% Finisar Corporation; 1 Month USD LIBOR
(261,598) Morgan Stanley 26/12/2049 18,166 0.00%
Amkor Technology Inc; 1 Month USD LIBOR 540,320 Morgan Stanley 26/12/2049 16,160 0.00%
1 Month USD LIBOR; Lear Corp
(273,734) Morgan Stanley 26/12/2049 15,537 0.00% Logmein Inc; 1 Month USD LIBOR
(204,320) Morgan Stanley 26/12/2049 14,769 0.00%
Liberty Global Plc Lilac - A; 1 Month USD LIBOR (216,379) Morgan Stanley 26/12/2049 13,834 0.00%
Fitbit Inc - A; 1 Month USD LIBOR (243,940) Morgan Stanley 26/12/2049 11,618 0.00%
Stericycle Inc; 1 Month USD LIBOR
(611,151) Morgan Stanley 26/12/2049 11,505 0.00% Education Realty Trust Inc; 1 Month USD LIBOR
189,460 Morgan Stanley 26/12/2049 11,190 0.00%
1 Month GBP LIBOR; B&M European Value Retai (241,867) Morgan Stanley 26/12/2049 11,137 0.00%
Trustmark Corp; 1 Month USD LIBOR
(398,299) Morgan Stanley 26/12/2049 11,131 0.00% Buzzi Unicem Spa; 1 Month EUR LIBOR
(535,076) Morgan Stanley 26/12/2049 9,853 0.00%
Casey'S General Stores Inc; 1 Month USD LIBOR (322,664) Morgan Stanley 26/12/2049 9,481 0.00%
Cirrus Logic Inc; 1 Month USD LIBOR
26

SEI Global Investments Fund plc
Unaudited Condensed Financial Statements for the half year ended 31 December 2017
THE SEI GLOBAL SELECT EQUITY FUND
PORTFOLIO OF INVESTMENTS AS AT 31 DECEMBER 2017 (continued)
Nominal
Counterparty Payments made by the Fund; Payments received by the Fund
Termination
Date Value US$ Fund %
Contracts for Differences - 0.08% (30 June 2017: 0.00%) (continued) (384,519) Morgan Stanley 26/12/2049 8,689 0.00%
Fresh Del Monte Produce Inc; 1 Month USD LIBOR (221,811) Morgan Stanley 26/12/2049 8,620 0.00%
Lexicon Pharmaceuticals Inc; 1 Month USD LIBOR
(204,805) Morgan Stanley 26/12/2049 8,413 0.00% Iyo Bank Ltd; 1 Month JPY LIBOR
367,031 Morgan Stanley 26/12/2049 8,386 0.00%
1 Month EUR LIBOR; Lvmh Moet Hennessy Louis (225,027) Morgan Stanley 26/12/2049 7,209 0.00%
Guotai Junan Internation; 1 Month HKD LIBOR
(183,420) Morgan Stanley 26/12/2049 6,440 0.00%
Natus Medical Inc; 1 Month USD LIBOR
(322,534) Morgan Stanley 26/12/2049 6,126 0.00%
Microsemi Corp; 1 Month USD LIBOR (216,493) Morgan Stanley 26/12/2049 5,311 0.00%
Northwest Bancshares Inc; 1 Month USD LIBOR
187,278 Morgan Stanley 26/12/2049 4,968 0.00% 1 Month GBP LIBOR; Taylor Wimpey Plc
202,365 Morgan Stanley 26/12/2049 4,815 0.00%
1 Month GBP LIBOR; Iqe Plc (244,296) Morgan Stanley 26/12/2049 4,316 0.00%
Huhtamaki Oyj; 1 Month EUR LIBOR
189,910 Morgan Stanley 26/12/2049 4,152 0.00% 1 Month GBP LIBOR; Lloyds Banking Group Plc
(257,166) Morgan Stanley 26/12/2049 2,924 0.00%
Bezeq The Israeli Teleco; 1 Month USD LIBOR (397,098) Morgan Stanley 26/12/2049 2,635 0.00%
Prosiebensat.1 Media Se; 1 Month EUR LIBOR
(319,189) Morgan Stanley 26/12/2049 2,445 0.00% Ellie Mae Inc; 1 Month USD LIBOR
467,689 Morgan Stanley 26/12/2049 2,294 0.00%
1 Month GBP LIBOR; Spirax-Sarco Engineering 325,683 Morgan Stanley 26/12/2049 1,929 0.00%
1 Month GBP LIBOR; Bodycote Plc
443,868 Morgan Stanley 26/12/2049 981 0.00% 1 Month GBP LIBOR; Keywords Studios Plc
(205,967) Morgan Stanley 26/12/2049 (242) 0.00%
Sartorius Ag-Vorzug; 1 Month EUR LIBOR (211,589) Morgan Stanley 26/12/2049 (932) 0.00%
Ceva Inc; 1 Month USD LIBOR
679,736 Morgan Stanley 26/12/2049 (969) 0.00% 1 Month USD LIBOR; Micron Technology Inc
210,663 Morgan Stanley 26/12/2049 (1,470) 0.00%
1 Month GBP LIBOR; Blue Prism Group Plc (235,889) Morgan Stanley 26/12/2049 (1,768) 0.00%
Kaken Pharmaceutical Co; 1 Month JPY LIBOR
(189,419) Morgan Stanley 26/12/2049 (2,075) 0.00% Nippon Denko Co Ltd; 1 Month JPY LIBOR
(184,050) Morgan Stanley 26/12/2049 (2,548) 0.00%
Mantra Group Ltd; 1 Month USD LIBOR (252,216) Morgan Stanley 26/12/2049 (2,897) 0.00%
Ptc Inc; 1 Month USD LIBOR (198,070) Morgan Stanley 26/12/2049 (3,079) 0.00%
U-Blox Holding Ag; 1 Month USD LIBOR
312,252 Morgan Stanley 26/12/2049 (3,700) 0.00% 1 Month GBP LIBOR; 3I Group Plc
274,708 Morgan Stanley 26/12/2049 (5,220) 0.00%
1 Month EUR LIBOR; S.O.I.T.E.C. (539,097) Morgan Stanley 26/12/2049 (5,833) 0.00%
Comfortdelgro Corp Ltd; 1 Month USD LIBOR
(228,726) Morgan Stanley 26/12/2049 (5,942) 0.00% Five9 Inc; 1 Month USD LIBOR
412,876 Morgan Stanley 26/12/2049 (6,058) 0.00%
1 Month GBP LIBOR; Grafton Group Plc-Uts (274,914) Morgan Stanley 26/12/2049 (8,186) 0.00%
8X8 Inc; 1 Month USD LIBOR
27

SEI Global Investments Fund plc
Unaudited Condensed Financial Statements for the half year ended 31 December 2017
THE SEI GLOBAL SELECT EQUITY FUND
PORTFOLIO OF INVESTMENTS AS AT 31 DECEMBER 2017 (continued)
Nominal
Counterparty Payments made by the Fund; Payments received by the Fund
Termination
Date Value US$ Fund %
Contracts for Differences - 0.08% (30 June 2017: 0.00%) (continued) (634,178) Morgan Stanley 26/12/2049 (8,654) 0.00%
Distribuidora Internacio; 1 Month EUR LIBOR (176,569) Morgan Stanley 26/12/2049 (8,868) 0.00%
Dermira Inc; 1 Month USD LIBOR
(632,788) Morgan Stanley 26/12/2049 (8,928) 0.00% Interdigital Inc; 1 Month USD LIBOR
(300,217) Morgan Stanley 26/12/2049 (9,609) 0.00%
Sjm Holdings Ltd; 1 Month HKD LIBOR (241,681) Morgan Stanley 26/12/2049 (10,023) 0.00%
Heiwa Corp; 1 Month JPY LIBOR
1,049,584 Morgan Stanley 26/12/2049 (10,190) 0.00%
1 Month USD LIBOR; Cadence Design Sys Inc
(169,255) Morgan Stanley 26/12/2049 (10,364) 0.00%
Csg Systems Intl Inc; 1 Month USD LIBOR (203,979) Morgan Stanley 26/12/2049 (10,976) 0.00%
Invincible Investment Co; 1 Month JPY LIBOR
(180,966) Morgan Stanley 26/12/2049 (11,387) 0.00% Integrated Device Tech Inc; 1 Month USD LIBOR
(184,099) Morgan Stanley 26/12/2049 (12,730) 0.00%
Us Concrete Inc; 1 Month USD LIBOR (162,140) Morgan Stanley 26/12/2049 (11,258) 0.00%
Autogrill Spa; 1 Month EUR LIBOR
404,722 Morgan Stanley 26/12/2049 (13,976) 0.00% 1 Month GBP LIBOR; Sophos Group Plc
(324,069) Morgan Stanley 26/12/2049 (15,819) 0.00%
Wabtec Corp; 1 Month USD LIBOR (197,054) Morgan Stanley 26/12/2049 (15,889) 0.00%
Ani Pharmaceuticals Inc; 1 Month USD LIBOR
(380,570) Morgan Stanley 26/12/2049 (16,992) 0.00% Bank Of Hawaii Corp; 1 Month USD LIBOR
(471,681) Morgan Stanley 26/12/2049 (17,265) 0.00%
Salvatore Ferragamo Spa; 1 Month EUR LIBOR (258,846) Morgan Stanley 26/12/2049 (17,748) 0.00%
Dip Corp; 1 Month JPY LIBOR
(232,496) Morgan Stanley 26/12/2049 (18,163) 0.00% Usana Health Sciences Inc; 1 Month USD LIBOR
370,705 Morgan Stanley 26/12/2049 (18,568) 0.00%
1 Month GBP LIBOR; Wood Group (John) Plc (165,069) Morgan Stanley 26/12/2049 (22,326) 0.00%
Rr Donnelley & Sons Co; 1 Month USD LIBOR
(249,889) Morgan Stanley 26/12/2049 (22,331) 0.00% Financial Products Group; 1 Month JPY LIBOR
(292,574) Morgan Stanley 26/12/2049 (23,112) 0.00%
Greene King Plc; 1 Month GBP LIBOR 184,811 Morgan Stanley 26/12/2049 (24,973) 0.00%
1 Month GBP LIBOR; Associated British Foods
(238,077) Morgan Stanley 26/12/2049 (26,239) 0.00% Amer Sports Oyj; 1 Month EUR LIBOR
(287,032) Morgan Stanley 26/12/2049 (26,786) 0.00%
Genesee & Wyoming Inc-Cl A; 1 Month USD LIBOR (247,269) Morgan Stanley 26/12/2049 (26,855) 0.00%
Peptidream Inc; 1 Month JPY LIBOR 482,707 Morgan Stanley 26/12/2049 (27,536) 0.00%
1 Month GBP LIBOR; Next Plc
(1,070,672) Morgan Stanley 26/12/2049 (27,808) 0.00% Transdigm Group Inc; 1 Month USD LIBOR
(384,908) Morgan Stanley 26/12/2049 (28,613) 0.00%
Wheaton Precious Metals Corp; 1 Month USD LIBOR (338,802) Morgan Stanley 26/12/2049 (29,320) 0.00%
Kenedix Inc; 1 Month JPY LIBOR
(355,979) Morgan Stanley 26/12/2049 (30,954) 0.00% Edwards Lifesciences Corp; 1 Month USD LIBOR
(308,821) Morgan Stanley 26/12/2049 (31,584) 0.00%
Xperi Corp; 1 Month USD LIBOR (224,484) Morgan Stanley 26/12/2049 (31,934) 0.00%
Seaworld Entertainment Inc; 1 Month USD LIBOR
28

SEI Global Investments Fund plc
Unaudited Condensed Financial Statements for the half year ended 31 December 2017
THE SEI GLOBAL SELECT EQUITY FUND
PORTFOLIO OF INVESTMENTS AS AT 31 DECEMBER 2017 (continued)
Nominal
Counterparty Payments made by the Fund; Payments received by the Fund
Termination
Date Value US$ Fund %
Contracts for Differences - 0.08% (30 June 2017: 0.00%) (continued) (181,185) Morgan Stanley 26/12/2049 (32,665) 0.00%
Bj'S Restaurants Inc; 1 Month USD LIBOR (267,566) Morgan Stanley 26/12/2049 (33,057) 0.00%
Wisdomtree Investments Inc; 1 Month USD LIBOR
624,289 Morgan Stanley 26/12/2049 (33,697) 0.00% 1 Month GBP LIBOR; United Drug Plc
(242,951) Morgan Stanley 26/12/2049 (35,648) 0.00%
Sats Ltd; 1 Month USD LIBOR 475,043 Morgan Stanley 26/12/2049 (38,231) 0.00%
1 Month EUR LIBOR; Credit Agricole Sa
(332,552) Morgan Stanley 26/12/2049 (40,906) 0.00%
Zendesk Inc; 1 Month USD LIBOR
(373,604) Morgan Stanley 26/12/2049 (43,104) 0.00%
Societe Bic Sa; 1 Month EUR LIBOR (217,985) Morgan Stanley 26/12/2049 (43,999) 0.00%
Tis Inc; 1 Month JPY LIBOR
(251,308) Morgan Stanley 26/12/2049 (46,535) 0.00% Gmo Payment Gateway Inc; 1 Month JPY LIBOR
(499,340) Morgan Stanley 26/12/2049 (48,088) 0.00%
Dineequity Inc; 1 Month USD LIBOR (499,933) Morgan Stanley 26/12/2049 (50,133) 0.00%
Dynegy Inc; 1 Month USD LIBOR
(245,089) Morgan Stanley 26/12/2049 (50,592) (0.01%) Ebix Inc; 1 Month USD LIBOR
(190,698) Morgan Stanley 26/12/2049 (51,999) (0.01%)
Advanced Drainage Systems In; 1 Month USD LIBOR (375,765) Morgan Stanley 26/12/2049 (53,956) (0.01%)
Maxlinear Inc; 1 Month USD LIBOR
(226,910) Morgan Stanley 26/12/2049 (54,953) (0.01%) Iwg Plc; 1 Month GBP LIBOR
627,492 Morgan Stanley 26/12/2049 (55,414) (0.01%)
1 Month GBP LIBOR; Electrocomponents Plc (237,199) Morgan Stanley 26/12/2049 (55,490) (0.01%)
Greencore Group Plc; 1 Month GBP LIBOR
(243,077) Morgan Stanley 26/12/2049 (59,295) (0.01%) Shutterstock Inc; 1 Month USD LIBOR
(531,646) Morgan Stanley 26/12/2049 (61,721) (0.01%)
Ultimate Software Group Inc; 1 Month USD LIBOR (475,646) Morgan Stanley 26/12/2049 (63,582) (0.01%)
Postnl Nv; 1 Month EUR LIBOR
(459,880) Morgan Stanley 26/12/2049 (69,168) (0.01%) Wesco International Inc; 1 Month USD LIBOR
(322,182) Morgan Stanley 26/12/2049 (69,771) (0.01%)
Shake Shack Inc - Class A; 1 Month USD LIBOR (972,671) Morgan Stanley 26/12/2049 (73,371) (0.01%)
Scotts Miracle-Gro Co; 1 Month USD LIBOR
(444,612) Morgan Stanley 26/12/2049 (87,084) (0.01%) Axon Enterprise Inc; 1 Month USD LIBOR
(968,236) Morgan Stanley 26/12/2049 (150,921) (0.01%)
Viasat Inc; 1 Month USD LIBOR 1,228,995 Morgan Stanley 26/12/2049 (231,972) (0.02%)
1 Month USD LIBOR; General Electric Co (158,022) Morgan Stanley 28/12/2049 11,796 0.00%
Hokkaido Electric Power; 1 Month JPY LIBOR
663,797 Morgan Stanley 30/12/2049 32,060 0.00% 1 Month GBP LIBOR; Royal Dutch Shell Plc-A
(236,726) Morgan Stanley 30/12/2049 25,833 0.00%
Veeva Systems Inc-Class A; 1 Month USD LIBOR (193,242) Morgan Stanley 30/12/2049 13,688 0.00%
Photronics Inc; 1 Month USD LIBOR
(188,774) Morgan Stanley 30/12/2049 12,259 0.00% Healthequity Inc; 1 Month USD LIBOR
(220,124) Morgan Stanley 30/12/2049 (12,436) 0.00%
Grubhub Inc; 1 Month USD LIBOR (204,752) Morgan Stanley 30/12/2049 (13,424) 0.00%
Amtrust Financial Services; 1 Month USD LIBOR
29

SEI Global Investments Fund plc
Unaudited Condensed Financial Statements for the half year ended 31 December 2017
THE SEI GLOBAL SELECT EQUITY FUND
PORTFOLIO OF INVESTMENTS AS AT 31 DECEMBER 2017 (continued)
Nominal
Counterparty Payments made by the Fund; Payments received by the Fund
Termination
Date Value US$ Fund %
Contracts for Differences - 0.08% (30 June 2017: 0.00%) (continued) (337,594) Morgan Stanley 30/12/2049 (18,283) 0.00%
Superior Energy Services Inc; 1 Month USD LIBOR (383,846) Morgan Stanley 30/12/2049 (24,184) 0.00%
Wix.Com Ltd; 1 Month USD LIBOR
(213,748) Morgan Stanley 30/12/2049 (26,396) 0.00% Cleveland-Cliffs Inc; 1 Month USD LIBOR
478,545 Morgan Stanley 31/12/2049 25,792 0.00%
1 Month EUR LIBOR; Elis Sa (326,956) Morgan Stanley 31/12/2049 (12,663) 0.00%
Hang Lung Properties Ltd; 1 Month HKD LIBOR
Total OTC Swaps∞ 1,314,235 0.08%
Financial Swap Assets at Fair Value Through Profit or Loss 4,371,022 0.25%
Financial Swap Liabilities at Fair Value Through Profit or Loss (3,056,787) (0.17%)
Number of
Contracts Description
Expiry Date/
Strike Price
Contract
Value US$ Fund %
OPTIONS
Put Options - 0.02% (30 June 2017: 0.01%)
28,296,798 Currency Option with Citibank January 18/8.32 448,702 0.02% for the right to sell USD/SEK at the
strike price of 8.32, expiring January 2018
23,679,792 Currency Option with Citibank January 18/1.31 228 0.00%
for the right to sell EUR/JPY at the
strike price of 1.31, expiring January 2018
Total OptionsΦ 448,930 0.02%
Financial Option Assets at Fair Value Through Profit or Loss 448,930 0.02%
Financial Option Liabilities at Fair Value Through Profit or Loss – –
Investments 1,675,888,157 94.25%
FORWARD FOREIGN CURRENCY CONTRACTS (0.03%) (30 June 2017: 0.05%)
Maturity
Date
Amount
Bought
Amount
Sold Counterparty
Unrealised
Gain/(Loss)
US$ Fund %
The SEI Global Select Equity Fund Hedged Euro Institutional Class 30/01/2018 303,331 EUR (473,021) AUD Brown Brothers Harriman (5,110) 0.00%
30/01/2018 426,329 EUR (645,750) CAD Brown Brothers Harriman (2,788) 0.00%
30/01/2018 368,183 EUR (428,531) CHF Brown Brothers Harriman 2,229 0.00% 30/01/2018 81,867 EUR (609,409) DKK Brown Brothers Harriman 11 0.00%
30/01/2018 795,271 EUR (701,068) GBP Brown Brothers Harriman 7,310 0.00%
30/01/2018 147,321 EUR (1,353,151) HKD Brown Brothers Harriman 3,994 0.00% 30/01/2018 1,108,811 EUR (147,970,654) JPY Brown Brothers Harriman 18,371 0.00%
30/01/2018 30,979 EUR (304,445) NOK Brown Brothers Harriman 10 0.00%
30/01/2018 6,107 EUR (10,382) NZD Brown Brothers Harriman (34) 0.00% 30/01/2018 125,637 EUR (1,244,663) SEK Brown Brothers Harriman (1,162) 0.00%
30/01/2018 60,166 EUR (95,834) SGD Brown Brothers Harriman 628 0.00%
30/01/2018 7,389,295 EUR (8,700,561) USD Brown Brothers Harriman 187,344 0.01%
210,803 0.01%
The SEI Global Select Equity Fund Hedged Sterling Institutional Class
30/01/2018 952,868 GBP (1,684,959) AUD Brown Brothers Harriman (27,674) 0.00%
30/01/2018 1,339,322 GBP (2,300,234) CAD Brown Brothers Harriman (23,124) 0.00% 30/01/2018 1,156,213 GBP (1,526,483) CHF Brown Brothers Harriman (4,042) 0.00%
30/01/2018 257,080 GBP (2,170,792) DKK Brown Brothers Harriman (2,638) 0.00%
30

SEI Global Investments Fund plc
Unaudited Condensed Financial Statements for the half year ended 31 December 2017
THE SEI GLOBAL SELECT EQUITY FUND
PORTFOLIO OF INVESTMENTS AS AT 31 DECEMBER 2017 (continued)
Maturity
Date
Amount
Bought
Amount
Sold Counterparty
Unrealised
Gain/(Loss)
US$ Fund %
The SEI Global Select Equity Fund Hedged Sterling Institutional Class (continued)
30/01/2018 4,650,014 GBP (5,275,246) EUR Brown Brothers Harriman (49,004) (0.01%) 30/01/2018 462,854 GBP (4,820,095) HKD Brown Brothers Harriman 9,735 0.00%
30/01/2018 3,481,470 GBP (527,091,170) JPY Brown Brothers Harriman 28,622 0.00%
30/01/2018 97,353 GBP (1,084,469) NOK Brown Brothers Harriman (878) 0.00% 30/01/2018 19,187 GBP (36,981) NZD Brown Brothers Harriman (311) 0.00%
30/01/2018 394,540 GBP (4,433,645) SEK Brown Brothers Harriman (8,234) 0.00%
30/01/2018 189,021 GBP (341,372) SGD Brown Brothers Harriman 390 0.00% 30/01/2018 23,215,093 GBP (30,992,512) USD Brown Brothers Harriman 441,147 0.03%
363,989 0.02%
The SEI Global Select Equity Fund Hedged U.S.$ Institutional Class
30/01/2018 425,935 USD (564,390) AUD Brown Brothers Harriman (15,512) 0.00% 30/01/2018 598,497 USD (770,470) CAD Brown Brothers Harriman (16,689) 0.00%
30/01/2018 517,196 USD (511,298) CHF Brown Brothers Harriman (8,544) 0.00%
30/01/2018 114,969 USD (727,099) DKK Brown Brothers Harriman (2,508) 0.00% 30/01/2018 2,079,876 USD (1,766,936) EUR Brown Brothers Harriman (45,487) 0.00%
30/01/2018 1,116,667 USD (836,473) GBP Brown Brothers Harriman (15,948) 0.00%
30/01/2018 206,952 USD (1,614,499) HKD Brown Brothers Harriman 294 0.00% 30/01/2018 1,557,241 USD (176,548,362) JPY Brown Brothers Harriman (12,122) 0.00%
30/01/2018 43,508 USD (363,252) NOK Brown Brothers Harriman (940) 0.00%
30/01/2018 8,577 USD (12,387) NZD Brown Brothers Harriman (229) 0.00% 30/01/2018 176,473 USD (1,485,070) SEK Brown Brothers Harriman (5,227) 0.00%
30/01/2018 84,473 USD (114,345) SGD Brown Brothers Harriman (1,126) 0.00%
(124,038) 0.00%
Portfolio Hedges 02/01/2018 28,296,798 USD (239,757,153) SEK Citibank (986,519) (0.06%)
(986,519) (0.06%)
Total Forward Foreign Currency Contracts∞ (535,765) (0.03%)
Financial Forward Foreign Currency Contract Assets at Fair Value Through Profit or Loss 700,085 0.04%
Financial Forward Foreign Currency Contract Liabilities at Fair Value Through Profit or Loss (1,235,850) (0.07%)
FUTURES 0.07% (30 June 2017: 0.06%)
Number of
Contracts Description Counterparty
Unrealised
Gain/(Loss)
US$ Fund %
499 Australian Dollar US Dollar Currency Futures March 2018 JP Morgan 1,521,830 0.09%
(452) British Pounds Currency Futures March 2018 JP Morgan (313,425) (0.02%)
570 Canadian Dollar Currency Futures March 2018 JP Morgan 1,167,190 0.07% (1,049) Euro FX Currency Futures March 2018 JP Morgan (2,994,350) (0.17%)
(2,736) Euro Stoxx 50 Futures March 2018 JP Morgan 2,631,902 0.15%
(222) FTSE 100 Index Futures March 2018 JP Morgan (634,066) (0.03%) 82 Hang Seng Index Futures January 2018 JP Morgan 202,973 0.01%
(1,130) Japanese Yen Currency Futures March 2018 JP Morgan (750,150) (0.04%)
212 MSCI Singapore Index ETS Futures January 2018 JP Morgan 20,813 0.00% 4 Norwegian Krone Futures March 2018 JP Morgan 13,380 0.00%
(364) OMXS30 Index Futures January 2018 JP Morgan 206,313 0.01%
2,065 S&P 500 E-Mini Futures March 2018 JP Morgan 2,112,245 0.12% 301 S&P TSX 60 Index Futures March 2018 JP Morgan 166,184 0.01%
313 SPI 200 Futures March 2018 JP Morgan 66,541 0.00%
(4) Swedish Krona Currency Futures March 2018 JP Morgan (24,617) 0.00% 185 Swiss Franc Currency Futures March 2018 JP Morgan 398,325 0.02%
(327) Swiss Market Index Futures March 2018 JP Morgan (112,571) (0.01%)
(761) TOPIX Index Futures March 2018 JP Morgan (2,463,382) (0.14%)
Total FuturesΦ 1,215,135 0.07%
Financial Future Assets at Fair Value Through Profit or Loss 8,507,696 0.48%
Financial Future Liabilities at Fair Value Through Profit or Loss (7,292,561) (0.41%)
31

SEI Global Investments Fund plc
Unaudited Condensed Financial Statements for the half year ended 31 December 2017
THE SEI GLOBAL SELECT EQUITY FUND
PORTFOLIO OF INVESTMENTS AS AT 31 DECEMBER 2017 (continued)
Value US$ Fund %
Total Financial Assets at Fair Value Through Profit or Loss 1,688,152,725 94.94%
Total Financial Liabilities at Fair Value Through Profit or Loss (11,585,198) (0.65%)
Portfolio Analysis Total Assets %
* Transferable securities admitted to an official stock exchange listing 1,398,495,662 82.84%
± UCITS and non-UCITS investment schemes 275,626,931 16.33% Φ Financial derivative instruments dealt in on a regulated market 1,664,065 0.10%
∞ OTC financial derivative instruments 778,470 0.05%
† Other transferable securities including those which are unlisted 2,399 0.00%
Total Investments 1,676,567,527 99.32%
The above holdings represent a portion of the investments held at the pool level allocated to the Fund at period end date.
The accompanying notes form an integral part of these financial statements.
32

SEI Global Investments Fund plc Unaudited Condensed Financial Statements for the half year ended 31 December 2017 CONDENSED INCOME STATEMENT
The accompanying notes form an integral part of the financial statements.
Global Select Equity Fund US$
Period From
Global Select Equity Fund US$
Period From 1 July 2017 to 1 July 2016 to Note 31 December 2017 31 December 2016 Income - Continuing Activities Income from Financial Assets at Fair Value through Profit or Loss 1(b) 13,859,940 11,989,648 Bank Interest Income 104,400 27,318 Net Gains/(Losses) on Financial Assets and Financial Liabilities at Fair Value through Profit or Loss 1(b) 185,936,811 111,256,174 199,901,151 123,273,140 Expenses - Continuing Activities Management Fee 1,165,278 895,674 Transaction Fees 45,416 41,151 Operational Expenses 76,742 89,033 Total Operating Expenses 1,287,436 1,025,858 Expense Reimbursement (148,615) (193,253) Net Expenses 1,138,821 832,605 Net Income/(Loss) before Finance Costs 198,762,330 122,440,535 Finance Costs 2 (346,060) (296,055) Profit/(Loss) for the Period 198,416,270 122,144,480 Withholding Tax (2,927,589) (2,340,075) Increase/(Decrease) in Assets for the Period Attributable to Redeemable Participating Shareholders 195,488,681 119,804,405 Income and expenses arose solely from continuing operations. There were no recognised gains and losses other than those dealt with in the condensed income statement.
33

SEI Global Investments Fund plc Unaudited Condensed Financial Statements for the half year ended 31 December 2017 CONDENSED STATEMENT OF FINANCIAL POSITION
The accompanying notes form an integral part of the financial statements.
Global Select Equity
Fund Global Select Equity
Fund US$ US$ As at As at Note 31 December 2017 30 June 2017 Current Assets Financial Assets at Fair Value through Profit or Loss 1(b) 1,688,152,725 1,539,282,734 Cash at Bank 61,502,833 39,819,518 Receivable for Investments Sold 8,925,126 1,347,651 Receivable for Shares Created 30,610 5,077,455 Accrued Income Receivable 1,710,963 2,556,696 Receivable from Broker Margin Accounts 45,401,515 58,185,975 Cash Collateral 6,539,341 6,409,020 Other Assets 24,651 25,490 Total Assets 1,812,287,764 1,652,704,539 Liabilities Due Within One Year Financial Liabilities at Fair Value through Profit or Loss 1(b) 11,585,198 7,074,245 Bank Overdraft 95 95 Payable for Investments Purchased 7,456,274 2,321,789 Payable for Shares Redeemed – 1,018,873 Payable on Broker Margin Accounts 12,251,464 24,078,096 Accrued Expenses Payable and Other Payables 2,760,054 304,941 Liabilities (excluding Net Assets Attributable to Redeemable Participating Shareholders) 34,053,085 34,798,039 Net Assets Attributable to Redeemable Participating Shareholders (at Last Traded Market Prices) 1,778,234,679 1,617,906,500
7
34

SEI Global Investments Fund plc Unaudited Condensed Financial Statements for the half year ended 31 December 2017 CONDENSED STATEMENT OF FINANCIAL POSITION (continued)
The accompanying notes form an integral part of the financial statements.
31 December 2017 30 June 2017 30 June 2016
Net Assets
Net Asset Value per
Share Net Assets
Net Asset Value per
Share Net Assets
Net Asset Value per
Share Global Select Equity Fund Euro Institutional Class US$5,878 EUR10.95 US$5,243 EUR10.28 US$1,215,074 EUR9.57 Hedged Euro Institutional Class US$14,780,313 EUR14.15 US$13,225,709 EUR12.86 US$11,048,210 EUR10.65 Hedged Sterling Institutional Class US$52,325,002 GBP13.26 US$47,702,237 GBP12.01 US$13,466,448 GBP9.87 Hedged U.S.$ Institutional Class* US$17,320,299 US$11.43 US$6,285 US$10.28 – – Sterling Institutional Class US$889,497,779 GBP23.35 US$825,023,755 GBP21.69 US$656,482,544 GBP17.31 Sterling Institutional Distributing Class US$33,893,643 GBP19.69 US$32,553,308 GBP18.48 US$26,748,861 GBP15.00 U.S.$ Institutional C Class US$55,596,134 US$13.57 US$49,727,988 US$12.15 US$28,554,439 US$10.07 U.S.$ Institutional Class US$714,815,631 US$21.57 US$649,661,975 US$19.24 US$443,613,438 US$15.80
* The Fund/Share Class commenced or ceased operations during the current or a prior reporting period/year.
35

SEI Global Investments Fund plc Unaudited Condensed Financial Statements for the half year ended 31 December 2017 CONDENSED STATEMENT OF CHANGES IN NET ASSETS ATTRIBUTABLE TO REDEEMABLE PARTICIPATING SHAREHOLDERS
The accompanying notes form an integral part of the financial statements.
Global Select Equity Fund US$
Period From
Global Select Equity Fund US$
Period From 1 July 2017 to 1 July 2016 to 31 December 2017 31 December 2016 Net Assets Attributable to Redeemable Participating Shareholders at beginning of Period 1,617,906,500 1,181,129,014 Proceeds from Redeemable Participating Shares Issued 123,468,097 174,635,848 Cost of Redeemable Participating Shares Redeemed (158,628,599) (108,288,962) 1,582,745,998 1,247,475,900 Increase/(Decrease) in Assets for the Period Attributable to Redeemable Participating Shareholders 195,488,681 119,804,405 Net Assets Attributable to Redeemable Participating Shareholders at end of Period 1,778,234,679 1,367,280,305
36

SEI Global Investments Fund plc Unaudited Condensed Financial Statements for the half year ended 31 December 2017 CONDENSED STATEMENT OF CHANGES IN NET ASSETS ATTRIBUTABLE TO REDEEMABLE PARTICIPATING SHAREHOLDERS (continued)
The accompanying notes form an integral part of the financial statements.
The number of Redeemable Participating Shares issued and redeemed during the half year ended 31 December 2017 were as follows:
Shares in Issue at 1 July 2017
Shares Issued
Shares Redeemed
Shares in Issue at 31 December 2017
Global Select Equity Fund Euro Institutional Class 447 – – 447 Hedged Euro Institutional Class 901,642 – (31,610) 870,032 Hedged Sterling Institutional Class 3,057,796 247,146 (387,674) 2,917,268 Hedged U.S.$ Institutional Class 612 1,583,053 (67,973) 1,515,692 Sterling Institutional Class 29,279,483 2,634,022 (3,753,429) 28,160,076 Sterling Institutional Distributing Class 1,356,191 13,316 (97,285) 1,272,222 U.S.$ Institutional C Class 4,091,497 6,324 – 4,097,821 U.S.$ Institutional Class 33,762,014 1,168,951 (1,792,985) 33,137,980
The number of Redeemable Participating Shares issued and redeemed during the year ended 30 June 2017 were as follows:
Shares in Issue at 1 July 2016
Shares Issued
Shares Redeemed
Shares in Issue at 30 June 2017
Global Select Equity Fund Euro Institutional Class 114,235 – (113,788) 447 Hedged Euro Institutional Class 933,650 – (32,008) 901,642 Hedged Sterling Institutional Class 1,020,174 2,319,843 (282,221) 3,057,796 Hedged U.S.$ Institutional Class* – 612 – 612 Sterling Institutional Class 28,366,735 5,673,338 (4,760,590) 29,279,483 Sterling Institutional Distributing Class 1,334,150 22,041 – 1,356,191 U.S.$ Institutional C Class 2,836,089 1,255,408 – 4,091,497 U.S.$ Institutional Class 28,068,850 8,158,175 (2,465,011) 33,762,014
* The Fund/Share Class commenced or ceased operations during the current or a prior reporting period/year.
37

SEI Global Investments Fund plc Unaudited Condensed Financial Statements for the half year ended 31 December 2017
NOTES TO THE CONDENSED FINANCIAL STATEMENTS FOR THE HALF YEAR ENDED 31 DECEMBER 2017 1. Accounting Policies
The significant accounting policies and estimation techniques adopted by the Company are as follows:
a) Basis of Presentation of Financial Statements The financial statements are prepared in accordance with accounting standards generally accepted in Ireland, comprising the Companies Act 2014 (as amended) and the European Communities (Undertakings for Collective Investment in Transferable Securities) Regulations 2011, as amended (the “UCITS Regulations”). Accounting standards generally accepted in Ireland in preparing financial statements giving a true and fair view are those published by the Institute of Chartered Accountants in Ireland and issued by the Financial Reporting Council (“FRC”). The Financial Reporting Standard applicable in the United Kingdom and Republic of Ireland (“FRS 102”) is effective for accounting periods beginning on or after 01 July 2015. FRS 104 “Interim financial reporting” (“FRS 104”) is effective for interim reporting periods commencing on or after 01 January 2015. These unaudited condensed financial statements have been prepared in accordance with the standard for interim financial statements, FRS 104, and should be read in conjunction with the audited financial statements for the year ended 30 June 2017. For the audited financial statements for the year ended 30 June 2017, securities which were quoted, listed or traded on an exchange were valued for financial reporting purposes at the current bid or ask price, at the valuation point. These reclassifications have had no impact on reported Shareholder dealing net assets. The format and certain wordings of the financial statements have been adapted from those contained in the Companies Act 2014 (as amended) so that, in the opinion of the Directors, they more appropriately reflect the nature of the Company’s business as an investment Fund. The Company has availed of the exemption available to open-ended investments funds under FRS 102 not to prepare a cash flow statement.
The financial statements are prepared under the historical cost convention as modified by the revaluation of financial assets and financial liabilities held at fair value through profit or loss. The financial statements are based on the valuations prepared at 4.00pm Eastern Time on 29 December 2017 (“Valuation Point”). The Administrator operates T+1 trading, therefore, investment transactions and capital transactions included in the valuations are up to close of business on 28 December 2017.
b) Financial Assets and Financial Liabilities at Fair Value through Profit or Loss Realised Gains and Losses on Financial Assets and Financial Liabilities at Fair Value through Profit or Loss Realised gains and losses on financial assets and financial liabilities at fair value through profit or loss are calculated based on a FIFO book cost. The associated foreign exchange movement between the date of purchase and the date of sale on the sale of financial assets and financial liabilities is included in “Net Gains/(Losses) on Financial Assets and Financial Liabilities at Fair Value through Profit or Loss” in the Condensed Income Statement. Unlisted Securities The fair value of any instrument that is not listed or dealt with on a market shall be the probable realisation value of the investment, estimated with care and in good faith by the Directors in consultation with the Administrator or by a competent person, firm or corporation appointed for such purpose by the Depositary. A Fund may have investments in securities in respect of which there may be only a small number of counterparties or brokers prepared to make a market. The single broker prices used at the year end have been sourced from brokers who are market specialists in the respective instruments and are the best estimate of fair value as at the period end date. However, it may not always be possible to trade the securities held at the stated mark with the broker that provided the period end price. Had these investments been sold at the period end proceeds may have differed from this fair value and this difference could be material. Investment Funds Shares or units in open-ended investment funds are valued by reference to the latest available net asset value of the shares or units of the relevant investment funds priced by the underlying Administrator and provider by a vendor. Shares or units in closed ended investment funds are valued by reference to the latest available net asset value of the shares or units of the relevant investment funds priced by the underlying administrator and provided by a vendor. If such prices are unavailable and if appropriate in the opinion of the Directors, shares or units in investment funds are valued at the estimated net asset value of the shares or units as provided by the underlying Administrator. Exchange Traded Derivative Instruments Exchange traded derivative instruments are valued at the close of the regular trading session of the relevant exchange on the relevant Business Day at the settlement price for such instruments on such markets. If the settlement price of an exchange traded derivative instrument is not available, the value of such instrument shall be the probable realisation value estimated with care and in good faith by the Directors or the Administrator or other competent person approved for the purpose by the Depositary.
38

SEI Global Investments Fund plc Unaudited Condensed Financial Statements for the half year ended 31 December 2017
NOTES TO THE CONDENSED FINANCIAL STATEMENTS FOR THE HALF YEAR ENDED 31 DECEMBER 2017 (continued) 1. Accounting Policies (continued)
b) Financial Assets and Financial Liabilities at Fair Value through Profit or Loss (continued)
Futures Contracts Upon entering into a futures contract, the Fund is required to deposit with its futures brokers, an amount of cash or US government obligations in accordance with the initial margin requirements of the brokers or exchange. Futures contracts are valued using quoted daily settlement prices established by the exchange on which they trade. The Fund and the broker agree to exchange an amount of cash equal to the daily fluctuations in the value of the futures contract (“variation margin”). For open futures contracts, changes in the value of the contract are recognised as unrealised gains or losses by “marking-to-market” the value of the contract at the statement of financial position date. When the contract is closed, the difference between the proceeds (or cost) of the closing transactions and the original transaction is recorded as a realised gain or loss in the Condensed Income Statement. Inflation-Indexed Bonds The Fund may invest in inflation-indexed bonds. Inflation-indexed bonds are fixed-income securities whose principal value is periodically adjusted to the rate of inflation. The interest rate on these bonds is generally fixed at issuance at a rate lower than typical bonds. Over the life of an inflation-indexed bond, however, interest will be paid based on a principal value, which is adjusted for inflation. Any increase in the principal amount of an inflation-indexed bond will be included in the Condensed Income Statement, even though investors do not receive their principal until maturity. Inflation-indexed bonds are valued using a pricing vendor. Warrants Where a warrant is purchased, the amount paid is recorded as an investment and is subsequently adjusted to the value of the warrant purchased. Warrants are expected to have similar characteristics as the underlying equity security. If the warrant is actively traded then the market price is used, otherwise the intrinsic value of the underlying equity price and the warrant strike price or modified black scholes derived value is used to arrive at an appropriate market value. Forward Foreign Currency Contracts The Fund may enter into three types of forward foreign currency contracts: class level hedging, foreign security hedging, and security transaction hedging. The unrealised gain or loss on open forward exchange contracts is calculated by reference to the difference between the contracted rate and the rate to close out the contract. Realised gains or losses include net gains on contracts which have been settled or offset by other contracts. For foreign security hedges and security transaction level hedges, realised and unrealised gains and losses are allocated at fund level. For class level hedges the realised and unrealised gains and losses are allocated solely to the relevant Share Classes. Contracts for Differences The Fund may invest in contracts for differences. Contracts for differences are futures or options contracts which are settled through cash payments, rather than the physical delivery of the underlying assets or securities. The rate of return will be paid or received by the Fund and it will reflect the general composition of the assets of the Fund for a rate of return which will generally be at a fixed rate above or below LIBOR or another index. Contracts for differences are marked-to-market daily based upon quotations received from counterparties or valued using a pricing service and in other cases based upon calculations using valuation models. During the period that the contract for differences is open, changes in the value of the contract are recognised as unrealised gains or losses and by marking to market at each valuation date in order to reflect the value of the underlying security. Realised gains or losses at the closure of the contract are equal to the difference between the value of the contract for differences at the time it was opened (including any financial charges) and the value at the time it was closed. Dividends (net of withholding taxes) attributable to open contracts for differences are deemed to be dividends receivable at the end of the period. Payments received or made are recorded as realised gains or losses. The Company discloses outstanding contracts for differences at the half year ended in the Portfolio of Investments.
c) Foreign Exchange Translation Functional and Presentation Currency The functional and presentation currency of The SEI Global Select Equity Fund is US Dollar (US$). This is considered to be the currency of the primary economic environment of the Fund. The presentation currency of The SEI Global Investments Fund plc is the US Dollar (US$). Transactions and Balances Assets and liabilities denominated in currencies other than the functional currency of the Fund are translated into the functional currency at the exchange rates ruling at the statement of financial position date. Transactions in currencies other than the functional currency of the Fund are translated into the functional currency at the exchange rates ruling at the dates of the transactions. Gains and losses on foreign exchange transactions are recognised in the Condensed Income Statement in determining the result for the half year ended 31 December 2017 and 31 December 2016. Proceeds from subscriptions and amounts paid on redemption of Redeemable Participating Shares are translated at the rates prevailing at the dates of the transactions. The Condensed Statement of Financial Position is translated using exchange rates at the period end and the Condensed Income Statement and Condensed Statement of Changes in Net Assets Attributable to Redeemable Participating Shareholders are translated at an average rate over the period for inclusion in the combined financial statements of the Company. The resulting notional currency gain/(loss) and the notional currency gain/(loss) on retranslation of the opening net assets is included in the Condensed Statement of Changes in Net Assets Attributable to Redeemable Participating Shareholders. The method of translation has no effect on the value of net assets allocated to the individual Fund.
39

SEI Global Investments Fund plc Unaudited Condensed Financial Statements for the half year ended 31 December 2017
NOTES TO THE CONDENSED FINANCIAL STATEMENTS FOR THE HALF YEAR ENDED 31 DECEMBER 2017 (continued)
1. Accounting Policies (continued) d) Collateral
Securitised collateral which is provided to the broker is annotated on the relevant security in the Portfolio of Investments. Securitised collateral which is provided to the Fund is disclosed in Note 7. Cash collateral which is provided to the broker is recorded as an asset to the Fund and included under “Cash Collateral”, and is valued at its fair value on the Condensed Statement of Financial Position. Cash collateral held is unrestricted and held in a segregated account in the individual Fund’s name. A related liability to repay the collateral is recorded as a liability on the Condensed Statement of Financial Position under “Cash Collateral Payable” and is also valued at its fair value and disclosed in Note 7. All types of collateral are treated in line with the reporting requirements of FRS 102 and are governed by the terms and conditions of individual ISDA Master Agreements.
2. Finance Costs
Distributions and Interest
Distributions take account of income received on the creation of shares and income deducted on the cancellation of shares.
Global Select Equity Fund
31 December 2017
US$ 31 December 2016
US$ Distribution (327,819) (293,894) Add: Income deducted/received on cancellation/issue of shares – – Net Distribution for the period (327,819) (293,894) Interest (18,241) (2,161) Total Finance Costs (346,060) (296,055)
3. Soft Commission Arrangements
The Portfolio Managers have not entered into soft commission arrangements with brokers during the half year ended 31 December 2017. Subject to compliance with the requirement to select brokers that provide best execution to the Company, or any such further requirements as may be imposed on the Company by the Central Bank, the Investment Adviser and Portfolio Managers, in managing the assets of the Fund, may direct a substantial portion of a Fund’s brokerage to an affiliate of the Investment Adviser.
4. Exchange Rates The US$ exchange rates at 31 December 2017 and 30 June 2017 used in this report, are as follows:
31 December 2017 30 June 2017 31 December 2017 30 June 2017
AUD 1.2785 1.3037 ILS 3.4717 3.4897 CAD 1.2530 1.2987 JPY 112.6500 112.3600 CHF 0.9745 0.9577 NOK 8.1794 8.3767 CZK 21.2600 22.8969 NZD 1.4061 1.3657 DKK 6.2004 6.5188 PLN 3.4748 3.7083 EUR 0.8328 0.8768 RON 3.8880 3.9955 GBP 0.7392 0.7699 SEK 8.1875 8.4346 HKD 7.8173 7.8065 SGD 1.3364 1.3769 HRK 6.1995 6.4976 TRY 3.7916 3.5226 HUF 258.3320 271.0097 ZAR 12.3800 13.1025
40

SEI Global Investments Fund plc Unaudited Condensed Financial Statements for the half year ended 31 December 2017
NOTES TO THE CONDENSED FINANCIAL STATEMENTS FOR THE HALF YEAR ENDED 31 DECEMBER 2017 (continued) 5. Risk Management Disclosures
In pursuing its investment objectives, the Company is exposed to a variety of financial risks: market risk (including price risk, currency risk and interest rate risk), credit risk and liquidity risk. The Company’s overall risk management programme focuses on the unpredictability of financial markets and seeks to minimise potential adverse effects on the Fund’s financial performance. The investment objectives of each Fund are specified in the Company’s Prospectus. To achieve its investment objectives, the Company invests in a variety of traded and over-the-counter debt, equity and money market securities. The Company also uses derivative financial instruments to moderate certain risk exposures and to facilitate certain portfolio transactions. Active Management Risk The Fund of the Company is “multi-managed”. Rather than managing the risk of individual securities directly, the Investment Adviser engages in extensive due diligence (“manager selection”) to determine appropriate Portfolio Managers for the Fund. The manager selection process encompasses conference calls, independent research and manager visits to determine the Portfolio Managers that the Investment Adviser believes to have superior security selection and risk management skills within their mandates. Each Portfolio Manager is responsible for managing its portion of the Fund in accordance with the investment policies and investment restrictions of the Fund as specified in the Company’s Prospectus. The Investment Adviser monitors each Portfolio Manager’s adherence to these policies through various reports, questionnaires, telephone conference calls and face-to-face meetings. The Investment Adviser meets with each Portfolio Manager at least semi-annually by conference call or in person. On-site meetings with each Portfolio Manager are conducted on an annual basis. The Company seeks to control the active management risk of the Fund with its multi-manager structure. The Portfolio Managers of each Fund utilise a variety of investment strategies. By diversifying Portfolio Managers, the Investment Adviser seeks to control the active management risk of the Fund. The Investment Adviser utilises various analytical techniques; and its qualitative judgement, to determine the appropriate allocation of assets to each Portfolio Manager. The Investment Adviser periodically monitors the diversification benefits of the Fund’s multi-manager structure.
a) Market Price Risk The Company takes positions in financial instruments, including derivatives, to take advantage of short-term market movements in equity and fixed income markets. The Funds may buy or sell call or put options, financial futures, and other derivative instruments within limits defined in the Prospectus. The Company’s equity, debt, and derivative financial instruments are susceptible to market price risk arising from uncertainties about future prices of the instruments. All security investments present a risk of loss of capital. Except for written options, the maximum risk resulting from financial instruments is determined by the fair value of the financial instruments.
As 31 December 2017, the Company’s market risk is affected by three main components: changes in actual market prices, foreign currency movements and interest rate movements. To measure market price risk, the Investment Adviser computes the VaR for each Fund. The VaR methodology and limitations are described below. VaR Methodology VaR is a method of assessing risk that reflects the interdependencies between market price risk, currency risk and interest rate risk for the financial instruments held by the Funds. Absolute VaR measures the maximum loss that is not expected to be exceeded with a particular level of confidence over a particular period of time. For example, if a Fund has an absolute VaR of 5%, this implies that the maximum expected loss over a one-day period is 5% with a 99% level of confidence. Daily, the Investment Adviser calculates the VaR for each Fund with a 99% level of confidence over a one-day time horizon. The Investment Adviser utilises a commercially available risk management system for calculating the relative VaR for each Fund. The risk management system employs a factor model approach to calculate VaR and Relative VaR. The factor model identifies the common sources of risk, or “factors,” that systematically affect asset returns. The system applies the factor exposures for the current holdings of each Fund, the volatility of the risk factors, the correlations between the risk factors, and the residual unsystematic risk of each security to estimate the risk of the Fund over a one-day holding period. The historical period for calculating the correlations and volatilities is two years. The one-tail confidence level is 99%. VaR Limitations The VaR methodology used by the Investment Adviser is subject to several limitations. First, VaR is based on a model of stock price returns which uses risk factors. To the extent that there are missing risk factors, mis-specified risk factors, or risk factors which are not predictive, the VaR may not be indicative of future risk. Also, the returns to various risk factors are not directly observable in the market, and must be estimated using statistical techniques. To the extent that these estimates may be imprecise, the VaR may not be indicative of future risk. In addition, the co-variance between the risk factors is estimated over a particular historical time period. To the extent that the future time period may be different from the historical time period, the VaR may not be indicative of future risk. For these reasons, VaR may be more useful as a relative measure of risk among Funds, rather than as an absolute measure of risk. The Company attempts to manage market price risk through its investment policies as specified in the Company’s Prospectus and by evaluating each Portfolio Manager’s risk management capabilities as a criterion for appointment. Each Portfolio Manager has its own methodology for monitoring and managing market risk with respect to the assets managed by it, which is tailored to that Portfolio Manager’s own specific investment style and approach to risk management. The Investment Adviser monitors a Portfolio Manager’s adherence to the applicable investment policies through various reports, questionnaires, telephone conference calls and face-to-face meetings.
41

SEI Global Investments Fund plc Unaudited Condensed Financial Statements for the half year ended 31 December 2017
NOTES TO THE CONDENSED FINANCIAL STATEMENTS FOR THE HALF YEAR ENDED 31 DECEMBER 2017 (continued)
5. Risk Management Disclosures (continued)
b) Currency Risk
Currency risk arises on financial instruments that are denominated in a foreign currency, i.e. in a currency other than the functional currency in which they are measured. For the purpose of FRS 104, currency risk does not arise from financial instruments that are non-monetary items or from financial instruments denominated in the functional currency. FRS 104 considers the foreign exchange exposure relating to non-monetary assets and liabilities to be a component of market price risk not foreign currency risk.
The Company attempts to manage currency risk through its investment policies and investment restrictions as specified in the Company’s Prospectus and by evaluating each Portfolio Manager’s currency risk management capabilities as a criterion for appointment, where appropriate. In addition, the Portfolio Manager performs stress tests to measure the impact of currency fluctuations on the Company’s Funds. The Portfolio Manager may seek to hedge these risks by investing in currencies, currency futures contracts and options on currency futures contracts, as specified in the Company’s Prospectus.
c) Interest Rate Risk
Interest rate risk is the risk that the fair value or future cash flows of a financial instrument will fluctuate because of changes in market interest rates. The Company has one Fund at 31 December 2017 (30 June 2017: one Fund). The majority of the assets and liabilities of the Fund are invested in equity securities which are non-interest bearing. As a result, this Fund is not subject to significant amounts of risk due to fluctuations in the prevailing levels of market interest rates. Any excess cash and cash equivalents are invested at short-term market interest rates. The cash reserves are generally equitised using futures or swaps in order to obtain equity market exposure. The Fund did not invest in any swaps as at the half year end.
The Company attempts to manage interest rate risk through its investment policies and investment restrictions as specified in the Company’s Prospectus and by evaluating the Portfolio Manager’s interest rate risk management capabilities as a criterion for appointment, where appropriate. In addition, the Portfolio Manager performs stress tests to measure the impact of changes in interest rates on the Company’s Fund. The Portfolio Manager may seek to reduce these risks by modifying the allocation of capital to Portfolio Managers within this Fund.
d) Credit Risk
Credit risk is the risk that the counterparty to a transaction or an issuer of a financial instrument will cause a financial loss to a Fund by failing to repay an obligation which may arise by purchasing debt instruments, placing deposits, and entering into derivative contracts. Credit risk is generally more significant for those Funds that invest primarily in debt instruments, or that use derivative contracts to a material degree. The Fund may have exposure to credit risk through its investments in other investment funds with themselves may have credit risk exposure.
For cash accounts, funds deposited are liabilities of the banks, thus creating a debtor-creditor relationship between the bank and the Company. Cash accounts opened on the books of Brown Brothers Harriman & Co. (“BBH”) are obligations of BBH while cash accounts opened on the books of a third party cash correspondent bank, sub-custodian or a broker (collectively, “agency accounts”) are obligations of the agent. For safekeeping of security assets, BBH’s policy is to maintain segregated client security accounts on its books and on the books of its sub-custodians. While BBH is responsible for exercising reasonable care in the administration of agency cash accounts, it is not liable for their repayment in the event the sub-custodian, by reason of its bankruptcy, insolvency or otherwise, fails to make repayment.
BBH performs both initial and ongoing due diligence on the sub-custodians in its global custody network. Such reviews include an assessment of the sub-custodian’s financial strength and general reputation and standing and, at a minimum, meet the due diligence requirements established by applicable law. The financial analysis is focused on the sub-custodian bank’s capital adequacy, asset quality, financial flexibility and strength, management expertise, earnings, and liquidity as key indicators of its financial standing in the market. These reviews are not audits. The Company may invest in debt instruments that may receive a credit rating from a well-known rating agency, or if unrated, may be assigned a credit rating using an approach which is consistent with that used by rating agencies.
All broker transactions in listed securities are settled upon delivery to the Company’s Depositary. The risk of default is considered minimal, as delivery of securities sold is only made once the Company’s Depositary has received payment from the broker. Payment to a broker is made on a purchase once the securities have been received by the Company’s Depositary. The trade will fail if either party fails to meet its obligation.
The Funds limit their exposure to credit losses on derivative instruments by limiting their exposure to counterparties in accordance with the investment restrictions specified in the Company’s Prospectus. Counterparties must be subject to prudential supervision and meet certain requirements as specified by the Central Bank. The Investment Adviser requires each Portfolio Manager to complete a quarterly questionnaire to verify compliance with the investment restrictions on counterparties.
The Funds also limit their exposure to credit losses on derivative instruments by entering into master netting arrangements with counterparties. Master netting arrangements do not result in an offset of Statement of Financial Position assets and liabilities, as transactions are usually settled on a gross basis. However, the credit risk associated with favourable contracts is reduced by a master netting arrangement to the extent that if an event of default occurs, all amounts with the counterparty are terminated and settled on a net basis. A Fund’s overall exposure to credit risk on derivative instruments subject to a master netting arrangement can change substantially within a short period, as it is affected by each transaction subject to the arrangement.
42

SEI Global Investments Fund plc Unaudited Condensed Financial Statements for the half year ended 31 December 2017
NOTES TO THE CONDENSED FINANCIAL STATEMENTS FOR THE HALF YEAR ENDED 31 DECEMBER 2017 (continued) 5. Risk Management Disclosures (continued) d) Credit Risk (continued)
The Company attempts to manage credit risk through its investment policies and investment restrictions as specified in the Company’s Prospectus and by evaluating each Portfolio Manager’s credit analysis capabilities as a criterion for appointment, where appropriate. Each Portfolio Manager that invests in debt instruments or derivative contracts has its own methodology for monitoring and managing credit risk with respect to the assets managed by it, which is tailored to that Portfolio Manager’s own specific investment style and approach to risk management. The Investment Adviser monitors a Portfolio Manager’s adherence to a Fund’s policies and restrictions through various reports, questionnaires, telephone conference calls and on-site meetings.
e) Liquidity Risk
Liquidity risk is the risk that a Fund will encounter difficulty in meeting obligations associated with financial liabilities. Such obligations may arise from daily cash redemptions or from derivative contracts such as options, futures and swaps. The Company is exposed to daily cash redemptions of Redeemable Participating Shares. As specified in the Company’s Prospectus, it therefore invests a majority of its assets in investments that are traded in an active market and which can be readily liquidated. The Company may, from time to time, invest in derivative contracts traded over-the-counter, which are not traded in an organised market and may be illiquid. As a result, the Company may not be able to liquidate quickly its investments in these instruments at an amount close to their fair value to meet its liquidity requirements or to respond to specific events such as deterioration in the creditworthiness of any particular issuer. The Company limits the use of derivative instruments which are not readily marketable, as specified in the Company’s Prospectus.
To manage liquidity risk, the Company also reserves the right to limit the amount of Shares that may be redeemed by an individual Shareholder. If the aggregate redemption requests on any Dealing Day equal or exceed 10% or more of the outstanding Shares of any Series in issue or deemed to be in issue, the Directors may elect to restrict the total number of Shares to be redeemed to 10% of the outstanding Shares in issue in that Series on that Dealing Day, in which case all redemption requests will be reduced pro rata to the size of the request.
f) Fair Value Estimation
FRS 102 on “Fair Value Disclosure” requires disclosure relating to the fair value hierarchy in which fair value measurements are categorised for assets and liabilities. The disclosures are based on a three-level fair value hierarchy for the inputs used in valuation techniques to measure fair value. Amendments were made to this FRS, revising the disclosure requirements for financial institutions. An entity shall apply these amendments for accounting periods beginning on or after 01 January 2017. This amendment has been adopted in the preparation of these financial statements. The Company has classified fair value measurements using a fair value hierarchy that reflects the significance of the inputs used in making the measurements. The fair value hierarchy has the following levels:
(i) Level 1: Investments, whose values are based on quoted market prices in active markets, and therefore classified within Level 1,
include active listed equities, exchange traded investment funds and REITs. Quoted prices for these instruments are not adjusted.
(ii) Level 2: Financial instruments that trade in markets that are not considered to be active but are valued based on quoted market prices, dealer quotations or alternative pricing sources supported by observable inputs are classified within Level 2. These include investment funds, investment grade corporate bonds, U.S. Government Treasury Bills, certain non-U.S. sovereign obligations, listed equities and over-the-counter derivatives. As Level 2 investments include positions that are not traded in active markets and/or are subject to transfer restrictions, valuations may be adjusted to reflect illiquidity and/or non-transferability, which are generally based on available market information.
(iii) Level 3: Investments classified within Level 3 have significant unobservable inputs, as they trade infrequently. These include
equities and a delisted equity which is no longer traded. Pricing inputs are unobservable for the investment and include situations where there is little, if any, market activity for the instrument. The inputs into the determination of fair value require significant management judgement or estimation. As observable prices are not available for these securities, the Fund has used valuation techniques to derive the fair value.
The level in the fair value hierarchy within which the fair value measurement is categorised in its entirety is determined on the basis of the lowest level input that is significant to the fair value measurement of the instrument in its entirety. For this purpose, the significance of an input is assessed against the fair value measurement of the instrument in its entirety. If a fair value measurement uses observable inputs that require significant adjustment based on unobservable inputs, that measurement is a Level 3 measurement. Assessing the significance of a particular input to the fair value measurement in its entirety requires judgement, considering factors specific to the financial asset or liability. The determination of what constitutes “observable” requires significant judgement by the Directors in consultation with the Investment Adviser. The Directors consider observable data to be that market data that is readily available, regularly distributed or updated, reliable and verifiable, not proprietary, and provided by independent sources that are actively involved in the relevant market.
43

SEI Global Investments Fund plc Unaudited Condensed Financial Statements for the half year ended 31 December 2017
NOTES TO THE CONDENSED FINANCIAL STATEMENTS FOR THE HALF YEAR ENDED 31 DECEMBER 2017 (continued) 5. Risk Management Disclosures (continued) f) Fair Value Estimation (continued)
The tables below provide an analysis within the fair value hierarchy of the Company’s financial assets and financial liabilities, measured at fair value at 31 December 2017 and 30 June 2017:
The SEI Global Select Equity Fund Level 1 Level 2 Level 3 Total 31 December 2017 Fair Value
US$ US$ US$ US$ Financial Assets at Fair Value Through Profit or Loss Equities 1,390,402,353 6,743,900 1,351,808 1,398,498,061 Investment Funds 32,638,055 242,988,876 – 275,626,931 Options – 448,930 – 448,930 Warrants – – 0* 0 Swaps – 4,371,022 – 4,371,022 Futures Contracts 8,507,696 – – 8,507,696 Forward Foreign Currency Contracts – 700,085 – 700,085
1,431,548,104 255,252,813 1,351,808 1,688,152,725
Financial Liabilities at Fair Value Through Profit or Loss Swaps – (3,056,787) – (3,056,787) Forward Foreign Currency Contracts – (1,235,850) – (1,235,850) Futures Contracts (7,292,561) – – (7,292,561)
(7,292,561) (4,292,637) – (11,585,198)
The SEI Global Select Equity Fund Level 1 Level 2 Level 3 Total 30 June 2017 Fair Value US$ US$ US$ US$ Financial Assets at Fair Value Through Profit or Loss Equities 1,294,893,453 4,414,610 2,473 1,299,310,536 Investment Funds 16,257,545 214,658,510 – 230,916,055 Options – 223,273 – 223,273 Warrants – – 0* 0 Forward Foreign Currency Contracts – 906,509 – 906,509 Futures Contracts 7,926,361 – – 7,926,361 1,319,077,359 220,202,902 2,473 1,539,282,734 Financial Liabilities at Fair Value Through Profit or Loss Forward Foreign Currency Contracts – (40,864) – (40,864) Futures Contracts (7,033,381) – – (7,033,381) (7,033,381) (40,864) – (7,074,245)
* Represents the interest in securities that were determined to have a value of zero as at 31 December 2017 and 30 June 2017. 6. Efficient Portfolio Management
The Company may employ investment techniques and use financial derivative instruments (such as futures contracts, forward foreign currency contracts, options and swaps) for efficient portfolio management of the assets of any Fund including hedging against market movements, currency exchange or interest rate risks subject to the conditions and within the limits laid down by the Central Bank and the Prospectus. The efficient portfolio management purposes for which the Company intends to employ financial derivative instruments and such investment techniques are the reductions of risk, reduction of cost and the generation of additional capital or income for the relevant Fund with an appropriate level of risk, taking into account the risk profile of the Fund and the general Central Bank UCITS Regulations. Any such investment technique or use of financial derivative instruments must be one which is reasonably believed by the Investment Adviser or Portfolio Managers to be economically appropriate in that they are realised in a cost-effective way. The Company engaged in securities lending during the half year ended 31 December 2017, details of which are included in a separate Note. Direct and indirect costs associated with efficient portfolio management techniques are not readily identifiable.
7. Collateral Cash received as collateral is recorded as an asset on the Condensed Statement of Financial Position and is valued at its fair value. A related liability to repay the collateral is recorded as a liability on the Condensed Statement of Financial Position and is also valued at its fair value in line with the requirement of FRS 102. There was no cash provided to the Fund as at 31 December 2017 and 30 June 2017. There was no securities provided to the Fund as collateral as at 31 December 2017 and 30 June 2017.
44
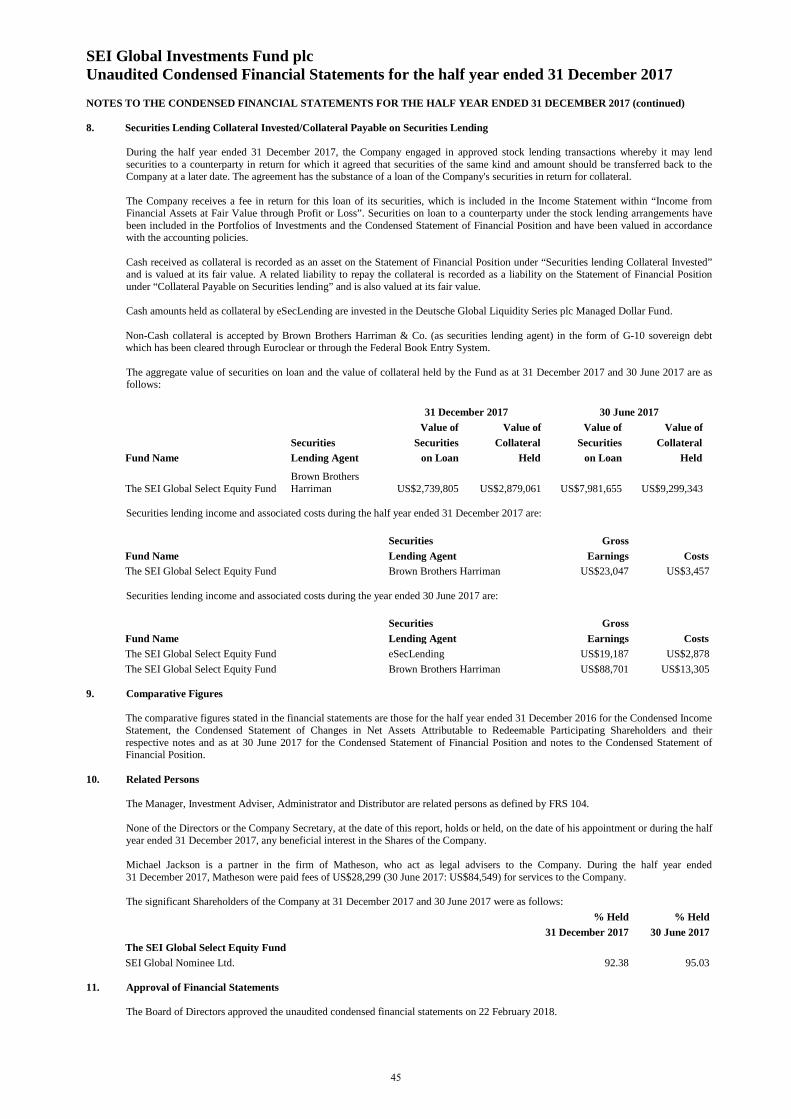
SEI Global Investments Fund plc Unaudited Condensed Financial Statements for the half year ended 31 December 2017
NOTES TO THE CONDENSED FINANCIAL STATEMENTS FOR THE HALF YEAR ENDED 31 DECEMBER 2017 (continued)
8. Securities Lending Collateral Invested/Collateral Payable on Securities Lending
During the half year ended 31 December 2017, the Company engaged in approved stock lending transactions whereby it may lend securities to a counterparty in return for which it agreed that securities of the same kind and amount should be transferred back to the Company at a later date. The agreement has the substance of a loan of the Company's securities in return for collateral.
The Company receives a fee in return for this loan of its securities, which is included in the Income Statement within “Income from Financial Assets at Fair Value through Profit or Loss”. Securities on loan to a counterparty under the stock lending arrangements have been included in the Portfolios of Investments and the Condensed Statement of Financial Position and have been valued in accordance with the accounting policies. Cash received as collateral is recorded as an asset on the Statement of Financial Position under “Securities lending Collateral Invested” and is valued at its fair value. A related liability to repay the collateral is recorded as a liability on the Statement of Financial Position under “Collateral Payable on Securities lending” and is also valued at its fair value.
Cash amounts held as collateral by eSecLending are invested in the Deutsche Global Liquidity Series plc Managed Dollar Fund.
Non-Cash collateral is accepted by Brown Brothers Harriman & Co. (as securities lending agent) in the form of G-10 sovereign debt which has been cleared through Euroclear or through the Federal Book Entry System.
The aggregate value of securities on loan and the value of collateral held by the Fund as at 31 December 2017 and 30 June 2017 are as follows: 31 December 2017 30 June 2017 Value of Value of Value of Value of Securities Securities Collateral Securities Collateral Fund Name Lending Agent on Loan Held on Loan Held
The SEI Global Select Equity Fund Brown Brothers Harriman US$2,739,805 US$2,879,061 US$7,981,655 US$9,299,343
Securities lending income and associated costs during the half year ended 31 December 2017 are:
Securities Gross Fund Name Lending Agent Earnings Costs The SEI Global Select Equity Fund Brown Brothers Harriman US$23,047 US$3,457 Securities lending income and associated costs during the year ended 30 June 2017 are: Securities Gross Fund Name Lending Agent Earnings Costs The SEI Global Select Equity Fund eSecLending US$19,187 US$2,878 The SEI Global Select Equity Fund Brown Brothers Harriman US$88,701 US$13,305
9. Comparative Figures
The comparative figures stated in the financial statements are those for the half year ended 31 December 2016 for the Condensed Income Statement, the Condensed Statement of Changes in Net Assets Attributable to Redeemable Participating Shareholders and their respective notes and as at 30 June 2017 for the Condensed Statement of Financial Position and notes to the Condensed Statement of Financial Position.
10. Related Persons The Manager, Investment Adviser, Administrator and Distributor are related persons as defined by FRS 104.
None of the Directors or the Company Secretary, at the date of this report, holds or held, on the date of his appointment or during the half year ended 31 December 2017, any beneficial interest in the Shares of the Company.
Michael Jackson is a partner in the firm of Matheson, who act as legal advisers to the Company. During the half year ended 31 December 2017, Matheson were paid fees of US$28,299 (30 June 2017: US$84,549) for services to the Company. The significant Shareholders of the Company at 31 December 2017 and 30 June 2017 were as follows: % Held % Held 31 December 2017 30 June 2017 The SEI Global Select Equity Fund SEI Global Nominee Ltd. 92.38 95.03
11. Approval of Financial Statements
The Board of Directors approved the unaudited condensed financial statements on 22 February 2018.
45

SEI Global Investments Fund plc Unaudited Condensed Financial Statements for the half year ended 31 December 2017
APPENDIX Appendix I – Remuneration Disclosures SEI Investments Global, Limited (the “Management Company”) has implemented a remuneration policy (the “Remuneration Policy”) which is in line with the provisions of the UCITS Regulations and in accordance with the European Securities and Markets Authority Guidelines on Sound Remuneration policies under the UCITS Directive (ESMA/2016/575) (“ESMA Guidelines”). The Remuneration Policy was adopted by the board of directors of the Management Company (the “Board”) on 19 December 2016. The Remuneration Policy is aligned with the business strategy, objectives, values and interests of the Management Company, the Fund and investors in the Fund and the policy includes measures to manage conflicts of interests.
The Management Company is controlled and managed by its Board, but does not currently have any employees. Accordingly, the identified staff for the purpose of the Remuneration Policy are the members of the Board. The Board has adopted the delegation model which leverages off the skills, experience, and knowledge of specialised staff employed by the service providers to the Management Company and the Fund who perform the day-to-day specific functions and are subject to the ongoing supervision and monitoring by the board. The Board considers that the extent of delegation by the Management Company of investment management functions does not exceed, by a substantial margin, the investment management functions performed by the Management Company itself.
The Remuneration Policy is aimed at ensuring that any relevant conflicts of interest can be managed appropriately at all times and sets out practices for those categories of staff, including senior management, risk takers, control functions, and any employees receiving total remuneration that takes them into the same remuneration bracket as senior management and risk takers, whose professional activities have a material impact on the risk profile of the Sub-Funds, that are consistent with and promote sound and effective risk management and do not encourage risk-taking which is inconsistent with the risk profiles of the Sub-Funds.
Variable Remuneration
The directors of the Management Company who are also employees of the SEI group of companies (the “SEI Group”) do not receive any remuneration in respect of their services as directors of the Management Company or the Fund. The other directors receive fixed remuneration in respect of their services which is set at a level determined by the Board as a whole and which is not performance related. The Management Company currently has seven directors of which two are not either employees or consultants of the SEI Group. None of the directors are currently in receipt of variable remuneration in respect of their services as directors of the Management Company or in respect of the Fund managed by the Management Company.
The Board has delegated certain activities in respect of the portfolio management and risk management of the Sub-Funds which it manages to SEI Investments Management Corporation (“SIMC”). In turn SIMC has also sub-delegated certain investment and risk management functions to certain other entities which provide sub-investment management services to the Fund. Where the Management Company has delegated or SIMC has sub-delegated investment management functions the Management Company is required to ensure that either:
(i) The entities to which investment management activities have been delegated are subject to regulatory requirements on remuneration that are equally as effective as those applicable under the UCITS Regulations and the ESMA Guidelines; or
(ii) A determination has been made that pursuant to the principle of proportionality it is appropriate that the entities to which investment management activities have been delegated do not need to adopt remuneration policies consistent with ESMA Guidelines; or
(iii) Appropriate contractual arrangements are put in place with entities to which investment management activities have been delegated in order to ensure that there is no circumvention of the remuneration rules set out in the ESMA Guidelines, subject to the application of the proportionality rules, set out in the ESMA Guidelines.
The ESMA Guidelines provide that when taking measures to comply with the requirements of the UCITS Regulations and the ESMA Guidelines, the Management Company should comply in a way and to the extent that is appropriate to its (a) size; (b) internal organisations; and (c) the nature, scope and complexity of its internal activities. The ESMA Guidelines outline that it is necessary to analyse (a) – (c) together, and not one single element, in isolation, when considering whether an entity may disapply the requirements set out in the UCITS Regulations, on the basis of the proportionality.
As outlined above, SIMC has appointed a number of third party entities to provided investment management and risk management services to the Fund. The Management Company shall ensure that the delegates of SIMC are subject to the requirements of (i), (ii) or (iii) above.
46

SEI Global Investment Fund plc
Unaudited Condensed Financial Statements for the half year ended 31 December 2017
APPENDIX (continued)
THE SEI GLOBAL SELECT EQUITY FUND
Appendix II - Statement of Changes in Composition of Portfolio
The following Statements of Changes in Composition of Portfolio reflect the aggregate purchases of a security exceeding one per cent of the
total value of purchases and aggregate disposals greater than one per cent of the total sales for the year. At a minimum the largest 20 purchases and 20 sales must be given.
Major Purchases Nominal Cost US$
CENTENE CORP 102,200 9,539,822
RENTOKIL INITIAL PLC 2,268,429 9,237,939
BANCO SANTANDER SA 1,383,944 9,081,189
FERRARI NV 77,514 8,919,197
ORANGE SA 508,517 8,796,200
ROPER TECHNOLOGIES INC 35,000 8,481,318
GLENCORE PLC 1,745,994 8,460,708
CHEMOURS CO/THE 147,800 7,909,396
LAM RESEARCH CORP 42,000 7,509,876
KONINKLIJKE AHOLD DELHAIZE NV 371,228 7,210,706
ARISTA NETWORKS INC 38,243 7,099,708
PAYPAL HOLDINGS INC 95,300 6,379,523
SERVICENOW INC 52,600 6,229,265
CARREFOUR SA 294,940 6,197,552
GENERAL DYNAMICS CORP 29,200 5,991,949
LION CORP 315,400 5,958,972
APPLIED MATERIALS INC 111,080 5,846,716
HOYA CORP 104,100 5,808,690
STRAUMANN HOLDING AG 8,416 5,553,223
PEARSON PLC 580,406 5,503,994
Major Sales Nominal Proceeds US$
NVIDIA CORP 68,205 12,729,683
ALLIANZ SE 51,716 11,950,938
MITSUBISHI CHEMICAL HOLDINGS CORP 1,048,000 10,719,098
GLENCORE PLC 2,128,958 10,387,843
LINDE AG 49,653 10,196,830
LAM RESEARCH CORP 48,818 9,809,008
CONTINENTAL AG 37,621 9,786,796
HOYA CORP 164,000 9,256,122
START TODAY CO LTD 298,000 9,154,175
APPLIED MATERIALS INC 168,821 8,988,580
ROPER TECHNOLOGIES INC 35,000 8,880,043
KOITO MANUFACTURING CO LTD 132,300 8,715,619
LENNOX INTERNATIONAL INC 45,200 8,711,676
CINTAS CORP 57,762 8,655,923
BURLINGTON STORES INC 96,400 8,599,933
MITSUI CHEMICALS INC 312,800 8,559,667
FERRARI NV 74,400 8,498,380
QUEST DIAGNOSTICS INC 89,400 8,487,986
VALEO SA 123,467 8,476,951
UNITEDHEALTH GROUP INC 40,900 8,455,746
RENTOKIL INITIAL PLC 1,942,054 8,425,025
CELANESE CORP 80,400 8,397,705
HUNTINGTON INGALLS INDUSTRIES INC 35,691 8,292,188
47

SEI Global Investments Fund plc Unaudited Condensed Financial Statements for the half year ended 31 December 2017
APPENDIX (continued) Appendix III – Securities Financing Transactions Regulation Securities Financing Transaction Regulation (“SFTR”) introduces reporting requirements for securities financing transactions (“SFTs”) and total return swaps. A Securities Financing Transaction (SFT) is defined as per Article 3(11) of the SFTR as: • a repurchase/reverse repurchase agreement, • securities or commodities lending and securities or commodities borrowing, • a buy-sell back transaction or sell-buy back transaction, or • a margin lending transaction. As at 31 December 2017 the Fund held the following types of SFTs: • securities lending All amounts shown represent Market Value. Global Data The amount of assets across all SFTs as at 31 December 2017 is as follows: The SEI Global Select Equity Fund
Type of asset Amount % of NAV % of lendable assets Securities lending US$2,739,805 0.15% 0.42%
Data on reuse of collateral There was no re-use of collateral during the half year ended 31 December 2017. Concentration data The ten largest issuers for collateral securities and commodities received across all SFTs as at 31 December 2017 is as follows: The SEI Global Select Equity Fund
# Collateral Issuers Amount 1 UK Government US$2,664,216 2 German Government US$132,439 3 French Government US$82,406
The ten largest counterparties across all SFTs as at 31 December 2017 is as follows: The SEI Global Select Equity Fund
Type of asset # Counterparty Amount Securities lending 1 HSBC US$1,733,061
2 Citigroup Global Markets Limited US$804,287 3 UBS AG US$202,457
Safekeeping of collateral received Three Custodians held collateral received as at 31 December 2017 as follows: The SEI Global Select Equity Fund
Custodian Type of collateral Amount CGO Security collateral US$2,664,216
Clearstream Security collateral US$214,844 Euroclear Security collateral US$1
Safekeeping of collateral granted There was no collateral granted for securities lending transactions.
48
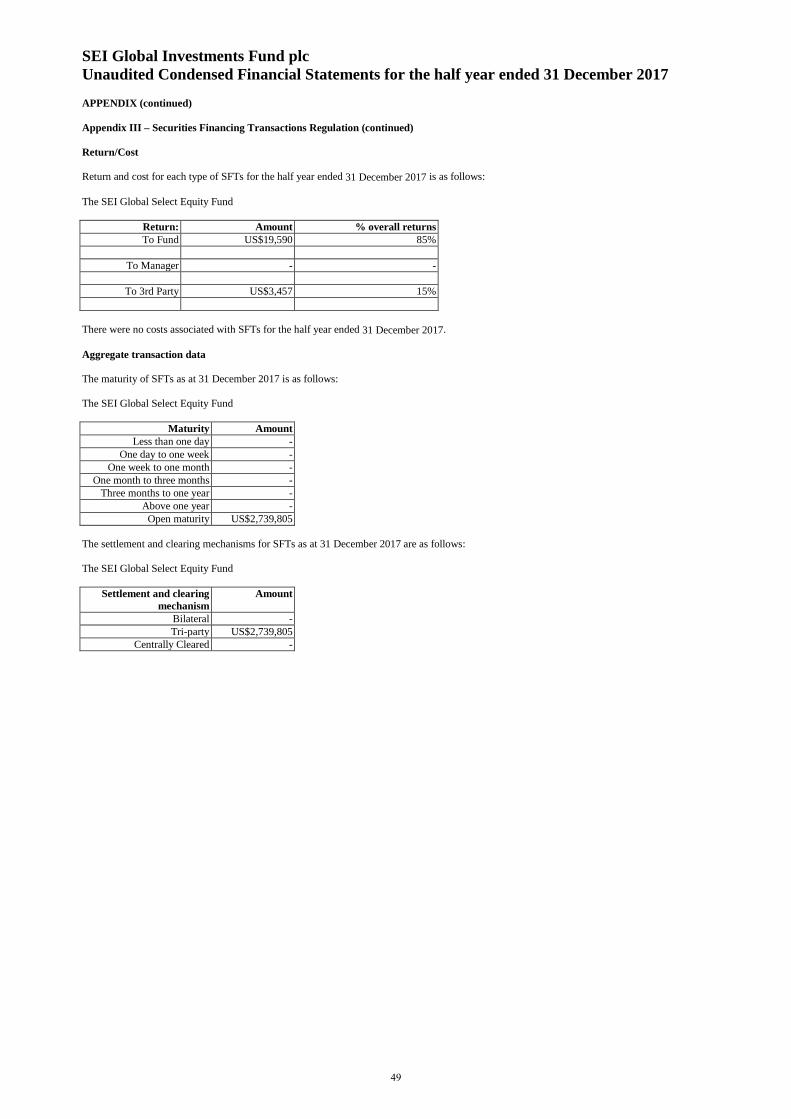
SEI Global Investments Fund plc Unaudited Condensed Financial Statements for the half year ended 31 December 2017
APPENDIX (continued) Appendix III – Securities Financing Transactions Regulation (continued) Return/Cost Return and cost for each type of SFTs for the half year ended 31 December 2017 is as follows: The SEI Global Select Equity Fund
Return: Amount % overall returns To Fund US$19,590 85%
To Manager - -
To 3rd Party US$3,457 15%
There were no costs associated with SFTs for the half year ended 31 December 2017. Aggregate transaction data The maturity of SFTs as at 31 December 2017 is as follows: The SEI Global Select Equity Fund
Maturity Amount Less than one day -
One day to one week - One week to one month -
One month to three months - Three months to one year -
Above one year - Open maturity US$2,739,805
The settlement and clearing mechanisms for SFTs as at 31 December 2017 are as follows: The SEI Global Select Equity Fund
Settlement and clearing mechanism
Amount
Bilateral - Tri-party US$2,739,805
Centrally Cleared -
49

SEI Global Investments Fund plc Unaudited Condensed Financial Statements for the half year ended 31 December 2017
APPENDIX (continued) Appendix III – Securities Financing Transactions Regulation (continued) Aggregate transaction data (continued) The aggregate transaction data for collateral positions (including cash) received across all SFTs as at 31 December 2017 is as follows: The SEI Global Select Equity Fund
Counterparty Type of collateral Amount Quality* Maturity tenor (collateral)
Currency of collateral
Country of counterparty establishment
Citigroup Global Markets Limited United Kingdom Gilt 5.00%, 07/03/2025 US$844,503 AA >1 year GBP United States HSBC United Kingdom Gilt 0.13%, 22/03/2046 US$1,819,611 AA >1 year GBP United States HSBC United Kingdom Gilt 1.25%, 22/07/2027 US$102 AA >1 year GBP United States HSBC France Government Bond 0.00%, 25/05/2020 US$1 AA >1 year EUR United States
UBS AG France Government Bond 3.75%, 25/10/2019 US$82,405 AA >1 year EUR Switzerland UBS AG German Government Bond 0.00%, 07/10/2022 US$67,511 AAA >1 year EUR Switzerland UBS AG German Government Bond 2.25%, 04/09/2020 US$64,928 AAA >1 year EUR Switzerland
*Standard and Poor’s long term issue credit rating
50