sefa corporate plan 2014/15 2018/19 - amazon web...
TRANSCRIPT
Sefa Corporate Plan – 2014/15 – 2018/19 Joint Portfolio Committee Meeting on Economic Development and Small Business Development
Thakhani Makhuvha
Chief Executive Officer
The Small Enterprise Finance Agency
29th July 2014
Introduction
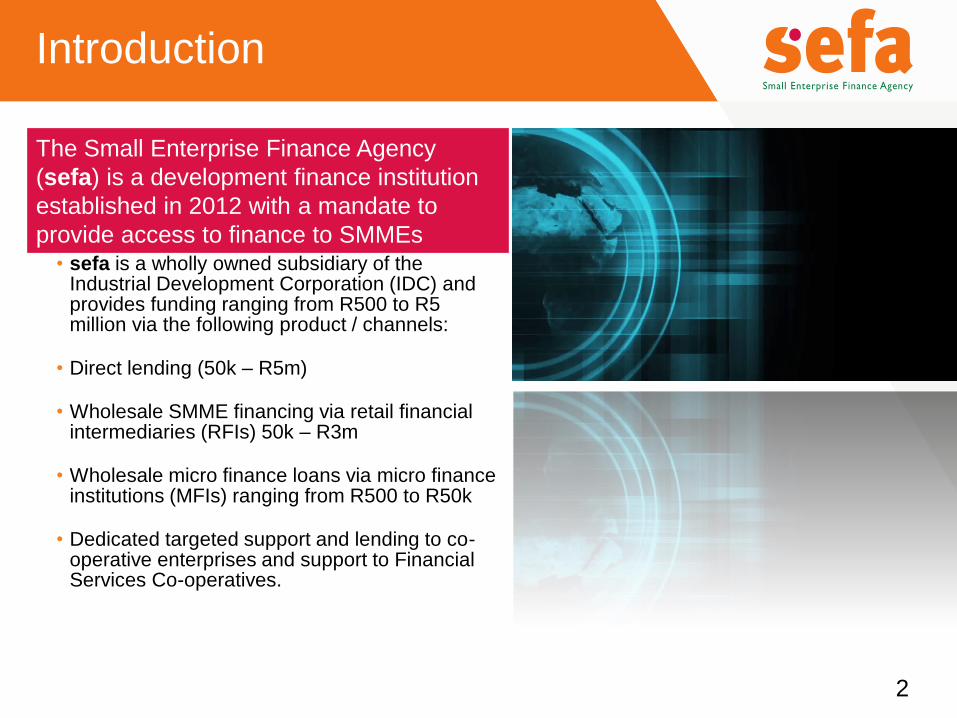
• sefa is a wholly owned subsidiary of the Industrial Development Corporation (IDC) and provides funding ranging from R500 to R5 million via the following product / channels:
• Direct lending (50k – R5m)
• Wholesale SMME financing via retail financial intermediaries (RFIs) 50k – R3m
• Wholesale micro finance loans via micro finance institutions (MFIs) ranging from R500 to R50k
• Dedicated targeted support and lending to co-operative enterprises and support to Financial Services Co-operatives.
2
The Small Enterprise Finance Agency
(sefa) is a development finance institution
established in 2012 with a mandate to
provide access to finance to SMMEs
Government Small Business Focus
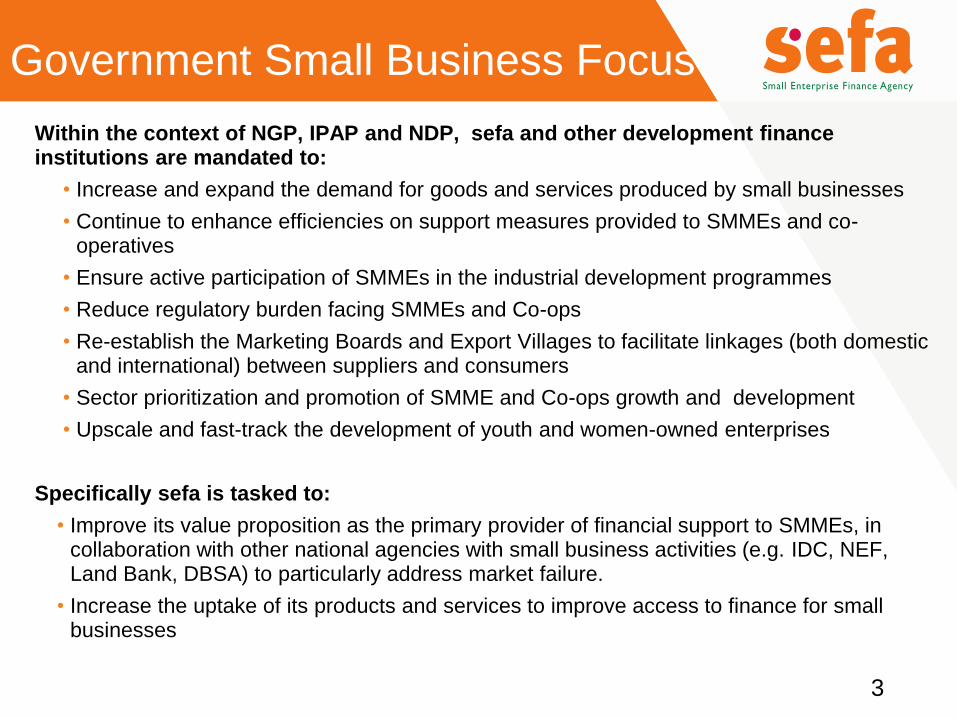
Within the context of NGP, IPAP and NDP, sefa and other development finance institutions are mandated to:
• Increase and expand the demand for goods and services produced by small businesses
• Continue to enhance efficiencies on support measures provided to SMMEs and co-operatives
• Ensure active participation of SMMEs in the industrial development programmes
• Reduce regulatory burden facing SMMEs and Co-ops
• Re-establish the Marketing Boards and Export Villages to facilitate linkages (both domestic and international) between suppliers and consumers
• Sector prioritization and promotion of SMME and Co-ops growth and development
• Upscale and fast-track the development of youth and women-owned enterprises
Specifically sefa is tasked to:
• Improve its value proposition as the primary provider of financial support to SMMEs, in collaboration with other national agencies with small business activities (e.g. IDC, NEF, Land Bank, DBSA) to particularly address market failure.
• Increase the uptake of its products and services to improve access to finance for small businesses
3
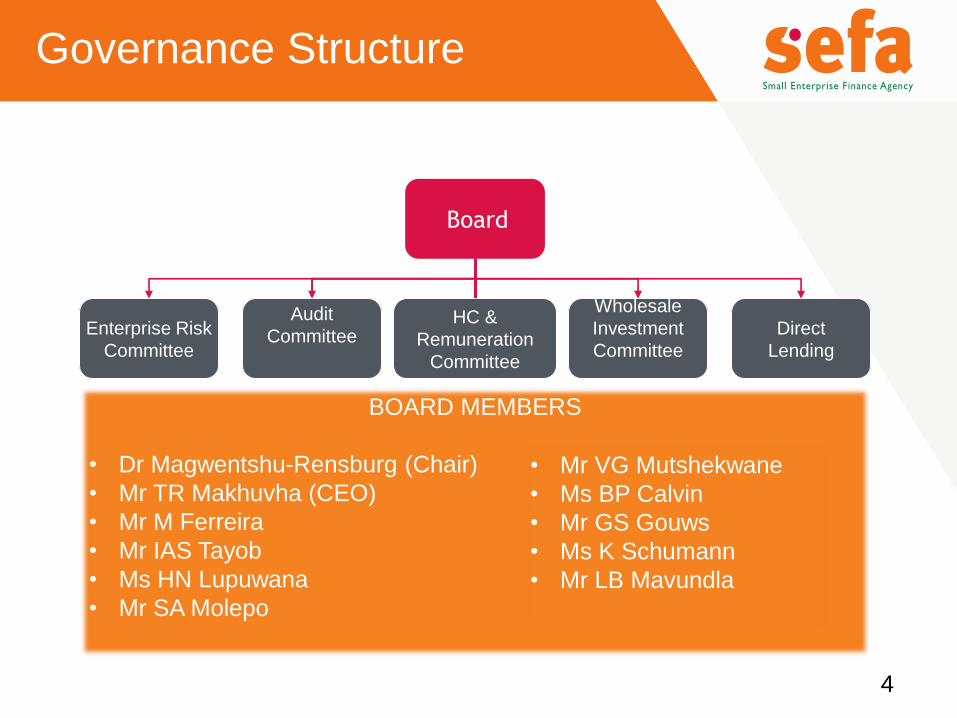
Governance Structure
4
Board
Enterprise Risk
Committee
Audit
Committee
HC &
Remuneration
Committee
Wholesale
Investment
Committee
Direct
Lending
BOARD MEMBERS
• Dr Magwentshu-Rensburg (Chair)
• Mr TR Makhuvha (CEO)
• Mr M Ferreira
• Mr IAS Tayob
• Ms HN Lupuwana
• Mr SA Molepo
• Mr VG Mutshekwane
• Ms BP Calvin
• Mr GS Gouws
• Ms K Schumann
• Mr LB Mavundla

Management Structure
5
CHIEF FINANCIAL OFFICER
Direct Lending EXECUTIVE
WHOLESALE EXECUTIVE
CHIEF RISK OFFICER
HR EXECUTIVE
Executive in CEO Office
sefa Board
CEO
Head:
Internal Audit
Company
Secretariat
5

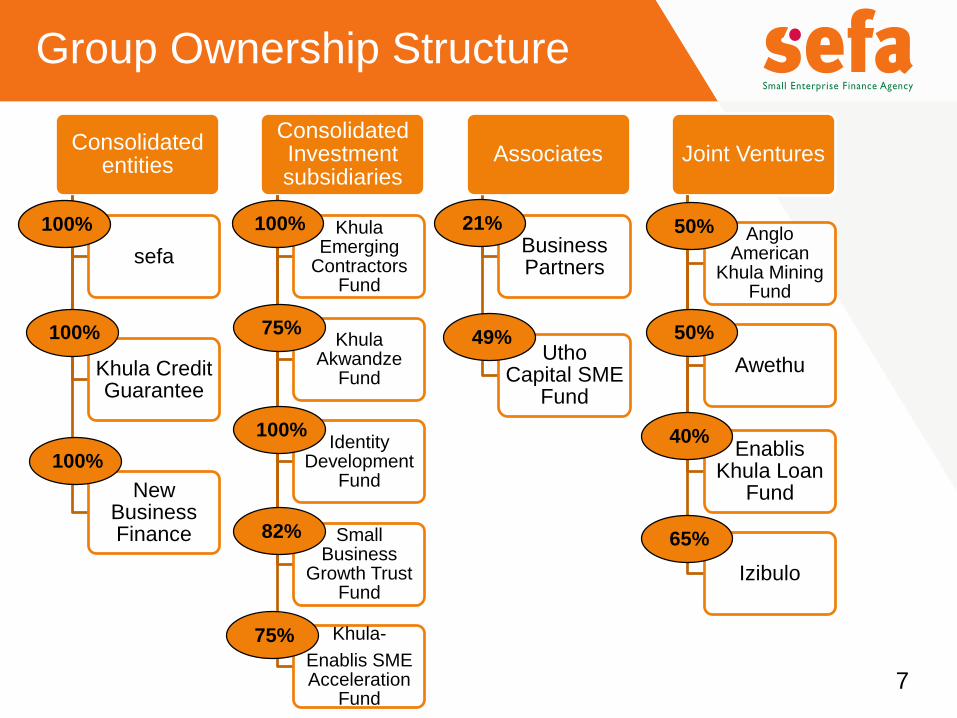
Group Ownership Structure
Consolidated entities
sefa
Khula Credit Guarantee
New Business Finance
Consolidated Investment subsidiaries
Khula Emerging
Contractors Fund
Khula Akwandze
Fund
Identity Development
Fund
Small Business
Growth Trust Fund
Khula-
Enablis SME Acceleration
Fund
Associates
Business Partners
UthoCapital SME
Fund
Joint Ventures
Anglo American
Khula Mining Fund
Awethu
EnablisKhula Loan
Fund
Izibulo
Wholly owned
subsidiaries not
consolidated:
• Khula Land
Reform
Empowerment
Facility NPC
• Khula Institutional
Support Services
NPC
Dormant
subsidiaries:
• Khula Business
Premises (Pty)
Ltd
• New Cape Equity
Fund (Pty) Ltd
• MKN Equity Fund
(Pty) Ltd
100%
100%
100%
75%
100%
82%
75%
21%
49%
50%
50%
40%
65%
100%
7

R’000 Group 2014 Group 2013
Total Assets R2,227,194 R2,179,684
Shareholders’ loan R1,175,521 R944,542
Other liabilities R158,353 R169,941
Equity R893,320 R1,065,201
Total Equity & Liabilities R2,227,194 R2,179,684
Financial Position
8
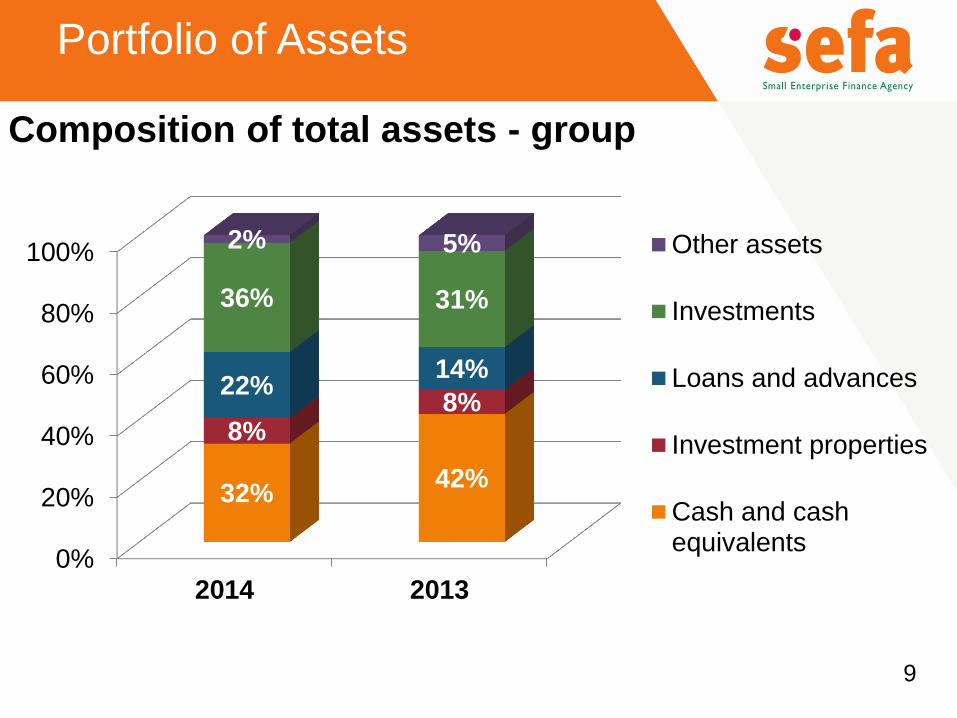
Composition of total assets - group
0%
20%
40%
60%
80%
100%
2014 2013
32% 42%
8% 8%
22% 14%
36% 31%
2% 5% Other assets
Investments
Loans and advances
Investment properties
Cash and cashequivalents
Portfolio of Assets
9
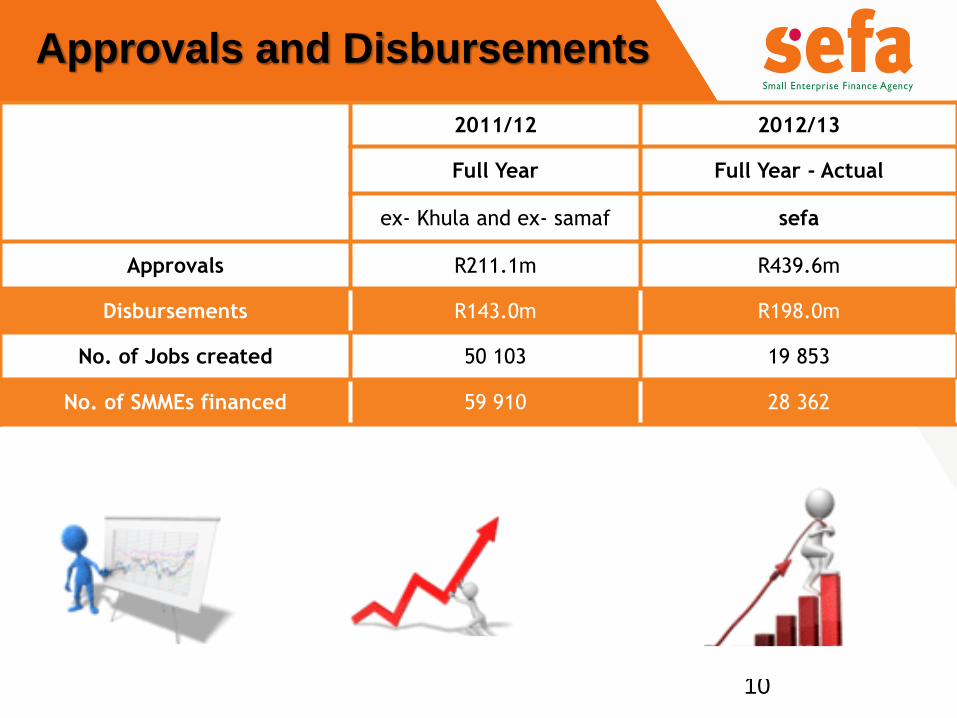
Approvals and Disbursements
10
2011/12 2012/13
Full Year Full Year - Actual
ex- Khula and ex- samaf sefa
Approvals R211.1m R439.6m
Disbursements R143.0m R198.0m
No. of Jobs created 50 103 19 853
No. of SMMEs financed 59 910 28 362

Target Market, Products and distribution channels
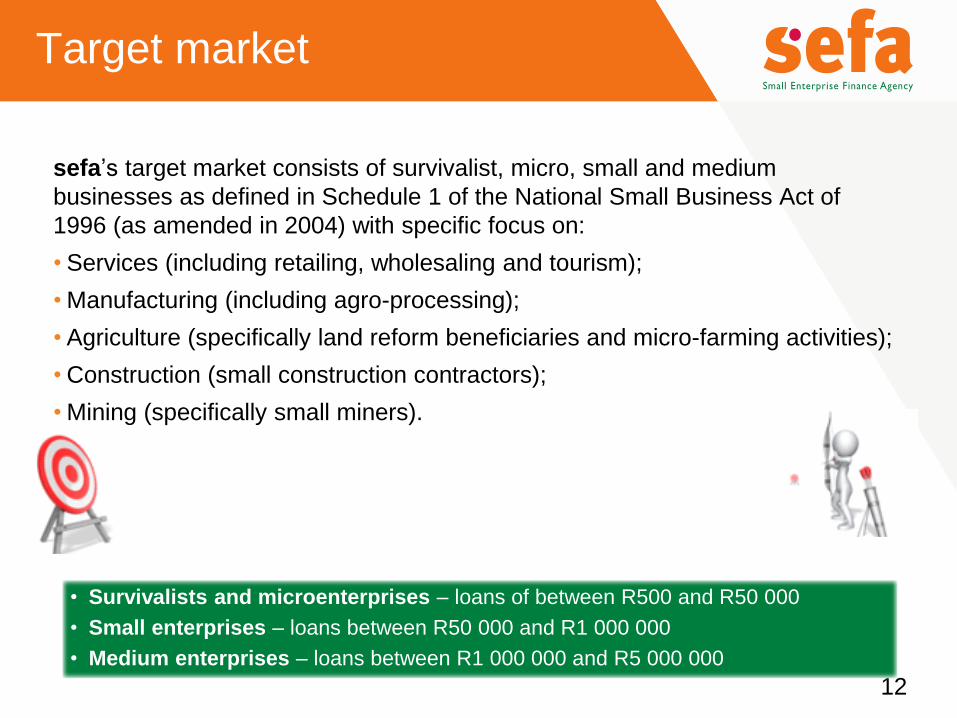
Target market
sefa’s target market consists of survivalist, micro, small and medium
businesses as defined in Schedule 1 of the National Small Business Act of
1996 (as amended in 2004) with specific focus on:
• Services (including retailing, wholesaling and tourism);
• Manufacturing (including agro-processing);
• Agriculture (specifically land reform beneficiaries and micro-farming activities);
• Construction (small construction contractors);
• Mining (specifically small miners).
12
• Survivalists and microenterprises – loans of between R500 and R50 000
• Small enterprises – loans between R50 000 and R1 000 000
• Medium enterprises – loans between R1 000 000 and R5 000 000
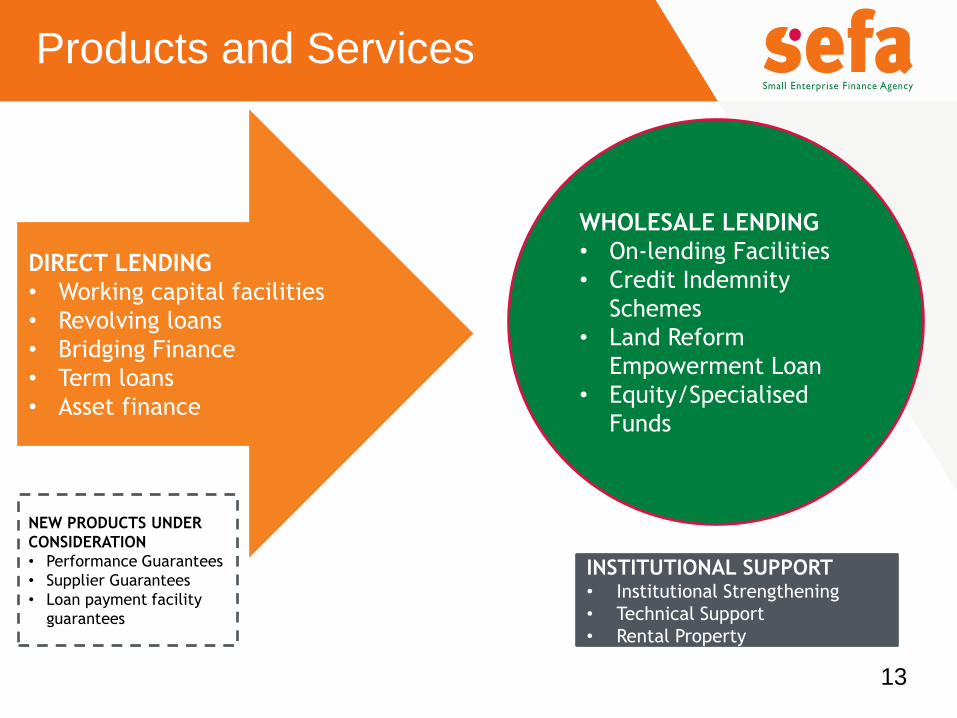
Products and Services
13
DIRECT LENDING
• Working capital facilities
• Revolving loans
• Bridging Finance
• Term loans
• Asset finance
WHOLESALE LENDING
• On-lending Facilities
• Credit Indemnity
Schemes
• Land Reform
Empowerment Loan
• Equity/Specialised
Funds
INSTITUTIONAL SUPPORT • Institutional Strengthening
• Technical Support
• Rental Property
NEW PRODUCTS UNDER
CONSIDERATION
• Performance Guarantees
• Supplier Guarantees
• Loan payment facility
guarantees

14
●
◦ ♦ ▲ 16 Micro-Finance Intermediaries
▪ 6 Retail Finance Intermediaries
∞ 3 Partnerships
*
●
●
●
●
●
●
●
● ● ●
♦
♦
♦
♦
♦
♦
♦
♦
♦
♦
♦ ▲
▲
▲
▲
▲
▲
▲
▲
▲ ▲
▲ ▲
▲ ▲ ▲
▲ 3 sefa Branch Offices
◦
◦
◦ ▪
▪
▪ ▪ ▪
▪
▪
9 sefa Regional Offices
10 Cooperative Offices
* *
* *
* *
*
*
∞ ∞ 8 Specialised Funds ∞
∞
Our Footprint
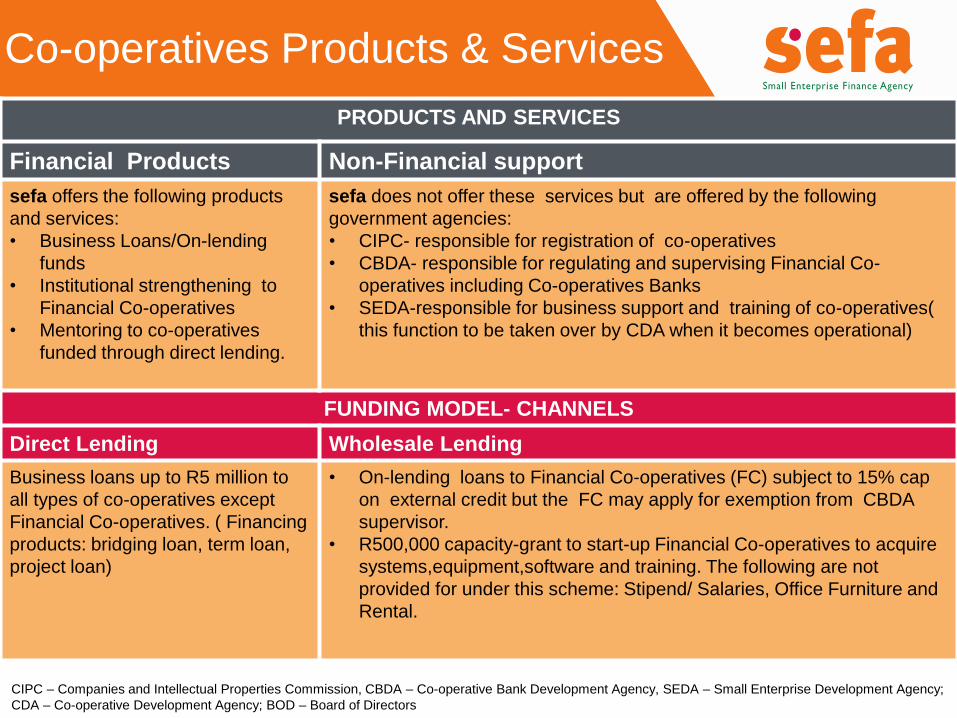
Co-operatives Products & Services
PRODUCTS AND SERVICES
Financial Products Non-Financial support
sefa offers the following products
and services:
• Business Loans/On-lending
funds
• Institutional strengthening to
Financial Co-operatives
• Mentoring to co-operatives
funded through direct lending.
sefa does not offer these services but are offered by the following
government agencies:
• CIPC- responsible for registration of co-operatives
• CBDA- responsible for regulating and supervising Financial Co-
operatives including Co-operatives Banks
• SEDA-responsible for business support and training of co-operatives(
this function to be taken over by CDA when it becomes operational)
FUNDING MODEL- CHANNELS
Direct Lending Wholesale Lending
Business loans up to R5 million to
all types of co-operatives except
Financial Co-operatives. ( Financing
products: bridging loan, term loan,
project loan)
• On-lending loans to Financial Co-operatives (FC) subject to 15% cap
on external credit but the FC may apply for exemption from CBDA
supervisor.
• R500,000 capacity-grant to start-up Financial Co-operatives to acquire
systems,equipment,software and training. The following are not
provided for under this scheme: Stipend/ Salaries, Office Furniture and
Rental.
CIPC – Companies and Intellectual Properties Commission, CBDA – Co-operative Bank Development Agency, SEDA – Small Enterprise Development Agency;
CDA – Co-operative Development Agency; BOD – Board of Directors
We do business with:
16
• South African citizens and permanent residents owned
enterprises
• Legally registered entities including sole traders with a
fixed physical address
• Applicants must be within the required contractual
capacity
• All business operations must be operated within RSA;
• The enterprise must be compliant with generally
accepted corporate governance practices appropriate
to the client’s legal status
• Have a written proposal or business plan that meets the
requirements of sefa’s loan application criteria
• Demonstrate the character and ability to repay the loan
• Have provided personal and/or credit references (if
available)
• Majority shareholder must be owner manager of the
business
• Where available, client provides relevant
securities/collateral
• Businesses with a valid tax clearance certificate

What makes sefa different
• Provision of capital and/or interest moratorium (Payment
Holiday) up to 12 Months
• High appetite for risk in exchange for high development
impact
• Financing SMMEs including start up businesses that are
often perceived as high risk
• Addressing the financing gap for loans below R500k
• Provision of pre and post loan business support
• Provision of funding to entrepreneurs with adverse credit
records provided they can demonstrate active remedy of
their indebtedness
• Lending not solely based on security backing – long term
sustainability potential
• Specific focus on youth owned businesses
17
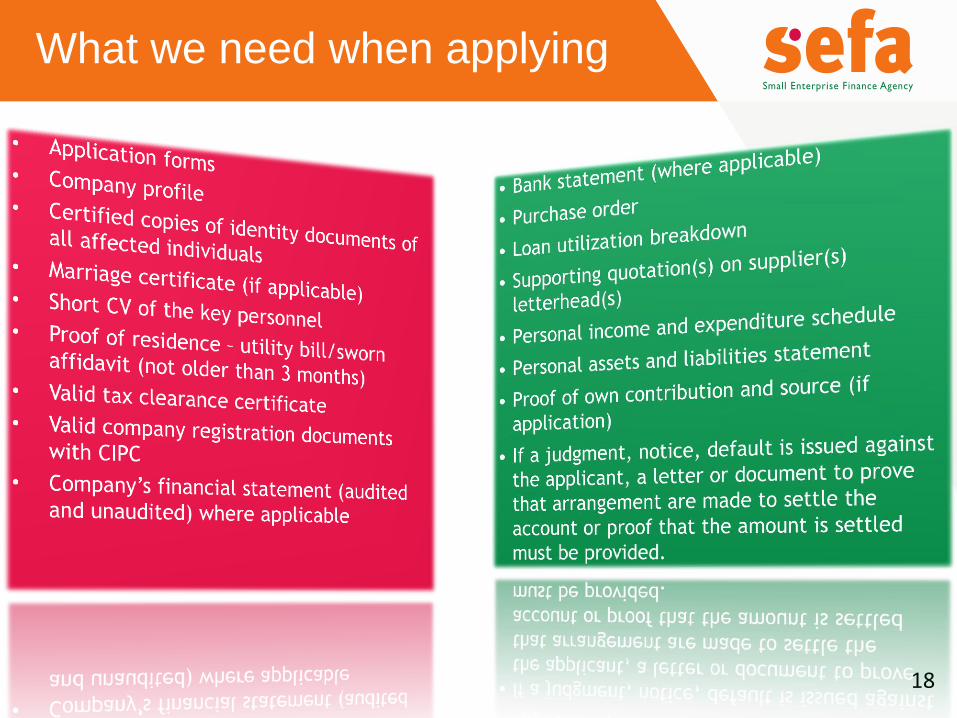
What we need when applying
18
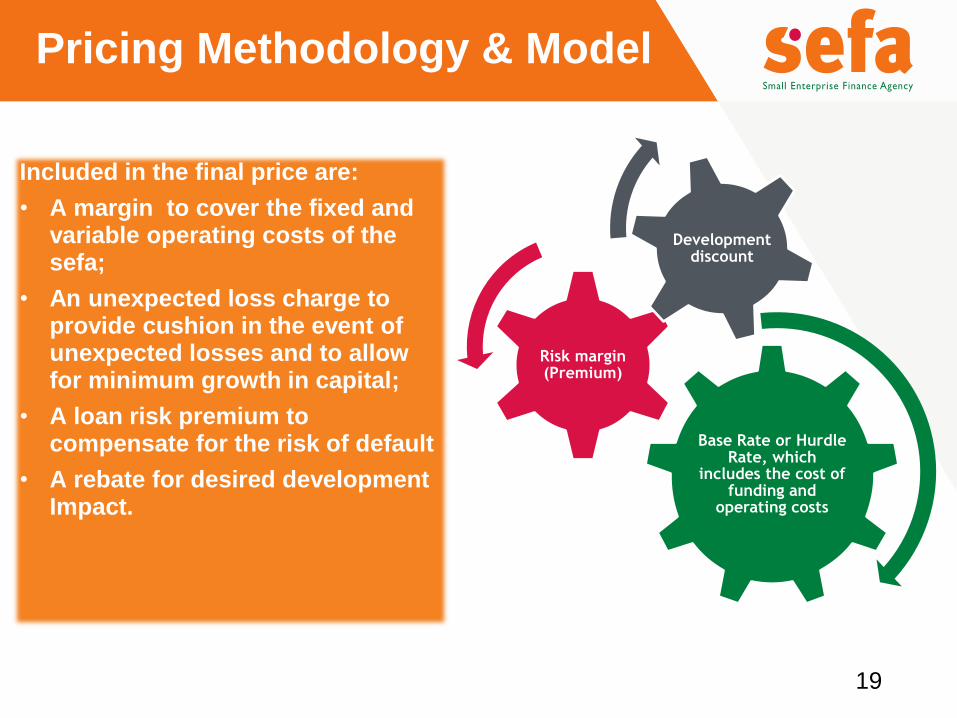
Pricing Methodology & Model
Included in the final price are:
• A margin to cover the fixed and variable operating costs of the sefa;
• An unexpected loss charge to provide cushion in the event of unexpected losses and to allow for minimum growth in capital;
• A loan risk premium to compensate for the risk of default
• A rebate for desired development Impact.
19
Base Rate or Hurdle Rate, which
includes the cost of funding and
operating costs
Risk margin (Premium)
Development discount
20
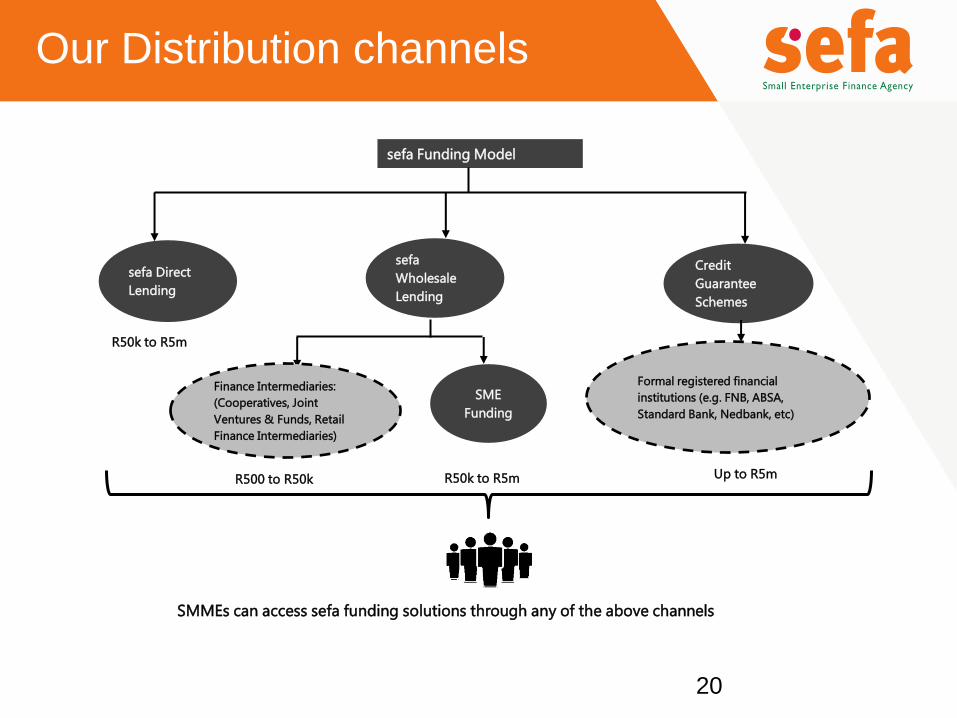
Our Distribution channels
sefa Direct
Lending
R50k to R5m
sefa
Wholesale
Lending
sefa Funding Model
SMMEs can access sefa funding solutions through any of the above channels
Credit
Guarantee
Schemes
Finance Intermediaries:
(Cooperatives, Joint
Ventures & Funds, Retail
Finance Intermediaries)
R50k to R5m Up to R5m
SME
Funding
R500 to R50k
Formal registered financial
institutions (e.g. FNB, ABSA,
Standard Bank, Nedbank, etc)
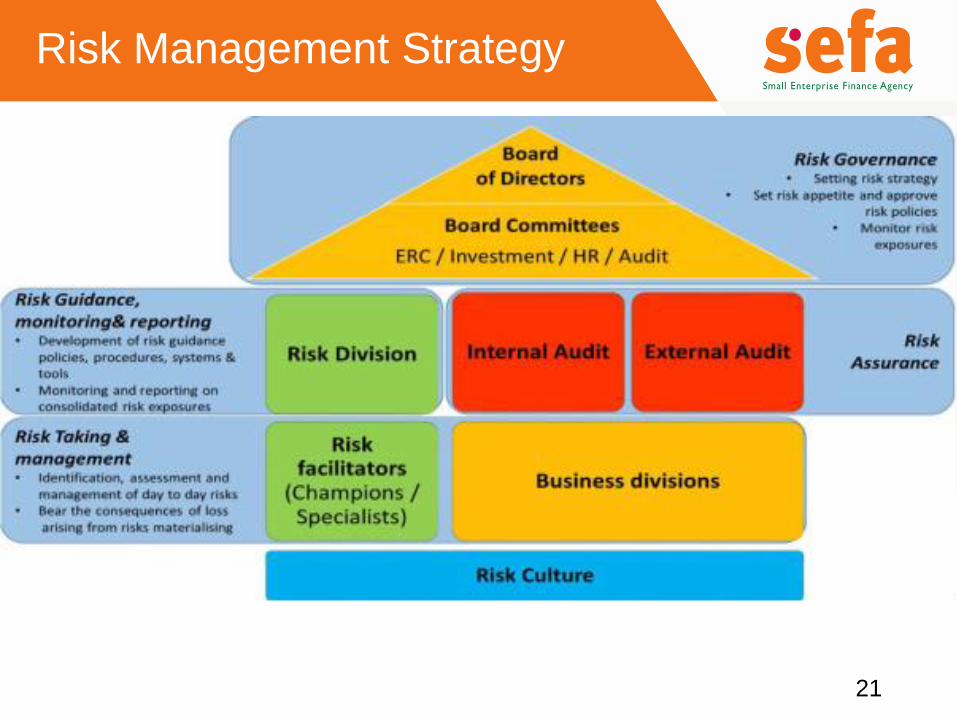
Risk Management Strategy
21

23
STRATEGIC
OBJECTIVE/
ENABLER
STRATEGIC GOAL
STATEMENT
KEY
PERFORMANCE
AREA
KEY PERFORMANCE
INDICATOR
KEY
PERFORMA
NCE
TARGET
Increase access &
provision of
finance to SMMEs
through a national
footprint &
contribute to job
creation
• Expand Direct
Lending through
partnerships
• Expand access to
Micro Enterprise
Finance
• Stronger partnerships
with RFIs in SMME
wholesale finance
• Increase utilisation of
guarantee indemnity
scheme by
commercial banks
Enable SMMEs to
access finance &
development
impact
Improve &
maintain
turnaround times
for approvals
Approvals
Disbursements
Development Impact:
R974m
R800m
SMMEs financed 37 758
Overall jobs created 57 255
Disbursements to
Youth owned 30%
Rural provinces 45%
Women 45%
People with disabilities 2%
Black-owned
businesses
70%
Facilities <R250k 40%
Approval in productive
industrial
20%
Number of day: bridging
finance
10
Number of days: term
loans
20
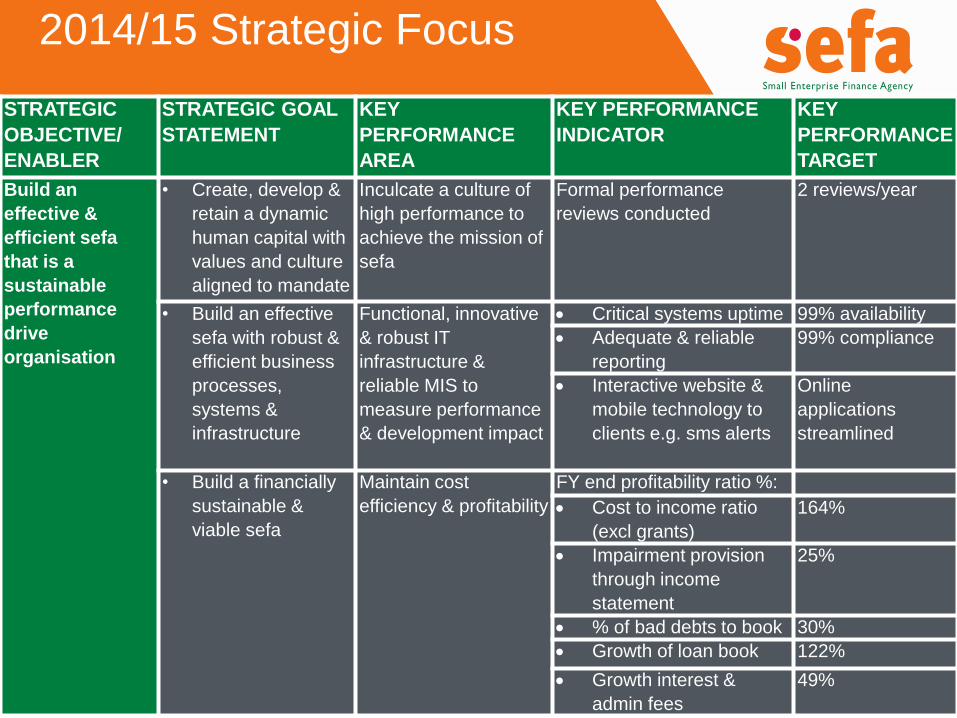
2014/15 Strategic Focus
24
STRATEGIC
OBJECTIVE/
ENABLER
STRATEGIC GOAL
STATEMENT
KEY
PERFORMANCE
AREA
KEY PERFORMANCE
INDICATOR
KEY
PERFORMANCE
TARGET
Build an
effective &
efficient sefa
that is a
sustainable
performance
drive
organisation
• Create, develop &
retain a dynamic
human capital with
values and culture
aligned to mandate
Inculcate a culture of
high performance to
achieve the mission of
sefa
Formal performance
reviews conducted
2 reviews/year
• Build an effective
sefa with robust &
efficient business
processes,
systems &
infrastructure
Functional, innovative
& robust IT
infrastructure &
reliable MIS to
measure performance
& development impact
Critical systems uptime 99% availability
Adequate & reliable
reporting
99% compliance
Interactive website &
mobile technology to
clients e.g. sms alerts
Online
applications
streamlined
• Build a financially
sustainable &
viable sefa
Maintain cost
efficiency & profitability
FY end profitability ratio %:
Cost to income ratio
(excl grants)
164%
Impairment provision
through income
statement
25%
% of bad debts to book 30%
Growth of loan book 122%
Growth interest &
admin fees
49%
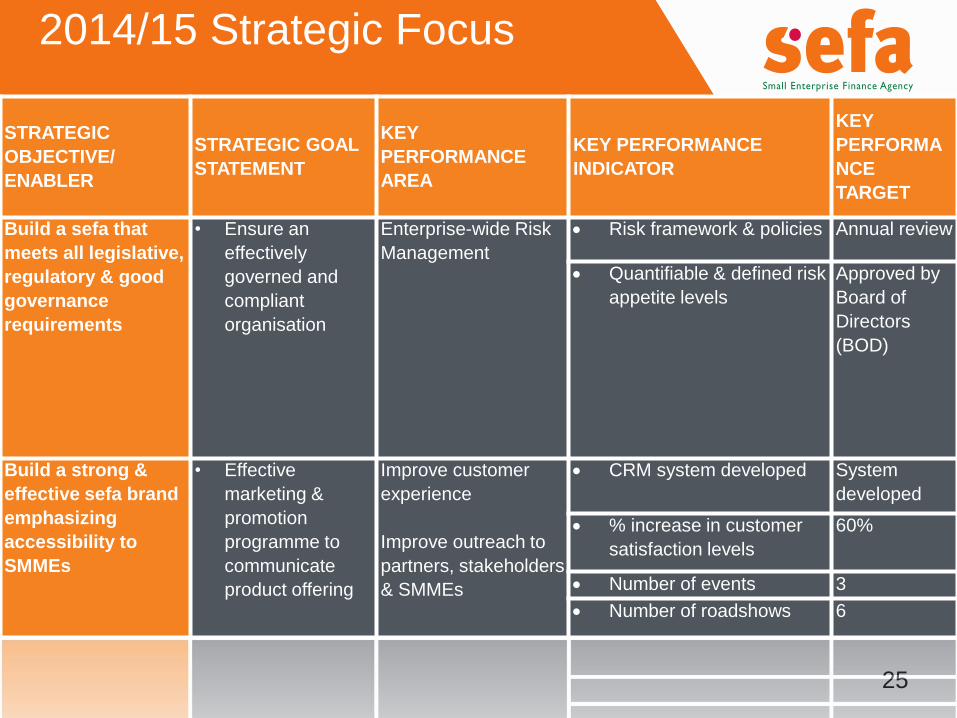
2014/15 Strategic Focus
25
STRATEGIC
OBJECTIVE/
ENABLER
STRATEGIC GOAL
STATEMENT
KEY
PERFORMANCE
AREA
KEY PERFORMANCE
INDICATOR
KEY
PERFORMA
NCE
TARGET
Build a sefa that
meets all legislative,
regulatory & good
governance
requirements
• Ensure an
effectively
governed and
compliant
organisation
Enterprise-wide Risk
Management
Risk framework & policies Annual review
Quantifiable & defined risk
appetite levels
Approved by
Board of
Directors
(BOD)
Build a strong &
effective sefa brand
emphasizing
accessibility to
SMMEs
• Effective
marketing &
promotion
programme to
communicate
product offering
Improve customer
experience
Improve outreach to
partners, stakeholders
& SMMEs
CRM system developed System
developed
% increase in customer
satisfaction levels
60%
Number of events 3
Number of roadshows 6
2014/15 Strategic Focus
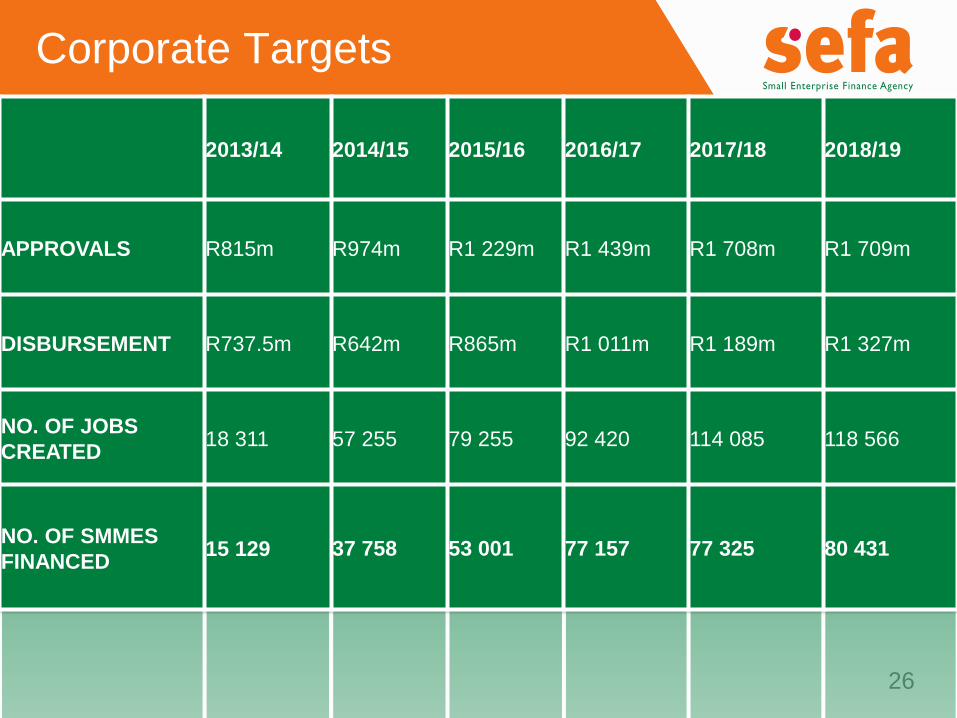
Corporate Targets
26
2013/14
2014/15
2015/16
2016/17
2017/18
2018/19
APPROVALS R815m R974m R1 229m R1 439m R1 708m R1 709m
DISBURSEMENT R737.5m R642m R865m R1 011m R1 189m R1 327m
NO. OF JOBS
CREATED 18 311 57 255 79 255 92 420 114 085 118 566
NO. OF SMMES
FINANCED 15 129 37 758 53 001 77 157 77 325 80 431
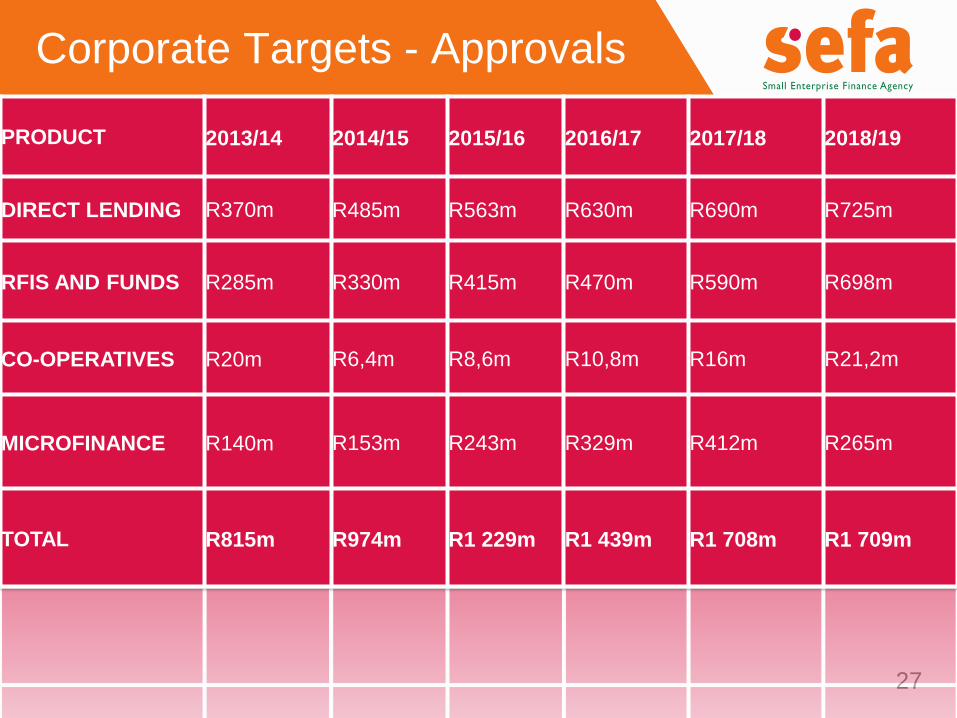
Corporate Targets - Approvals
27
PRODUCT
2013/14
2014/15
2015/16
2016/17
2017/18
2018/19
DIRECT LENDING R370m R485m R563m R630m R690m R725m
RFIS AND FUNDS R285m R330m R415m R470m R590m R698m
CO-OPERATIVES R20m R6,4m R8,6m R10,8m R16m R21,2m
MICROFINANCE R140m R153m R243m R329m R412m R265m
TOTAL R815m R974m R1 229m R1 439m R1 708m R1 709m
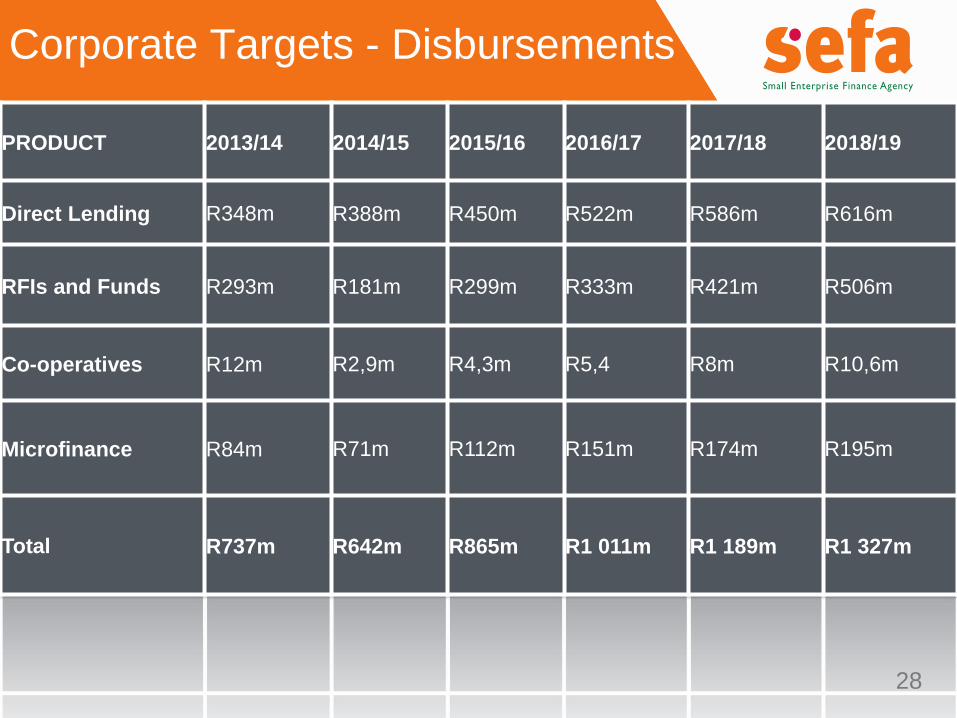
Corporate Targets - Disbursements
28
PRODUCT
2013/14
2014/15
2015/16
2016/17
2017/18
2018/19
Direct Lending R348m R388m R450m R522m R586m R616m
RFIs and Funds R293m R181m R299m R333m R421m R506m
Co-operatives R12m R2,9m R4,3m R5,4 R8m R10,6m
Microfinance R84m R71m R112m R151m R174m R195m
Total R737m R642m R865m R1 011m R1 189m R1 327m
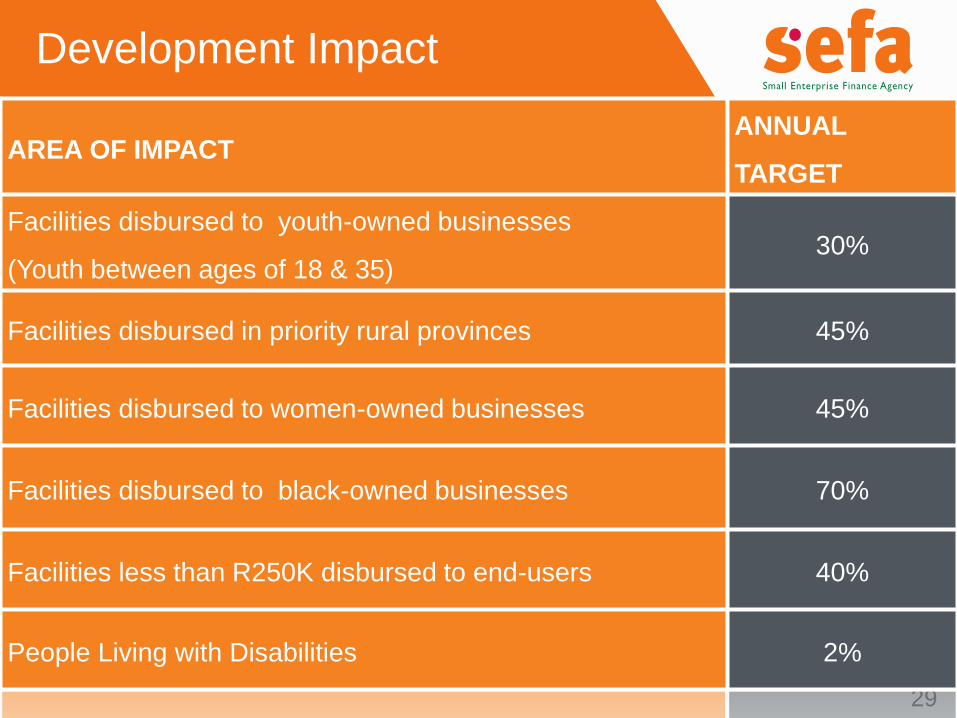
Development Impact
29
AREA OF IMPACT ANNUAL
TARGET
Facilities disbursed to youth-owned businesses
(Youth between ages of 18 & 35) 30%
Facilities disbursed in priority rural provinces 45%
Facilities disbursed to women-owned businesses 45%
Facilities disbursed to black-owned businesses 70%
Facilities less than R250K disbursed to end-users 40%
People Living with Disabilities 2%
Financial Management
30
Budget base and philosophy
• Budget and projections are based on the Corporate Plan, mainly driven by the targeted disbursements;
• Business targets per Corporate Plan remain ambitious with an upward trajectory over the Corporate Plan period;
• Current organisational capability requires a significant investment in human resources for:
–Shift in Wholesale investment business strategy;
–Direct Lending – business development, due diligence, credit assessment, post investment business support, collections and work out;
–Business process renewal – focused review and enhancement of critical business systems and processes both from a compliance and efficient service delivery perspective
• Drive cost containment in line with instructions from National Treasury
31
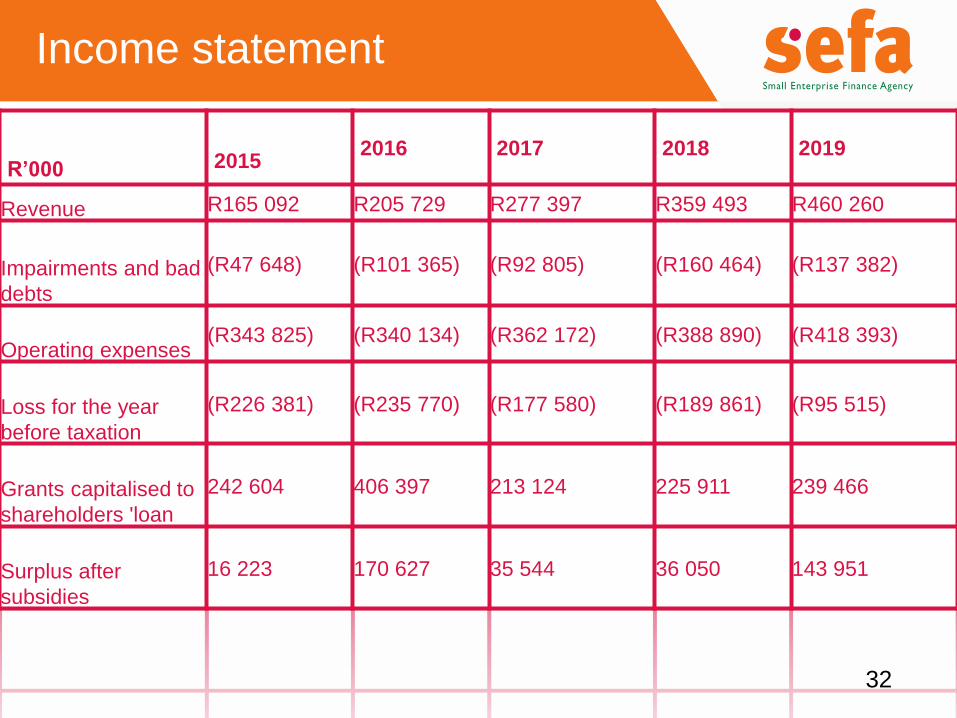
Income statement
R’000
2015 2016 2017 2018 2019
Revenue R165 092 R205 729 R277 397 R359 493 R460 260
Impairments and bad
debts
(R47 648) (R101 365) (R92 805) (R160 464) (R137 382)
Operating expenses (R343 825) (R340 134) (R362 172) (R388 890) (R418 393)
Loss for the year
before taxation
(R226 381) (R235 770) (R177 580) (R189 861) (R95 515)
Grants capitalised to
shareholders 'loan
242 604 406 397 213 124 225 911 239 466
Surplus after
subsidies
16 223 170 627 35 544 36 050 143 951
32
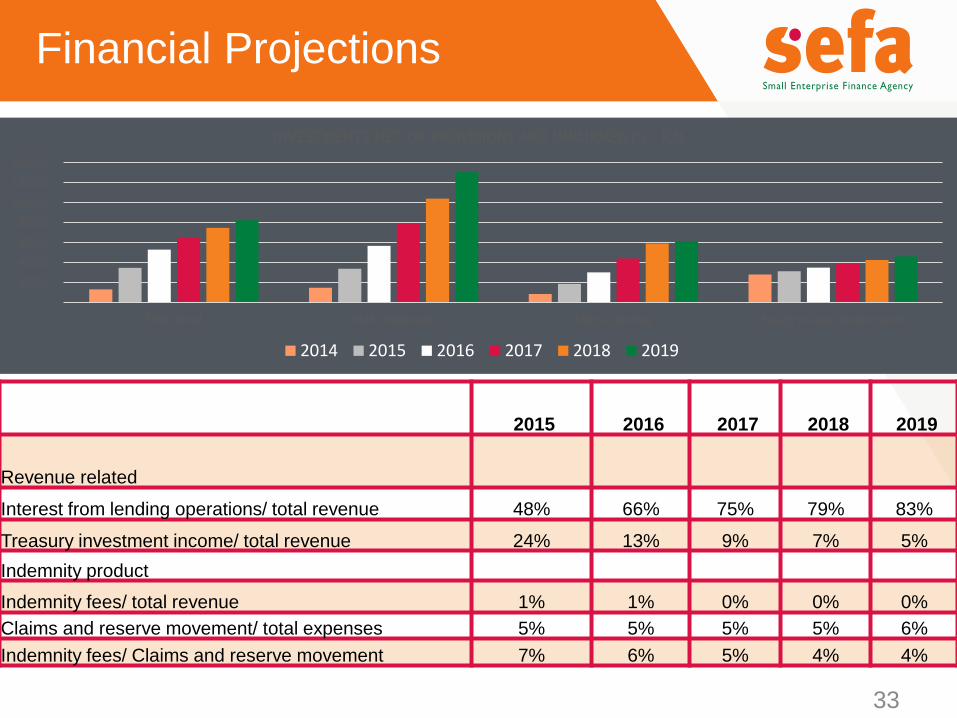
Financial Projections
2015 2016 2017 2018 2019
Revenue related
Interest from lending operations/ total revenue 48% 66% 75% 79% 83%
Treasury investment income/ total revenue 24% 13% 9% 7% 5%
Indemnity product
Indemnity fees/ total revenue 1% 1% 0% 0% 0%
Claims and reserve movement/ total expenses 5% 5% 5% 5% 6%
Indemnity fees/ Claims and reserve movement 7% 6% 5% 4% 4%
33
-
200.0
400.0
600.0
800.0
1000.0
1200.0
1400.0
SME Retail SME Wholesale Micro Lending Equity related investments
INVESTMENTS NET OF PROVISIONS AND IMPAIRMENTS - R'M
2014 2015 2016 2017 2018 2019
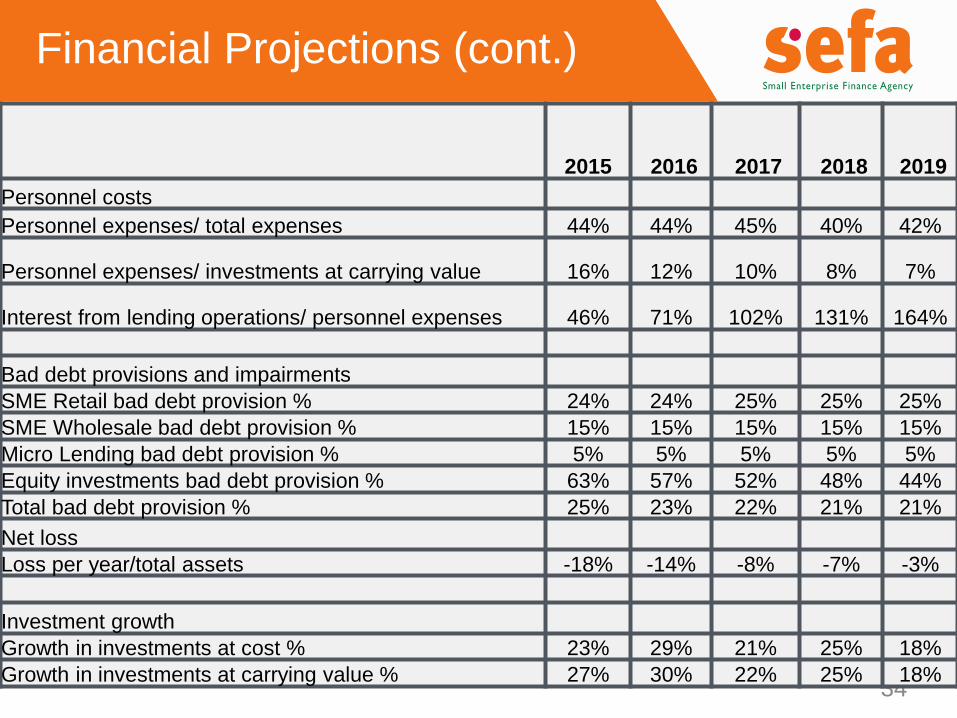
Financial Projections (cont.)
34
2015 2016 2017 2018 2019
Personnel costs
Personnel expenses/ total expenses 44% 44% 45% 40% 42%
Personnel expenses/ investments at carrying value 16% 12% 10% 8% 7%
Interest from lending operations/ personnel expenses 46% 71% 102% 131% 164%
Bad debt provisions and impairments
SME Retail bad debt provision % 24% 24% 25% 25% 25%
SME Wholesale bad debt provision % 15% 15% 15% 15% 15%
Micro Lending bad debt provision % 5% 5% 5% 5% 5%
Equity investments bad debt provision % 63% 57% 52% 48% 44%
Total bad debt provision % 25% 23% 22% 21% 21%
Net loss
Loss per year/total assets -18% -14% -8% -7% -3%
Investment growth
Growth in investments at cost % 23% 29% 21% 25% 18%
Growth in investments at carrying value % 27% 30% 22% 25% 18%
sefa Contact Details
•sefa National Call
Centre : 0860 007 332
•E-mail: [email protected]
•www.sefa.org.za
35
36