seeking advice: an exploratory analysis of how often first-year
TRANSCRIPT

Running head: SEEKING ADVICE 1
Seeking Advice:
An Exploratory Analysis of How Often First-Year Students Meet with Advisors
Kevin Fosnacht
Alexander C. McCormick
Jennifer Nailos
Amy K. Ribera
Center for Postsecondary Education
Indiana University, Bloomington
Paper presented at the annual meeting of the American Education Research Association,
Chicago, IL, April 2015.
SEEKING ADVICE 2
Seeking Advice: An Exploratory Analysis of How Often First-Year Students Meet with Advisors
Abstract
While it is well understood that academic advising helps students adjust to and deal with the
challenges of college, little is known about what influences the extent of their interactions with
advisors. Using data from 52,546 full-time, first-year students at a diverse set of 209 institutions,
we examined how often students met with academic advisors, and how this varies by student and
institutional characteristics. We find that the typical first-year student met with an advisor one to
three times during their first college year. However, the number of meetings varied across
student subpopulations and institutional types. Findings aim to inform wider discussions about
academic advising and student support on college campuses.
Keywords: Academic advising, assessment, supportive campus environment
SEEKING ADVICE 3
Seeking Advice: An Exploratory Analysis of How Often First-Year Students Meet with Advisors
The American higher education system is the most complex education system in the
world. Colleges and universities have diversified with regard to type, degrees offerings (Lucas,
1994), and social and economic backgrounds of their students (McCormick, 2011). Due to this
expansion, it is not surprising that the campus environment can pose significant social, physical,
bureaucratic obstacles for incoming students (St. John, Hu, & Fisher, 2011). Navigating the
campus, reaching academic goals, and pursuing career or educational ambitions often require
guidance from others. White and Schulenburg (2012) argue that academic advisors hold a
strategic position in the college environment to facilitate the connection between students’
academic choices and the larger purpose of their educational goals. Advisors often guide students
through a host of important educational decisions including course selection, degree plan,
personal development, and career decisions (Ender, Winston, & Miller, 1982).
Yet, despite the importance of academic advising on college campuses and the growing
body of literature showing its positive effects on retention and satisfaction (e.g., Christian &
Sprinkle, 2013; Kuh, 2008), little is known about how often today’s students take advantage of
this valuable resource and how the institutional setting shapes the frequency of interactions with
advisors. The present study explores these questions among first-year students by examining the
relationship between students’ demographic and academic characteristics and how often they
met with advisors, and whether these patterns vary by institutional characteristics. Findings aim
to inform the wider discussion of academic advising and student support on college campuses.
Literature Review
Academic advising as a formal job category developed in the late twentieth century as a
result of the massification of higher education and the shift of faculty responsibilities from
holistic student development toward a more exclusive focus on teaching and research (Hemwall,
SEEKING ADVICE 4
2008; Self, 2008). Helping students navigate requirements and opportunities, academic advisors
serve an important role in undergraduate education (National Academic Advising Association
[NACADA], 2014). In the 1980s, academic advising was recognized as a distinct role on
campus, with specific responsibilities and guidelines for advisors established by the Council for
the Advancement of Standards (Cook, 2009). NACADA (2014) defines expectations for advisors
to include supporting the academic experience with a focus on student learning (Hemwall, 2008;
Lowenstein, 2005). Responsibilities include assisting students with orientation, course selection,
degree planning, personal development, career decisions, and resource access, among others
(Ender, Winston, & Miller, 1982; Gordon, 1992). Academic advisors are often the “only
individual the students are obligated to visit three or four times each academic year” (Ender,
Winston, & Miller, 1982, p. 6).
Students benefit from advisors who can share knowledge, resources, and support across
the campus (Self, 2008). Studies of academic advising find that organizational models vary
across institutions (Habley, 1988; Lynch & Stucky, 2000). In a now-dated finding, Habley
(1988) found differences in advising loads by institutional control, with loads at public
institutions about twice that of private ones.
Frequency of interactions with advisors is important due to the relationship between
advising and student success (e.g., Barbuto, Story, Fritz, & Schinstock, 2011; Winston, et al.,
1984). How academic advising influences student persistence is unclear, as researchers have
found both direct and indirect effects of advising on students’ persistence decisions (Kot, 2014;
Metzner, 1989; Pascarella & Terenzini, 2005; Swecker, Fifolt & Searby, 2013). Academic
advising also impacts student satisfaction, career aspirations, perceptions of a supportive
environment, and campus navigation (Cuseo, n.d.; Drake, 2011; Habley, 1981; National Survey
SEEKING ADVICE 5
of Student Engagement [NSSE], 2014; Smith & Allen, 2014; Swecker et al., 2013; Trombley &
Holmes, 1981; Winston, et al., 1984). These outcomes can be influenced by institutions, as the
frequency of contact with advisors can be altered through practices such as intrusive advising
(Schwebel, Walburn, Jacobsen, Jerrolds, & Klyce, 2008; Schwebel, Walburn, Klyce, & Jerrolds,
2012). However, students’ perceptions of advising roles and satisfaction with the advising
experience vary (Christian & Sprinkle, 2013; Kuh, 2008). Students desire accurate information,
guidance, and support from their advisors (Allen & Smith, 2008) and the changing student body
composition challenges academic advisors to tailor their services to student needs and interests
(Cook, 2009; Kennedy & Ishler, 2008).
Study Purpose
While the importance of academic advising is well established, the literature on advising
largely ignores the threshold question of how often students meet with advisors and how student
and institution characteristics shape the frequency of these meetings. The existing literature
examining these questions dates from the 1980s and is not representative of today’s diverse
college student body (Habley, 1988) or how the organization of advising has changed. To add to
and update the empirical literature on advising, we exploit recent data collected from a large
multi-institutional survey. We focus on first-year students, as these students recently transitioned
to college and have the most need for interacting with an advisor as part of their transition to
college. This study is the beginning of a larger effort to investigate how advising shapes college
experiences and outcomes for current undergraduates.
Our focus on the frequency of interactions with an advisor was informed by Pascarella’s
(1985) general causal model of college impact. In this model, interactions with socializing
agents, such as faculty and advisors, are conditioned by characteristics of students and of the
SEEKING ADVICE 6
environment of the institutions attended. Thus, we view academic advisors as one potential
pathway to improve students’ learning and development. However, the efficacy of
undergraduates’ interactions with advisors depends upon how much the institution emphasizes
services and activities designed to improve student outcomes. For example, the ability of an
advisor to guide a student to services, like tutoring or job placement, or special opportunities,
such as study abroad or an internship, that facilitate learning and development depends upon the
institution’s commitment to providing the services.
Methods
Data
We utilized data from the 2013 National Survey of Student Engagement (NSSE)
administration. Due to our focus on academic advising during the first year of college, we
limited our data set to first-year respondents at institutions that chose to administer NSSE and the
optional Academic Advising module. We also excluded students attending special-focus
institutions, such as seminaries and art schools, and part-time students,1 as we focused on the
frequency of interactions with advisors and lacked data on part-time students’ credit loads. After
accounting for these exclusions, our final dataset contained 52,546 full-time, first-year students
who attended 209 U.S. bachelor’s degree-granting institutions2.
About two-thirds of the respondents were female and 68% lived on campus. Two out of
three students were White; African American and Hispanic/Latino students each comprised 9%
of the sample; Asian and foreign students each represented 4% of respondents, while the
remaining students were American Indian or Alaska Native, multiracial, or of another
(unspecified) racial/ethnic background. About two-thirds of the sample attended public
1 Part-time students on average had .33 fewer advisor meetings than full-time students. Additionally, part-time students were about twice as likely as full-time students to never meet with an advisor. 2 NSSE is limited to bachelor’s-granting institutions.
SEEKING ADVICE 7
institutions. Students attending doctorate-granting and master’s universities represented 41% and
45% of the sample, respectively, while the remaining students attended baccalaureate colleges.
Our outcome measure was the number of times students reported having met with an
academic advisor during the school year “to discuss [their] academic interests, course selections,
or academic performance.” Response options included exact enumerations from zero to five, plus
a final option of “6 or more” (coded as six). Student-level covariates included a variety of
student and academic characteristics. We also used data on the following institutional
characteristics: Carnegie classification, selectivity, control, undergraduate enrollment, and per-
FTE expenditures on student services.
We used multiple imputation by chained equations (MICE) to impute missing data.
Multiple imputation is a preferred way to handle missing data (Allison, 2001) and MICE
outperforms other imputation methods (van Buuren, 2007; Yu, Burton, & Rivero-Arias, 2007).
Imputing data was particularly important in this study, as our outcome measure appeared near
the end of a comprehensive survey and about 20% of the respondents did not answer our
dependent variable due to survey attrition. We used a total of 20 imputations to minimize the
loss of statistical power (Graham, Olchowski, & Gilreath, 2007), but keep the computation time
reasonable. Continuous variables were imputed using predictive mean matching, while binary,
ordinal, multinomial, and count variables were imputed using the appropriate form of logistic or
Poisson regression.
Analyses
We began by examining the mean and distribution of advisor meeting frequency during
the first year. Because our dependent variable is a count, we checked the assumptions of the
Poisson regression model to assess whether the Poisson or another count model would be more
SEEKING ADVICE 8
appropriate. We then investigated bivariate relationships between the number of advisor
meetings and a variety of student and institutional characteristics by regressing the number of
meetings on each characteristic separately. Finally, we built three regression models that
controlled for varying combinations of student and institutional characteristics. The first model
only contained student characteristics. The second model added all institutional characteristics
except for institutional control, and the final model added institutional control. We converted
regression coefficients into incident rate ratios (IRR), which are analogous to odds ratios in
logistic regression and represent the expected multiplicative change in the predicted number of
advising meetings associated with a unit increase in the independent variable. That is, an IRR of
.90 corresponds to a 10% reduction in the number of meetings, while an IRR of 1.10 corresponds
to a 10% increase.
We weighted all analyses by gender and institution size to correct for nonresponse bias.
We used robust standard errors to account for the clustered nature of our data and further
adjusted them to account for the uncertainty of the imputation (Rubin, 1987). Additionally, we
compared the coefficients from the final model to an unimputed model with the same covariates
using z-tests. Only one estimate (Barron’s selectivity of highly competitive) was significantly
different using a critical value of p < .05. Since only one of the 52 coefficient estimates was
significantly different and this variable was not imputed, we concluded that any difference
between the imputed and unimputed model is most likely due to chance.
Limitations
While our data are relatively unique in enabling the investigation of advising practices at
a large number of institutions, the institutions included in our sample choose to administer NSSE
and the academic advising module. Thus, these institutions took affirmative steps to assess

SEEKING ADVICE 9
advising practices and may not be representative of all bachelor’s-granting institutions. Second,
our data on the frequency of advising interactions is self-reported by students and is subject to
recall bias. NSSE is administered during the spring and sends reminder emails to non- and partial
respondents encouraging them to complete the survey. Therefore, respondents completed the
survey at different time points and we may not be capturing advising meetings that occur
towards the end of the first academic year, such as course planning for the fall term.
Additionally, the question wording may not capture advising interactions that occur via phone,
email, or web-based systems. Also, as discussed above, we had a considerable amount of missing
data in our dependent variable. We used the best possible methodological practices to handle
these missing cases and compared the results to an unimputed model, but the missing data might
impact our results if the number of advising meetings is correlated with survey nonresponse.
Results
The average full-time first-year student met with an advisor twice during the school year.
Meeting with an advisor one to three times appears to be normative for first-year students, as this
range encompassed about three out of four students in our sample (Figure 1). About one student
in ten never met with an advisor.
Next, we investigated which count model was most appropriate for our data. In checking
our data against the assumptions of the Poisson general linear model, we observed that our
outcome did not have excessive zeros and that, with a mean and variance of 2.29 and 2.27,
respectively, the counts were not overdispersed. We decided to use a general linear model with a
Poisson distribution in our analyses. A goodness of fit test for our final model also indicated an
appropriate fit to the data.
SEEKING ADVICE 10
Table 1 presents our bivariate and multivariate findings. The first column displays
bivariate associations for the student and institutional characteristics examined. Student-athletes
met with an advisor about 15% more often than non-athletes. Similarly, on-campus students met
with an advisor about nine percent more frequently than students living off campus. Black and
foreign students met advisors more often than Whites.3 Compared to students in the social
sciences, arts & humanities and biological sciences majors met with advisors more often, while
business majors less often did so.4 Students with a parent holding a doctoral or professional
degree met with advisors more frequently than their peers with a highest parental education level
of bachelor’s. Students expecting to earn only a bachelor’s degree met with advisors less often
than students who expected to complete either less than or more than a bachelor’s degree.
Students who received mostly Bs met with advisors slightly less often than those who received
mostly As. The amount of time spent studying was positively correlated with frequency of
advisor meetings. Students over age 23 met less often with advisors compared with those under
20. Interestingly, there was no significant bivariate relationship between prior preparation (as
measured by SAT score) and frequency of advisor meetings.
Several institutional characteristics were also associated with the number of advising
meetings. Students attending baccalaureate colleges met with an advisor more often than
students at doctoral institutions. Advising meetings were also more common at more selective
institutions (Barron’s rating higher than “competitive”). Indeed, the largest bivariate relationship
in the table is for students attending baccalaureate arts and sciences colleges, associated with a
25% increase in the number of meetings compared to doctoral institutions. Students attending
institutions with fewer than 5,000 undergraduates met with advisors more often than their peers
3 “Foreign” is included in race/ethnicity because this is an institution-reported variable that aligns with reporting standards for the Integrated Postsecondary Education data System (IPEDS). 4 Major-field groups include expected majors.
SEEKING ADVICE 11
at larger institutions. Per full-time equivalent student services spending was positively related to
frequency of advising meetings, with a 6% increase in advising meetings for every $1,000 in per-
student expenditure. Finally, students at private institutions met with advisors about 19% more
often than their peers at public institutions.
The remaining columns in Table 1 display results for the three regression models. Model
1 adds parameters for student characteristics only, Model 2 adds institutional characteristics
other than control, and Model 3 adds institutional control. The final model shows that holding
other factors constant, many of the bivariate relationships with student characteristics described
earlier continue to hold (though the magnitude of the estimates changed). Student-athletes and
on-campus residents met 8% and 5% more often with an advisor, respectively, controlling for
other characteristics. Asian, Black, and foreign students met with advisors more frequently than
White students after holding other factors constant. Students majoring in the arts and humanities,
biological sciences, and education, as well as undecided students, met more often with advisors
than did social science majors net of the other student and institutional characteristics. Students
with a parent who holds a doctoral or professional degree (e.g., M.D., J.D.) met with an advisor
3% more frequently than students with a parental education level of bachelor’s. Students who
expected to earn just a bachelor’s degree were the least likely to meet with an advisor, as
students who did not expect to earn a bachelor’s and those seeking more advanced degrees met
more frequently with an advisor holding other characteristics constant. The frequency of
interactions with an advisor also varied with students’ grades. Relative to students earning
mostly As, those who received mostly Bs had fewer meetings while those earning mostly Cs or
lower had more meetings. The amount of time spent studying was positively correlated with the
frequency of advisor meetings. Students aged 23 or older met less often with an advisor than
SEEKING ADVICE 12
students under age 20 after controlling for other characteristics. Additionally, SAT score had a
modest negative relationship with the number of advisor interactions, as a 100 point increase was
associated with an estimated 2% reduction in the number of meetings after holding other
characteristics constant.
In contrast with the findings for student characteristics, nearly all significant bivariate
relationships with institutional characteristics fell away in the multivariate models. In Model 2,
with controls for institutional characteristics other than control, the only significant finding
among institutional characteristics was a positive relationship with per full-time equivalent
student services spending. Each thousand dollar increase in spending was associated with a 3%
increase in the number of advising meetings. However, this relationship became non-significant
after adding institutional control into our third model. In the final model, students attending
private institutions met advisors about 13% more often than their peers at public institutions,
holding other characteristics constant.
Discussion
The diversity and complexity of America’s higher education system virtually necessitates
that students receive a wide variety of advice from informed persons before and after
matriculating into college. Students must navigate an environment that contains substantially
different requirements both between and within institutions and that can change over time. In a
complex and unfamiliar environment, advice from peers or family members may be insufficient
or incorrect. Academic advisors help connect students to campus resources that can enrich their
educational experiences or assist them to overcome problems. Additionally, advisors can help
students understand the connections between current educational activities and their long-term
goals.

SEEKING ADVICE 13
Due to these important functions, it is not surprising that academic advising has been
linked to student satisfaction, persistence, and other desirable outcomes (e.g., Barbuto et al.,
2011; Winston, et al., 1984). While it is generally accepted that interactions with advisors are
beneficial to undergraduates, little is known about how often these interactions occur and how
this may be related to student and institution characteristics. Using data from over 50,000 first-
year students attending 209 institutions, we examined how often students met with an advisor
and the correlates of these interactions. We found that the typical full-time first-year student met
with an advisor one to three times per school year. However, about 10% never met with an
advisor.
A number of student background and academic characteristics were related to the
frequency of advisor meetings, but after controlling for student characteristics, we found few
differences in the frequency of advising interactions by institutional characteristics. The
exception was type of institutional control: Students who attended private institutions on average
had 13% more interactions with an advisor than their peers at public colleges and universities,
holding constant student and other institutional characteristics. Bivariate relationships between
Carnegie type, size, and selectivity dropped from significance in the multivariate analysis, and a
positive relationship between student services expenditures and number of advising meetings
observed in Model 2 became nonsignificant after adding private/public status in Model 3. Private
control was the only significant institutional characteristic in that model, and it also showed the
largest estimated effect in that model. This result suggests that while private institutions spend
more on student services than publics, there is something unique about private institutions and
advising interactions—beyond institution type, size, and selectivity—that accounts for this
increased spending. For example, students may demand more personalized services, like

SEEKING ADVICE 14
advising, from private institutions than publics due their higher costs, shortening time to degree.
Private institutions may differ in the types of student services they finance, and these differences
increase students’ willingness to consult with advisors. Alternatively, private colleges and
universities may feel compelled to provide additional advising services to differentiate
themselves from their less costly public competitors. Finally, private institutions may simply be
more insistent that students meet with advisors during the first year, for example by requiring
such meetings as a condition of registration. Although our data do not reveal whether advisors
were faculty or professional advisors, previous research (Habley, 1988; Lynch & Stucky, 2000;
Self, 2013) suggests that students at many private institutions are advised by faculty rather than
professional advisors. If this is true, our findings may challenge assumptions about the benefits
the professional academic advisor model and faculty willingness to commit time to advising
(Selingo, 2014)5.
In contrast to the institutional characteristics, we found that advising interactions varied
by a variety of student characteristics. Student athletes on average had eight percent more
interactions with an advisor than their peers, holding constant other factors. A possible reason for
this relationship is due to specialized or intrusive advising practices implemented by many teams
whereby student-athletes interact more frequently with advisors regardless of academic need, to
ensure the student-athlete fulfills NCAA academic requirements. A similar rationale may explain
why foreign students met with an advisor nine percent more often than White students, after
controlling for other factors. Advisors who work with foreign students, particularly those in their
first year, may proactively encourage students to meet with them to monitor their transition into
the United States. International students must also meet the requirements of the federal Student
5 We hasten to note, however, that the number of advising meetings is different from the quality of academic advice provided.

SEEKING ADVICE 15
and Exchange Visitor Information System and may need to interact with an advisor to obtain
permission to change their courses or work. In combination, these findings comport with
previous research that intrusive advising practices can promote greater student interaction with
an advisor (Schwebel et al., 2008; 2012).
Two findings suggest a bimodal relationship between frequency of advisor meetings and
academic performance. Students expecting to obtain no more than a bachelor’s degree had less
frequent interactions on average than their peers not expecting to complete college as well as
those planning to earn a graduate degree. Similarly, students who obtained mostly B grades had
fewer advising interactions during their first college year than those who earned mostly As,
while those who had mostly Cs or below had more interactions than those with mostly As, net of
SAT scores and other characteristics. These findings suggest that students who are struggling or
very successful academically meet with advisors more often than the typical academic student,
and can speculate that the reasons for meeting with advisors differ for the groups at the extremes
of educational expectations and academic performance. That said, we did find a positive
relationship between the amount of time spent studying and the number of advising interactions
and a negative relationship between SAT scores and the frequency of advisor meetings, net of
other characteristics.
Implications for Research
This exploratory study suggests several important avenues for future research. The data
used for the current study do not permit us to analyze either the reasons for advising meetings or
the organization of advising at the institutional level, and both would help advance our
understanding. Knowing more about the purpose of advising meetings would illuminate
observed differences related to student characteristics, especially the apparently bimodal

SEEKING ADVICE 16
relationship related to students’ academic performance. It could also help us understand the role
of “intrusive advising” for students experiencing academic difficulty.
How an institution organizes advising is another important area for further research. In
what ways is the advising relationship different when an advisor is a faculty member as opposed
to a professional academic advisor? What is an appropriate case load for a faculty or professional
advisor? To what extent can technology offset the demands of face-to-face meetings? What is the
impact of special advising programs for student-athletes? And of particular importance given our
findings, how is the organization and delivery of advising distinctive at private institutions?
This analysis also does not take into account students’ subjective judgment of the quality
and value of the advice received from an advisor. Incorporating such measurements could go far
to explain students’ choices with regard to advising. Some students may elect not to meet with an
advisor after an unsatisfactory experience, and this may be an entirely rational response.
Future research might focus attention on extreme cases. For example, it is worrisome that
about one in ten full-time, first-year students (9%) never met with an advisor, and about one-
quarter (24%) did so only once.6 To what extent does this pattern represent scheduling
constraints limiting opportunities to consult with an advisor, versus choice behavior based on
students’ judgments about the relevance and value of advising for their circumstances? Did these
students realize different academic outcomes than otherwise similar students who met more often
with advisors?
At the other extreme, about one in five first-year students met at least four times with an
advisor, including about one in ten (9%) who had at least five advising meetings. Who are the
6 Previous analyses of NSSE data indicate that older, commuting, and part-time students are over-represented among students who never or only once met with an advisor (NSSE, 2014).
SEEKING ADVICE 17
“hyper-advised” and what are their reasons for frequent advising meetings? Is this group
composed primarily of low- and high-achievers?
Some research implications involve research design. Although the present study involves
a large and diverse institutional sample of 209 colleges and universities, those institutions self-
selected into NSSE and the advising module. It would be valuable to test whether the
relationships observed here stand up in a research design using a nationally representative
sample of institutions. The present study examined only bachelor’s degree-granting institutions,
and it would also be important to extend the research to inform the advising function at
community colleges. As a cross-sectional study, the present research cannot demonstrate a causal
relationship between frequency of advising meetings and student behavior and outcomes. For
example, we found a positive relationship between the amount of time students devote to class
preparation and the number of advising meetings. But because of the cross-sectional nature of
the study, we don’t know whether this relationship simply reflects the behavior of motivated,
diligent students, or the result of interactions with advisors. A longitudinal or experimental
design could fruitfully inform a variety of questions related to the efficacy and impact of
advising.
Implications for Practice
Our findings also offer implications for practice. These results can be used to identify
student populations who may be less inclined or less able to take full advantage of academic
advising, and to tailor programs to meet their needs. For example, the bimodal pattern described
earlier, whereby students who are neither struggling nor excelling interact less often with
advisors, raises questions of whether the needs of “the vast middle” are being properly served.
SEEKING ADVICE 18
It is clear from the present study that the assertion by Ender, Winston, and Miller (1982)
that first-year students “are obligated to visit [an advisor] three or four times each academic
year” (p. 6) no longer holds. If periodic advising meetings are important to student success, then
our results suggest the need for more systematic tracking of advising relationships. This is
particularly important due to the changing nature of advising with a blend of in-person and
online interactions. Additionally, the tendency of older and commuter students to meet less often
with advisors (documented elsewhere; see NSSE, 2014) suggests the need to examine how well
advising arrangements meet the needs of these populations.
Conclusion
Academic advising plays an important role in student success by facilitating students’
transition to college and ensuring that they are well acquainted with course offerings, degree
requirements, support services, and special opportunities. As colleges and universities face
mounting pressure to increase completion rates and shorten time to degree, improving the reach
and effectiveness of advising systems may be an important leverage point. Yet despite its
importance, empirical investigation into advising has been surprisingly sparse in recent years.
The present study offers a first step in broadening the knowledge base on academic advising, and
it exposes a number of avenues for further investigation.
SEEKING ADVICE 19
References
Allen, J. M., & Smith, C. L. (2008). Faculty and student perspectives on advising: Implications for student dissatisfaction. Journal of College Student Development, 49(6), 609-624.
Allison, P. D. (2001). Missing data. Thousand Oaks, CA: Sage.
Barbuto Jr., J. E., Story, J. S., Fritz, S. M., & Schinstock, J. L. (2011). Full range advising: Transforming the advisor-advisee experience. Journal of College Student Development, 52(6), 656-670.
Christian, T. Y., & Sprinkle, J. E. (2013). College student perceptions and ideals of advising: An exploratory analysis. College Student Journal, 47(2), 271-291.
Cook, S. (2009). Important events in the development of academic advising in the United States. NACADA Journal, 29(2), 18-40.
Cuseo, J. (n.d.). Academic advisement and student retention: Empirical connections & systemic interventions. Retrieved from http://www.nacada.ksu.edu/Resources/Clearinghouse/View-Articles/Retention-and-attrition-resources.aspx
Drake, J. K. (2011). The role of academic advising in student retention and persistence. About Campus, 16(3), 8-12.
Ender, S. C., Winston, Jr., R. B., & Miller, T. K. (1982). Academic advising as student development. In R. Winston, S. Ender, & T. Miller (Eds.), New Directions for Student Services: Developmental Approaches to Academic Advising, no. 17. (pp. 3-18). San Francisco, CA: Jossey-Bass.
Gordon, V. N. (1992). Handbook of academic advising. Westport, CT: Greenwood Press.
Graham, J. W., Olchowski, A. E., & Gilreath, T. D. (2007). How many imputations are really needed? Some practical clarifications of multiple imputation theory. Prevention Science, 8(3), 206-213.
Habley, W. R. (1981). Academic advisement: The critical link in student retention. NASPA Journal, 18(4), 45–50.
Habley, W. R. (1988). The status and future of academic advising: Problems and promise. The ACT National Center for the Advancement of Educational Practice. Eric Clearinghouse Brief (#ED346903). Retrieved from http://eric.ed.gov/?id=ED346903.
Hemwall, M. K. (2008). Advising delivery: Faculty advising. In V. N. Gordon, W. R. Habley, T. J. Grites & Associates (Eds.), Academic Advising: A Comprehensive Handbook (Second ed., pp. 253-266). San Francisco, CA: John Wiley & Sons, Inc.
Kennedy, K., & Ishler, J. C. (2008). The changing college student. In V. N. Gordon, W. R. Habley, T. J. Grites & Associates (Eds.), Academic Advising: A Comprehensive Handbook (Second ed., pp. 123-141). San Francisco, CA: John Wiley & Sons, Inc.
Kot, F.C. (2014). The impact of centralized advising on first-year academic performance and second-year enrollment behavior. Research in higher education, 55, 527-563.

SEEKING ADVICE 20
Kuh, G. D. (2008). Advising for student success. In V. N. Gordon, W. R. Habley, T. J. Grites & Associates (Eds.), Academic Advising: A Comprehensive Handbook (Second ed., pp. 68-84). San Francisco, CA: John Wiley & Sons, Inc.
Lowenstein, M. (2005). If advising is teaching, what do advisors teach? NACADA Journal, 25(2) 65-73.
Lucas, C. J. (1994). American Higher Education: A History, Second Edition. New York: Palgrave Macmillan.
Lynch, M. L., & Stucky, K. (2000). Advising at the millennium: Advisor roles and responsibilities. NACADA Journal, 21(1), 15-31.
McCormick, A. C. (2011). It’s about time: What to make of reported declines in how much college students study. Liberal Education, 97(1), 30-39.
Metzner, B. S. (1989). Perceived quality of academic advising: The effect on freshmen attrition. American Educational Research Journal, 26, 422–442.
National Academic Advising Association (2014). About us. Retrieved from http://www.nacada.ksu.edu/About-Us/Vision-and-Mission.aspx
National Survey of Student Engagement (2014). Bringing the institution into focus—Annual results 2014. Bloomington, IN: Indiana University Center for Postsecondary Research.
Pascarella, E. T. (1985). College environmental influences on learning and cognitive development: A critical review and synthesis. In J. C. Smart (Ed.), Higher education: Handbook of theory and research (Vol. 1). New York: Agathon.
Pascarella, E. T., & Terenzini, P. T. (2005). How college affects students: A third decade of research (Vol. 2). San Francisco, CA: John Wiley & Sons, Inc.
Rubin, D. B. (1987). Multiple imputation for nonresponse in surveys. New York: Wiley.
Schwebel, D. C., Walburn, N. C., Jacobsen, S. H., Jerrolds, K. L., & Klyce, K. (2008). Efficacy of intrusively advising first-year students via frequent reminders for advising appointments. NACADA Journal, 28(2), 28–32,
Schwebel, D. C., Walburn, N. C., Klyce, K., & Jerrolds, K. L. (2012). Efficacy of advising outreach on student retention, academic progress and achievement, and frequency of advising contacts: A longitudinal randomized trial. NACADA Journal, 32(2), 36-43.
Self, C. (2008). Advising delivery: Professional advisors, counselors, and other staff. In V. N. Gordon, W. R. Habley, T. J. Grites & Associates (Eds.), Academic Advising: A Comprehensive Handbook (Second ed., pp. 267-278). San Francisco: Wiley.
Self, C. (2013). Implications of advising personnel of undergraduates 2011 National Survey. Retrieved from: http://www.nacada.ksu.edu/Resources/Clearinghouse/View-Articles/Implications-of-advising-personnel-of-undergraduates-2011-National-Survey.aspx
Selingo, J. J. (2014). Who advises best, pros or profs? New York Times. Retrieved from http://www.nytimes.com/2014/04/13/education/edlife/who-advises-best-pros-or-profs.html
SEEKING ADVICE 21
Smith, C. L. & Allen, J. M. (2014). Does contact with advisors predict judgments and attitudes consistent with student success? A multi-institutional study. NACADA Journal, 34(1), 50-63.
St. John, E. P., Hu, S., & Fisher, A. (2011). Breaking through the access barrier: How academic capital formation can improve policy in higher education. New York: Taylor & Francis.
Swecker, H., Fifolt, M., &Searby, L. (2013). Academic Advising and First-Generation College Students: A Quantitative Study on Student Retention. NACADA Journal, 33(1), 46-53.
Trombley, T. B., & Holmes, D. (1981). Defining the role of academic advising in the industrial setting: The next phase. NACADA Journal, 1(2), 1-8.
van Buuren, S. (2007). Multiple imputation of discrete and continuous data by fully conditional specification. Statistical Methods in Medical Research, 16(3), 219-242.
Winston, Jr., R. B., Miller, T. K., Ender, S. C., Grites, T. J., & Associates. (1984). Developmental academic advising. San Francisco, CA: Jossey-Bass Publishers.
White, E., & Schulenberg, J. (2012). Academic advising: A focus on learning. About Campus,16, 11-17.
Yu, L. M., Burton, A., & Rivero-Arias, O. (2007). Evaluation of software for multiple imputation of semi-continuous data. Statistical Methods in Medical Research, 16(3), 243-258.

SEEKING ADVICE 22
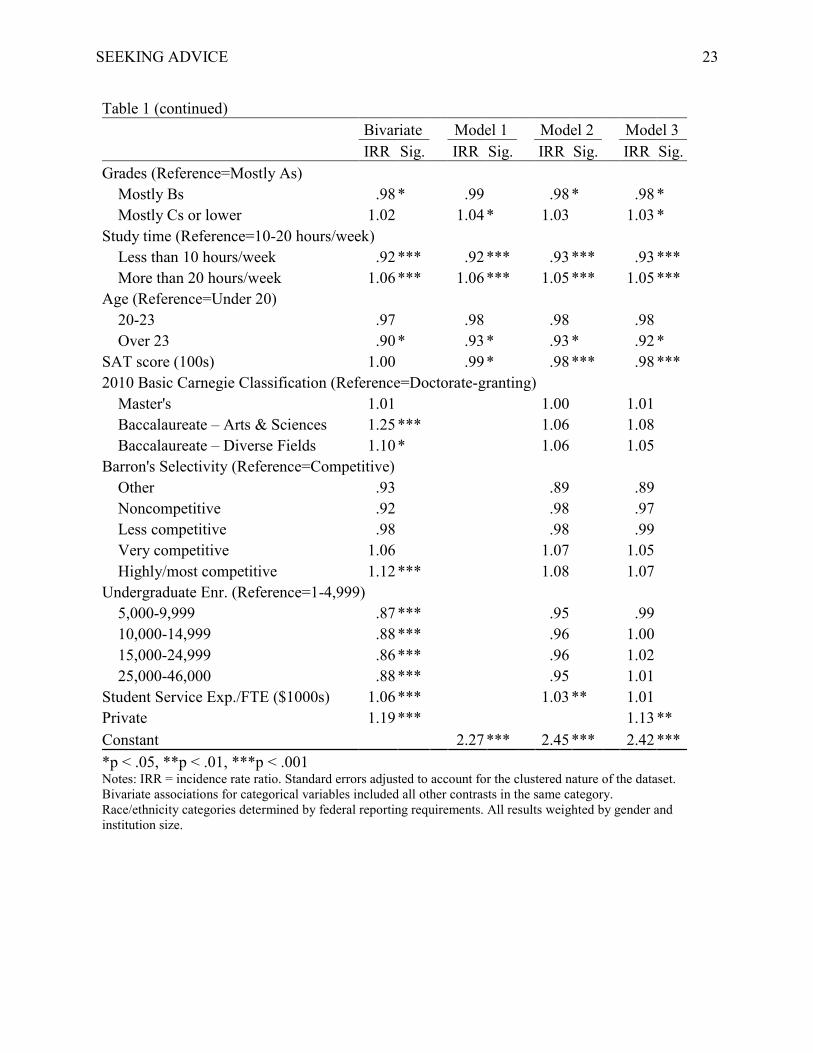
Table 1. Poisson regression estimates of the number of meetings with an advisor (N=52,546)
Bivariate
Model 1
Model 2
Model 3 IRR Sig. IRR Sig. IRR Sig. IRR Sig. Male .99
1.00
1.00
1.00
Student athlete 1.15 ***
1.14 ***
1.09 ***
1.08 *** On campus 1.09 ***
1.08 ***
1.06 ***
1.05 ***
All courses online .91
1.01
.95
.92 Race/ethnicity (Reference=White)
Native American 1.00
1.01
1.00
1.01 Asian/Pacific Islander 1.05
1.06 *
1.06 *
1.05 *
Black 1.10 ***
1.09 ***
1.08 ***
1.08 *** Hispanic/Latino 1.02
1.02
1.03
1.03
Foreign 1.11 ***
1.12 ***
1.10 ***
1.09 *** Multiracial 1.00
.99
.99
.99
Other 1.05
1.06
1.05
1.04 Major field (Reference=Social Sciences)
Arts & Humanities 1.05 *
1.07 ***
1.08 ***
1.07 *** Biological Sciences 1.05 **
1.03
1.03
1.03 *
Physical Sciences 1.00
1.01
1.02
1.02 Business .96 *
.98
.99
.99
Communications .97
1.01
1.02
1.01 Education 1.02
1.04 *
1.06 **
1.06 **
Engineering .97
.99
1.00
1.01 Health Professions .98
.98
1.00
1.00
Social Service Professions .96
.99
1.00
1.01 Other major .97
1.02
1.02
1.02
Undecided 1.01
1.05 *
1.05 *
1.06 * Parental Education (Reference=Bachelor's)
Less than high school 1.03
1.04
1.04
1.04 High school 1.00
1.01
1.01
1.01
Associate’s/Some college .98
.99
.99
.99 Master's 1.02
1.00
1.00
1.00
Doctoral/professional 1.07 ***
1.05 **
1.03 *
1.03 * Educational Expectations (Reference=Bachelor's)
Some college 1.06 *
1.06 *
1.05 *
1.05 * Master's 1.07 ***
1.06 ***
1.06 ***
1.06 ***
Doctoral/professional 1.13 *** 1.10 *** 1.10 *** 1.09 ***
SEEKING ADVICE 23
Table 1 (continued)
Bivariate
Model 1
Model 2
Model 3
IRR Sig. IRR Sig. IRR Sig. IRR Sig. Grades (Reference=Mostly As)
Mostly Bs .98 *
.99
.98 *
.98 * Mostly Cs or lower 1.02
1.04 *
1.03
1.03 *
Study time (Reference=10-20 hours/week) Less than 10 hours/week .92 *** .92 *** .93 *** .93 ***
More than 20 hours/week 1.06 *** 1.06 *** 1.05 *** 1.05 *** Age (Reference=Under 20)
20-23 .97
.98
.98
.98 Over 23 .90 *
.93 *
.93 *
.92 *
SAT score (100s) 1.00
.99 *
.98 *** .98 *** 2010 Basic Carnegie Classification (Reference=Doctorate-granting)
Master's 1.01
1.00
1.01 Baccalaureate – Arts & Sciences 1.25 ***
1.06
1.08
Baccalaureate – Diverse Fields 1.10 *
1.06
1.05 Barron's Selectivity (Reference=Competitive)
Other .93
.89
.89 Noncompetitive .92
.98
.97
Less competitive .98
.98
.99 Very competitive 1.06
1.07
1.05
Highly/most competitive 1.12 ***
1.08
1.07 Undergraduate Enr. (Reference=1-4,999)
5,000-9,999 .87 ***
.95
.99 10,000-14,999 .88 ***
.96
1.00
15,000-24,999 .86 ***
.96
1.02 25,000-46,000 .88 ***
.95
1.01
Student Service Exp./FTE ($1000s) 1.06 ***
1.03 **
1.01 Private 1.19 ***
1.13 **
Constant 2.27 *** 2.45 *** 2.42 *** *p < .05, **p < .01, ***p < .001
Notes: IRR = incidence rate ratio. Standard errors adjusted to account for the clustered nature of the dataset. Bivariate associations for categorical variables included all other contrasts in the same category. Race/ethnicity categories determined by federal reporting requirements. All results weighted by gender and institution size.

SEEKING ADVICE 24
Figure 1 Percentage distribution of full-time first-year students by number of meetings with an academic advisor