seeing machines annual report 2014
DESCRIPTION
ÂTRANSCRIPT
2014 ANNUAL REPORT
Annual Report2014
saves liveswww.seeingmachines.com
Saves lives
2014 ANN
UAL REPO
RT
12014 ANNUAL REPORT
2014
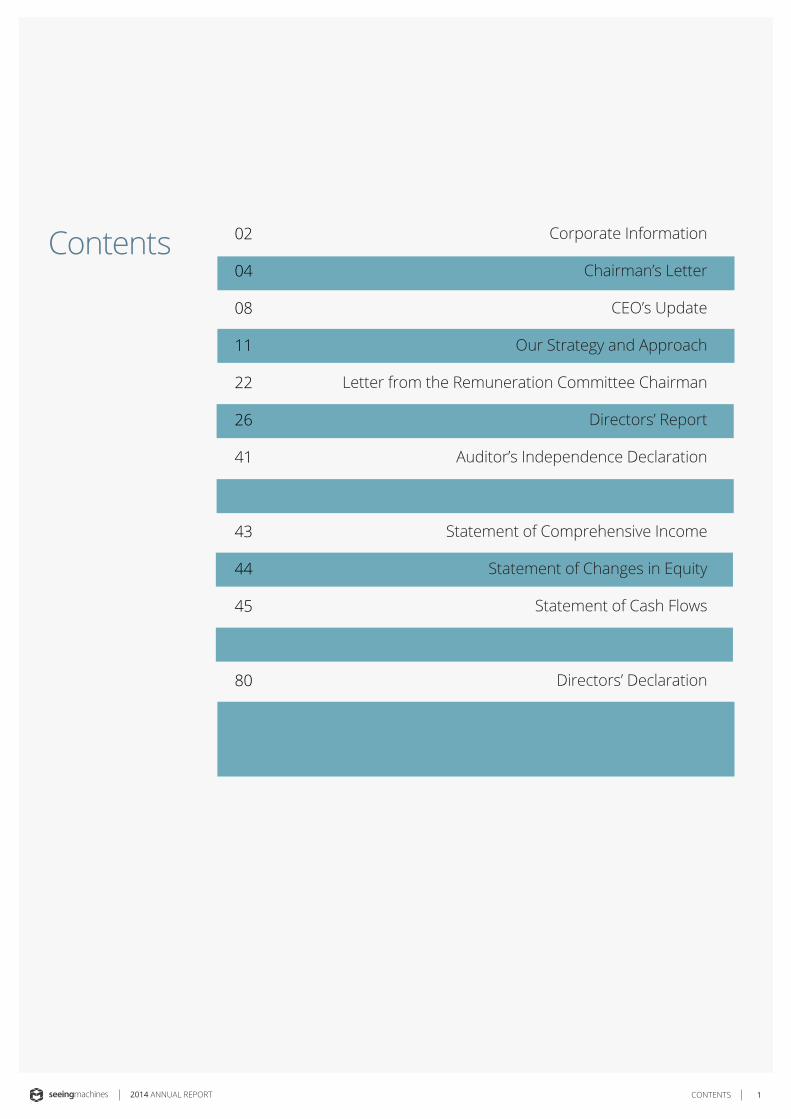
Contents 02
04
08
11
22
26
41
42
43
44
45
46
80
81
Corporate Information
Chairman’s Letter
CEO’s Update
Our Strategy and Approach
Letter from the Remuneration Committee Chairman
Directors’ Report
Auditor’s Independence Declaration
Statement of Financial Position
Statement of Comprehensive Income
Statement of Changes in Equity
Statement of Cash Flows
Notes to the Financial Statements
Directors’ Declaration
Independent Auditor’s Report to the Members of
Seeing Machines Limited
CONTENTS
2 2014 ANNUAL REPORT
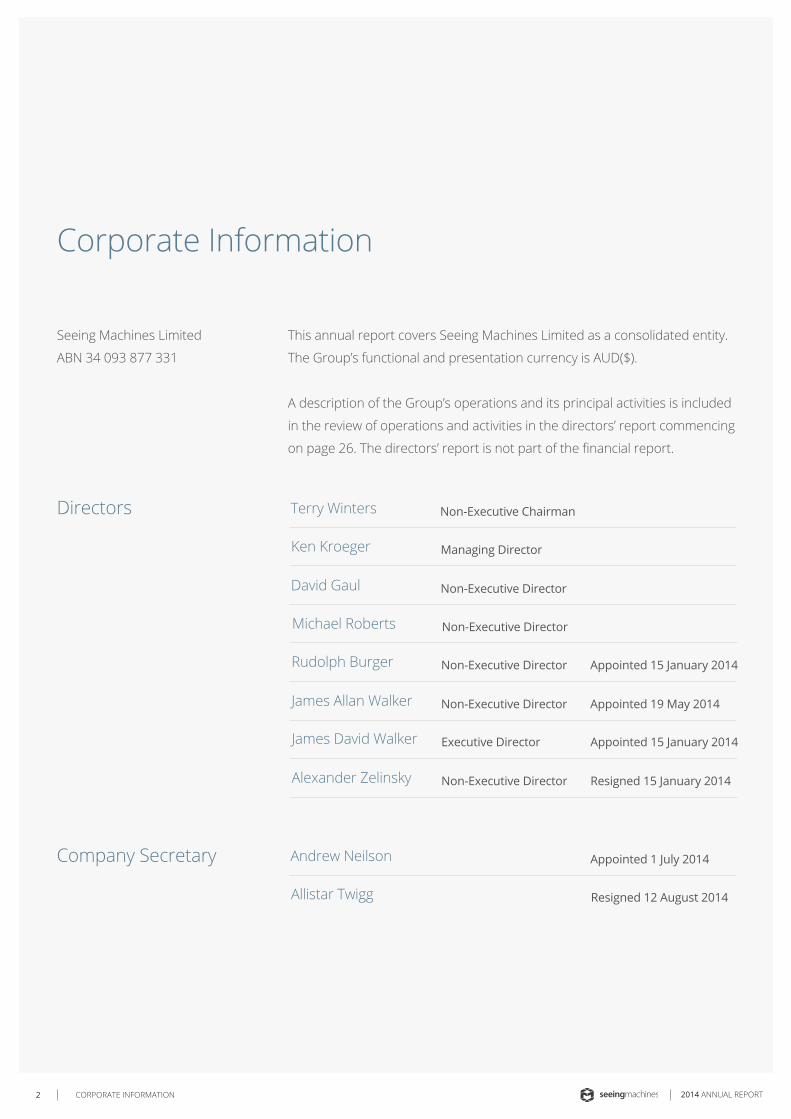
Corporate Information
This annual report covers Seeing Machines Limited as a consolidated entity.
The Group’s functional and presentation currency is AUD($).
A description of the Group’s operations and its principal activities is included
in the review of operations and activities in the directors’ report commencing
on page 26. The directors’ report is not part of the financial report.
Seeing Machines Limited
ABN 34 093 877 331
Directors
Company Secretary
CORPORATE INFORMATION
Non-Executive Chairman
Appointed 1 July 2014
Terry Winters
Andrew Neilson
Managing Director
Resigned 12 August 2014
Non-Executive Director
Non-Executive Director
Non-Executive Director
Executive Director
Non-Executive Director
Non-Executive Director
Appointed 15 January 2014
Appointed 15 January 2014
Appointed 19 May 2014
Resigned 15 January 2014
Ken Kroeger
Allistar Twigg
David Gaul
Michael Roberts
Rudolph Burger
James David Walker
James Allan Walker
Alexander Zelinsky
32014 ANNUAL REPORT
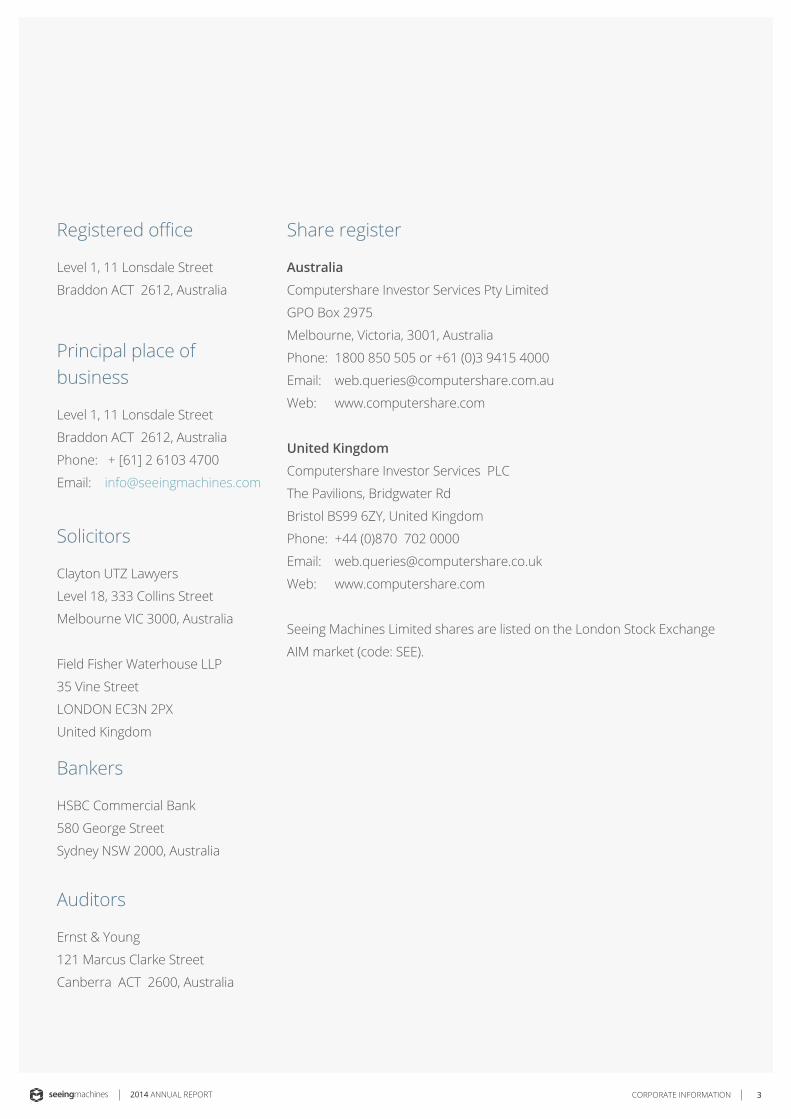
Level 1, 11 Lonsdale Street
Braddon ACT 2612, Australia
Australia
Computershare Investor Services Pty Limited
GPO Box 2975
Melbourne, Victoria, 3001, Australia
Phone: 1800 850 505 or +61 (0)3 9415 4000
Email: [email protected]
Web: www.computershare.com
United Kingdom
Computershare Investor Services PLC
The Pavilions, Bridgwater Rd
Bristol BS99 6ZY, United Kingdom
Phone: +44 (0)870 702 0000
Email: [email protected]
Web: www.computershare.com
Seeing Machines Limited shares are listed on the London Stock Exchange
AIM market (code: SEE).
Level 1, 11 Lonsdale Street
Braddon ACT 2612, Australia
Phone: + [61] 2 6103 4700
Email: [email protected]
Clayton UTZ Lawyers
Level 18, 333 Collins Street
Melbourne VIC 3000, Australia
Field Fisher Waterhouse LLP
35 Vine Street
LONDON EC3N 2PX
United Kingdom
HSBC Commercial Bank
580 George Street
Sydney NSW 2000, Australia
Ernst & Young
121 Marcus Clarke Street
Canberra ACT 2600, Australia
Registered office Share register
Principal place of business
Solicitors
Bankers
Auditors
CORPORATE INFORMATION
4 2014 ANNUAL REPORT
2014Dear ShareholderIt is my pleasure to present the 2014 Annual Report to shareholders as Chairman of your
Company.
OverviewSeeing Machines achieved record sales in the year ended 30 June 2014, with particularly
strong performance delivered from the Company’s continued roll-out of its DSS products
and services to the global mining sector. This growth has been aided by our strong
relationship with Caterpillar, our growing relationship with the Caterpillar Global Dealer
Network and the increased reach these dealers bring to our distribution capabilities.
In parallel with the successes being derived from our DSS product range, we are
experiencing significant interest from other much larger markets, including the long
distance road freight transport industry and rail networks.
This has reinforced the Company’s research and development focus:
• Developing original equipment manufacturer (OEM) products for the world’s leading
automobile and truck manufacturers that in the foreseeable future are expected
to lead to DSS type capabilities being incorporated into Advanced Driver Assistance
Systems (ADAS) for new vehicles;
• Developing OEM products that will deliver DSS type capabilities into today’s fleets of
long distance road freight transport and rail network operators;
• Developing after-market products that will deliver DSS type capabilities into today’s
fleets of long distance road freight transport and rail network operators.
CHAIRMAN’S LETTER
Chairman’s Letter
52014 ANNUAL REPORT
2014
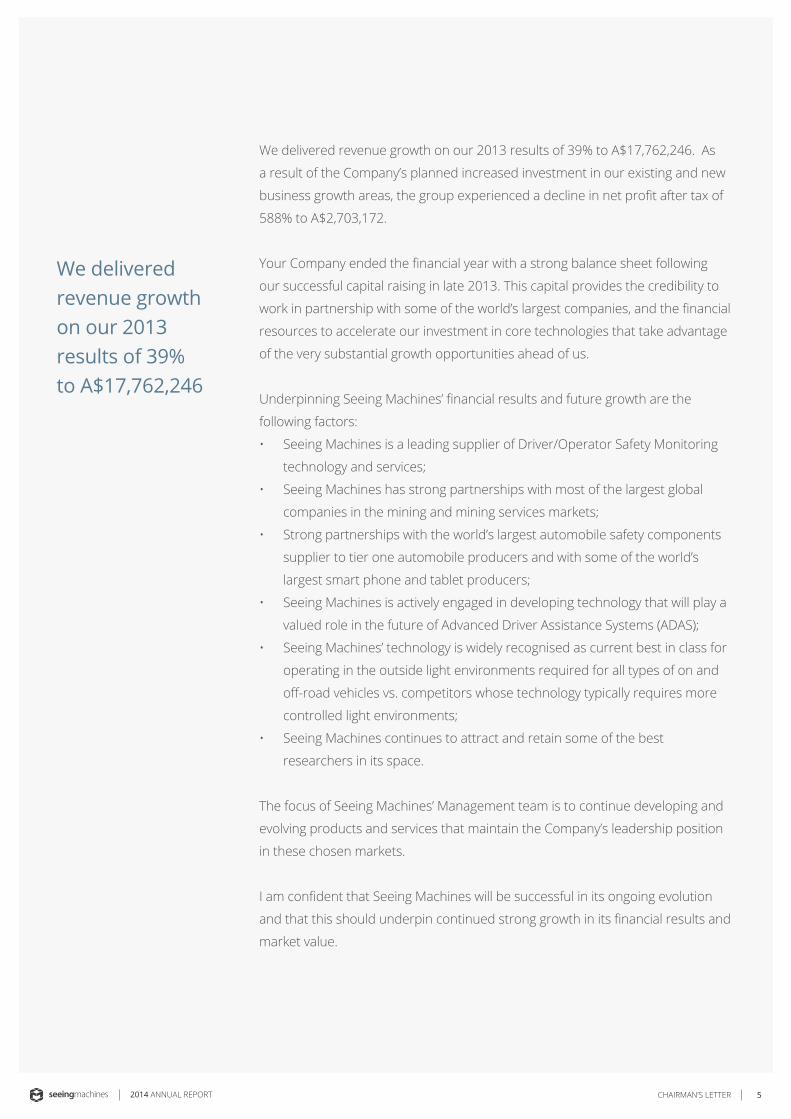
We delivered revenue growth on our 2013 results of 39% to A$17,762,246. As
a result of the Company’s planned increased investment in our existing and new
business growth areas, the group experienced a decline in net profit after tax of
588% to A$2,703,172.
Your Company ended the financial year with a strong balance sheet following
our successful capital raising in late 2013. This capital provides the credibility to
work in partnership with some of the world’s largest companies, and the financial
resources to accelerate our investment in core technologies that take advantage
of the very substantial growth opportunities ahead of us.
Underpinning Seeing Machines’ financial results and future growth are the
following factors:
• Seeing Machines is a leading supplier of Driver/Operator Safety Monitoring
technology and services;
• Seeing Machines has strong partnerships with most of the largest global
companies in the mining and mining services markets;
• Strong partnerships with the world’s largest automobile safety components
supplier to tier one automobile producers and with some of the world’s
largest smart phone and tablet producers;
• Seeing Machines is actively engaged in developing technology that will play a
valued role in the future of Advanced Driver Assistance Systems (ADAS);
• Seeing Machines’ technology is widely recognised as current best in class for
operating in the outside light environments required for all types of on and
off-road vehicles vs. competitors whose technology typically requires more
controlled light environments;
• Seeing Machines continues to attract and retain some of the best
researchers in its space.
The focus of Seeing Machines’ Management team is to continue developing and
evolving products and services that maintain the Company’s leadership position
in these chosen markets.
I am confident that Seeing Machines will be successful in its ongoing evolution
and that this should underpin continued strong growth in its financial results and
market value.
CHAIRMAN’S LETTER
We delivered revenue growth on our 2013 results of 39% to A$17,762,246
6 2014 ANNUAL REPORT
2014
Changes to the Board of DirectorsIn January 2014 we said farewell to long-standing director, and one of Seeing Machines’
founders, Dr Alex Zelinsky after 12 years of service to the Company. On behalf of the
Board, I thank Alex for his substantial contribution to Seeing Machines and wish him our
very best for the future.
We welcomed Dr Rudolph (Rudy) Burger to the Board as a non-executive director
in January 2014. Rudy’s background and experience are already adding value to the
Company. Over the past 25 years, Rudy has founded five digital media technology
companies in the US, run a European public company, and served as a senior executive
for two global 500 companies. Dr Burger is currently Founder and Managing Partner of
an investment bank headquartered in California.
In January 2014, we also invited James Walker, CFO, to join the Board as Finance Director
in recognition of the value he has added to the Company’s financial management and his
contribution to our successful capital raising in late 2013.
In May 2014 we welcomed Jim Walker who joined the Board as a non-executive director.
Jim has already made a positive contribution to the Company. Jim recently retired from
WesTrac (the Caterpillar dealer for Western Australia, New South Wales/Australian Capital
Territory and North East China) after 13 years as CEO.
The Board continues to review its composition, with a view to enhancing its capacity and
capabilities to support the ongoing growth of the business.
RemunerationSeeing Machines has made some positive changes to enhancing and explaining its
remuneration structure. The Board believes that these changes strengthen the nexus
between management incentives and long-term growth in shareholder value and that
the structure will serve shareholders well into the future. Please refer to page 22 for
further details.
CHAIRMAN’S LETTER
72014 ANNUAL REPORT
2014
Thanks and Congratulations to the Seeing Machines TeamI would like to acknowledge Ken Kroeger, CEO, our Executive Team and my Board colleagues
for their dedication and leadership over the past 12 months. I would also like to thank the
entire Seeing Machines family for their outstanding work this year which is reflected in the
company’s continuing growth and our positioning as a global leader in real-time monitoring
and intervention technology that enhances operator performance and safety through
intelligent in-house sensing technologies and analytics.
Finally, I thank our customers and shareholders for their loyalty and support.
Terry Winters Chairman Seeing Machines Limited
CHAIRMAN’S LETTER
8 2014 ANNUAL REPORT
2014CEO’s Update
IntroductionSeeing Machines saves lives – the organisation is committed to the
prevention of driver fatigue and distraction related accidents and is actively
engaged in developing technology that will play an increasingly important
role in the future of Advanced Driver Assistance Systems (ADAS). To date,
our technology has helped deliver over fifty million miles of accident free,
on and off-highway, commercial and industrial driving. In the coming years
it is expected to deliver the same levels of protection to fleet, rail and public
transport system operators, the airline industry and private passenger
vehicle occupants and road users.
Seeing Machines is now home to over 100 employees and while remaining
committed to our home base in Australia, the Company is expanding
internationally to better server our customers and collaborate with our
partners.
CEO’S UPDATE
CEO’s Update

92014 ANNUAL REPORT
2014
CEO’S UPDATE
An organisation building for success, major
growth and a profitable future requires
strong core values, superlative technology,
an exceptional level of capability within
our employees, and supportive partners,
customers and shareholders.
At Seeing Machines, our future is anchored
by a noteworthy technological past, as
the organisation’s core computer vision
expertise continues to form the foundation
for newly engineered technologies and
business strategies that will help provide
answers to some of world’s pressing
transportation safety challenges. In this
year’s annual report, we would like to
present our multi-horizon business strategy
and the programs that will, over time,
help save thousands of lives and play a
pioneering role in industrial, commercial,
public and private passenger transport
safety.
Underpinning our focus on innovation and
technology driven growth markets, we
will first examine DSS mining, our horizon
one field of operation. To maximize the
return from our four-phased alliance with
Caterpillar Global Mining, Seeing Machines
will continue to invest in the dealer on-
boarding process - supporting dealer led
sales and marketing, technical support
and training activities to ensure that all
Caterpillar dealers become able to sell,
implement and support the DSS technology
within their regions.
Our horizon two strategy encompasses two
fields of operation: first, a direct to market,
commercial fleet transport application
of the DSS technology as an aftermarket
offering; and second, an automotive
manufacturer integrated driver monitoring
system initially for private passenger
vehicles and following this for major truck
and bus manufacturers.
Horizon three captures three key sectors
that Seeing Machines believes are worthy
of pursuing - rail, simulation/aviation and
consumer electronics.
All of the above fields of operation will
benefit greatly from the availability of the
data captured by Seeing Machines’ in-
vehicle technology. We expect our growing
ability to capture, transmit, interpret and
distribute data and to help our partners,
customers and industry stakeholders apply
the learnings held within the information
will generate significant recurring revenue
streams. This same information will also be
of value to organisations such as research
institutes, insurers and governments.
Building the Seeing Machines of the Future
At Seeing Machines, our future is anchored by a noteworthy technological past, as the organisation’s core computer vision expertise continues to form the foundation for newly engineered technologies and business strategies that will help provide answers to some of world’s pressing transportation safety challenges.

10 2014 ANNUAL REPORT
2014
In the year under review, Seeing Machines
posted a strong all-round performance
against operational and financial targets
while also recapitalizing the organization
and refocusing our strategy to fully exploit
core technical capability, the growing
success of our DSS technology and our
alliance with Caterpillar Global Mining.
Our significant engineering efforts and
the resulting development of new driver
monitoring capabilities, brings us ever
closer to the release of technologies that
are expected to satisfy our chosen mass-
market transport applications. In parallel,
we have been successfully building strategic
relationships to take these technologies to
market. We aspire to see our technology in
a wide number of commercial fields and in
millions of cars over time.
The organisation has expanded its
employee numbers, with additional highly
capable and credentialed people and
leaders now working in geographically
diverse locations, in an effort to ensure the
highest levels of support for our growing
internationally distributed customer base.
We have prioritized our internal
management efforts and begun to
implement the significant organizational
change required to deliver on our ambitious
strategy. As we go forward, Seeing Machines
is focused on leading our fields of operation
and maturing into a more effective, efficient
and capable organization – preparing Seeing
Machines for a key role in the enhancement
of operator performance and safety through
real time monitoring and intervention,
enabled by intelligent sensing capability.
Our highly-performing people, trusted
alliance partners, loyal customers and
suppliers, combined with our long-term
strategic vision will ensure that we will
provide value to all of our stakeholders
in the years ahead. In all that we do, we
are guided by our vision of continuously
improving and being the recognized leader
in our chosen markets.
The Year in Review
Ken KroegerChief Executive OfficerSeeing Machines Limited
CEO’S UPDATE
112014 ANNUAL REPORT
What we aspire to and work towards
Through delivery of our result-proven algorithms, products and services and strategic collaboration with sector partners, Seeing Machines will be the recognised leader in our chosen markets.
To enhance operator performance and safety through real-time monitoring and interventions – enabled by intelligent sensing technologies.
Our common Vision and Mission
Vision
Mission
OUR STRATEGY AND APPROACH
Our strategy and approach
12 2014 ANNUAL REPORTOUR STRATEGY AND APPROACH
132014 ANNUAL REPORT OUR STRATEGY AND APPROACH
Our Strategy and Approach (continued)
We will listen to our customers and understand their current and emerging
needs. We will strive to leave more value that we take and to build long-
lasting relationships.
Employees will be engaged and empowered to make a difference every
day. They will be aligned with the organisation’s values and goals and will be
rewarded appropriately for their performance and contribution.
We will meet or exceed customer expectations by providing excellent
service. In all customer interactions, our people will demonstrate integrity
and humility.
We will build are release only the highest quality products. We sill strive
to make regular technological advancements and implement continuous
improvements. We will drive cost reduction through quality, design and
planning.
Customer Focused
Invest in a High Performance Team
Operational Excellence
Product Innovation and Excellence
To measure our performance, the organisation has established a set of Key
Performance Indicators. These will be used in the short and longer term to
monitor our performance, in financial and non-financial ways.
Corporate Key Performance Indicators

14 2014 ANNUAL REPORT
Seeing Machines has made the conscious decision
to only enter industry sectors or markets where it
can achieve and maintain a leadership position. This
position will be achieved and maintained through
the selection of one or more strategic partners for
each field of operation or key geographic region. We
will work in close collaboration with these partners
to develop a clear understanding of their market’s
requirements and expectations, leverage their
dominant market position and brand, and to bring
joint technology and safety solutions to market the
best way possible.
Caterpillar Global Mining (CGM)
TK Holdings Inc.
Samsung Electro-Mechanics (SEMCo)
Eye Tracking Inc.
Alliance Partners
To date, Seeing Machines has established formal
agreement with the following alliance partners:
OUR STRATEGY AND APPROACH
152014 ANNUAL REPORT
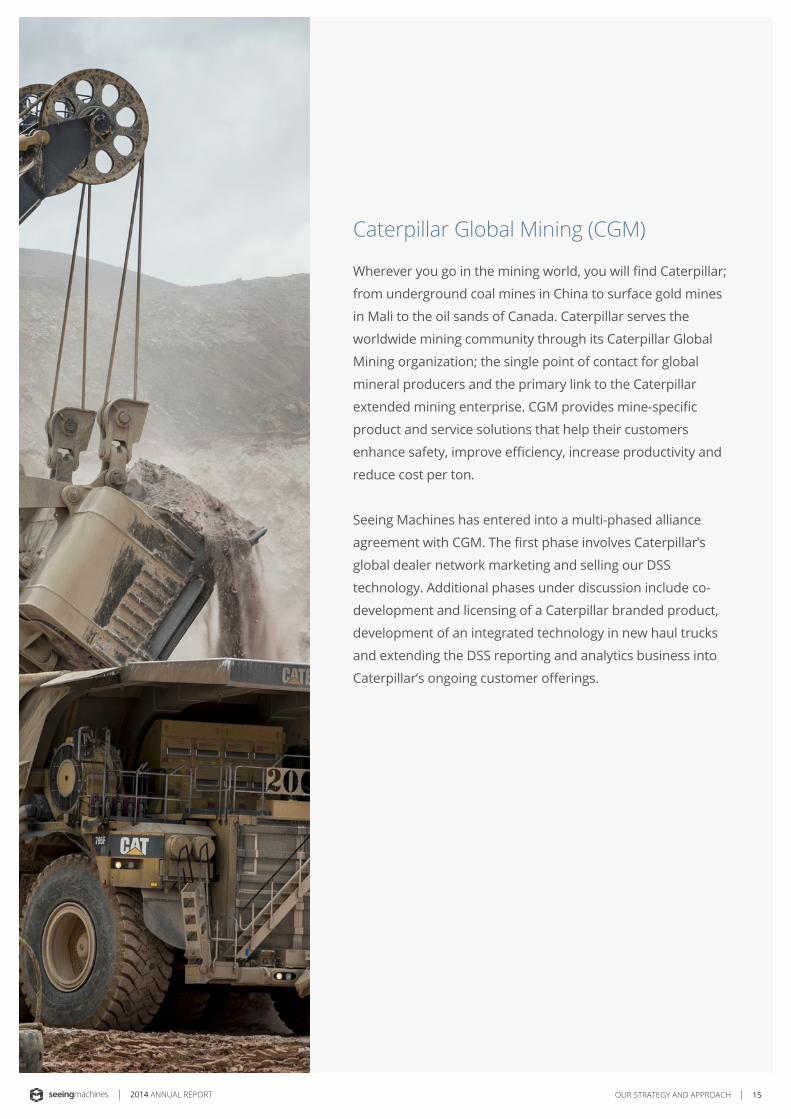
Wherever you go in the mining world, you will find Caterpillar;
from underground coal mines in China to surface gold mines
in Mali to the oil sands of Canada. Caterpillar serves the
worldwide mining community through its Caterpillar Global
Mining organization; the single point of contact for global
mineral producers and the primary link to the Caterpillar
extended mining enterprise. CGM provides mine-specific
product and service solutions that help their customers
enhance safety, improve efficiency, increase productivity and
reduce cost per ton.
Seeing Machines has entered into a multi-phased alliance
agreement with CGM. The first phase involves Caterpillar’s
global dealer network marketing and selling our DSS
technology. Additional phases under discussion include co-
development and licensing of a Caterpillar branded product,
development of an integrated technology in new haul trucks
and extending the DSS reporting and analytics business into
Caterpillar’s ongoing customer offerings.
Caterpillar Global Mining (CGM)
OUR STRATEGY AND APPROACH
16 2014 ANNUAL REPORT
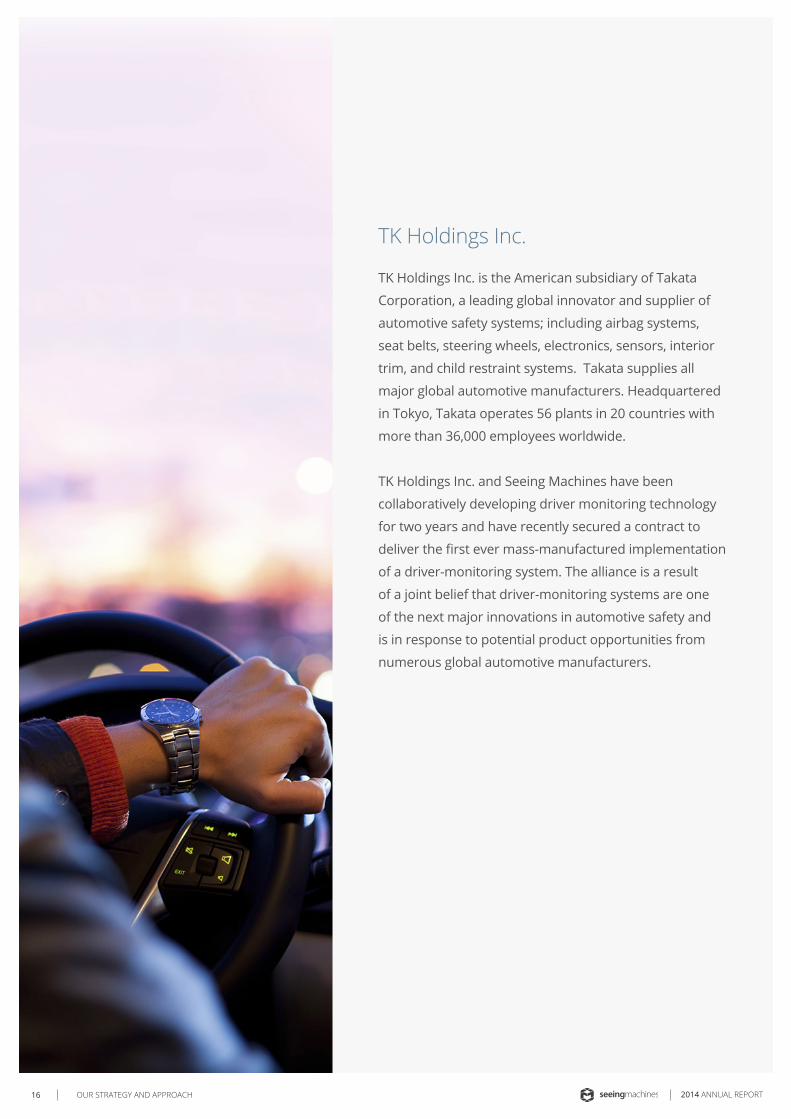
TK Holdings Inc. is the American subsidiary of Takata
Corporation, a leading global innovator and supplier of
automotive safety systems; including airbag systems,
seat belts, steering wheels, electronics, sensors, interior
trim, and child restraint systems. Takata supplies all
major global automotive manufacturers. Headquartered
in Tokyo, Takata operates 56 plants in 20 countries with
more than 36,000 employees worldwide.
TK Holdings Inc. and Seeing Machines have been
collaboratively developing driver monitoring technology
for two years and have recently secured a contract to
deliver the first ever mass-manufactured implementation
of a driver-monitoring system. The alliance is a result
of a joint belief that driver-monitoring systems are one
of the next major innovations in automotive safety and
is in response to potential product opportunities from
numerous global automotive manufacturers.
TK Holdings Inc.
OUR STRATEGY AND APPROACH
172014 ANNUAL REPORT
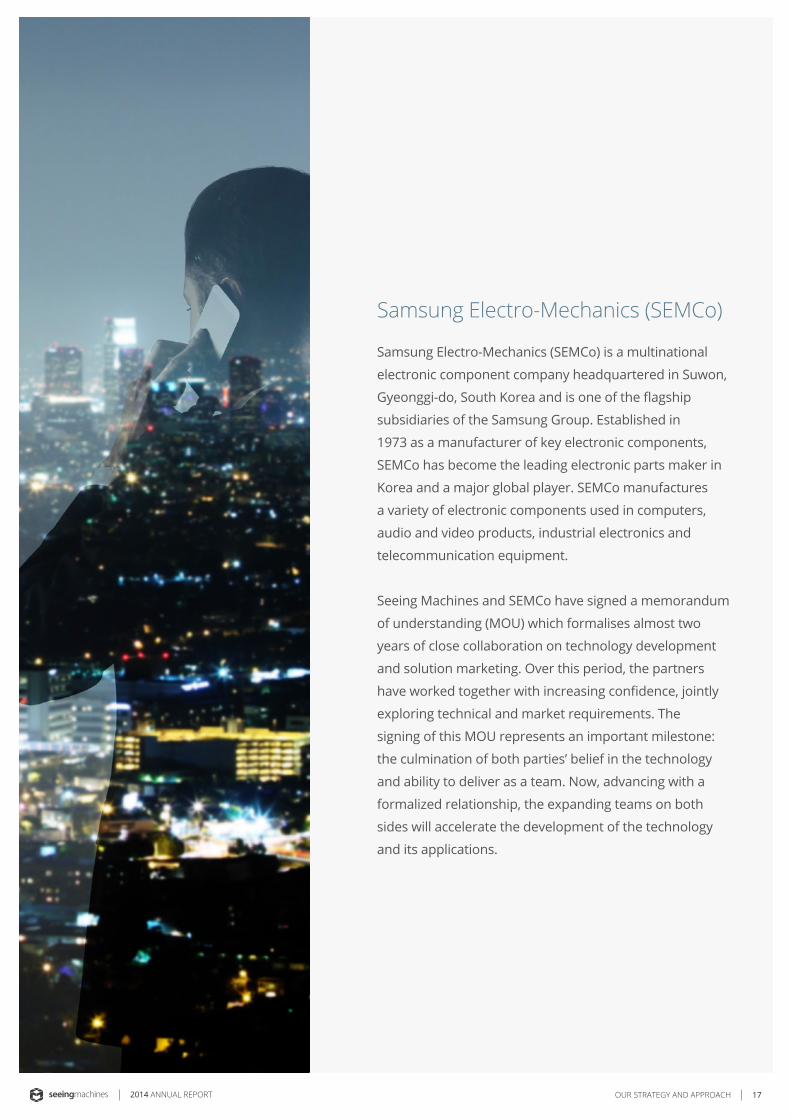
Samsung Electro-Mechanics (SEMCo) is a multinational
electronic component company headquartered in Suwon,
Gyeonggi-do, South Korea and is one of the flagship
subsidiaries of the Samsung Group. Established in
1973 as a manufacturer of key electronic components,
SEMCo has become the leading electronic parts maker in
Korea and a major global player. SEMCo manufactures
a variety of electronic components used in computers,
audio and video products, industrial electronics and
telecommunication equipment.
Seeing Machines and SEMCo have signed a memorandum
of understanding (MOU) which formalises almost two
years of close collaboration on technology development
and solution marketing. Over this period, the partners
have worked together with increasing confidence, jointly
exploring technical and market requirements. The
signing of this MOU represents an important milestone:
the culmination of both parties’ belief in the technology
and ability to deliver as a team. Now, advancing with a
formalized relationship, the expanding teams on both
sides will accelerate the development of the technology
and its applications.
Samsung Electro-Mechanics (SEMCo)
OUR STRATEGY AND APPROACH
18 2014 ANNUAL REPORT
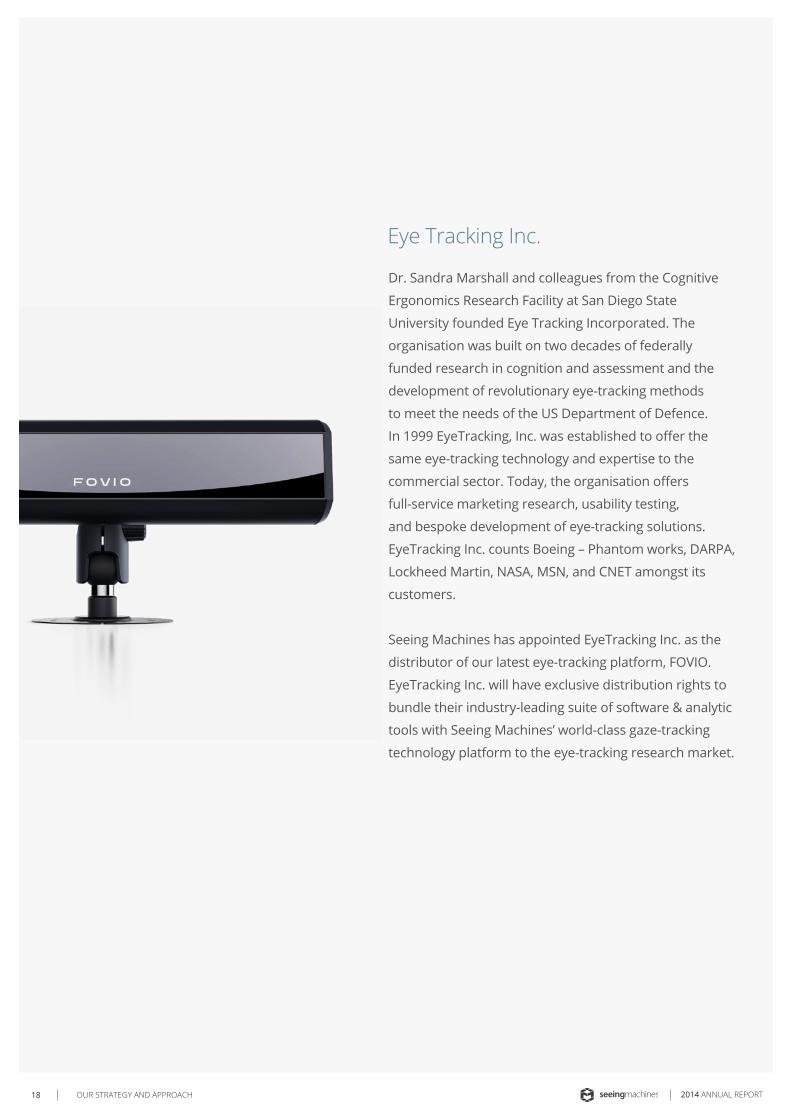
Dr. Sandra Marshall and colleagues from the Cognitive
Ergonomics Research Facility at San Diego State
University founded Eye Tracking Incorporated. The
organisation was built on two decades of federally
funded research in cognition and assessment and the
development of revolutionary eye-tracking methods
to meet the needs of the US Department of Defence.
In 1999 EyeTracking, Inc. was established to offer the
same eye-tracking technology and expertise to the
commercial sector. Today, the organisation offers
full-service marketing research, usability testing,
and bespoke development of eye-tracking solutions.
EyeTracking Inc. counts Boeing – Phantom works, DARPA,
Lockheed Martin, NASA, MSN, and CNET amongst its
customers.
Seeing Machines has appointed EyeTracking Inc. as the
distributor of our latest eye-tracking platform, FOVIO.
EyeTracking Inc. will have exclusive distribution rights to
bundle their industry-leading suite of software & analytic
tools with Seeing Machines’ world-class gaze-tracking
technology platform to the eye-tracking research market.
Eye Tracking Inc.
OUR STRATEGY AND APPROACH
192014 ANNUAL REPORT
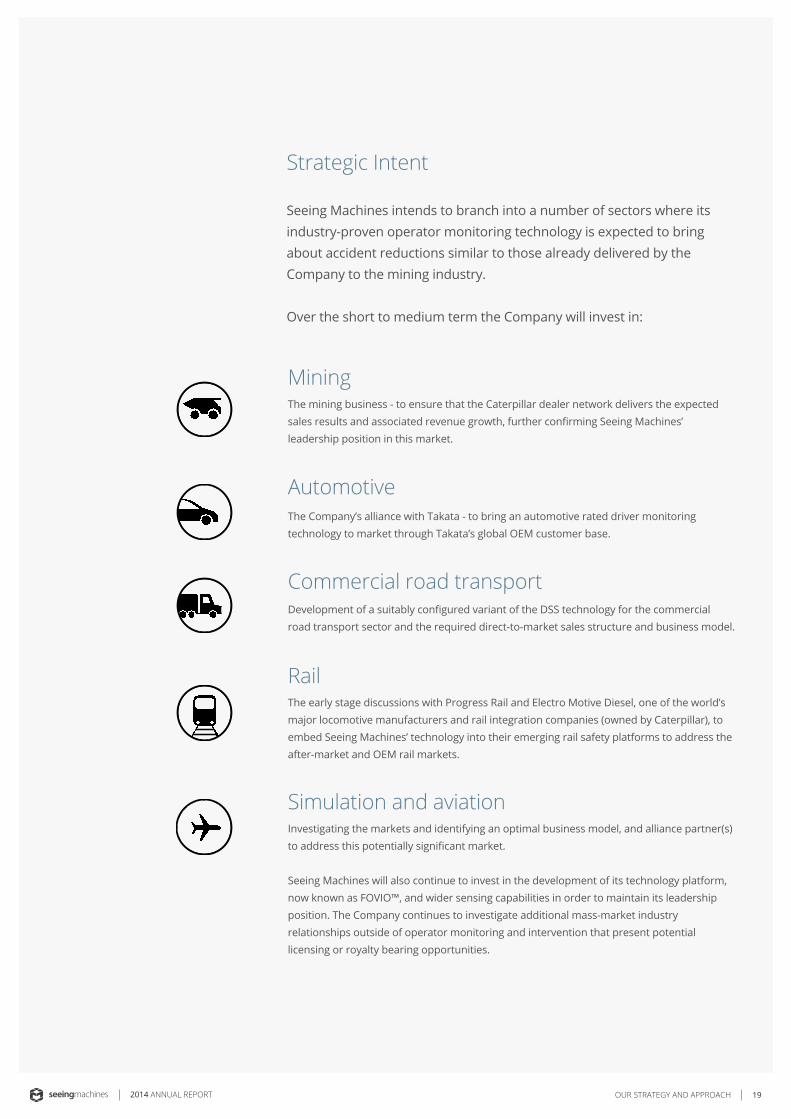
Seeing Machines intends to branch into a number of sectors where its industry-proven operator monitoring technology is expected to bring about accident reductions similar to those already delivered by the Company to the mining industry.
Over the short to medium term the Company will invest in:
The mining business - to ensure that the Caterpillar dealer network delivers the expected sales results and associated revenue growth, further confirming Seeing Machines’ leadership position in this market.
The Company’s alliance with Takata - to bring an automotive rated driver monitoring technology to market through Takata’s global OEM customer base.
Development of a suitably configured variant of the DSS technology for the commercial road transport sector and the required direct-to-market sales structure and business model.
The early stage discussions with Progress Rail and Electro Motive Diesel, one of the world’s major locomotive manufacturers and rail integration companies (owned by Caterpillar), to embed Seeing Machines’ technology into their emerging rail safety platforms to address the after-market and OEM rail markets.
Investigating the markets and identifying an optimal business model, and alliance partner(s) to address this potentially significant market.
Seeing Machines will also continue to invest in the development of its technology platform, now known as FOVIO™, and wider sensing capabilities in order to maintain its leadership position. The Company continues to investigate additional mass-market industry relationships outside of operator monitoring and intervention that present potential licensing or royalty bearing opportunities.
Strategic Intent
Mining
Automotive
Commercial road transport
Rail
Simulation and aviation
OUR STRATEGY AND APPROACH
20 2014 ANNUAL REPORT
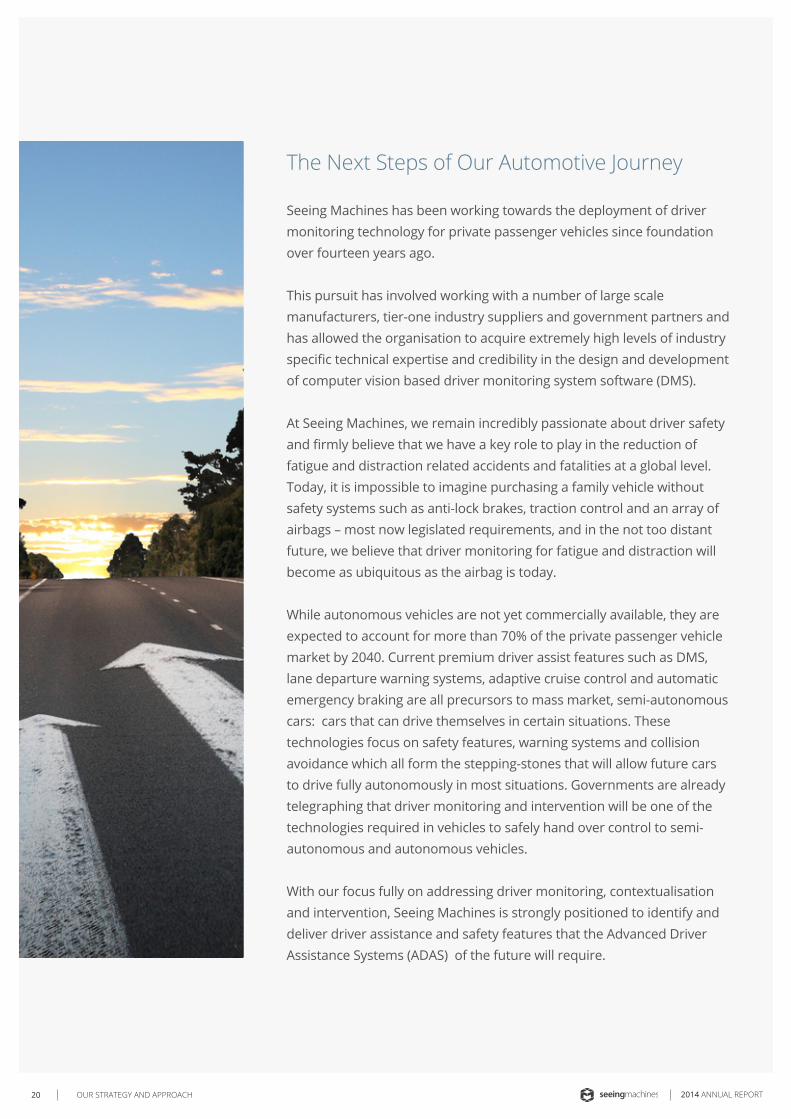
Seeing Machines has been working towards the deployment of driver monitoring technology for private passenger vehicles since foundation over fourteen years ago.
This pursuit has involved working with a number of large scale manufacturers, tier-one industry suppliers and government partners and has allowed the organisation to acquire extremely high levels of industry specific technical expertise and credibility in the design and development of computer vision based driver monitoring system software (DMS).
At Seeing Machines, we remain incredibly passionate about driver safety and firmly believe that we have a key role to play in the reduction of fatigue and distraction related accidents and fatalities at a global level. Today, it is impossible to imagine purchasing a family vehicle without safety systems such as anti-lock brakes, traction control and an array of airbags – most now legislated requirements, and in the not too distant future, we believe that driver monitoring for fatigue and distraction will become as ubiquitous as the airbag is today.
While autonomous vehicles are not yet commercially available, they are expected to account for more than 70% of the private passenger vehicle market by 2040. Current premium driver assist features such as DMS, lane departure warning systems, adaptive cruise control and automatic emergency braking are all precursors to mass market, semi-autonomous cars: cars that can drive themselves in certain situations. These technologies focus on safety features, warning systems and collision avoidance which all form the stepping-stones that will allow future cars to drive fully autonomously in most situations. Governments are already telegraphing that driver monitoring and intervention will be one of the technologies required in vehicles to safely hand over control to semi-autonomous and autonomous vehicles.
With our focus fully on addressing driver monitoring, contextualisation and intervention, Seeing Machines is strongly positioned to identify and deliver driver assistance and safety features that the Advanced Driver Assistance Systems (ADAS) of the future will require.
The Next Steps of Our Automotive Journey
OUR STRATEGY AND APPROACH
212014 ANNUAL REPORT
Our shared values define what we stand for as a Company and drive
our actions and our behaviour. They help determine the way we
respond to both opportunities and challenges.
At Seeing Machines, we lead by example and ask that all employees
agree to embrace our following organisational values as the
foundation of our culture.
Demand of ourselves and of each other the highest standards of individual and
corporate integrity.
Continuously challenge each other to improve our products, processes and
ourselves.
Seek honest feedback, be open to personal change and learn from both mistakes
and success.
Foster an environment that encourages innovation, creativity and results through
teamwork.
Honour commitments and take personal responsibility for actions and results.
Shared Values and Culture
Integrity
Excellence
Humility
Teamwork
Accountability
OUR STRATEGY AND APPROACH
22 2014 ANNUAL REPORTLETTER FROM THE REMUNERATION COMMITTEE CHAIRMAN
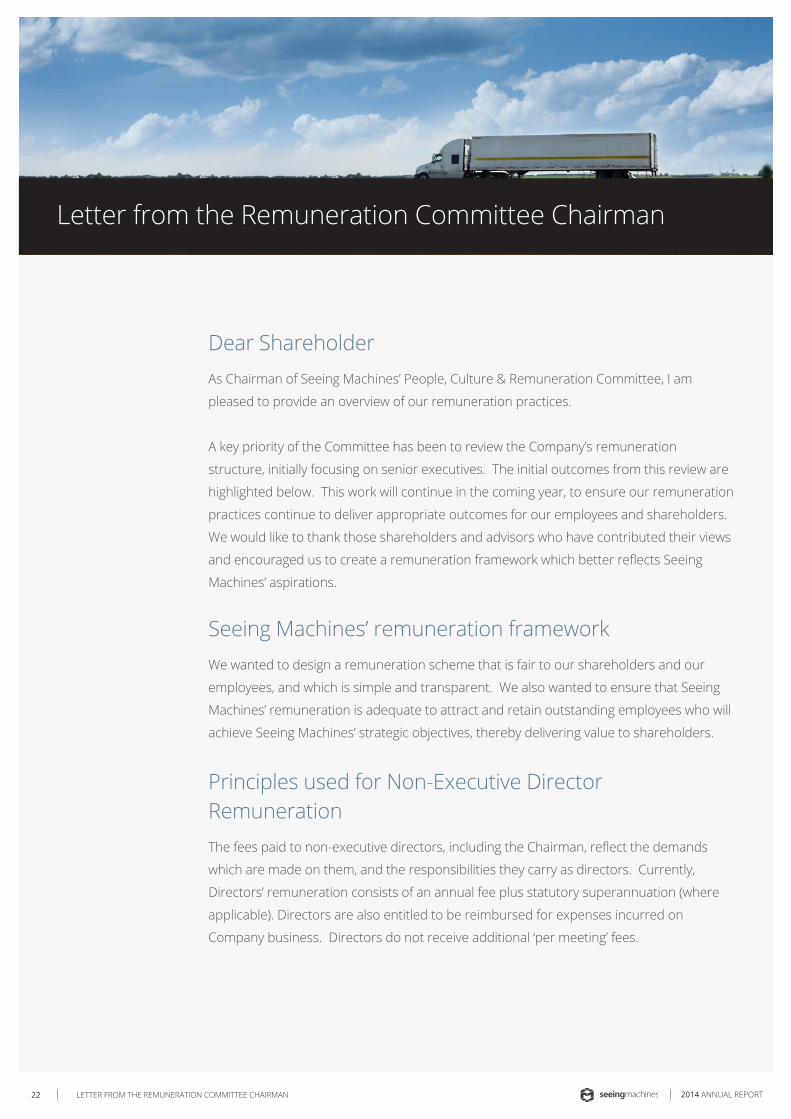
Letter from the Remuneration Committee Chairman
Dear ShareholderAs Chairman of Seeing Machines’ People, Culture & Remuneration Committee, I am
pleased to provide an overview of our remuneration practices.
A key priority of the Committee has been to review the Company’s remuneration
structure, initially focusing on senior executives. The initial outcomes from this review are
highlighted below. This work will continue in the coming year, to ensure our remuneration
practices continue to deliver appropriate outcomes for our employees and shareholders.
We would like to thank those shareholders and advisors who have contributed their views
and encouraged us to create a remuneration framework which better reflects Seeing
Machines’ aspirations.
Seeing Machines’ remuneration frameworkWe wanted to design a remuneration scheme that is fair to our shareholders and our
employees, and which is simple and transparent. We also wanted to ensure that Seeing
Machines’ remuneration is adequate to attract and retain outstanding employees who will
achieve Seeing Machines’ strategic objectives, thereby delivering value to shareholders.
Principles used for Non-Executive Director RemunerationThe fees paid to non-executive directors, including the Chairman, reflect the demands
which are made on them, and the responsibilities they carry as directors. Currently,
Directors’ remuneration consists of an annual fee plus statutory superannuation (where
applicable). Directors are also entitled to be reimbursed for expenses incurred on
Company business. Directors do not receive additional ‘per meeting’ fees.
232014 ANNUAL REPORT LETTER FROM THE REMUNERATION COMMITTEE CHAIRMAN
The annual fees for non-executive directors for the year to 30 June 2014 are set out in
Note 28 to the Accounts on page 76 of this Annual Report. The total of all remuneration
paid to all non-executive directors for the year to 30 June 2014 was $216,220. This is well
below the cap on non-executive director remuneration set out in the current Constitution,
which for the 30 June 2014 year was $443,000.
As part of our general review of the Company’s remuneration principles, the Board
believes that it is appropriate for non-executive directors to receive part of their
remuneration in shares, in order to more closely align their interests with shareholders
while still remaining well within the current cap referred to above. Accordingly, during
the 2015 financial year the Board intends to re-structure non-executive directors’
remuneration to include an equity component. The Board will promptly release details of
any equity issued to directors.
Principles used for Executives and Employees We have determined that the remuneration of our executives should consist of two
components: a fixed amount and an ‘at risk’ component.
We benchmarked our “fixed remuneration” against a comparator group – looking at a
combination of fixed remuneration plus actually delivered short-term incentives. We also
checked with recruitment markets for what would attract and keep our executives. Seeing
Machines is one of the few Australian technology companies to build a strong global
position in some of the world’s fastest growing and yet challenging markets and so we
should expect our numbers to be at the higher end of local benchmarks.
Fair amount of remuneration to incentivise and motivate our executivesFirst, we believe our employees should receive a fixed amount to come to work and do
a great job regardless of the market conditions. This fixed remuneration will reflect fair
reward for effort and achievement, as well as market conditions.

24 2014 ANNUAL REPORT
Fair participation in any additional long-term wealth createdThe second, ‘at risk’ element, gives the opportunity for key executives to participate in
additional long-term wealth creation if our shareholders are also doing well. We know that
investors are understandably annoyed when long-term incentives pay out when share
prices have fallen; however our scheme only pays when shareholders are clearly better
off.
Our long term incentive involves the issue of shares under the Executive Share Plan
approved by shareholders at the AGM in November 2010. The details of the long term
incentive plan, and shares issued to senior executives as part of the 2013 remuneration
review, were announced to the market on 5 September 2013.
In general terms:
• Long term equity comprises a serious and meaningful component of most senior
executives’ remuneration – typically from 20% to 50%
• New shares are issued to a trustee of a loan plan and held on trust for executives
(including Managing Director Ken Kroeger and Finance Director James Walker) until
certain time and performance hurdles are achieved.
• The issue price of these shares is the market price leading up to 1 July each year.
• These shares will only vest for the benefit of executives after a waiting period (typically
three years, subject to a small number of extraordinary events occurring), and then
only if the executive is still employed by the Company and if the Company’s share
price at that time meets or exceeds a ‘stretch target’ set by the Board when the shares
were first issued. This is designed to ensure the loan shares only deliver value if our
share price escalation exceeds historical market levels.
• Should these requirements be met, Seeing Machines will provide a non-recourse,
interest-free loan to enable the executives to purchase their allocated shares at the
issue price set at the beginning of the 3 year waiting period.
As part of the 2014 remuneration review the Board intends to make similar offers to
senior executives this year, on similar terms. The details of any offers will be announced
to the market when they are made.
LETTER FROM THE REMUNERATION COMMITTEE CHAIRMAN
252014 ANNUAL REPORT
The long term incentive plan is currently available to certain senior executives. In order to
recognise and reward the efforts of a broader group of employees, the Board also intends
to make a one-off general offer of $5,000 worth of shares to other employees who are not
eligible for the senior executive plan. The details of this offer will also be announced when
it is made. The Committee intends to review the scope of the current plan to ensure that
appropriate long term incentives are available for a broader range of employees.
Short term incentives – only if well designed Currently the Company does not have a broad-ranging short-term incentive program,
preferring instead to focus our executives on longer term performance. The Committee
believes that some short-term incentive programs, if not well designed, can deliver
capricious outcomes. Some companies have seen management do great work in tough
times and, conversely, we have seen executives receive “performance” bonuses because
of good luck.
The Committee is conscious of the need for remuneration practices to create incentives
for employees to build valuable long-term returns for shareholders, as well as delivering
outstanding performance in the short term. The Committee intends to continue to review
the role of short-term incentives in its remuneration framework.
Simple, transparent and fair We intend to create and maintain a remuneration framework that is simple, transparent
and fair to both shareholders and our employees. We will continue to review our
remuneration practices to achieve this goal. We will also continue to ensure that Seeing
Machines meets regulatory and legislative remuneration requirements.
I would like to thank my fellow Committee members for their expertise and guidance,
as well as all those who have supported the Board in driving our ongoing remuneration
changes and crafting Seeing Machines’ remuneration framework.
Jim Walker
Chair of the People, Culture & Remuneration Committee
LETTER FROM THE REMUNERATION COMMITTEE CHAIRMAN
26 2014 ANNUAL REPORT
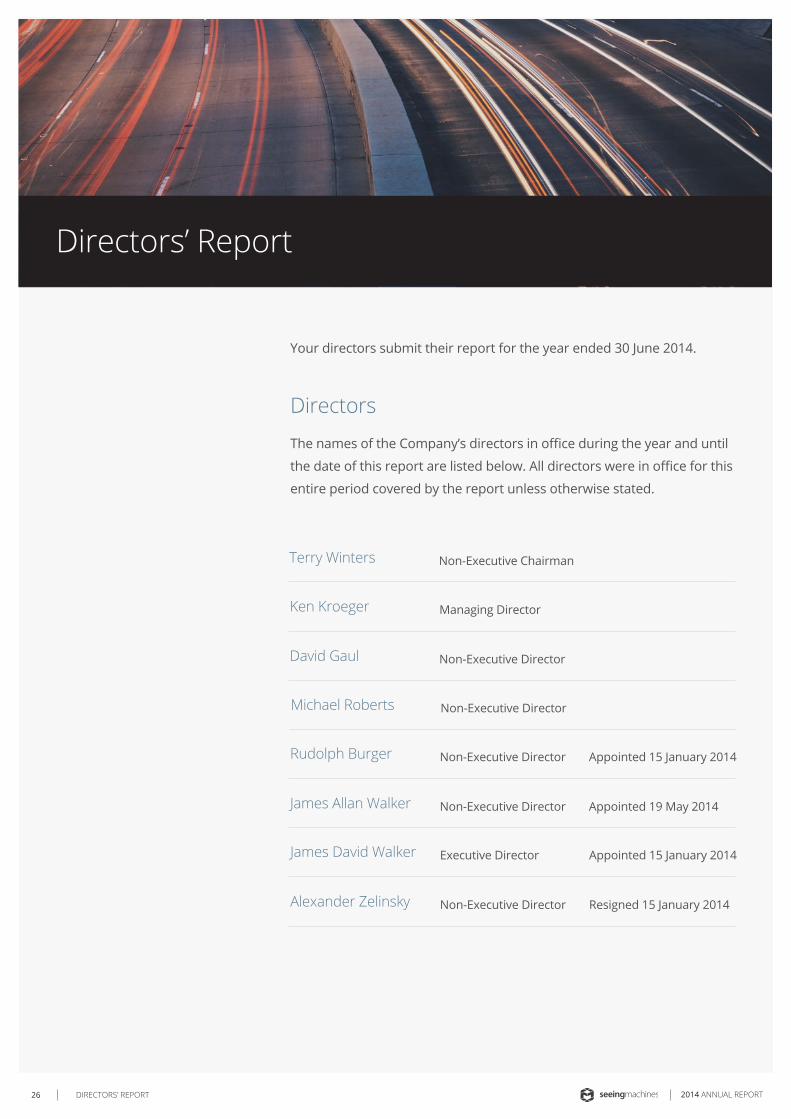
Your directors submit their report for the year ended 30 June 2014.
The names of the Company’s directors in office during the year and until
the date of this report are listed below. All directors were in office for this
entire period covered by the report unless otherwise stated.
Non-Executive ChairmanTerry Winters
Directors
DIRECTORS’ REPORT
Managing Director
Non-Executive Director
Non-Executive Director
Non-Executive Director
Executive Director
Non-Executive Director
Non-Executive Director
Appointed 15 January 2014
Appointed 15 January 2014
Appointed 19 May 2014
Resigned 15 January 2014
Ken Kroeger
David Gaul
Michael Roberts
Rudolph Burger
James David Walker
James Allan Walker
Alexander Zelinsky
Directors’ Report
272014 ANNUAL REPORT DIRECTORS’ REPORT
The existing DSS mining focussed business was profitable this year but with
the significant investment already started in the activities identified above to
accelerate growth in future years the Company has generated a consolidated
loss for this year.
Total revenue for the year increased by A$5,026,505 (39% over the prior year) to
A$17,762,246 (2013: A$12,735,741):
• Revenue from sale of DSS, license fees, services and faceLAB® and
faceAPI™ was A$16,756,392 (2013: A$11,692,298); and
• Other income was A$887,335 (2013: A$1,034,398) primarily due to the
recovery of R&D tax offsets refunded from the Australian Government.
• Finance income was A$118,519 (2013: A$9,045) attributable to the interest
earnings due to increased cash holdings resulting from the capital raise in
late 2013.
Cost of Goods Sold (COGS) increased to A$6,743,498 (2013: A$4,199,601) due
primarily to:
• a change in product mix resulting from higher DSS sales;
• the increased sale of services including consulting; and
• decline in faceLAB® and faceAPI™ sales.
Operational expenses, including R&D, increased by 72% to A$13,721,919
(2013: A$7,981,797). This increase is a result of Seeing Machines expanding its
plans for entry into an extended set of industry sectors as well as supporting
the significant growth in revenue through additional customer fulfilment and
support infrastructure and personnel.
The Company achieved a net loss of A$2,706,380 for the year ended 30 June
2014, a reduction by A$3,265,331 on the prior year’s net profit (2013: profit of
A$558,951). Included in this result is an unrealised foreign exchange loss of
$558,650 in relation to the Company holding its cash balances in AUD, USD and
GBP.
The consolidated loss for the year is as a direct result of the Company’s
expanded strategy of entering other industry sectors for future years’ revenue
growth and the unrealised foreign exchange loss. The Company has already
started to invest in personnel, technology and infrastructure for the commercial
fleet, automotive, rail and simulations through to aviation markets. Without this
investment the Company would have generated a profit this year.
Financial Results
Review of Operations

28 2014 ANNUAL REPORT
Revenue
Cost of goods sold
Gross profit
Other income
Finance income
Expenses
Research and development
Marketing & distribution
Occupancy and facilities
Administration and corporate
Finance & other
Total expenses
Net profit for the year
11,692,298
(4,199,601)
7,492,697
1,034,398
9,045
8,536,140
(1,400,225)
(2,485,467)
(812,207)
(3,236,352)
(42,938)
(7,977,189)
558,951
16,756,392
(6,743,498)
10,012,894
887,835
118,519
11,018,748
(1,975,478)
(3,397,481)
(867,163)
(4,384,086)
(30,033)
(10,654,241)
364,507
-
-
-
-
-
-
(577,064)
(984,555)
-
(950,618)
(558,650)
(3,070,887)
(3,070,887)
16,756,392
(6,743,498)
10,012,894
887,835
118,519
11,018,748
(2,552,542)
(4,382,036)
(867,163)
(5,334,704)
(588,683)
(13,725,128)
(2,706,380)
CONSOLIDATED RESULT
30 JUNE 2013 30 JUNE 2014
CONSOLIDATED RESULT
EXISTINGBUSINESS
NEW BUSINESS ACTIVITIES
The profit from the existing business was due largely to the significant growth in demand for DSS by the world’s largest mining and resource companies. The growth in revenue allowed the Company to maintain its strategy of investing in R&D, increasing global business development activities, expanded field support capabilities and improving our data reporting capabilities.
The Company had A$22,764,774 in cash at 30 June 2014 compared to A$835,001 at 30 June 2013 and debtors of A$5,502,755 compared to A$3,700,648 in the previous year and completed a capital raising during the year realising A$28,019,889.
DIRECTORS’ REPORT
292014 ANNUAL REPORT
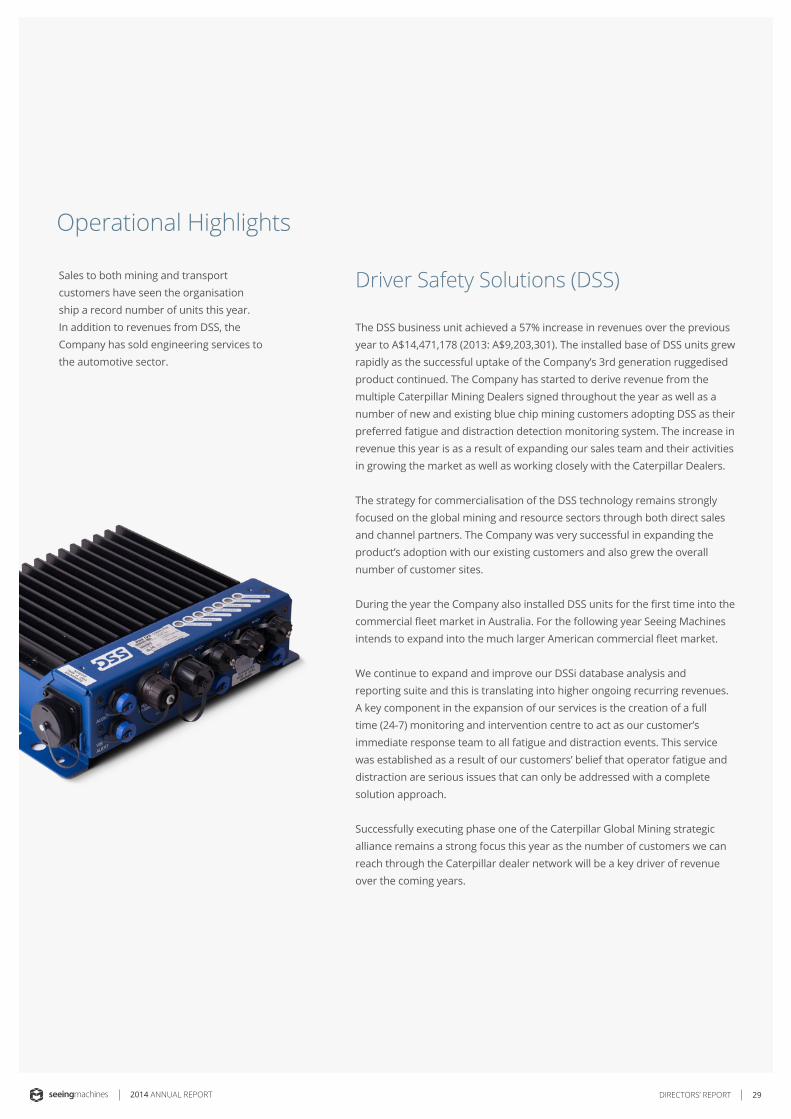
Sales to both mining and transport customers have seen the organisation ship a record number of units this year. In addition to revenues from DSS, the Company has sold engineering services to the automotive sector.
The DSS business unit achieved a 57% increase in revenues over the previous year to A$14,471,178 (2013: A$9,203,301). The installed base of DSS units grew rapidly as the successful uptake of the Company’s 3rd generation ruggedised product continued. The Company has started to derive revenue from the multiple Caterpillar Mining Dealers signed throughout the year as well as a number of new and existing blue chip mining customers adopting DSS as their preferred fatigue and distraction detection monitoring system. The increase in revenue this year is as a result of expanding our sales team and their activities in growing the market as well as working closely with the Caterpillar Dealers.
The strategy for commercialisation of the DSS technology remains strongly focused on the global mining and resource sectors through both direct sales and channel partners. The Company was very successful in expanding the product’s adoption with our existing customers and also grew the overall number of customer sites.
During the year the Company also installed DSS units for the first time into the commercial fleet market in Australia. For the following year Seeing Machines intends to expand into the much larger American commercial fleet market.
We continue to expand and improve our DSSi database analysis and reporting suite and this is translating into higher ongoing recurring revenues. A key component in the expansion of our services is the creation of a full time (24-7) monitoring and intervention centre to act as our customer’s immediate response team to all fatigue and distraction events. This service was established as a result of our customers’ belief that operator fatigue and distraction are serious issues that can only be addressed with a complete solution approach.
Successfully executing phase one of the Caterpillar Global Mining strategic alliance remains a strong focus this year as the number of customers we can reach through the Caterpillar dealer network will be a key driver of revenue over the coming years.
Driver Safety Solutions (DSS)
Operational Highlights
DIRECTORS’ REPORT
30 2014 ANNUAL REPORT
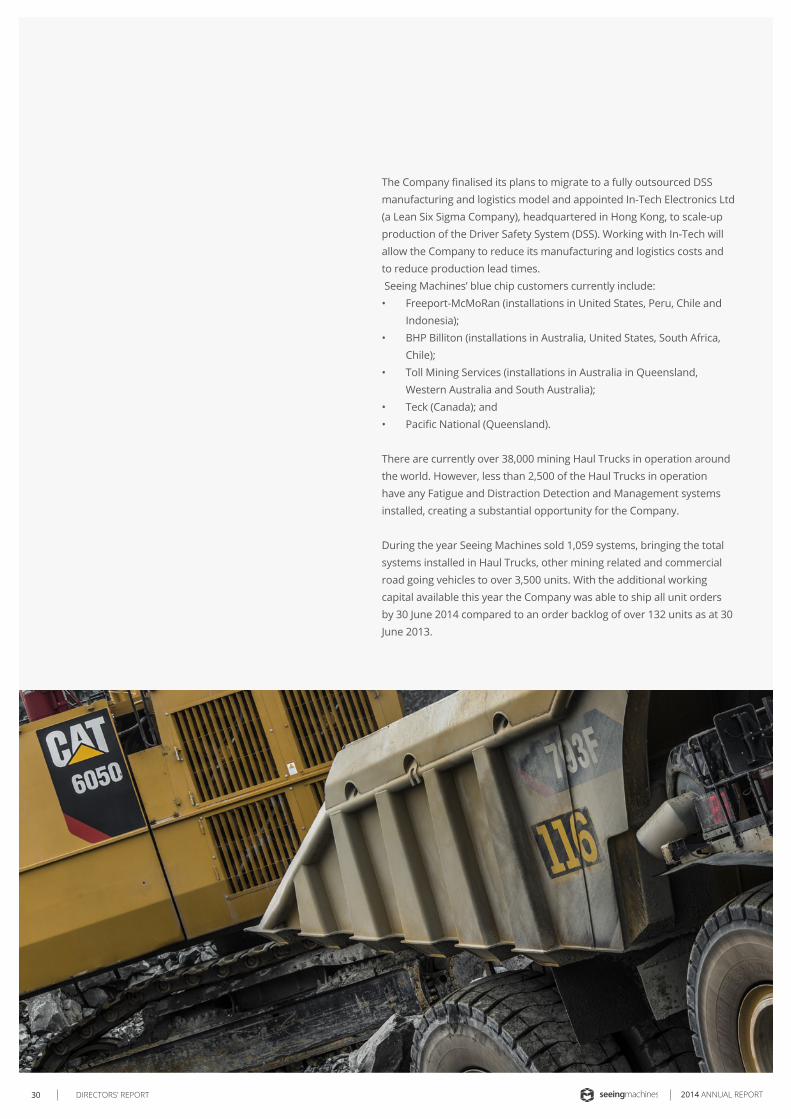
The Company finalised its plans to migrate to a fully outsourced DSS manufacturing and logistics model and appointed In-Tech Electronics Ltd (a Lean Six Sigma Company), headquartered in Hong Kong, to scale-up production of the Driver Safety System (DSS). Working with In-Tech will allow the Company to reduce its manufacturing and logistics costs and to reduce production lead times. Seeing Machines’ blue chip customers currently include:• Freeport-McMoRan (installations in United States, Peru, Chile and
Indonesia);• BHP Billiton (installations in Australia, United States, South Africa,
Chile);• Toll Mining Services (installations in Australia in Queensland,
Western Australia and South Australia);• Teck (Canada); and• Pacific National (Queensland).
There are currently over 38,000 mining Haul Trucks in operation around the world. However, less than 2,500 of the Haul Trucks in operation have any Fatigue and Distraction Detection and Management systems installed, creating a substantial opportunity for the Company.
During the year Seeing Machines sold 1,059 systems, bringing the total systems installed in Haul Trucks, other mining related and commercial road going vehicles to over 3,500 units. With the additional working capital available this year the Company was able to ship all unit orders by 30 June 2014 compared to an order backlog of over 132 units as at 30 June 2013.
DIRECTORS’ REPORT

312014 ANNUAL REPORT
The Company has continued to support the work of the ANU College of Medicine, Biology and Environment to prepare for the commercialisation of the TFA. With the Company’s strategic focus on operator performance and safety and ANU’s intention to be more active in the commercialisation process both parties have agreed to spin out the TFA technology and IP into a new company.
Seeing Machines will become a minority shareholder and receive royalties from any future licensing deals the new company enters into.
Core Technology Team Integration ServicesThe continued interest in Seeing Machines’ platform technology, now known as FOVIO, has created a market demand for the provision of platform integration and non-recurring engineering services to third parties.
Through these services, the Company generated revenues of A$968,275, up from A$441,695 in the previous year. We expect this to continue in future years.
TrueField Analyzer® (TFA)
Revenue declined during the year to A$1,162,730 (2013: A$2,047,302).
During the year the Company rebranded these research market products under the FOVIO™ core technology banner. With Seeing Machines planning its entry into new and significant industrial markets the Company has appointed Eye Tracking Inc. as our distributor for the eye tracking research marketplace.
faceAPI™ and faceLAB®
FOVIO - the future of eye tracking. Proper caption pending.
DIRECTORS’ REPORT
32 2014 ANNUAL REPORT
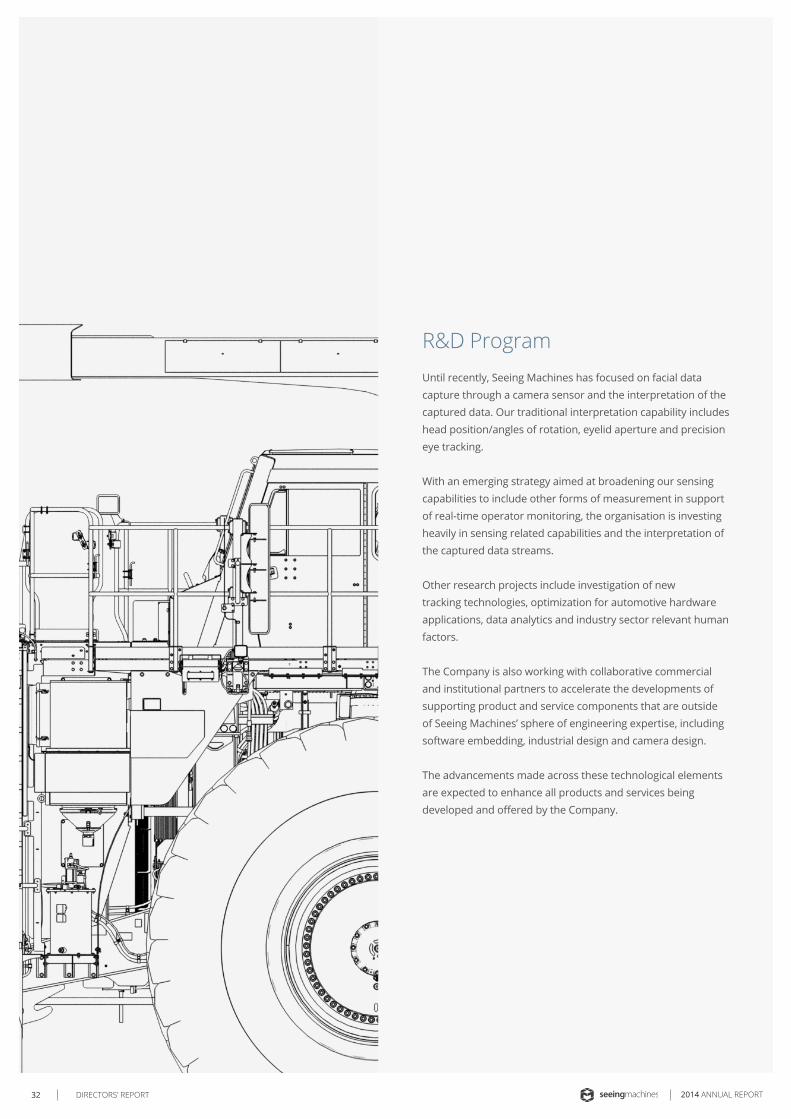
Until recently, Seeing Machines has focused on facial data capture through a camera sensor and the interpretation of the captured data. Our traditional interpretation capability includes head position/angles of rotation, eyelid aperture and precision eye tracking.
With an emerging strategy aimed at broadening our sensing capabilities to include other forms of measurement in support of real-time operator monitoring, the organisation is investing heavily in sensing related capabilities and the interpretation of the captured data streams.
Other research projects include investigation of new tracking technologies, optimization for automotive hardware applications, data analytics and industry sector relevant human factors.
The Company is also working with collaborative commercial and institutional partners to accelerate the developments of supporting product and service components that are outside of Seeing Machines’ sphere of engineering expertise, including software embedding, industrial design and camera design.
The advancements made across these technological elements are expected to enhance all products and services being developed and offered by the Company.
R&D Program
DIRECTORS’ REPORT
332014 ANNUAL REPORT
The Company’s Chief Executive Officer for the full financial year to 30 June 2014 and at the date of this report is Ken Kroeger.
At 30 June 2014 the Group had 90 full-time employees (47 employees at 30 June 2013).
The Company Secretary for the full financial year to 30 June 2014 was Allistar Twigg. From 1 July 2014 and to the date of this report Andrew Neilson was appointed as company secretary.
Position Holders During the Period
Employee Numbers
Chief Executive Officer
Company Secretary
DIRECTORS’ REPORT

34 2014 ANNUAL REPORT
2014 has been a significant year in the
Company’s history with another record
revenue result. This significant revenue
growth is based on our leadership in the
mining industry though our own efforts
and in partnership with Caterpillar Global
Mining.
This growth, together with the capital raise
completed during the year is expected to
lead to the accelerated commercialization
of our technology across a focused
range of industry sectors. In preparation,
Seeing Machines has expanded its
business development teams, improved
its technology, reviewed new market
opportunities and further developed its
service and reporting offerings.
This focus and approach has seen Seeing
Machines execute on its strategic alliance
with the world’s leading manufacturer of
mining equipment, Caterpillar Global Mining
and gives the Board confidence in another
year of revenue growth from the mining
sector.
The signing of a 15 year, mutually exclusive
commercial partnership agreement with
TK Holdings, one of the world’s leading
suppliers of advanced automotive safety
systems and products, to deploy driver
monitoring technology for a major global
automotive manufacturer will result in a
significant step towards our technology
becoming a common component within
new vehicles, improving of the safety
of vehicle occupants, road users and
pedestrians.
The Takata alliance extends to automotive
product opportunities in across all global
automotive manufacturers and their model
line-ups. The two organisations will work
collaboratively to broaden the uptake of the
technology by TK’s existing customer base.
The successful execution of these two major
alliances, combined with our existing sales
pipeline, provides the Board with confidence
of continued strong revenue growth in 2015.
While the existing mining focussed business
(DSS) was profitable this year the significant
investment being made in the activities
identified above to accelerate growth in
future years are expected to generate a
consolidated loss for the following financial
year.
Outlook for Financial Year 2014-2015
DIRECTORS’ REPORT

352014 ANNUAL REPORT
Directors The names and particulars of the directors of the Company
are set out in the following table. The directors were in office
for the entire period unless otherwise stated.
Non-Executive Chairman, member of Risk, Audit & Finance Committee and member of People, Culture & Remuneration Committee
Terry is widely known as a strategic leader having served as chairman and director of several Australian and international listed and private companies and charities. He has led companies from start-up to successful realisation events and is currently chairman of Converge International Incorporating Resolutions RTK and Intelledox and is a director of Redflex Holdings Limited, Australian Home Care Services, Future Fibre Technologies and Many Rivers Microfinance. Terry led the team that created Optus Communications, Australia’s second telecommunications carrier. Prior to this he founded Link Telecommunications, a business that grew to over $200 million in revenues with over 1,000 employees. In addition, he also served on several boards of Opportunity International, a global microfinance organisation, including a period as its global chairman.
Non-Executive director and member of the People, Culture & Remuneration Committee.
David is co-founder, non-executive director and past President of CEA Technologies, a highly successful technology company that designs and develops radar and communications technology. David was the Australian Technology Entrepreneur of the Year in 2003 and Australian Export Hero 2009/2010. David has over 20 years’ experience in high-tech commercialism. David is a founding fellow of the Australian Institute of Company Directors.
Terry WintersFAICD
David GaulFAICD
NAME AND QUALIFICATIONS
EXPERIENCE AND SPECIAL RESPONSIBILITIES
DIRECTORS’ REPORT

36 2014 ANNUAL REPORT
Managing Director
Ken comes from a long technology and commercialisation background with exposure to a wide variety of industry sectors. He was the founder of international simulation & training business Catalyst Interactive; with offices in three countries and over 100 employees. The organisation was highly recognised for innovation & high customer service levels and was sold to Halliburton subsidiary, Kellogg, Brown and Root in 2008. Ken has held multiple board directorships, and enjoys mentoring a number of start-up entrepreneurs through his Directorship at Lighthouse Innovations and remains involved in aged care services company HealthCube.
Non-Executive director and Chair of Risk, Audit & Finance Committee
Michael Roberts is a London-based private investor who has been an active shareholder in the Company since the 2005 IPO. Prior to joining the Board, Michael spent 15 years at JPMorgan in the Emerging Markets Group. At JPMorgan, Michael’s responsibilities were primarily in the trading, sales and placement of corporate debt in the Eastern Europe, Africa and Middle East regions. Michael holds a BA in Economics and MSc in Investment Management.
Non-Executive director and member of Risk, Audit & Finance Committee
Over the past twenty-five years, Rudolph has founded five digital media technology companies in the US, run a European public company, and served as a senior executive for two global 500 companies. He is widely recognised as an effective, dynamic leader with a proven track record in management, strategic planning, business development, and M&A. Dr Burger is currently Founder and Managing Partner of an investment bank headquartered in California. He also serves as a Board Member of another technology company based in Cambridge, UK. Rudy has a BSc and MSc from Yale University and a PhD from Cambridge University.
Ken Kroeger
Michael Roberts
Dr. Rudolph Burger(since 15 January 2014)
DIRECTORS’ REPORT

372014 ANNUAL REPORT
Non-Executive director and Chair of People, Culture & Remuneration Committee
Over the past 45 years, Jim has been involved with heavy equipment dealerships, having recently retired from WesTrac (Caterpillar dealer for Western Australia, New South Wales/Australian Capital Territory and North East China) after 13 years as CEO.
Jim is also Chairman of Macmahon Holdings, Non-Executive Director of Skilled Group, RAC Holdings (WA), and State Training Board (WA).
Executive Finance Director
James has extensive experience in building businesses and commercialising technology. He has led and managed global companies across a wide range of industries, including hotel marketing, biotechnology and mining and safety services. Over the past fifteen years James has completed multiple capital raisings on both the Australian and London Stock Exchanges as well as through private equity and other sources. James is a fellow of the Institute of Chartered Accountants in Australia and holds a Bachelor of Commerce from the University of New South Wales.
Company Secretary
Andrew is an experienced legal and commercial executive. He has eight years’ experience as a commercial lawyer, with one of Australia’s largest law firms, as well as Asia-Pacific legal counsel for two NYSE-listed global information technology firms. He also has eight years’ management experience as Group General Manager Commercial (and Company Secretary) for Ceramic Fuel Cells Limited, an Australian clean energy company listed on the AIM market. He has experience in commercialising technology, managing intellectual property and structuring and negotiating deals with global partners, as well as capital raising, investor & public relations, corporate governance and AIM market practice. He has a Bachelor of Laws (Honours) and a Bachelor of Commerce from the University of Melbourne and is a Graduate of the Australian Institute of Company Directors.
James (Jim) Allan WalkerGAICD
(since 19 May 2014)
James David Walker(since 15 January 2014)
Andrew Neilson(since 1 July 2014)
DIRECTORS’ REPORT

38 2014 ANNUAL REPORT
Seeing Machines is currently developing a new product for commercial fleets and expects to bring a global product to market by mid-2015. Working with Takata, our exclusive global automotive tier-one supplier on the development of Advanced Driver Assistance Systems (ADAS), Seeing Machines is developing driver-monitoring technology to be incorporated into passenger cars. The Company’s principal activities during the year were:
• development and sale of the DSSTM Product Suite to detect and manage driver fatigue and distraction, including continued market development to secure sustainable channels to market for the product;
• rebranding the faceAPITM and faceLAB® research platform as FovioTM, Seeing Machines’ computer vision platform.
• development of commercial opportunities for applications developed using FovioTM ; and
• research and development of the Company’s core vision processing technologies to support the development and refinement of the Company’s products.
During the financial year there was no other significant change in the state of affairs of the Company other than those referred to below and in the financial statements or notes thereto.
Seeing Machines continued to support the work of the Australian National University Research School of Biology in finalizing the science underpinning the Company’s TrueField Analyzer® medical device. This support lead to Seeing Machines signing a term sheet in June 2014 to transfer the medical device and related technology and intellectual property into a new entity. This entity will be jointly owned by Seeing Machines and the Australian National University whereby ANU will take the lead in commercializing the technology. It is expected that binding agreements will be executed shortly to complete this transaction.
Changes in State of Affairs
Principal Activities
Following the year end, Research and Development expenditure claims have been finalised and lodged with AusIndustry. As a result, and subject to assessment by AusIndustry and the Australian Taxation Office, refundable tax offsets totaling A$2,202,534 are expected to be received in October 2014.
Seeing Machines has successfully incorporated a majority owned subsidiary, Seeing Machines Latin America SpA, with our existing distribution partner GTD in Chile taking a minority stake. GTD has a strong network and reputation among the mining customers in Latin American markets and has been one of our major customers.
The Company holds no licenses issued by relevant Environmental Protection Authorities and there have been no known breaches of any environmental regulations.
No dividends or distributions have been made to members during the year ended 30 June 2014 and no dividends or distributions have been recommended or declared by the Directors in respect of the year ended 30 June 2014.
Subsequent Events After the Balance Date
Environmental Regulations
Dividends
(i) Share options granted during or since the end of the year
During the year 18,920,020 share options were granted. The terms and conditions of these options are disclosed in note 29 of this financial report.
(ii) Shares Issued as a Result of the Exercise of OptionsDuring the year no ordinary shares have been issued as a result of the exercise of options under the Employee Share Options Scheme.
Since the end of the financial year there have been no shares issued by the Board as a result of the exercise of options under the Employee Share Options Scheme.
Share Options
DIRECTORS’ REPORT

392014 ANNUAL REPORT
As at the date of this report there were 18,920,020 unissued ordinary shares under options (615,415 at the previous reporting date).Option holders do not have any right, by virtue of the option, to participate in any share issue of the Company or any related body corporate or in the issue of any other registered scheme.
During the 2014 financial year, 14 Board meetings were held. The following table sets out the number of Directors’ meetings each Director was eligible to attend and the number of meetings they actually attended1.
During the financial year, the Company paid a premium in respect of a contract insuring the Directors of the Company (Seeing Machines Limited and the US subsidiary Seeing Machines Inc), the Company Secretary, and all executive officers of the Company against a liability incurred as such a Director, secretary, or executive officer to the extent permitted by the Corporations Act 2001. The contract of insurance prohibits disclosure of the nature of the liability and the amount of the premium.
Unissued Shares
Directors’ Meetings
Indemnification of Directors and Officers
Terry Winters
Ken Kroeger
David Gaul
Michael Roberts
Rudolph Burger
James A Walker
James D Walker
Alexander Zelinsky
14
14
14
14
4
1
4
10
14
14
13
13
42
13
44
95
MEETINGS ELIGIBLE TO ATTENDDIRECTOR MEETINGS ATTENDED
1 Attendance via telephone conference call included.
2Rudolph Burger was appointed on 15 January 2014.
3 James A Walker was appointed on 19 May 2014.
4James Walker was appointed on 15 January 2014.
5Alexander Zelinsky resigned on 15 January 2014.
DIRECTORS’ REPORT
40 2014 ANNUAL REPORT
To the extent permitted by law, the Company has agreed to indemnify its auditors, Ernst & Young, as part of the terms of its audit engagement against claims by third parties arising from the audit (for an unspecified amount). No payment has been made to indemnify Ernst & Young during or since the financial year.
There were no non-audit services provided by the Company’s auditor, Ernst & Young.
Signed at Canberra this 12th day of September 2014 in accordance with a resolution of the Directors made pursuant to section 298(2) of the Corporations Act 2001.
Terry Winters Chairman
Ken KroegerManaging Director
We have obtained an independence declaration from our auditors, Ernst & Young. The signed declaration is included after this report.
Indemnification of Auditors
Non-Audit Services
Auditor’s Independence Declaration
DIRECTORS’ REPORT

41AUDITOR’S INDEPENDENCE DECLARATION2014 ANNUAL REPORT
42 STATEMENT OF FINANCIAL POSITION 2014 ANNUAL REPORT
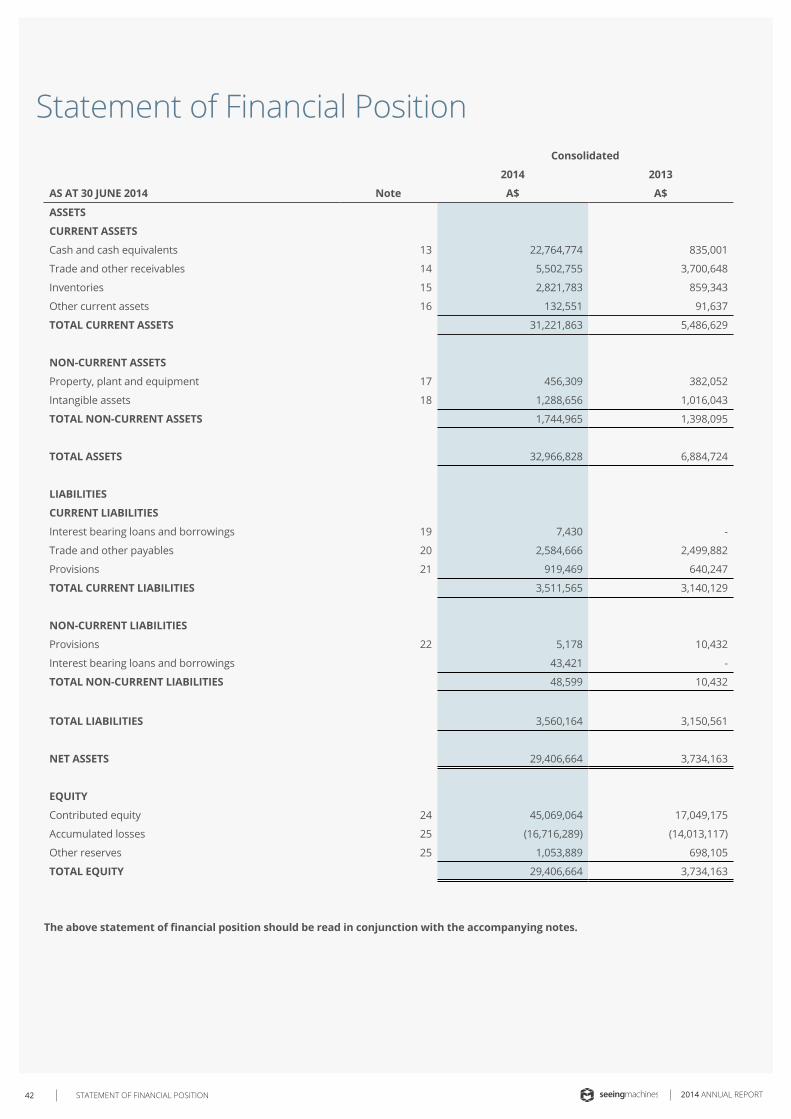
Statement of Financial PositionConsolidated
2014 2013
AS AT 30 JUNE 2014 Note A$ A$
ASSETS
CURRENT ASSETS
Cash and cash equivalents 13 22,764,774 835,001
Trade and other receivables 14 5,502,755 3,700,648
Inventories 15 2,821,783 859,343
Other current assets 16 132,551 91,637
TOTAL CURRENT ASSETS 31,221,863 5,486,629
NON-CURRENT ASSETS
Property, plant and equipment 17 456,309 382,052
Intangible assets 18 1,288,656 1,016,043
TOTAL NON-CURRENT ASSETS 1,744,965 1,398,095
TOTAL ASSETS 32,966,828 6,884,724
LIABILITIES
CURRENT LIABILITIES
Interest bearing loans and borrowings 19 7,430 -
Trade and other payables 20 2,584,666 2,499,882
Provisions 21 919,469 640,247
TOTAL CURRENT LIABILITIES 3,511,565 3,140,129
NON-CURRENT LIABILITIES
Provisions 22 5,178 10,432
Interest bearing loans and borrowings 43,421 -
TOTAL NON-CURRENT LIABILITIES 48,599 10,432
TOTAL LIABILITIES 3,560,164 3,150,561
NET ASSETS 29,406,664 3,734,163
EQUITY
Contributed equity 24 45,069,064 17,049,175
Accumulated losses 25 (16,716,289) (14,013,117)
Other reserves 25 1,053,889 698,105
TOTAL EQUITY 29,406,664 3,734,163
The above statement of financial position should be read in conjunction with the accompanying notes.
43STATEMENT OF COMPREHENSIVE INCOME2014 ANNUAL REPORT
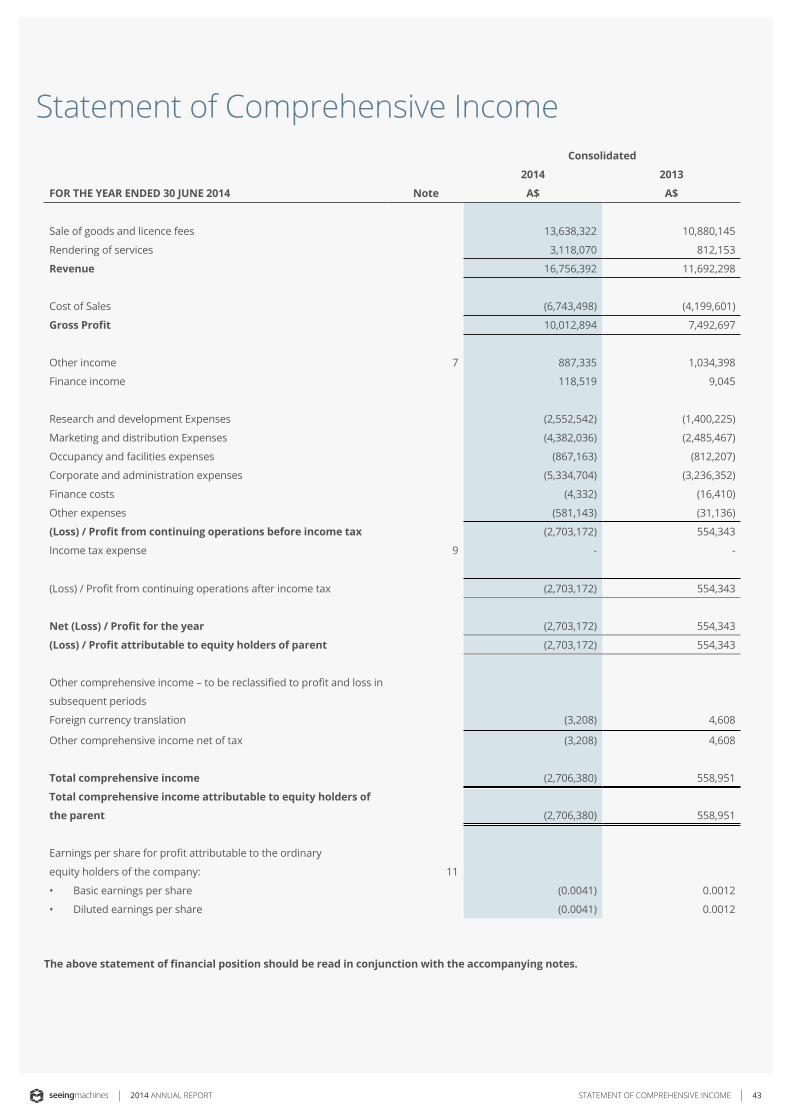
Statement of Comprehensive IncomeConsolidated
2014 2013
FOR THE YEAR ENDED 30 JUNE 2014 Note A$ A$
Sale of goods and licence fees 13,638,322 10,880,145
Rendering of services 3,118,070 812,153
Revenue 16,756,392 11,692,298
Cost of Sales (6,743,498) (4,199,601)
Gross Profit 10,012,894 7,492,697
Other income 7 887,335 1,034,398
Finance income 118,519 9,045
Research and development Expenses (2,552,542) (1,400,225)
Marketing and distribution Expenses (4,382,036) (2,485,467)
Occupancy and facilities expenses (867,163) (812,207)
Corporate and administration expenses (5,334,704) (3,236,352)
Finance costs (4,332) (16,410)
Other expenses (581,143) (31,136)
(Loss) / Profit from continuing operations before income tax (2,703,172) 554,343
Income tax expense 9 - -
(Loss) / Profit from continuing operations after income tax (2,703,172) 554,343
Net (Loss) / Profit for the year (2,703,172) 554,343
(Loss) / Profit attributable to equity holders of parent (2,703,172) 554,343
Other comprehensive income – to be reclassified to profit and loss in
subsequent periods
Foreign currency translation (3,208) 4,608
Other comprehensive income net of tax (3,208) 4,608
Total comprehensive income (2,706,380) 558,951
Total comprehensive income attributable to equity holders of
the parent (2,706,380) 558,951
Earnings per share for profit attributable to the ordinary
equity holders of the company: 11
• Basic earnings per share (0.0041) 0.0012
• Diluted earnings per share (0.0041) 0.0012
The above statement of financial position should be read in conjunction with the accompanying notes.

44 STATEMENT OF CHANGES IN EQUITY 2014 ANNUAL REPORT
Statement of Changes in EquityConsolidated
Contributed
Equity
Treasury
Shares
Accumulated
Losses
Foreign
Currency
Translation
Employee
Equity
Benefits
& Share
Options
Reserve Total Equity
FOR THE YEAR ENDED 30 JUNE 2014 Note A$ A$ A$ A$ A$ A$
At 1 July 2012 15,024,112 (14,567,460) 45,238 648,259 1,150,149
Profit / (Loss) for the year - 554,343 - - 554,343
Other comprehensive income - - 4,608 - 4,608
Total comprehensive income - 554,343 4,608 - 558,951
Transaction with owner in their capacity as owner
Share issue 2,049,124 - - - 2,049,124
Transaction costs (24,061) - - - (24,061)
At 30 June 2013 17,049,175 (14,013,117) 49,846 648,259 3,734,163
At 1 July 2013 17,049,175 (14,013,117) 49,846 648,259 3,734,163
Profit / (Loss) for the year - (2,703,172) - - (2,703,172)
Other comprehensive income - - (3,208) - (3,208)
Total comprehensive income - (2,703,172) (3,208) - (2,706,380)
Transaction with owner in their ca-
pacity as owner
Shares issued 30,310,556 (707,110) - - - 29,603,446
Capital raising costs
(1,583,557)
- - - - (1,583,557)
Employee share loan plan - - - - 233,387 233,387
Share options issued 29(b) - - - - 125,605 125,605
At 30 June 2014 45,776,174 (707,110) (16,716,289) 46,638 1,007,251 29,406,664
The above statement of financial position should be read in conjunction with the accompanying notes.
45STATEMENT OF CASH FLOWS2014 ANNUAL REPORT
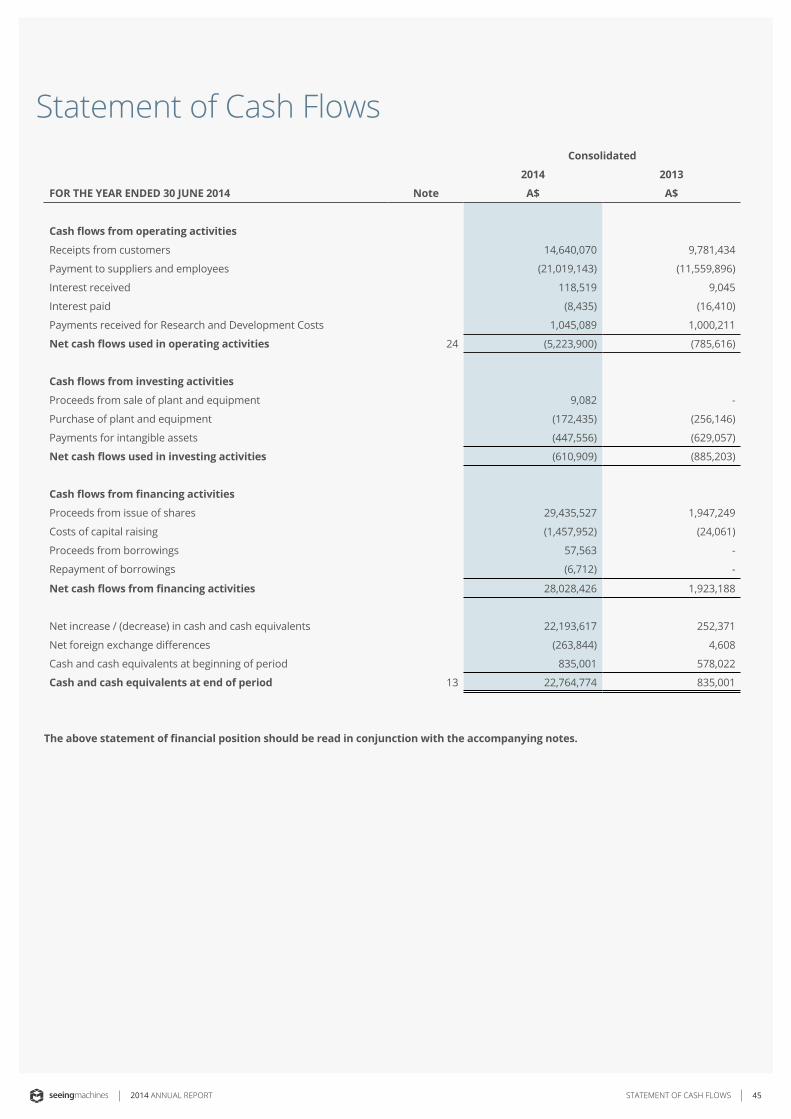
Statement of Cash FlowsConsolidated
2014 2013
FOR THE YEAR ENDED 30 JUNE 2014 Note A$ A$
Cash flows from operating activities
Receipts from customers 14,640,070 9,781,434
Payment to suppliers and employees (21,019,143) (11,559,896)
Interest received 118,519 9,045
Interest paid (8,435) (16,410)
Payments received for Research and Development Costs 1,045,089 1,000,211
Net cash flows used in operating activities 24 (5,223,900) (785,616)
Cash flows from investing activities
Proceeds from sale of plant and equipment 9,082 -
Purchase of plant and equipment (172,435) (256,146)
Payments for intangible assets (447,556) (629,057)
Net cash flows used in investing activities (610,909) (885,203)
Cash flows from financing activities
Proceeds from issue of shares 29,435,527 1,947,249
Costs of capital raising (1,457,952) (24,061)
Proceeds from borrowings 57,563 -
Repayment of borrowings (6,712) -
Net cash flows from financing activities 28,028,426 1,923,188
Net increase / (decrease) in cash and cash equivalents 22,193,617 252,371
Net foreign exchange differences (263,844) 4,608
Cash and cash equivalents at beginning of period 835,001 578,022
Cash and cash equivalents at end of period 13 22,764,774 835,001
The above statement of financial position should be read in conjunction with the accompanying notes.
NOTES TO THE FINANCIAL STATEMENTS46 2014 ANNUAL REPORT
The consolidated financial report of Seeing Machines Limited and its subsidiaries (collectively, the Group) for the year ended 30 June 2014 was authorised for issue in accordance with a resolution of the Directors on 12 September 2014.
Seeing Machines Limited (the parent) is a for-profit company limited by shares incorporated in Australia whose shares are publicly traded on the AIM of the London Stock Exchange.
The nature of the operations and principal activities of the Group are described in the Directors’ Report.
1. Corporate Information
Notes to the Financial Statements
The financial report has been prepared on the going concern basis. The Group has made a loss for the year of A$2,706,380 (2013: Profit of A$554,343). The Group has Accumulated Losses of A$16,716,288 (2013: Accumulated Losses of A$14,013,117). The balance of cash and cash equivalents at 30 June 2014 is A$22,764,774 (2013: Cash and cash equivalents $835,001). The Group has prepared cash flow forecasts for the next twelve months that show that the Group will be able to meet its debts as and when they fall due. These cash flow forecasts are based on a number of assumptions in particular about the Group’s ability to meet projected sales levels, and approval of the Research and Development Tax Incentive claim.
The directors are of the opinion that there are reasonable grounds to believe that the company will meet projected revenue, retain overheads at budget levels and receive the Research and Development Tax Incentive claim. As disclosed in Note 32, subsequent to year end, the Group will shortly lodge a Research and Development Tax Incentive claim for A$2,202,534. The directors are continuing to monitor cash flows on a regular basis and tightly managing discretionary expenditure. On this basis and together with the current cash reserves the directors believe the adoption of the going concern basis of accounting is justified.
2. Going Concern Basis of Accounting
a) Basis of preparationThe financial report is a general-purpose financial report, which has been prepared in accordance with the requirements of the Corporations Act 2001, Australian Accounting Standards as issued by the Australian Accounting Standards Board and other authoritative pronouncements of the Australian Accounting
3. Summary of Significant Accounting Policies
Standards Board. The financial report has also been prepared on a historical cost basis. The financial report is presented in Australian dollars and all values are rounded to the nearest dollar.
b) Compliance with IFRSThe financial report complies with International Financial Reporting Standards (IFRS) as issued by the International Accounting Standards Board
c) New accounting standards and interpretationsThe accounting policies adopted are consistent with those of the previous financial year except as follows:
The Group has adopted the following new and amended Australian Accounting Standards and AASB Interpretations as of 1 July 2013:
• AASB 10- This Standard establishes a new control model that applies to all entities. The new control model broadens the situations when an entity is considered to be controlled by another entity and includes new guidance for applying the model to specific situations, including when acting as a manager may give control, the impact of potential voting rights and when holding less than a majority voting rights may give control. The adoption of these amendments had no material impact on the financial position or performance of the Group.
• AASB 12- This Standard sets out the requirements for disclosures relating to an entity’s interests in subsidiaries, joint arrangements, associates and structured entities. The requirements in this standard are more comprehensive than the previously existing disclosure requirements for subsidiaries. The application of this Standard impacts the disclosure of interest in the subsidiaries in the financial statements which has been incorporated by the group.
• AASB 13- This Standard establishes a single source of guidance for determining the fair value of assets and liabilities. Application of this definition may result in different fair values being determined for the relevant assets. It also expands the disclosure requirements for all assets or liabilities carried at fair value. This includes information about the assumptions made and the qualitative impact of those assumptions on the fair value determined. The application of this Standard has impacted the disclosure of fair value of the assets which have been noted by the Group.
(Section continues on next page)
47NOTES TO THE FINANCIAL STATEMENTS2014 ANNUAL REPORT
• AASB119 -The revised Standard changes the definition of short-term employee benefits. The distinction between short-term and other long-term employee benefits is now based on whether the benefits are expected to be settled wholly within 12 months after the reporting date. The application of this Standard has impacted the measurement of employee benefits in the financial statements which has been noted by the Group and has not had a material impact.
• AASB 2012-5 - AASB 2012-5 makes amendments resulting from the 2009-2011 Annual Improvements Cycle. The standard addresses a range of improvements, including repeat application of AASB 1 is permitted (AASB 1) and clarification of the comparative information requirements when an entity provides a third balance sheet (AASB 101 Presentation of Financial Statements). No impact of this Standard has been noted upon the application of this Standard.
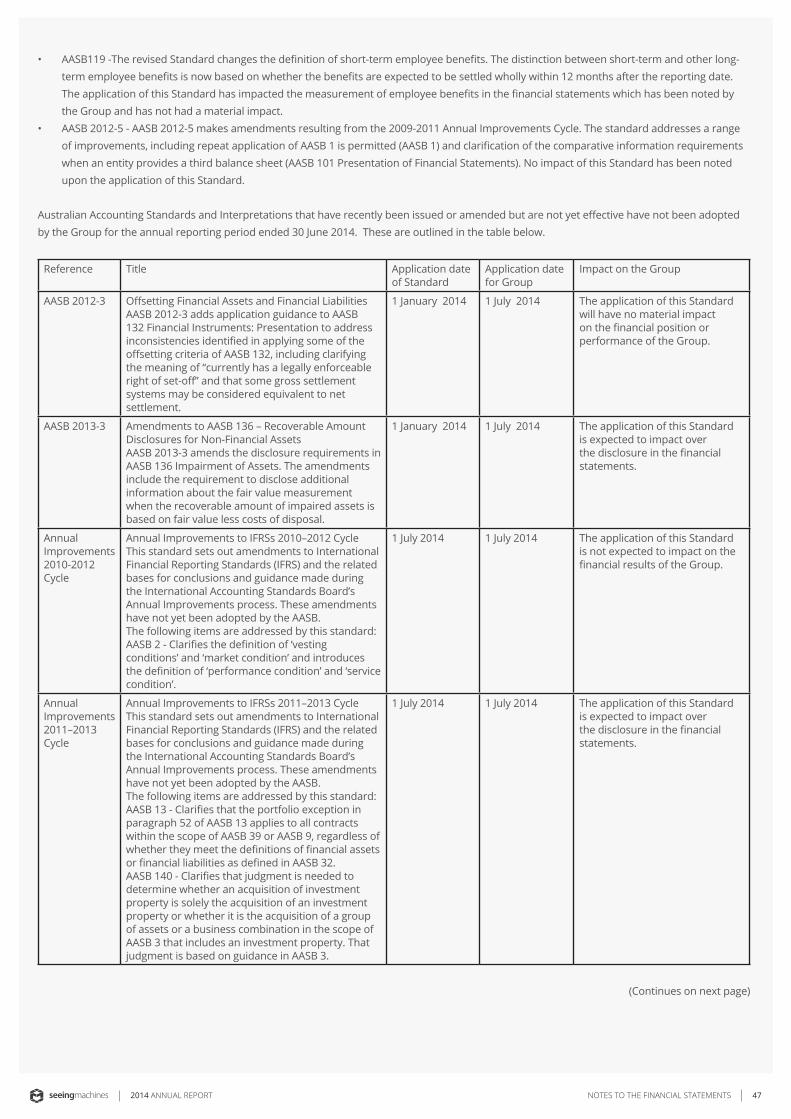
Australian Accounting Standards and Interpretations that have recently been issued or amended but are not yet effective have not been adopted by the Group for the annual reporting period ended 30 June 2014. These are outlined in the table below.
Reference Title Application date of Standard
Application date for Group
Impact on the Group
AASB 2012-3 Offsetting Financial Assets and Financial LiabilitiesAASB 2012-3 adds application guidance to AASB 132 Financial Instruments: Presentation to address inconsistencies identified in applying some of the offsetting criteria of AASB 132, including clarifying the meaning of “currently has a legally enforceable right of set-off” and that some gross settlement systems may be considered equivalent to net settlement.
1 January 2014 1 July 2014 The application of this Standard will have no material impact on the financial position or performance of the Group.
AASB 2013-3 Amendments to AASB 136 – Recoverable Amount Disclosures for Non-Financial AssetsAASB 2013-3 amends the disclosure requirements in AASB 136 Impairment of Assets. The amendments include the requirement to disclose additional information about the fair value measurement when the recoverable amount of impaired assets is based on fair value less costs of disposal.
1 January 2014 1 July 2014 The application of this Standard is expected to impact over the disclosure in the financial statements.
Annual Improvements 2010-2012 Cycle
Annual Improvements to IFRSs 2010–2012 CycleThis standard sets out amendments to International Financial Reporting Standards (IFRS) and the related bases for conclusions and guidance made during the International Accounting Standards Board’s Annual Improvements process. These amendments have not yet been adopted by the AASB.The following items are addressed by this standard:AASB 2 - Clarifies the definition of ‘vesting conditions’ and ‘market condition’ and introduces the definition of ‘performance condition’ and ‘service condition’.
1 July 2014 1 July 2014 The application of this Standard is not expected to impact on the financial results of the Group.
Annual Improvements 2011–2013 Cycle
Annual Improvements to IFRSs 2011–2013 CycleThis standard sets out amendments to International Financial Reporting Standards (IFRS) and the related bases for conclusions and guidance made during the International Accounting Standards Board’s Annual Improvements process. These amendments have not yet been adopted by the AASB.The following items are addressed by this standard:AASB 13 - Clarifies that the portfolio exception in paragraph 52 of AASB 13 applies to all contracts within the scope of AASB 39 or AASB 9, regardless of whether they meet the definitions of financial assets or financial liabilities as defined in AASB 32.AASB 140 - Clarifies that judgment is needed to determine whether an acquisition of investment property is solely the acquisition of an investment property or whether it is the acquisition of a group of assets or a business combination in the scope of AASB 3 that includes an investment property. That judgment is based on guidance in AASB 3.
1 July 2014 1 July 2014 The application of this Standard is expected to impact over the disclosure in the financial statements.
(Continues on next page)
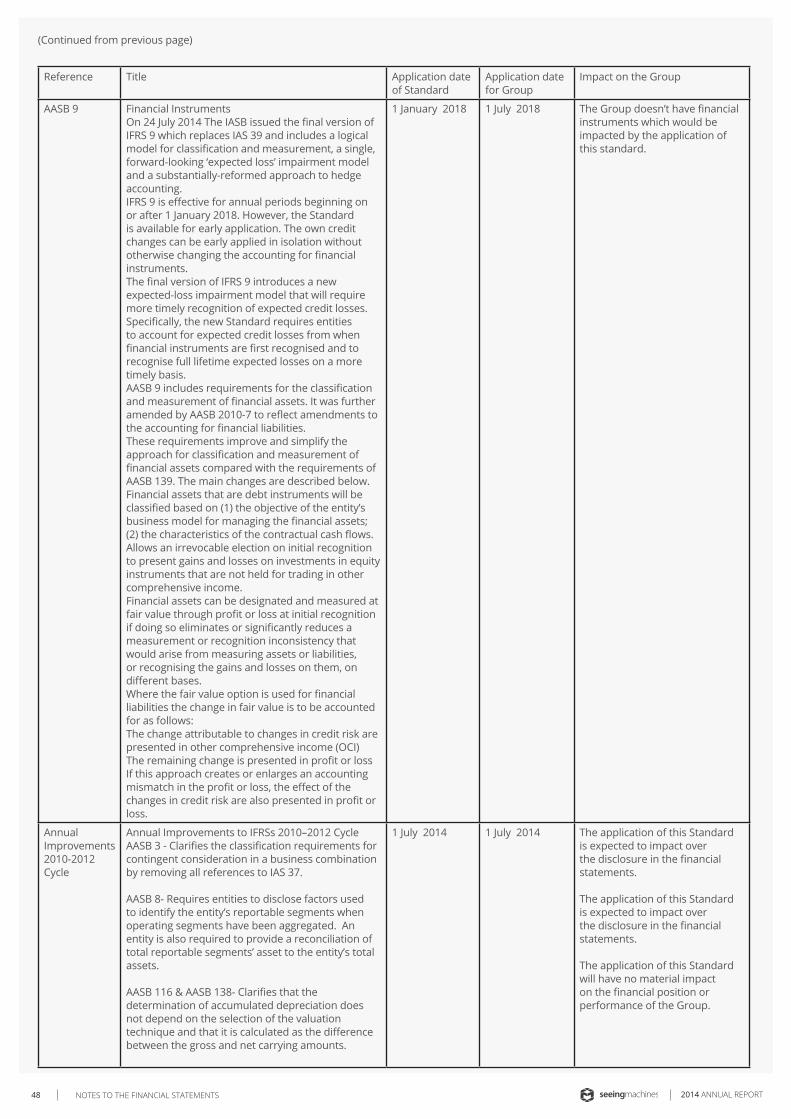
NOTES TO THE FINANCIAL STATEMENTS48 2014 ANNUAL REPORT
(Continued from previous page)
Reference Title Application date of Standard
Application date for Group
Impact on the Group
AASB 9 Financial InstrumentsOn 24 July 2014 The IASB issued the final version of IFRS 9 which replaces IAS 39 and includes a logical model for classification and measurement, a single, forward-looking ‘expected loss’ impairment model and a substantially-reformed approach to hedge accounting.IFRS 9 is effective for annual periods beginning on or after 1 January 2018. However, the Standard is available for early application. The own credit changes can be early applied in isolation without otherwise changing the accounting for financial instruments.The final version of IFRS 9 introduces a new expected-loss impairment model that will require more timely recognition of expected credit losses. Specifically, the new Standard requires entities to account for expected credit losses from when financial instruments are first recognised and to recognise full lifetime expected losses on a more timely basis.AASB 9 includes requirements for the classification and measurement of financial assets. It was further amended by AASB 2010-7 to reflect amendments to the accounting for financial liabilities.These requirements improve and simplify the approach for classification and measurement of financial assets compared with the requirements of AASB 139. The main changes are described below.Financial assets that are debt instruments will be classified based on (1) the objective of the entity’s business model for managing the financial assets; (2) the characteristics of the contractual cash flows.Allows an irrevocable election on initial recognition to present gains and losses on investments in equity instruments that are not held for trading in other comprehensive income. Financial assets can be designated and measured at fair value through profit or loss at initial recognition if doing so eliminates or significantly reduces a measurement or recognition inconsistency that would arise from measuring assets or liabilities, or recognising the gains and losses on them, on different bases.Where the fair value option is used for financial liabilities the change in fair value is to be accounted for as follows:The change attributable to changes in credit risk are presented in other comprehensive income (OCI)The remaining change is presented in profit or lossIf this approach creates or enlarges an accounting mismatch in the profit or loss, the effect of the changes in credit risk are also presented in profit or loss.
1 January 2018 1 July 2018 The Group doesn’t have financial instruments which would be impacted by the application of this standard.
Annual Improvements 2010-2012 Cycle
Annual Improvements to IFRSs 2010–2012 CycleAASB 3 - Clarifies the classification requirements for contingent consideration in a business combination by removing all references to IAS 37.
AASB 8- Requires entities to disclose factors used to identify the entity’s reportable segments when operating segments have been aggregated. An entity is also required to provide a reconciliation of total reportable segments’ asset to the entity’s total assets.
AASB 116 & AASB 138- Clarifies that the determination of accumulated depreciation does not depend on the selection of the valuation technique and that it is calculated as the difference between the gross and net carrying amounts.
1 July 2014 1 July 2014 The application of this Standard is expected to impact over the disclosure in the financial statements.
The application of this Standard is expected to impact over the disclosure in the financial statements.
The application of this Standard will have no material impact on the financial position or performance of the Group.
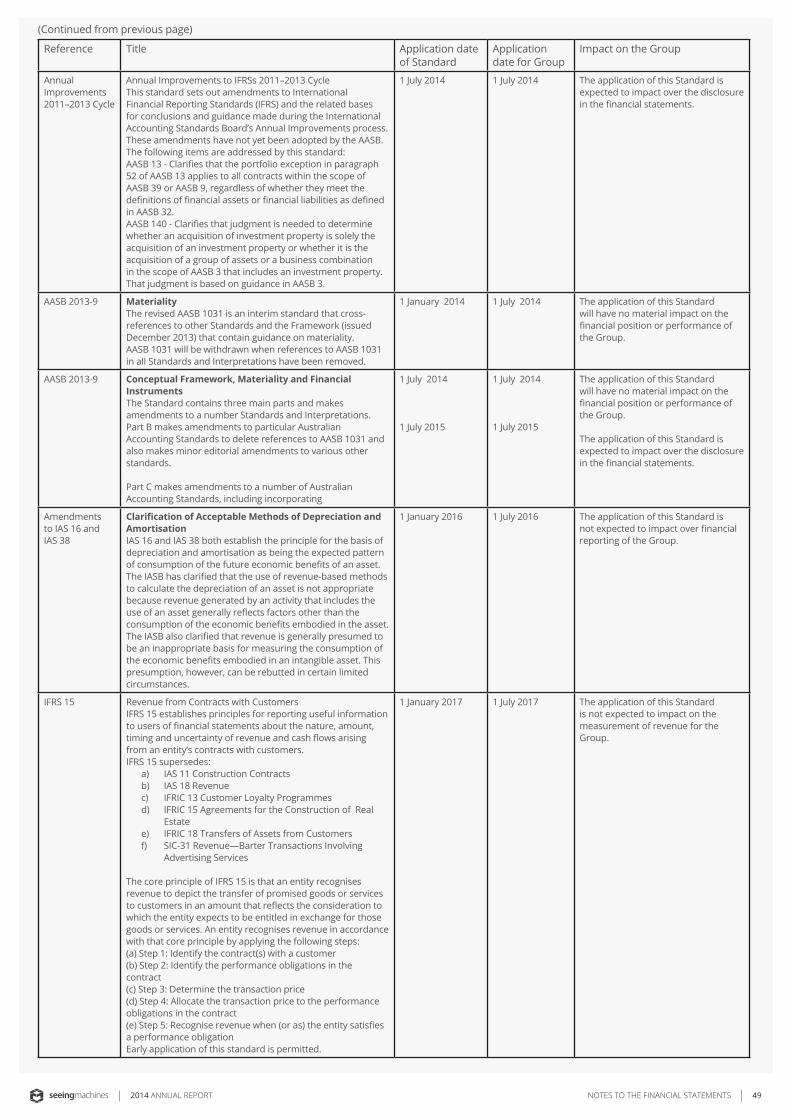
49NOTES TO THE FINANCIAL STATEMENTS2014 ANNUAL REPORT
(Continued from previous page)
Reference Title Application date of Standard
Application date for Group
Impact on the Group
Annual Improvements 2011–2013 Cycle
Annual Improvements to IFRSs 2011–2013 CycleThis standard sets out amendments to International Financial Reporting Standards (IFRS) and the related bases for conclusions and guidance made during the International Accounting Standards Board’s Annual Improvements process. These amendments have not yet been adopted by the AASB.The following items are addressed by this standard:AASB 13 - Clarifies that the portfolio exception in paragraph 52 of AASB 13 applies to all contracts within the scope of AASB 39 or AASB 9, regardless of whether they meet the definitions of financial assets or financial liabilities as defined in AASB 32.AASB 140 - Clarifies that judgment is needed to determine whether an acquisition of investment property is solely the acquisition of an investment property or whether it is the acquisition of a group of assets or a business combination in the scope of AASB 3 that includes an investment property. That judgment is based on guidance in AASB 3.
1 July 2014 1 July 2014 The application of this Standard is expected to impact over the disclosure in the financial statements.
AASB 2013-9 MaterialityThe revised AASB 1031 is an interim standard that cross-references to other Standards and the Framework (issued December 2013) that contain guidance on materiality. AASB 1031 will be withdrawn when references to AASB 1031 in all Standards and Interpretations have been removed.
1 January 2014 1 July 2014 The application of this Standard will have no material impact on the financial position or performance of the Group.
AASB 2013-9 Conceptual Framework, Materiality and Financial InstrumentsThe Standard contains three main parts and makes amendments to a number Standards and Interpretations. Part B makes amendments to particular Australian Accounting Standards to delete references to AASB 1031 and also makes minor editorial amendments to various other standards.
Part C makes amendments to a number of Australian Accounting Standards, including incorporating
1 July 2014
1 July 2015
1 July 2014
1 July 2015
The application of this Standard will have no material impact on the financial position or performance of the Group.
The application of this Standard is expected to impact over the disclosure in the financial statements.
Amendments to IAS 16 and IAS 38
Clarification of Acceptable Methods of Depreciation and Amortisation IAS 16 and IAS 38 both establish the principle for the basis of depreciation and amortisation as being the expected pattern of consumption of the future economic benefits of an asset. The IASB has clarified that the use of revenue-based methods to calculate the depreciation of an asset is not appropriate because revenue generated by an activity that includes the use of an asset generally reflects factors other than the consumption of the economic benefits embodied in the asset.The IASB also clarified that revenue is generally presumed to be an inappropriate basis for measuring the consumption of the economic benefits embodied in an intangible asset. This presumption, however, can be rebutted in certain limited circumstances.
1 January 2016 1 July 2016 The application of this Standard is not expected to impact over financial reporting of the Group.
IFRS 15 Revenue from Contracts with Customers IFRS 15 establishes principles for reporting useful information to users of financial statements about the nature, amount, timing and uncertainty of revenue and cash flows arising from an entity’s contracts with customers.IFRS 15 supersedes:
a) IAS 11 Construction Contractsb) IAS 18 Revenuec) IFRIC 13 Customer Loyalty Programmesd) IFRIC 15 Agreements for the Construction of Real
Estatee) IFRIC 18 Transfers of Assets from Customersf) SIC-31 Revenue—Barter Transactions Involving
Advertising Services
The core principle of IFRS 15 is that an entity recognises revenue to depict the transfer of promised goods or services to customers in an amount that reflects the consideration to which the entity expects to be entitled in exchange for those goods or services. An entity recognises revenue in accordance with that core principle by applying the following steps:(a) Step 1: Identify the contract(s) with a customer(b) Step 2: Identify the performance obligations in the contract(c) Step 3: Determine the transaction price(d) Step 4: Allocate the transaction price to the performance obligations in the contract(e) Step 5: Recognise revenue when (or as) the entity satisfies a performance obligationEarly application of this standard is permitted.
1 January 2017 1 July 2017 The application of this Standard is not expected to impact on the measurement of revenue for the Group.
NOTES TO THE FINANCIAL STATEMENTS50 2014 ANNUAL REPORT
d) Basis of consolidationThe consolidated financial statements comprise the financial statements of Seeing Machines Limited and its subsidiaries (as outlined in note 27 as at 30 June each year (the Group).
Control is achieved when the Group is exposed, or has rights, to variable returns from its involvement with the investee and has the ability to affect those returns through its power over the investee. Specifically, the Group controls an investee if and only if the Group has:• Power over the investee (i.e. existing rights that give it the
current ability to direct the relevant activities of the investee)• Exposure, or rights, to variable returns from its involvement with
the investee, and• The ability to use its power over the investee to affect its returns
When the Group has less than a majority of the voting or similar rights of an investee, the Group considers all relevant facts and circumstances in assessing whether it has power over an investee including:• The contractual arrangement with the other vote holders of the
investee• Rights arising from other contractual arrangements• The Group’s voting rights and potential voting rights
The Group re-assesses whether or not it controls an investee if facts and circumstances indicate that there are changes to one or more of the three elements of control. Consolidation of a subsidiary begins when the Group obtains control over the subsidiary and ceases when the Group loses control of the subsidiary. Assets, liabilities, income and expenses of a subsidiary acquired or disposed of during the year are included in the statement of comprehensive income from the date the Group gains control until the date the Group ceases to control the subsidiary.
Profit or loss and each component of other comprehensive income (OCI) are attributed to the equity holders of the parent of the Group. When necessary, adjustments are made to the financial statements of subsidiaries to bring their accounting policies into line with the Group’s accounting policies. All intra-group assets and liabilities, equity, income, expenses and cash flows relating to transactions between members of the Group are eliminated in full on consolidation.
e) Business combinationsBusiness combinations are accounted for using the acquisition method. The cost of an acquisition is measured as the aggregate of the consideration transferred measured at acquisition date fair value and the amount of any non-controlling interests in the acquiree. For each business combination, the Group elects whether to measure the non-controlling interests in the acquiree at fair value or at the proportionate share of the acquiree’s identifiable net assets. Acquisition-related costs are expensed as incurred and included in administrative expenses.
When the Group acquires a business, it assesses the financial assets and liabilities assumed for appropriate classification and designation in accordance with the contractual terms, economic circumstances and pertinent conditions as at the acquisition date. This includes the separation of embedded derivatives in host contracts by the acquiree.
If the business combination is achieved in stages, any previously held equity interest is re-measured at its acquisition date fair value and any resulting gain or loss is recognised in profit or loss.
Any contingent consideration to be transferred by the acquirer will be recognised at fair value at the acquisition date. Contingent consideration classified as an asset or liability that is a financial instrument and within the scope of AASB 139 Financial Instruments: Recognition and Measurement, is measured at fair value with changes in fair value recognised either in either profit or loss or as a change to OCI. If the contingent consideration is not within the scope of AASB 139, it is measured in accordance with the appropriate AASB. Contingent consideration that is classified as equity is not re-measured and subsequent settlement is accounted for within equity.
f) Segment Information – refer note 6An operating segment is a component of the entity that engages in business activities from which it may earn revenues and incur expenses, whose operating results are regularly reviewed by the entity’s chief operating decision makers to make decisions about resources to be allocated to the segment and asses its performance and for which discrete financial information is available. Management will also consider other factors in determining operating segments such as the level of segment information presented to the board of directors.
Operating segments that meet the qualitative criteria as prescribed by AASB 8 are reported separately. However an operating segment that does not meet the qualitative criteria is still reported separately where information about the segment would be useful to users of the financial statements.
A geographical segment is a distinguishable component of the entity that is engaged in providing products or services within a particular economic environment and is subject to risks and returns that are different than those of segments operating in other economic environments.
g) Foreign currency translation(i) Functional and presentation currencyBoth the functional and presentation currency of Seeing Machines Limited is Australian dollars ($). The United States subsidiary’s functional currency is United States Dollars which is translated to presentation currency (see below).
(ii) Transactions and balancesTransactions in foreign currencies are initially recorded in the functional currency by applying the exchange rates ruling at the date of the transaction. Monetary assets and liabilities denominated in foreign currencies are retranslated at the rate of exchange ruling at the reporting date. Non-monetary items that are measured in terms of historical cost in a foreign currency are translated using the exchange rate as at the date of the initial transaction. Non-monetary items measured at fair value in a foreign currency are translated using the exchange rates at the date when the fair value was determined.
(iii) Group CompaniesOn consolidation, the assets and liabilities of foreign operations are translated into dollars at the rate of exchange prevailing at the reporting date and their statements of profit or loss are translated at exchange rates prevailing at the dates of the transactions. The exchange differences arising on translation for consolidation are recognised in other comprehensive income. If a United States subsidiary were sold, the proportionate share of exchange differences would be transferred out of equity and recognised in the statement of comprehensive income.

51NOTES TO THE FINANCIAL STATEMENTS2014 ANNUAL REPORT
h) Cash and cash equivalents – refer note 13Cash and cash equivalents in the statement of financial position comprise cash at bank and in hand and short-term deposits with an original maturity of three months or less that are readily convertible to known amounts of cash and which are subject to an insignificant risk of changes in value.
For the purposes of the Statement of Cash Flows, cash and cash equivalents consist of cash and cash equivalents as defined above, net of outstanding bank overdrafts. Bank overdrafts are included within interest-bearing loans and borrowings in current liabilities on the statement of financial position.
i) Inventories - refer note 15Inventories including raw materials, work in progress and finished goods are valued at the lower of cost and net realisable value.
Costs incurred in bringing each product to its present location and condition are accounted for as follows:
Raw materials, work in progress and finished goods – purchase cost on a first-in, first-out basis. The cost of purchase comprises the purchase price including the transfer from equity of gains and losses on qualifying cash flow hedges of purchases of raw materials, import duties and other taxes (other than those subsequently recoverable by the entity from the taxing authorities), transport, handling and other costs directly attributable to the acquisition of raw materials. Volume discounts and rebates are included in determining the cost of purchase.
Net realisable value is the estimated selling price in the ordinary course of business, less estimated costs of completion and the estimated costs necessary to make the sale.
j) Property, plant and equipment – refer note 17Plant and equipment is stated at cost less accumulated depreciation and any accumulated impairment losses. Such cost includes the cost of replacing parts that are eligible for capitalisation when the cost of replacing the parts is incurred. Similarly, when each major inspection is performed, its cost is recognised in the carrying amount of the plant and equipment as a replacement only if it is eligible for capitalisation. All other repairs and maintenance are recognised in profit or loss as incurred.
Depreciation is calculated on the diminishing value or straight line basis using the following depreciation rates of the specific asset as follows:Office furniture, fittings and equipment - 11.25% to 40%Research and development software and equipment - 33.3%
The assets’ residual values, useful lives and amortisation methods are reviewed, and adjusted if appropriate, at each financial year end.
De-recognitionAn item of property, plant and equipment is derecognised upon disposal or when no further future economic benefits are expected from its use or disposal.
k) LeasesThe determination of whether an arrangement is or contains a lease is based on the substance of the arrangement and requires an assessment of whether the fulfilment of the arrangement is dependent on the use of a specific asset or assets and the arrangement conveys a right to use the asset.
i) Group as a lesseeFinance leases, which transfer to the Group substantially all the risks and benefits incidental to ownership of the leased item, are capitalised at the inception of the lease at the fair value of the leased asset or, if lower, at the present value of the minimum lease payments. Lease payments are apportioned between the finance charges and reduction of the lease liability so as to achieve a constant rate of interest on the remaining balance of the liability. Finance charges are recognised as an expense in profit or loss.
Capitalised leased assets are depreciated over the shorter of the estimated useful life of the asset and the lease term if there is no reasonable certainty that the Group will obtain ownership by the end of the lease term.
Operating lease payments are recognised as an expense in the statement of comprehensive income on a straight-line basis over the lease term. Operating lease incentives are recognised as a liability when received and subsequently reduced by allocating lease payments between rental expense and reduction of the liability.
l) Impairment of non-financial assetsThe Group assesses, at each reporting date, whether there is an indication that an asset may be impaired. If any indication exists, or when annual impairment testing for an asset is required, the Group estimates the asset’s recoverable amount. An asset’s recoverable amount is the higher of an asset’s fair value less costs of disposal and its value in use. Recoverable amount is determined for an individual asset, unless the asset does not generate cash inflows that are largely independent of those from other assets or groups of assets. When the carrying amount of an asset or CGU exceeds its recoverable amount, the asset is considered impaired and is written down to its recoverable amount.
In assessing value in use, the Group conducts an annual internal review of asset values, which is used as a source of information to assess for any indicators of impairment. External factors, such as changes in expected future processes, technology and economic conditions, are also monitored to assess for indicators of impairment. If any indication of impairment exists, an estimate of the asset’s recoverable amount is calculated.
Impairment losses of continuing operations, including impairment on inventories are recognised in the statement of profit or loss in expense categories consistent with the functions of the impaired asset, except for the assets previously revalued with the revaluation taken to OCI. For such assets, the impairment is recognised in OCI up to the amount of any previous revaluation.
For assets excluding goodwill, an assessment is made at each reporting date to determine whether there is an indication that previously recognised impairment losses no longer exist or have decreased. If such indication exists, the Group estimates the asset’s or CGU’s recoverable amount. A previously recognised impairment loss is reversed only if there has been a change in the assumptions used to determine the asset’s recoverable amount since the last impairment loss was recognised. The reversal is limited so that the carrying amount of the asset does not exceed its recoverable amount, nor exceed the carrying amount that would have been determined, net of depreciation, had no impairment loss been recognised for the asset in prior years. Such reversal is recognised in the statement of profit or loss unless the asset is carried at a revalued amount, in which case, the reversal is treated as a revaluation increase.
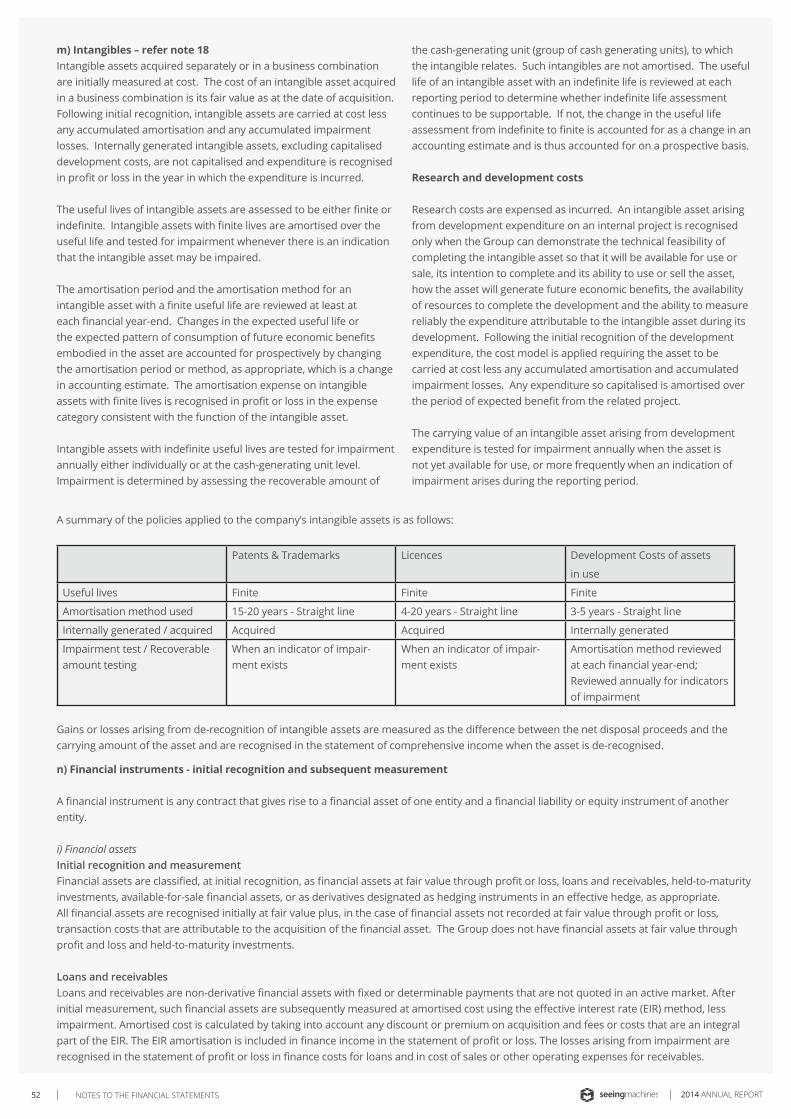
NOTES TO THE FINANCIAL STATEMENTS52 2014 ANNUAL REPORT
m) Intangibles – refer note 18Intangible assets acquired separately or in a business combination are initially measured at cost. The cost of an intangible asset acquired in a business combination is its fair value as at the date of acquisition. Following initial recognition, intangible assets are carried at cost less any accumulated amortisation and any accumulated impairment losses. Internally generated intangible assets, excluding capitalised development costs, are not capitalised and expenditure is recognised in profit or loss in the year in which the expenditure is incurred.
The useful lives of intangible assets are assessed to be either finite or indefinite. Intangible assets with finite lives are amortised over the useful life and tested for impairment whenever there is an indication that the intangible asset may be impaired.
The amortisation period and the amortisation method for an intangible asset with a finite useful life are reviewed at least at each financial year-end. Changes in the expected useful life or the expected pattern of consumption of future economic benefits embodied in the asset are accounted for prospectively by changing the amortisation period or method, as appropriate, which is a change in accounting estimate. The amortisation expense on intangible assets with finite lives is recognised in profit or loss in the expense category consistent with the function of the intangible asset.
Intangible assets with indefinite useful lives are tested for impairment annually either individually or at the cash-generating unit level. Impairment is determined by assessing the recoverable amount of
the cash-generating unit (group of cash generating units), to which the intangible relates. Such intangibles are not amortised. The useful life of an intangible asset with an indefinite life is reviewed at each reporting period to determine whether indefinite life assessment continues to be supportable. If not, the change in the useful life assessment from indefinite to finite is accounted for as a change in an accounting estimate and is thus accounted for on a prospective basis.
Research and development costs
Research costs are expensed as incurred. An intangible asset arising from development expenditure on an internal project is recognised only when the Group can demonstrate the technical feasibility of completing the intangible asset so that it will be available for use or sale, its intention to complete and its ability to use or sell the asset, how the asset will generate future economic benefits, the availability of resources to complete the development and the ability to measure reliably the expenditure attributable to the intangible asset during its development. Following the initial recognition of the development expenditure, the cost model is applied requiring the asset to be carried at cost less any accumulated amortisation and accumulated impairment losses. Any expenditure so capitalised is amortised over the period of expected benefit from the related project.
The carrying value of an intangible asset arising from development expenditure is tested for impairment annually when the asset is not yet available for use, or more frequently when an indication of impairment arises during the reporting period.
A summary of the policies applied to the company’s intangible assets is as follows:
Patents & Trademarks Licences Development Costs of assets
in use
Useful lives Finite Finite Finite
Amortisation method used 15-20 years - Straight line 4-20 years - Straight line 3-5 years - Straight line
Internally generated / acquired Acquired Acquired Internally generated
Impairment test / Recoverable amount testing
When an indicator of impair-ment exists
When an indicator of impair-ment exists
Amortisation method reviewed at each financial year-end; Reviewed annually for indicators of impairment
Gains or losses arising from de-recognition of intangible assets are measured as the difference between the net disposal proceeds and the carrying amount of the asset and are recognised in the statement of comprehensive income when the asset is de-recognised.
n) Financial instruments - initial recognition and subsequent measurement
A financial instrument is any contract that gives rise to a financial asset of one entity and a financial liability or equity instrument of another entity.
i) Financial assetsInitial recognition and measurementFinancial assets are classified, at initial recognition, as financial assets at fair value through profit or loss, loans and receivables, held-to-maturity investments, available-for-sale financial assets, or as derivatives designated as hedging instruments in an effective hedge, as appropriate. All financial assets are recognised initially at fair value plus, in the case of financial assets not recorded at fair value through profit or loss, transaction costs that are attributable to the acquisition of the financial asset. The Group does not have financial assets at fair value through profit and loss and held-to-maturity investments.
Loans and receivablesLoans and receivables are non-derivative financial assets with fixed or determinable payments that are not quoted in an active market. After initial measurement, such financial assets are subsequently measured at amortised cost using the effective interest rate (EIR) method, less impairment. Amortised cost is calculated by taking into account any discount or premium on acquisition and fees or costs that are an integral part of the EIR. The EIR amortisation is included in finance income in the statement of profit or loss. The losses arising from impairment are recognised in the statement of profit or loss in finance costs for loans and in cost of sales or other operating expenses for receivables.
53NOTES TO THE FINANCIAL STATEMENTS2014 ANNUAL REPORT
De-recognitionA financial asset (or, where applicable, a part of a financial asset or part of a group of similar financial assets) is primarily de-recognised (i.e. removed from the group’s consolidated statement of financial position) when:• The rights to receive cash flows from the asset have expired; or• The Group has transferred its rights to receive cash flows from
the asset or has assumed an obligation to pay the received cash flows in full without material delay to a third party under a ”pass-through” arrangement; and either (a) the Group has transferred substantially all the risks and rewards of the asset, or (b) the Group has neither transferred nor retained substantially all the risks and rewards of the asset, but has transferred control of the asset.
When the Group has transferred its rights to receive cash flows from an asset or has entered into a pass-through arrangement, it evaluates if and to what extent it has retained the risks and rewards of ownership. When it has neither transferred nor retained substantially all of the risks and rewards of the asset, nor transferred control of the asset, the Group continues to recognise the transferred asset to the extent of the Group’s continuing involvement. In that case, the Group also recognises an associated liability. The transferred asset and the associated liability are measured on a basis that reflects the rights and obligations that the Group has retained.
Impairment of financial assetsThe Group assesses, at each reporting date, whether there is objective evidence that a financial asset or a group of financial assets is impaired. An impairment exists if one or more events that has occurred since the initial recognition of the asset (an incurred ‘loss event’) has an impact on the estimated future cash flows of the financial asset or the group of financial assets that can be reliably estimated. Evidence of impairment may include indications that the debtors or a group of debtors is experiencing significant financial difficulty, default or delinquency in interest or principal payments, the probability that they will enter bankruptcy or other financial reorganisation and observable data indicating that there is a measurable decrease in the estimated future cash flows, such as changes in arrears or economic conditions that correlate with defaults.
ii) Financial Liabilities
Initial Recognition and measurementFinancial liabilities are classified, at initial recognition, as financial liabilities at fair value through profit or loss, loans and borrowings, payables, or as derivatives designated as hedging instruments in an effective hedge, as appropriate.All financial liabilities are recognised initially at fair value and, in the case of loans and borrowings and payables, net of directly attributable transaction costs.
The Group’s financial liabilities include trade and other payables, loans and borrowings, including bank overdrafts,
Subsequent measurementThe measurement of financial liabilities depends on their classification, as described below:
Loans and BorrowingsAfter initial recognition, interest bearing loans and borrowings are subsequently measures at amortised cost using the Effective Interest Rate (EIR) method. Gains and losses are recognised in the income statement when the liabilities are derecognised as well as through the EIR amortisation process.
Amortised cost is calculated by taking into account any discount or premium on acquisition and fees or costs that are an integral part of the EIR. The amortisation is in included in finance costs in the statement of comprehensive income.
De-recognitionA financial liability is de-recognised when the obligation under the liability is discharged or cancelled, or expires. When an existing financial liability is replaced by another from the same lender on substantially different terms, or the terms of an existing liability are substantially modified, such an exchange or modification is treated as the de-recognition of the original liability and the recognition of a new liability. The difference in the respective carrying amounts is recognised in the statement or profit or loss.
Offsetting of financial instrumentsFinancial assets and financial liabilities are offset and the net amount is reported in the consolidated statement of financial position if there is a currently enforceable legal right to offset the recognised amounts and there is an intention to settle on a net basis, to realise the assets and settle the liabilities simultaneously.
o) Provisions – refer notes 21 and 22Provisions are recognised when the Group has a present obligation (legal or constructive) as a result of a past event, it is probable that an outflow of resources embodying economic benefits will be required to settle the obligation and a reliable estimate can be made of the amount of the obligation.
When the Group expects some or all of a provision to be reimbursed, for example under an insurance contract, the reimbursement is recognised as a separate asset but only when the reimbursement is virtually certain. The expense relating to any provision is presented in the statement of comprehensive income net of any reimbursement.
Provisions are measured at the present value of management’s best estimate of the expenditure required to settle the present obligation at the reporting date using a discounted cash flow methodology. The risks specific to the provision are factored into the cash flows and as such a risk-free government bond rate relative to the expected life of the provision is used as a discount rate. If the effect of the time value of money is material, provisions are discounted using a current pre-tax rate that reflects the time value of money and the risks specific to the liability. The increase in the provision resulting from the passage of time is recognised in finance costs.
i) Short-term employee benefitsLiabilities for wages and salaries, including non-monetary benefits and annual leave expected to be settled within 12 months of the reporting date are recognised in respect of employees’ services up to the reporting date and are measured at the amounts expected to be paid when the liabilities are settled. Expenses for non-accumulating sick leave are recognised when the leave is taken and are measured at the rates paid or payable.

NOTES TO THE FINANCIAL STATEMENTS54 2014 ANNUAL REPORT
ii) Other long-term employee benefitsThe liability for annual leave and long service leave not expected to be settled within 12 months of the reporting date are recognised in non-current liabilities, provided there is an unconditional right to defer settlement of the liability. The liability is measured as the present value of expected future payments to be made in respect of services provided by employees up to the reporting date using the projected unit credit method. Consideration is given to expected future wage and salary levels, experience of employee departures, and periods of service. Expected future payments are discounted using market yields at the reporting date on national government bonds with terms to maturity and currencies that match, as closely as possible, the estimated future cash outflows.
iii) Warranty Provision The Group closely monitors the performance of DSS IVS Computer for the failure rate within warranty period to assess the likely warranty costs. A warranty provision is recognized and revised based on this assessment.
p) Share-based payment transactions – refer note 29The Group provides benefits to employees (including KMP and directors in the form of share-based payment transactions, whereby employees render services in exchange for shares or rights over shares (‘equity-settled transactions’).
The cost of these equity-settled transactions with employees is measured by reference to the fair value at the date at which they are granted. The fair value is determined by using a Trinomial model.
In valuing equity-settled transactions, no account is taken of any vesting conditions, other than conditions linked to the price of the shares of Seeing Machines Limited (market conditions).
The cost of equity–settled transactions is recognised, together with a corresponding increase in equity, over the period in which the performance conditions and/or service conditions are fulfilled (the vesting period) ending on the date on which the relevant employees become fully-entitled to the award (the vesting date).At each subsequent reporting date until vesting, the cumulative charge to the statement of comprehensive income is the product of:
i) The grant date fair value of the award.ii) The current best estimate of the number of awards that
will vest, taking into account such factors as the likelihood of employee turnover during the vesting period and the likelihood of non-market performance conditions being met.
iii) The expired portion of the vesting period.
The charge to the statement of comprehensive income for the period is the cumulative amount as calculated above less the amounts already charged in previous periods. There is a corresponding entry to equity.If the terms of an equity-settled award are modified, as a minimum an expense is recognised as if the terms had not been modified. An additional expense is recognised for any modification that increases the total fair value of the share-based payment arrangement, or if otherwise beneficial to the employee, as measured at the date of modification.If an equity-settled award is cancelled, it is treated as if it had vested on the date of cancellation, and any expense not yet recognised for the award is recognised immediately. However, if a new award is substituted for the cancelled award, and designated as a replacement
award on the date that it is granted, the cancelled and new award are treated as if they were a modification of the original award, as described in the previous paragraph. The Employee share option scheme was replaced on 1 July 2013 with an Employee Share Loan Plan (ESLP). Refer to Note 29 for further details on ESLP.
The dilutive effect, if any, of outstanding options is reflected as additional share dilution in the computation of earnings per share (see note 11).
q) Contributed equity – refer note 24Ordinary shares are classified as equity. Incremental costs directly attributable to the issue of new shares or options are shown in equity as a deduction, net of tax, from the proceeds.
r) Treasury SharesOwn instruments that are reacquired (treasury shares) are recognised at cost and deducted are recognised at cost and deducted from equity. No gain or loss is recognised in the income statement on the purchase, sale, issue or cancellation of the Group’s own equity instruments. Voting rights related to treasury shares are nullified for the Group and no dividends are allocated to them.
s) Revenue recognitionRevenue is recognised and measured at the fair value of the consideration received or receivable to the extent it is probable that the economic benefits will flow to the Group and the revenue can be reliably measured. The following specific recognition criteria must also be met before revenue is recognised:
i) Sale of goodsRevenue from the sale of goods is recognised when there is persuasive evidence, usually in the form of an executed sales agreement at the time of delivery of the goods to customer, indicating that there has been a transfer of risks and rewards to the customer, no further work or processing is required, the quantity and quality of the goods has been determined, the price is fixed and generally title has passed (for shipped goods this is the bill of lading date).
ii) Licence feesRevenue from licence fees is recognised when there is persuasive evidence, usually in the form of a licence agreement at the time of delivery of the goods to customer, indicating that there has been a transfer of risks and rewards to the customer. Licences granted to customers are perpetual licences for use of intellectual property (usually in the form of software) with no further work or processing required by the Group.
iii) Rendering of servicesRevenue from the support and consultancy is recognised by reference to the stage of completion of a contract or contracts in progress at reporting date or at the time of completion of the contract and billing to the customer.
Stage of completion is measured by reference to labour hours incurred to date as a percentage of total estimated labour hours for each contract which is determined by a set quotation with the customer. As the contracts are reasonably short, there is only a small amount outstanding at reporting date, as such the level of judgement required is minimal. When the contract outcome cannot be estimated reliably, revenue is recognised only to the extent of the expenses recognised that are recoverable.

55NOTES TO THE FINANCIAL STATEMENTS2014 ANNUAL REPORT
iv) Interest revenueRevenue is recognised as interest accrues using the effective interest method. This is a method of calculating the amortised cost of a financial asset and allocating the interest income over the relevant period using the effective interest rate, which is the rate that exactly discounts estimated future cash receipts through the expected life of the financial asset to the net carrying amount of the financial asset.
v) Research and development refundable tax offsetRefundable tax offset received under the government’s research and development scheme is recognised as revenue on receipt to the extent those costs have been expensed in the financial year. Refundable tax offset related to research and development costs capitalised in the financial year is deferred and recognised in the relevant year, per the matching principle, proportionate to the amortisation of these costs.
t) Income taxes and other taxes – refer note 9Current tax assets and liabilities for the current and prior periods are measured at the amount expected to be recovered from or paid to the taxation authorities based on the current period’s taxable income. The tax rates and tax laws used to compute the amount are those that are enacted or substantively enacted by the reporting date.
Deferred income tax is provided on all temporary differences at the reporting date between the tax bases of assets and liabilities and their carrying amounts for financial reporting purposes.
Deferred income tax liabilities are recognised for all taxable temporary differences except:
• when the deferred income tax liability arises from the initial recognition of goodwill or of an asset or liability in a transaction that is not a business combination and that, at the time of the transaction, affects neither the accounting profit nor taxable profit or loss; or
• when the taxable temporary difference is associated with investments in subsidiaries, and the timing of the reversal of the temporary difference can be controlled and it is probable that the temporary difference will not reverse in the foreseeable future.
Deferred income tax assets are recognised for all deductible temporary differences, carry-forward of unused tax credits and unused tax losses, to the extent that it is probable that taxable profit will be available against which the deductible temporary differences and the carry-forward of unused tax credits and unused tax losses can be utilised, except:
• when the deferred income tax asset relating to the deductible temporary difference arises from the initial recognition of an asset or liability in a transaction that is not a business combination and, at the time of the transaction, affects neither the accounting profit nor taxable profit or loss.
• when the deductible temporary difference is associated with investments in subsidiaries, in which case a deferred tax asset is only recognised to the extent that it is probable that the temporary difference will reverse in the foreseeable future and taxable profit will be available against which the temporary difference can be utilised.
The carrying amount of deferred income tax assets is reviewed at each reporting date and reduced to the extent that it is no longer
probable that sufficient taxable profit will be available to allow all or part of the deferred income tax asset to be utilised.
Unrecognised deferred income tax assets are reassessed at each reporting date and are recognised to the extent that it has become probable that future taxable profit will allow the deferred tax asset to be recovered.
Deferred income tax assets and liabilities are measured at the tax rates that are expected to apply to the year when the asset is realised or the liability is settled, based on tax rates (and tax laws) that have been enacted or substantively enacted at the reporting date.
Deferred tax assets and deferred tax liabilities are offset only if a legally enforceable right exists to set off current tax assets against current tax liabilities and the deferred tax assets and liabilities relate to the same taxable entity and the same taxation authority.
Other taxesRevenues, expenses and assets are recognised net of the amount of GST except:
• when the GST incurred on a purchase of goods and services is not recoverable from the taxation authority, in which case the GST is recognised as part of the cost of acquisition of the asset or as part of the expense item as applicable; and
• receivables and payables, which are stated with the amount of GST included.
The net amount of GST recoverable from, or payable to, the taxation authority is included as part of receivables or payables in the statement of financial position.
Cash flows are included in the Cash Flow Statement on a gross basis and the GST component of cash flows arising from investing and financing activities, which is recoverable from, or payable to, the taxation authority is classified as part of operating cash flows.
Commitments and contingencies are disclosed net of the amount of GST recoverable from, or payable to, the taxation authority.
u) Government grantsGovernment grants are recognised in the statement of financial position as a liability when the grant is received.
When the grant relates to an expense item, it is recognised as income over the periods necessary to match the grant on a systematic basis to the costs that it is intended to compensate. They are not credited directly to shareholders’ equity.
When the grant relates to an asset (development expenditure), the fair value is credited to deferred income and is released to the statement of comprehensive income over the expected useful life of the relevant asset by equal annual instalments.
v) Earnings per share – refer note 11Basic earnings per share is calculated as net profit attributable to members of the parent, adjusted to exclude any costs of servicing equity (other than dividends) and preference share dividends, divided by the weighted average number of ordinary shares, adjusted for any bonus element.
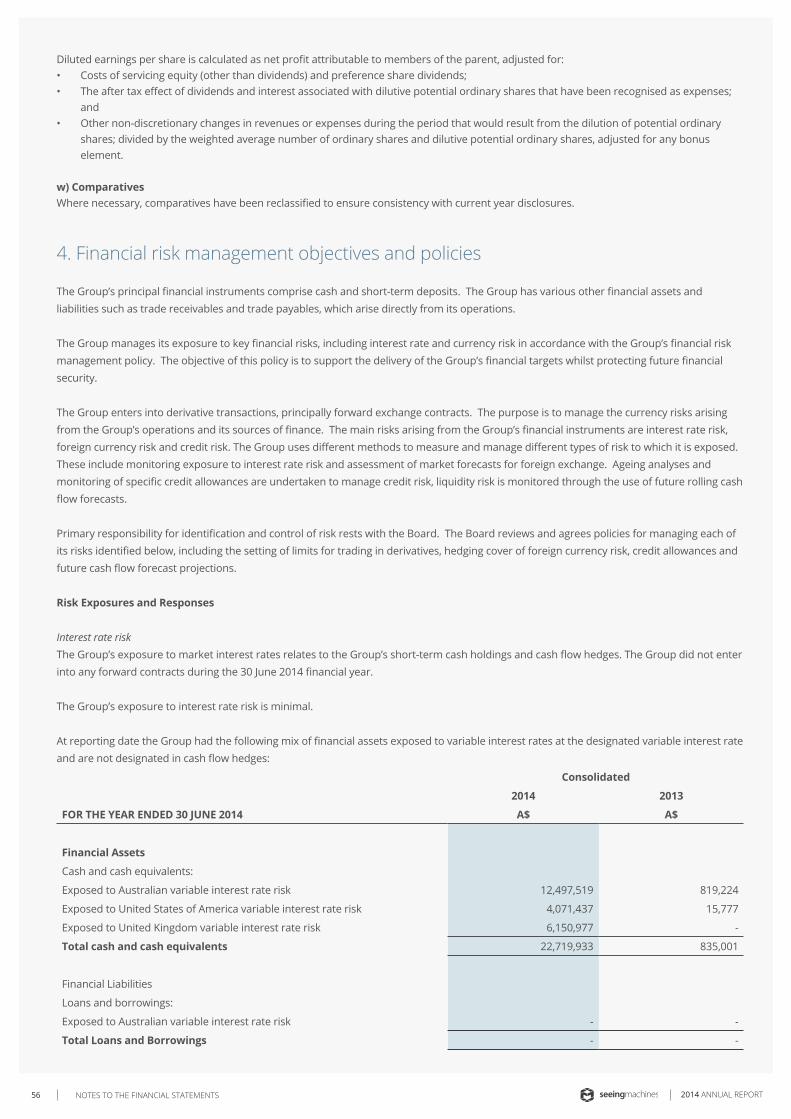
NOTES TO THE FINANCIAL STATEMENTS56 2014 ANNUAL REPORT
Diluted earnings per share is calculated as net profit attributable to members of the parent, adjusted for:• Costs of servicing equity (other than dividends) and preference share dividends;• The after tax effect of dividends and interest associated with dilutive potential ordinary shares that have been recognised as expenses;
and• Other non-discretionary changes in revenues or expenses during the period that would result from the dilution of potential ordinary
shares; divided by the weighted average number of ordinary shares and dilutive potential ordinary shares, adjusted for any bonus element.
w) ComparativesWhere necessary, comparatives have been reclassified to ensure consistency with current year disclosures.
The Group’s principal financial instruments comprise cash and short-term deposits. The Group has various other financial assets and liabilities such as trade receivables and trade payables, which arise directly from its operations.
The Group manages its exposure to key financial risks, including interest rate and currency risk in accordance with the Group’s financial risk management policy. The objective of this policy is to support the delivery of the Group’s financial targets whilst protecting future financial security.
The Group enters into derivative transactions, principally forward exchange contracts. The purpose is to manage the currency risks arising from the Group’s operations and its sources of finance. The main risks arising from the Group’s financial instruments are interest rate risk, foreign currency risk and credit risk. The Group uses different methods to measure and manage different types of risk to which it is exposed. These include monitoring exposure to interest rate risk and assessment of market forecasts for foreign exchange. Ageing analyses and monitoring of specific credit allowances are undertaken to manage credit risk, liquidity risk is monitored through the use of future rolling cash flow forecasts.
Primary responsibility for identification and control of risk rests with the Board. The Board reviews and agrees policies for managing each of its risks identified below, including the setting of limits for trading in derivatives, hedging cover of foreign currency risk, credit allowances and future cash flow forecast projections.
Risk Exposures and Responses
Interest rate riskThe Group’s exposure to market interest rates relates to the Group’s short-term cash holdings and cash flow hedges. The Group did not enter into any forward contracts during the 30 June 2014 financial year.
The Group’s exposure to interest rate risk is minimal.
At reporting date the Group had the following mix of financial assets exposed to variable interest rates at the designated variable interest rate and are not designated in cash flow hedges:
Consolidated
2014 2013
FOR THE YEAR ENDED 30 JUNE 2014 A$ A$
Financial Assets
Cash and cash equivalents:
Exposed to Australian variable interest rate risk 12,497,519 819,224
Exposed to United States of America variable interest rate risk 4,071,437 15,777
Exposed to United Kingdom variable interest rate risk 6,150,977 -
Total cash and cash equivalents 22,719,933 835,001
Financial Liabilities
Loans and borrowings:
Exposed to Australian variable interest rate risk - -
Total Loans and Borrowings - -
4. Financial risk management objectives and policies
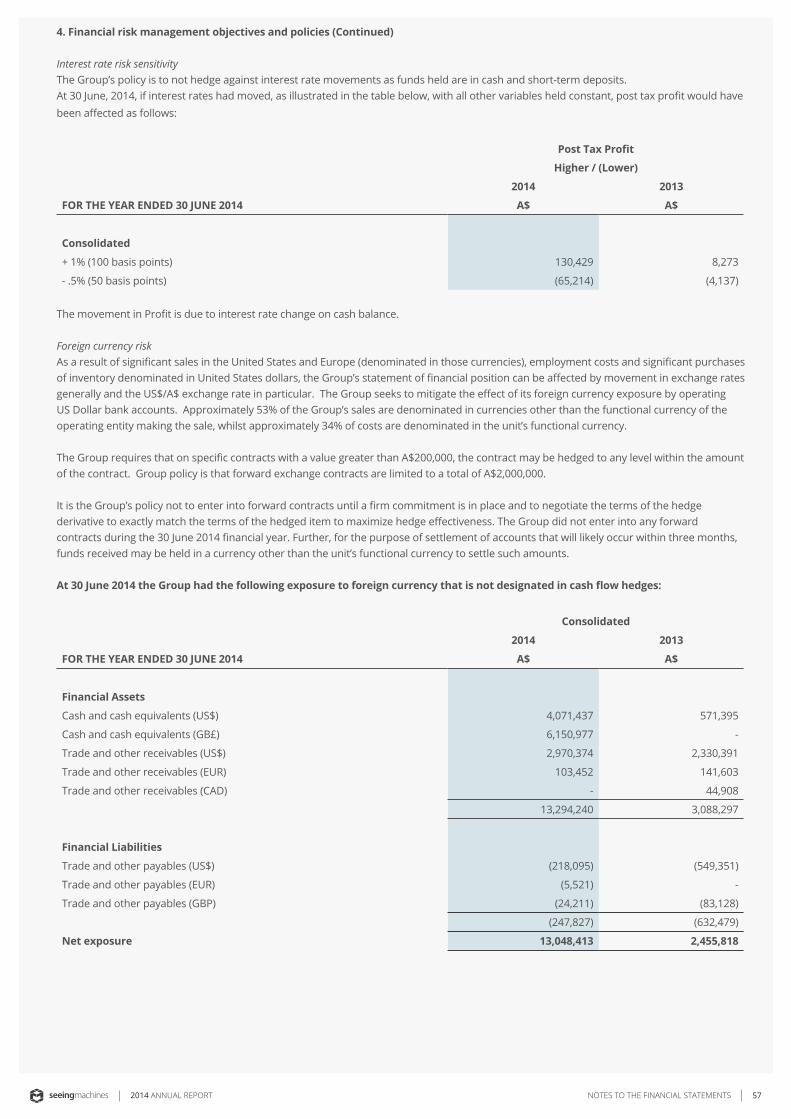
57NOTES TO THE FINANCIAL STATEMENTS2014 ANNUAL REPORT
4. Financial risk management objectives and policies (Continued)
Interest rate risk sensitivityThe Group’s policy is to not hedge against interest rate movements as funds held are in cash and short-term deposits.At 30 June, 2014, if interest rates had moved, as illustrated in the table below, with all other variables held constant, post tax profit would have been affected as follows:
Post Tax Profit
Higher / (Lower)
2014 2013
FOR THE YEAR ENDED 30 JUNE 2014 A$ A$
Consolidated
+ 1% (100 basis points) 130,429 8,273
- .5% (50 basis points) (65,214) (4,137)
The movement in Profit is due to interest rate change on cash balance.
Foreign currency riskAs a result of significant sales in the United States and Europe (denominated in those currencies), employment costs and significant purchases of inventory denominated in United States dollars, the Group’s statement of financial position can be affected by movement in exchange rates generally and the US$/A$ exchange rate in particular. The Group seeks to mitigate the effect of its foreign currency exposure by operating US Dollar bank accounts. Approximately 53% of the Group’s sales are denominated in currencies other than the functional currency of the operating entity making the sale, whilst approximately 34% of costs are denominated in the unit’s functional currency.
The Group requires that on specific contracts with a value greater than A$200,000, the contract may be hedged to any level within the amount of the contract. Group policy is that forward exchange contracts are limited to a total of A$2,000,000.
It is the Group’s policy not to enter into forward contracts until a firm commitment is in place and to negotiate the terms of the hedge derivative to exactly match the terms of the hedged item to maximize hedge effectiveness. The Group did not enter into any forward contracts during the 30 June 2014 financial year. Further, for the purpose of settlement of accounts that will likely occur within three months, funds received may be held in a currency other than the unit’s functional currency to settle such amounts.
At 30 June 2014 the Group had the following exposure to foreign currency that is not designated in cash flow hedges:
Consolidated
2014 2013
FOR THE YEAR ENDED 30 JUNE 2014 A$ A$
Financial Assets
Cash and cash equivalents (US$) 4,071,437 571,395
Cash and cash equivalents (GB£) 6,150,977 -
Trade and other receivables (US$) 2,970,374 2,330,391
Trade and other receivables (EUR) 103,452 141,603
Trade and other receivables (CAD) - 44,908
13,294,240 3,088,297
Financial Liabilities
Trade and other payables (US$) (218,095) (549,351)
Trade and other payables (EUR) (5,521) -
Trade and other payables (GBP) (24,211) (83,128)
(247,827) (632,479)
Net exposure 13,048,413 2,455,818
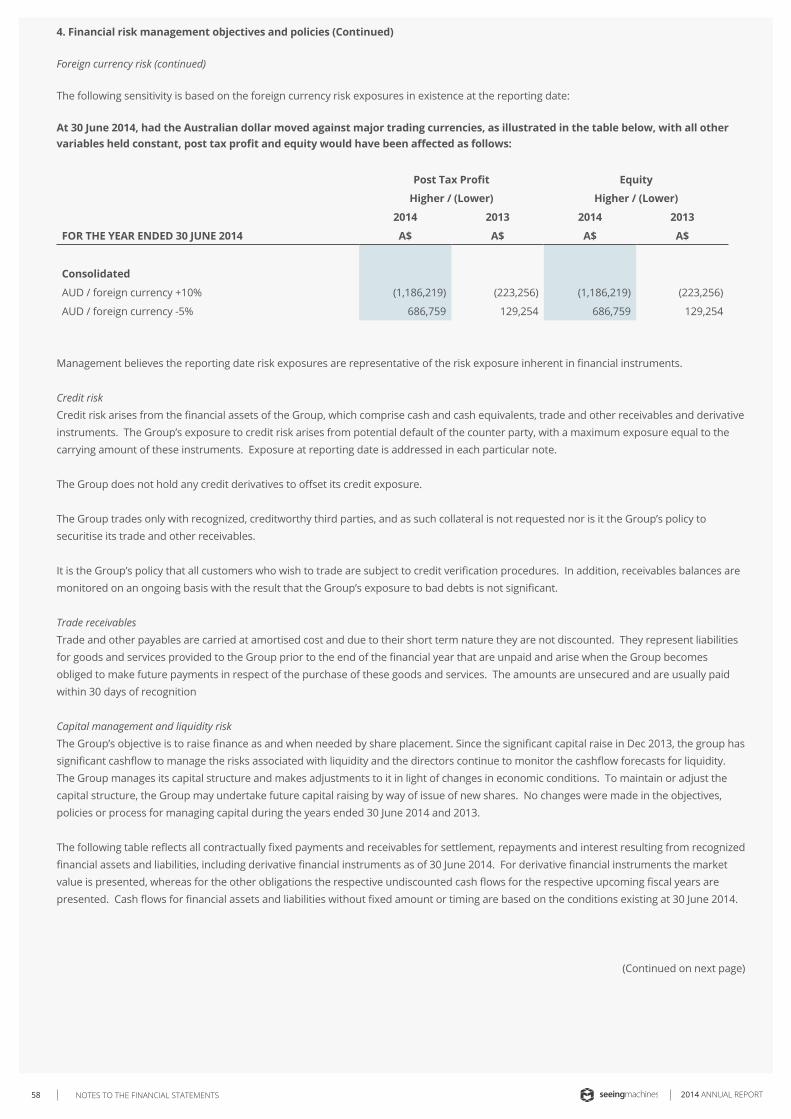
NOTES TO THE FINANCIAL STATEMENTS58 2014 ANNUAL REPORT
4. Financial risk management objectives and policies (Continued)
Foreign currency risk (continued)
The following sensitivity is based on the foreign currency risk exposures in existence at the reporting date:
At 30 June 2014, had the Australian dollar moved against major trading currencies, as illustrated in the table below, with all other variables held constant, post tax profit and equity would have been affected as follows:
Post Tax Profit
Higher / (Lower)
Equity
Higher / (Lower)
2014 2013 2014 2013
FOR THE YEAR ENDED 30 JUNE 2014 A$ A$ A$ A$
Consolidated
AUD / foreign currency +10% (1,186,219) (223,256) (1,186,219) (223,256)
AUD / foreign currency -5% 686,759 129,254 686,759 129,254
Management believes the reporting date risk exposures are representative of the risk exposure inherent in financial instruments.
Credit riskCredit risk arises from the financial assets of the Group, which comprise cash and cash equivalents, trade and other receivables and derivative instruments. The Group’s exposure to credit risk arises from potential default of the counter party, with a maximum exposure equal to the carrying amount of these instruments. Exposure at reporting date is addressed in each particular note.
The Group does not hold any credit derivatives to offset its credit exposure.
The Group trades only with recognized, creditworthy third parties, and as such collateral is not requested nor is it the Group’s policy to securitise its trade and other receivables.
It is the Group’s policy that all customers who wish to trade are subject to credit verification procedures. In addition, receivables balances are monitored on an ongoing basis with the result that the Group’s exposure to bad debts is not significant.
Trade receivablesTrade and other payables are carried at amortised cost and due to their short term nature they are not discounted. They represent liabilities for goods and services provided to the Group prior to the end of the financial year that are unpaid and arise when the Group becomes obliged to make future payments in respect of the purchase of these goods and services. The amounts are unsecured and are usually paid within 30 days of recognition
Capital management and liquidity riskThe Group’s objective is to raise finance as and when needed by share placement. Since the significant capital raise in Dec 2013, the group has significant cashflow to manage the risks associated with liquidity and the directors continue to monitor the cashflow forecasts for liquidity.The Group manages its capital structure and makes adjustments to it in light of changes in economic conditions. To maintain or adjust the capital structure, the Group may undertake future capital raising by way of issue of new shares. No changes were made in the objectives, policies or process for managing capital during the years ended 30 June 2014 and 2013.
The following table reflects all contractually fixed payments and receivables for settlement, repayments and interest resulting from recognized financial assets and liabilities, including derivative financial instruments as of 30 June 2014. For derivative financial instruments the market value is presented, whereas for the other obligations the respective undiscounted cash flows for the respective upcoming fiscal years are presented. Cash flows for financial assets and liabilities without fixed amount or timing are based on the conditions existing at 30 June 2014.
(Continued on next page)
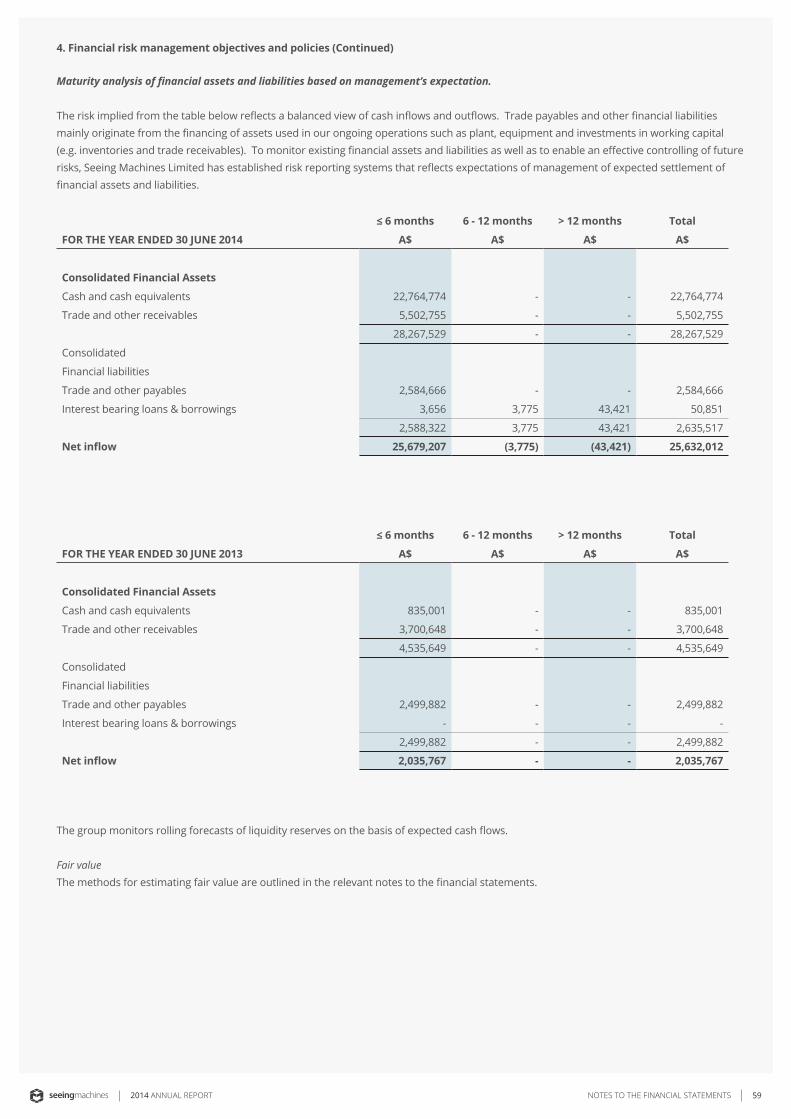
59NOTES TO THE FINANCIAL STATEMENTS2014 ANNUAL REPORT
4. Financial risk management objectives and policies (Continued)
Maturity analysis of financial assets and liabilities based on management’s expectation.
The risk implied from the table below reflects a balanced view of cash inflows and outflows. Trade payables and other financial liabilities mainly originate from the financing of assets used in our ongoing operations such as plant, equipment and investments in working capital (e.g. inventories and trade receivables). To monitor existing financial assets and liabilities as well as to enable an effective controlling of future risks, Seeing Machines Limited has established risk reporting systems that reflects expectations of management of expected settlement of financial assets and liabilities.
≤ 6 months 6 - 12 months > 12 months Total
FOR THE YEAR ENDED 30 JUNE 2014 A$ A$ A$ A$
Consolidated Financial Assets
Cash and cash equivalents 22,764,774 - - 22,764,774
Trade and other receivables 5,502,755 - - 5,502,755
28,267,529 - - 28,267,529
Consolidated
Financial liabilities
Trade and other payables 2,584,666 - - 2,584,666
Interest bearing loans & borrowings 3,656 3,775 43,421 50,851
2,588,322 3,775 43,421 2,635,517
Net inflow 25,679,207 (3,775) (43,421) 25,632,012
≤ 6 months 6 - 12 months > 12 months Total
FOR THE YEAR ENDED 30 JUNE 2013 A$ A$ A$ A$
Consolidated Financial Assets
Cash and cash equivalents 835,001 - - 835,001
Trade and other receivables 3,700,648 - - 3,700,648
4,535,649 - - 4,535,649
Consolidated
Financial liabilities
Trade and other payables 2,499,882 - - 2,499,882
Interest bearing loans & borrowings - - - -
2,499,882 - - 2,499,882
Net inflow 2,035,767 - - 2,035,767
The group monitors rolling forecasts of liquidity reserves on the basis of expected cash flows.
Fair valueThe methods for estimating fair value are outlined in the relevant notes to the financial statements.

NOTES TO THE FINANCIAL STATEMENTS60 2014 ANNUAL REPORT
5. Significant Accounting Judgements, Estimates, and Assumptions
The preparation of the financial statements requires management to make judgements, estimates and assumptions that affect the reported amounts in the financial statements. Management continually evaluates its judgements and estimates in relation to assets, liabilities, contingent liabilities, revenue and expenses. Management bases its judgements and estimates on historical experience and on other various factors it believes to be reasonable under the circumstances, the result of which form the basis of the carrying values of assets and liabilities that are not readily apparent from other sources. Actual results may differ from these estimates under different assumptions and conditions.
Management has identified the following critical accounting policies for which significant judgements, estimates and assumptions are made. Actual results may differ from these estimates under different assumptions and conditions and may materially affect financial results or the financial position reported in future periods.
Further details of the nature of these assumptions and conditions may be found in the relevant notes to the financial statements.
a) Significant accounting judgments
Capitalised development costsResearch costs are expensed as incurred. An intangible asset arising from development expenditure on an internal project is recognised only when the Group can demonstrate the technical feasibility of completing the intangible asset so that it will be available for use or sale, its intention to complete and its ability to use or sell the asset, how the asset will generate future economic benefits, the availability of resources to complete the development and the ability to measure reliably the expenditure attributable to the intangible asset during its development.
TaxationThe Group’s accounting policy for taxation requires management’s judgement as to the types of arrangements considered to be a tax on income in contrast to an operating cost. Judgement is also required in assessing whether deferred tax assets and certain deferred tax liabilities are recognised on the statement of financial position. Deferred tax assets, including those arising from unrecouped tax losses, capital losses and temporary differences, are recognised only where it is considered more likely than not that they will be recovered, which is dependent on the generation of sufficient future taxable profits.
Assumptions about the generation of future taxable profits and repatriation of retained earnings depend on management’s estimates of future cash flows. These depend on estimates of future production and sales volumes, operating costs, restoration costs, capital expenditure, dividends and other capital management transactions. Judgements are also required about the application of income tax legislation. These judgements and assumptions are subject to risk and uncertainty, hence there is a possibility that changes in circumstances will alter expectations, which may impact the amount of deferred tax assets and deferred tax liabilities recognised on the statement of financial position and the amount of other
tax losses and temporary differences not yet recognised. In such circumstances, some or all of the carrying amounts of recognised deferred tax assets and liabilities may require adjustment, resulting in a corresponding credit or charge to the statement of comprehensive income.
b) Significant accounting estimates and assumptions
Impairment of non-financial assetsThe Group assesses impairment of all assets at each reporting date by evaluating conditions specific to the Group and to the particular asset that may lead to impairment. These include product and manufacturing performance, technology, economic and political environments and future product expectations. If an impairment trigger exists the recoverable amount of the asset is determined (higher of fair value less cost of disposal and its value in use.).
Impairment of intangible assets and capitalised development costsThe Group determines whether intangible assets and capitalised development costs are impaired at least on an annual basis. This requires an estimation of the recoverable amount of the cash-generating units, using a value in use discounted cash flow methodology, to which the intangibles with indefinite useful lives are allocated.
Share-based payment transactionsThe Group measures the cost of equity-settled transactions with employees by reference to the fair value of the equity instruments at the date at which they are granted. The fair value is determined using the Hull White method using a trinomial model, with the assumptions detailed in note 29. The accounting estimates and assumptions relating to equity-settled share-based payments would have no impact on the carrying amounts of assets and liabilities within the next annual reporting period but may impact expenses and equity.
Estimation of useful lives of assetsThe estimation of the useful lives of assets has been based on historical experience as well as manufacturers’ warranties (for plant and equipment). In addition, the condition of the assets is assessed at least once per year and considered against the remaining useful life. Adjustments to useful lives are made when considered necessary.
6. Segment Information
The Group has identified its operating segments based on the internal reports that are reviewed and used by the executive management team (the chief operating decision makers) is assessing performance and determining the allocation of resources.
The operating segments are identified by management based on the country of origin. The Group operates in two geographical segments, Australia and United States of America.
Transfer prices between geographical segments are set on an arm’s length basis in a manner similar to transactions with third parties. Segment revenue, segment expense and segment result include transfers between business segments. Those transfers are eliminated on consolidation.
(Continues on next page)
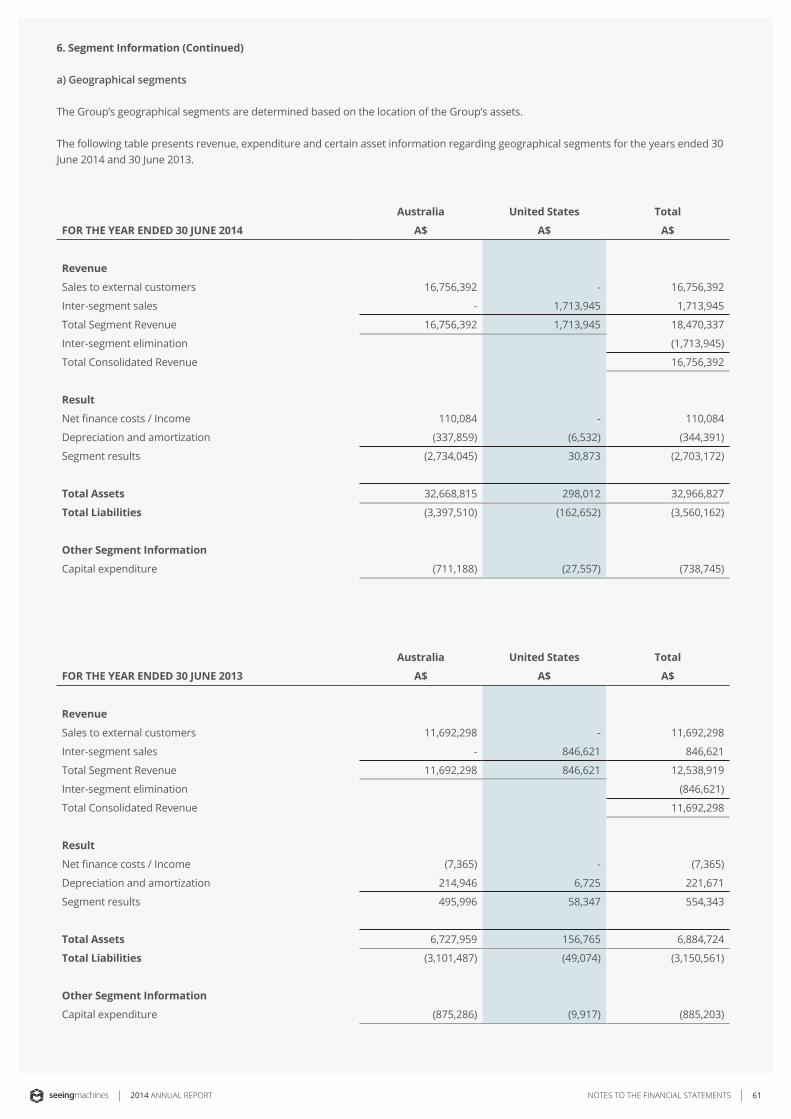
61NOTES TO THE FINANCIAL STATEMENTS2014 ANNUAL REPORT
6. Segment Information (Continued)
a) Geographical segments
The Group’s geographical segments are determined based on the location of the Group’s assets.
The following table presents revenue, expenditure and certain asset information regarding geographical segments for the years ended 30 June 2014 and 30 June 2013.
Australia United States Total
FOR THE YEAR ENDED 30 JUNE 2014 A$ A$ A$
Revenue
Sales to external customers 16,756,392 - 16,756,392
Inter-segment sales - 1,713,945 1,713,945
Total Segment Revenue 16,756,392 1,713,945 18,470,337
Inter-segment elimination (1,713,945)
Total Consolidated Revenue 16,756,392
Result
Net finance costs / Income 110,084 - 110,084
Depreciation and amortization (337,859) (6,532) (344,391)
Segment results (2,734,045) 30,873 (2,703,172)
Total Assets 32,668,815 298,012 32,966,827
Total Liabilities (3,397,510) (162,652) (3,560,162)
Other Segment Information
Capital expenditure (711,188) (27,557) (738,745)
Australia United States Total
FOR THE YEAR ENDED 30 JUNE 2013 A$ A$ A$
Revenue
Sales to external customers 11,692,298 - 11,692,298
Inter-segment sales - 846,621 846,621
Total Segment Revenue 11,692,298 846,621 12,538,919
Inter-segment elimination (846,621)
Total Consolidated Revenue 11,692,298
Result
Net finance costs / Income (7,365) - (7,365)
Depreciation and amortization 214,946 6,725 221,671
Segment results 495,996 58,347 554,343
Total Assets 6,727,959 156,765 6,884,724
Total Liabilities (3,101,487) (49,074) (3,150,561)
Other Segment Information
Capital expenditure (875,286) (9,917) (885,203)
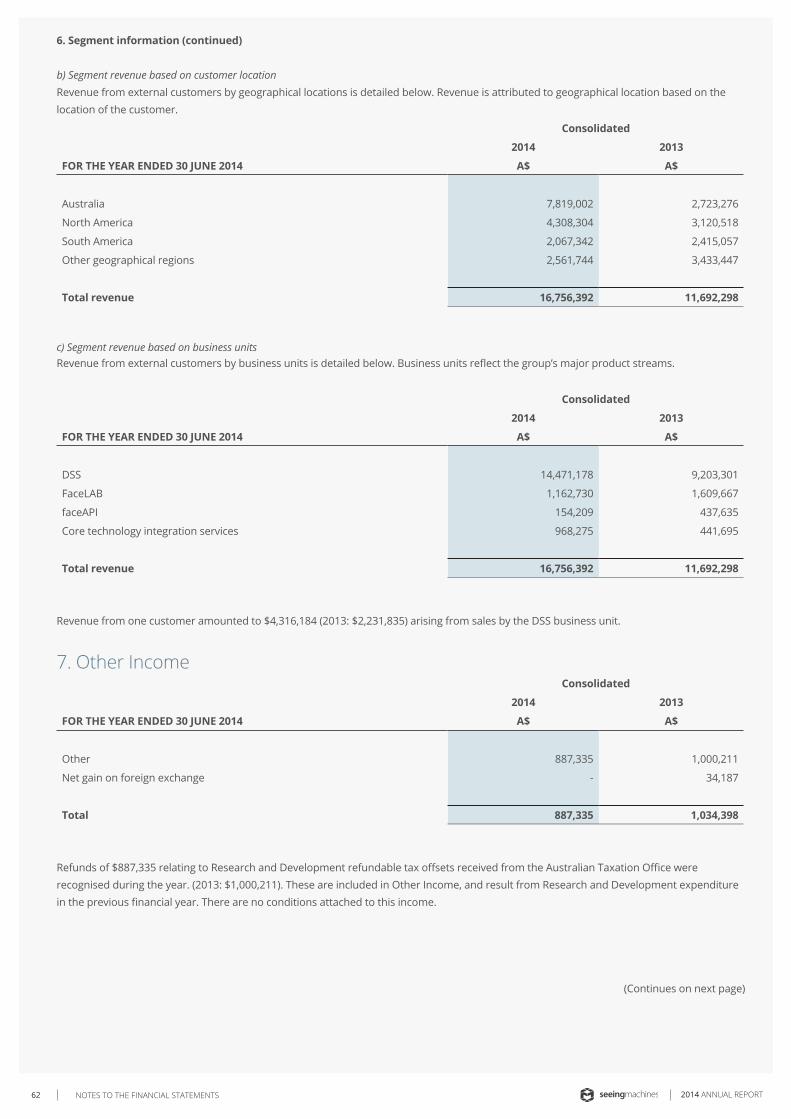
NOTES TO THE FINANCIAL STATEMENTS62 2014 ANNUAL REPORT
6. Segment information (continued)
b) Segment revenue based on customer locationRevenue from external customers by geographical locations is detailed below. Revenue is attributed to geographical location based on the location of the customer.
Consolidated
2014 2013
FOR THE YEAR ENDED 30 JUNE 2014 A$ A$
Australia 7,819,002 2,723,276
North America 4,308,304 3,120,518
South America 2,067,342 2,415,057
Other geographical regions 2,561,744 3,433,447
Total revenue 16,756,392 11,692,298
c) Segment revenue based on business unitsRevenue from external customers by business units is detailed below. Business units reflect the group’s major product streams.
Consolidated
2014 2013
FOR THE YEAR ENDED 30 JUNE 2014 A$ A$
DSS 14,471,178 9,203,301
FaceLAB 1,162,730 1,609,667
faceAPI 154,209 437,635
Core technology integration services 968,275 441,695
Total revenue 16,756,392 11,692,298
Revenue from one customer amounted to $4,316,184 (2013: $2,231,835) arising from sales by the DSS business unit.
7. Other IncomeConsolidated
2014 2013
FOR THE YEAR ENDED 30 JUNE 2014 A$ A$
Other 887,335 1,000,211
Net gain on foreign exchange - 34,187
Total 887,335 1,034,398
Refunds of $887,335 relating to Research and Development refundable tax offsets received from the Australian Taxation Office were recognised during the year. (2013: $1,000,211). These are included in Other Income, and result from Research and Development expenditure in the previous financial year. There are no conditions attached to this income.
(Continues on next page)
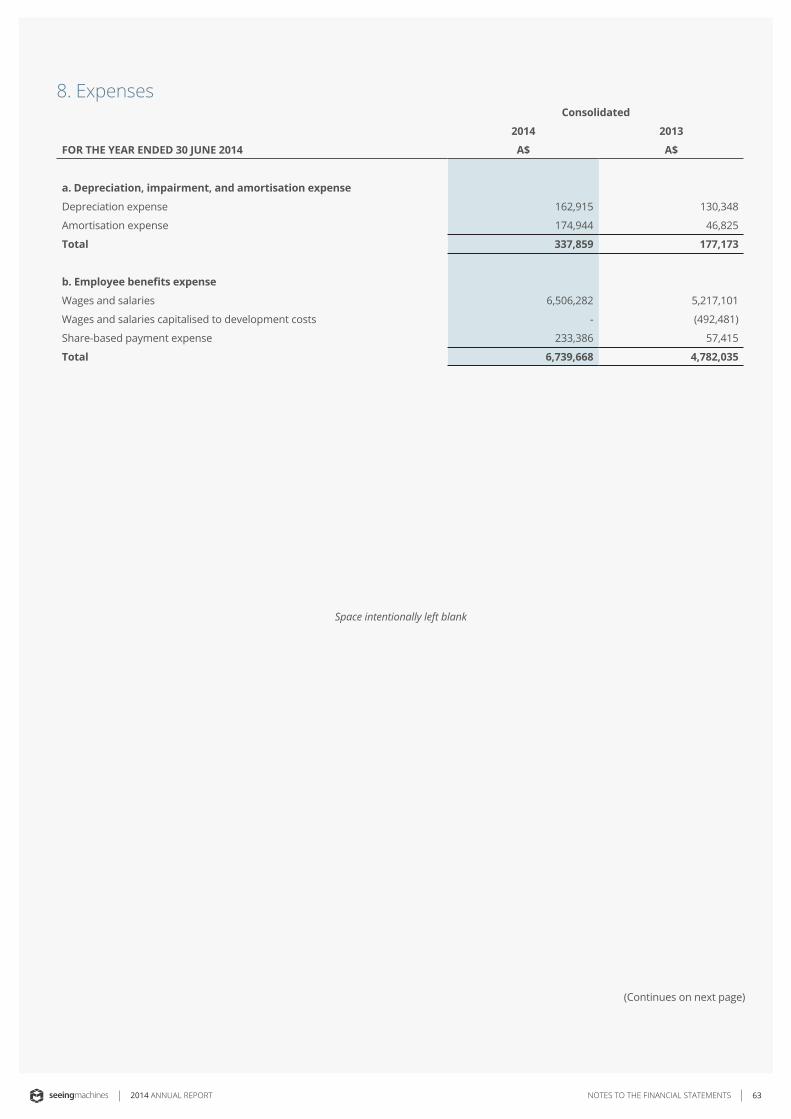
63NOTES TO THE FINANCIAL STATEMENTS2014 ANNUAL REPORT
8. ExpensesConsolidated
2014 2013
FOR THE YEAR ENDED 30 JUNE 2014 A$ A$
a. Depreciation, impairment, and amortisation expense
Depreciation expense 162,915 130,348
Amortisation expense 174,944 46,825
Total 337,859 177,173
b. Employee benefits expense
Wages and salaries 6,506,282 5,217,101
Wages and salaries capitalised to development costs - (492,481)
Share-based payment expense 233,386 57,415
Total 6,739,668 4,782,035
Space intentionally left blank
(Continues on next page)

NOTES TO THE FINANCIAL STATEMENTS64 2014 ANNUAL REPORT
9. Income TaxConsolidated
2014 2013
FOR THE YEAR ENDED 30 JUNE 2014 A$ A$
a) Income tax expense
The major components of income tax expense are:
Current income tax
Current income tax charge 374,217 475,434
Adjustments in respect of current income tax of previous years - 27,009
Taxation loss not recognized - (27,009)
Tax loss utilized – not previously recognised (374,217) (475,434)
Deferred income tax
Relating to the origination and reversal of timing differences (226,358) (172,254)
Temporary differences not recognised 226,358 172,254
Total - -
b) Numerical reconciliation between aggregate tax expense recognised
in the statement of comprehensive income calculated per the statutory
income tax rate
A reconciliation between tax expense and the product of the accounting profit before income tax multiplied by the Group’s applicable income tax rate is as follows:
Total accounting profit / (loss) before income tax (2,703,172) 554,343
At the parents entity's statutory income tax rate of 30% (2013: 30%) (810,952) 166,303
Non-assessable R&D Refundable Tax Credits
Research and development – 2014 Total R&D Costs Claimed 1,678,217 816,593
Research and development – 2013 R&D tax credit (not assessable) (313,527) (300,330)
Research and development – “R&D Income” (209,861) (119,866)
Capitalised R&D costs (104,647) (174,320)
Capitalised Patent costs (29,620) -
Entertainment 2,540 -
Share based payments (equity settled) 70,016 17,225
Legal Fees 22,591 20,645
Temporary differences recognised (156,898) (61,540)
Temporary differences not recognised 226,358 110,724
Adjustments in respect of current income tax of previous years - 27,009
Taxation loss not recognised - (27,009)
Taxation loss utilised – not previously recognised (374,217) (475,434)
Total - -
c) Deferred income tax at 30 June relates to the following:
i) Deferred tax liabilities
Interest receivable - (209)
Accelerated depreciation: plant and equipment - (20,462)
Intangible assets (386,597) (130,487)
Gross deferred tax liabilities (386,597) (181,765)
Set-off deferred tax assets 386,597 181,765
Net deferred tax liabilities - -
(Continues on next page)

65NOTES TO THE FINANCIAL STATEMENTS2014 ANNUAL REPORT
9. Income Tax (continued)
Consolidated
2014 2013
FOR THE YEAR ENDED 30 JUNE 2014 A$ A$
(ii) Deferred tax assets
Provision for Doubtful Debts 83,071 61,281
Accrued expenses 63,652 202,619
Provisions:
Annual Leave 173,533 126,625
Long Service Leave 75,365 68,579
Provision for warranties 28,496 -
S. 40-880 Deduction 417,213 92,300
Unrealised FX 141,264 (30,607)
Gross deferred tax assets 982,594 551,403
Set-off deferred tax liabilities (386,597) (181,765)
Net deferred tax balance not brought to account 595,997 369,638
Tax losses 3,046,796 3,421,013
Losses not recognized (3,046,796) (3,421,013)
Net deferred tax asset - -
d) Unrecognised temporary differences
At 30 June 2014 Seeing Machines Limited (consolidated) has unrecognised temporary differences in relation to unbooked tax losses of $10,155,988 (DTA of $3,046,796)) for which no deferred tax asset has been recognised on the statement of financial position (2013: Unrecognised tax losses of $11,403,376 and DTA of $3,421,013). These losses are available for recoupment subject to satisfaction of relevant statutory tests. As at 30 June 2014 there are unrecognised deductible temporary differences of $754,528 (DTA of $226,358) for which no deferred tax asset has been recognised on the statement of financial position (2013: unrecognised deductible temporary differences $574,180 and DTA of $172,254).
10. Dividends Paid and Proposed
No dividends or distributions have been made to members during the year ended 30 June 2014 and no dividends or distributions have been recommended or declared by the directors in respect of the year ended 30 June 2014.
11. Earnings Per Share
The following reflects the income used in the basic and diluted earnings per share computations:
a) Earnings used in calculating earnings per share
Consolidated
2014 2013
FOR THE YEAR ENDED 30 JUNE 2014 A$ A$
For basic and diluted earnings per share:
Net Profit / (Loss) (2,703,172) 554,343
Net Profit / (Loss) attributable to ordinary equity holders of the company (2,703,172) 554,343
(Continues on next page)
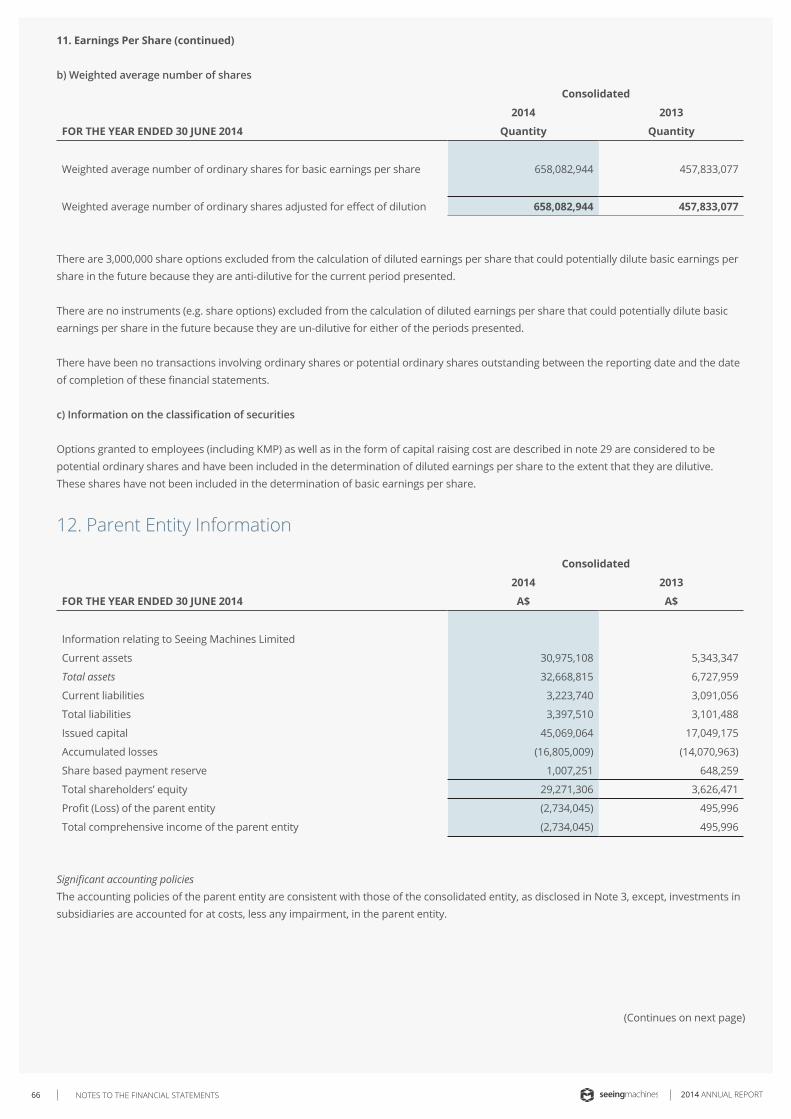
NOTES TO THE FINANCIAL STATEMENTS66 2014 ANNUAL REPORT
11. Earnings Per Share (continued)
b) Weighted average number of shares
Consolidated
2014 2013
FOR THE YEAR ENDED 30 JUNE 2014 Quantity Quantity
Weighted average number of ordinary shares for basic earnings per share 658,082,944 457,833,077
Weighted average number of ordinary shares adjusted for effect of dilution 658,082,944 457,833,077
There are 3,000,000 share options excluded from the calculation of diluted earnings per share that could potentially dilute basic earnings per share in the future because they are anti-dilutive for the current period presented.
There are no instruments (e.g. share options) excluded from the calculation of diluted earnings per share that could potentially dilute basic earnings per share in the future because they are un-dilutive for either of the periods presented.
There have been no transactions involving ordinary shares or potential ordinary shares outstanding between the reporting date and the date of completion of these financial statements.
c) Information on the classification of securities
Options granted to employees (including KMP) as well as in the form of capital raising cost are described in note 29 are considered to be potential ordinary shares and have been included in the determination of diluted earnings per share to the extent that they are dilutive. These shares have not been included in the determination of basic earnings per share.
12. Parent Entity Information
Consolidated
2014 2013
FOR THE YEAR ENDED 30 JUNE 2014 A$ A$
Information relating to Seeing Machines Limited
Current assets 30,975,108 5,343,347
Total assets 32,668,815 6,727,959
Current liabilities 3,223,740 3,091,056
Total liabilities 3,397,510 3,101,488
Issued capital 45,069,064 17,049,175
Accumulated losses (16,805,009) (14,070,963)
Share based payment reserve 1,007,251 648,259
Total shareholders’ equity 29,271,306 3,626,471
Profit (Loss) of the parent entity (2,734,045) 495,996
Total comprehensive income of the parent entity (2,734,045) 495,996
Significant accounting policiesThe accounting policies of the parent entity are consistent with those of the consolidated entity, as disclosed in Note 3, except, investments in subsidiaries are accounted for at costs, less any impairment, in the parent entity.
(Continues on next page)
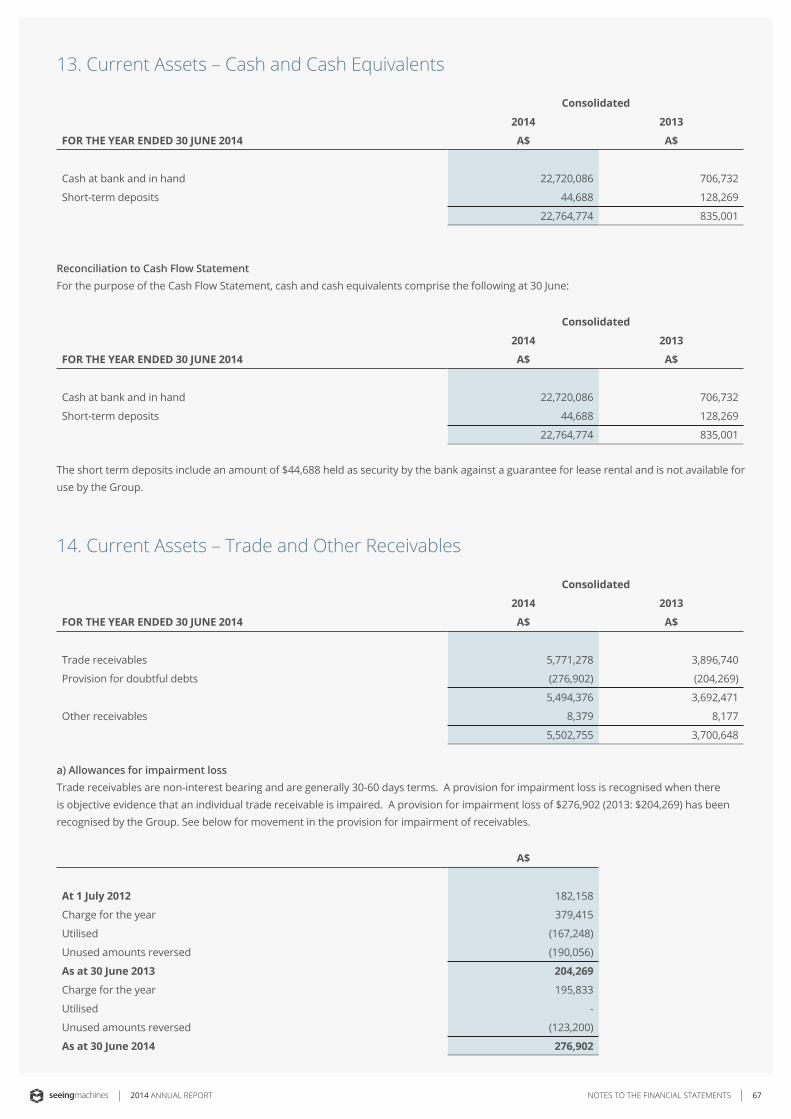
67NOTES TO THE FINANCIAL STATEMENTS2014 ANNUAL REPORT
13. Current Assets – Cash and Cash Equivalents
Consolidated
2014 2013
FOR THE YEAR ENDED 30 JUNE 2014 A$ A$
Cash at bank and in hand 22,720,086 706,732
Short-term deposits 44,688 128,269
22,764,774 835,001
Reconciliation to Cash Flow StatementFor the purpose of the Cash Flow Statement, cash and cash equivalents comprise the following at 30 June:
Consolidated
2014 2013
FOR THE YEAR ENDED 30 JUNE 2014 A$ A$
Cash at bank and in hand 22,720,086 706,732
Short-term deposits 44,688 128,269
22,764,774 835,001
The short term deposits include an amount of $44,688 held as security by the bank against a guarantee for lease rental and is not available for use by the Group.
14. Current Assets – Trade and Other Receivables
Consolidated
2014 2013
FOR THE YEAR ENDED 30 JUNE 2014 A$ A$
Trade receivables 5,771,278 3,896,740
Provision for doubtful debts (276,902) (204,269)
5,494,376 3,692,471
Other receivables 8,379 8,177
5,502,755 3,700,648
a) Allowances for impairment lossTrade receivables are non-interest bearing and are generally 30-60 days terms. A provision for impairment loss is recognised when there is objective evidence that an individual trade receivable is impaired. A provision for impairment loss of $276,902 (2013: $204,269) has been recognised by the Group. See below for movement in the provision for impairment of receivables.
A$
At 1 July 2012 182,158
Charge for the year 379,415
Utilised (167,248)
Unused amounts reversed (190,056)
As at 30 June 2013 204,269
Charge for the year 195,833
Utilised -
Unused amounts reversed (123,200)
As at 30 June 2014 276,902
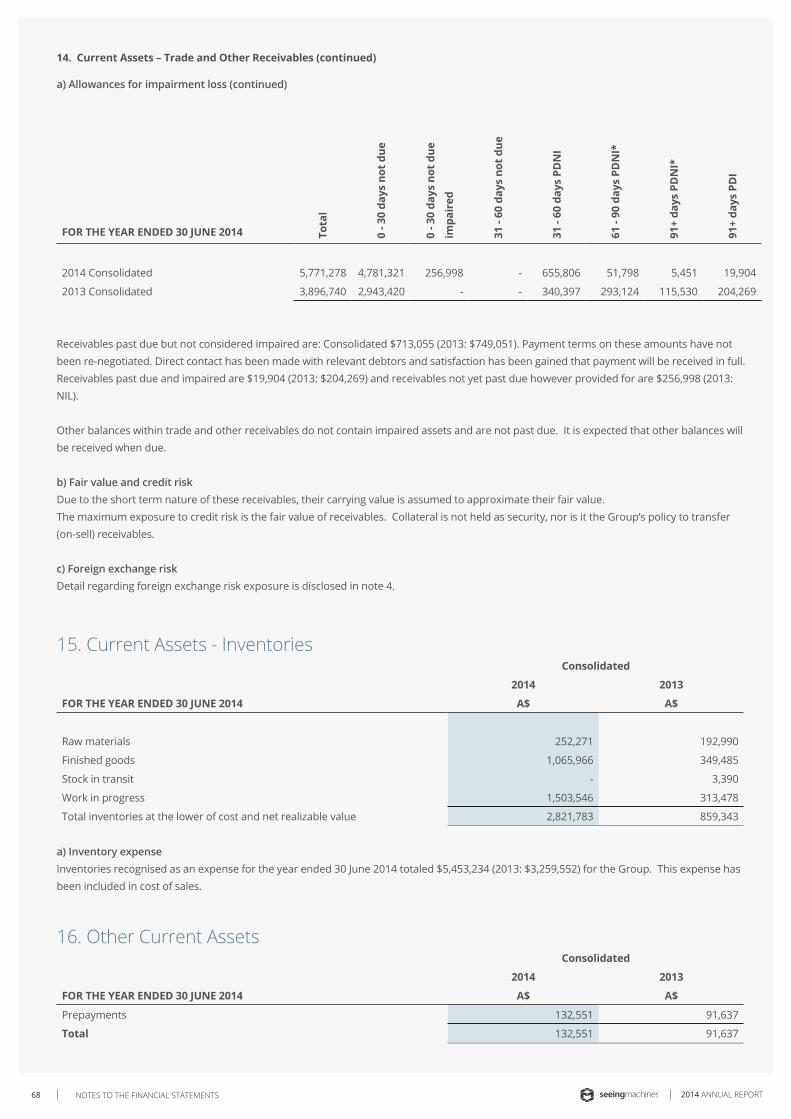
NOTES TO THE FINANCIAL STATEMENTS68 2014 ANNUAL REPORT
14. Current Assets – Trade and Other Receivables (continued)
a) Allowances for impairment loss (continued)
FOR THE YEAR ENDED 30 JUNE 2014 Tota
l
0 - 3
0 da
ys n
ot d
ue
0 - 3
0 da
ys n
ot d
ue
impa
ired
31 -
60 d
ays
not d
ue
31 -
60 d
ays
PDN
I
61 -
90 d
ays
PDN
I*
91+
days
PD
NI*
91+
days
PD
I
2014 Consolidated 5,771,278 4,781,321 256,998 - 655,806 51,798 5,451 19,904
2013 Consolidated 3,896,740 2,943,420 - - 340,397 293,124 115,530 204,269
Receivables past due but not considered impaired are: Consolidated $713,055 (2013: $749,051). Payment terms on these amounts have not been re-negotiated. Direct contact has been made with relevant debtors and satisfaction has been gained that payment will be received in full. Receivables past due and impaired are $19,904 (2013: $204,269) and receivables not yet past due however provided for are $256,998 (2013: NIL).
Other balances within trade and other receivables do not contain impaired assets and are not past due. It is expected that other balances will be received when due.
b) Fair value and credit riskDue to the short term nature of these receivables, their carrying value is assumed to approximate their fair value.The maximum exposure to credit risk is the fair value of receivables. Collateral is not held as security, nor is it the Group’s policy to transfer (on-sell) receivables.
c) Foreign exchange riskDetail regarding foreign exchange risk exposure is disclosed in note 4.
15. Current Assets - InventoriesConsolidated
2014 2013
FOR THE YEAR ENDED 30 JUNE 2014 A$ A$
Raw materials 252,271 192,990
Finished goods 1,065,966 349,485
Stock in transit - 3,390
Work in progress 1,503,546 313,478
Total inventories at the lower of cost and net realizable value 2,821,783 859,343
a) Inventory expenseInventories recognised as an expense for the year ended 30 June 2014 totaled $5,453,234 (2013: $3,259,552) for the Group. This expense has been included in cost of sales.
16. Other Current AssetsConsolidated
2014 2013
FOR THE YEAR ENDED 30 JUNE 2014 A$ A$
Prepayments 132,551 91,637
Total 132,551 91,637

69NOTES TO THE FINANCIAL STATEMENTS2014 ANNUAL REPORT
17. Non-current Assets – Property, Plant and Equipment
a) Reconciliation of carrying amounts at the beginning and end of the year
Office Furniture, Fittings & Equipment
Research & Development Software
and Equipment Total
CONSOLIDATED A$ A$ A$
At 1 July 2013 net of accumulated depreciation and
impairment
181,701 200,351 382,052
Additions 121,141 170,048 291,189
Disposals (46,115) (1,826) (47,942)
Depreciation charge for the year (67,810) (101,181) (168,991)
At 30 June 2014 net of accumulated depreciation and
impairment
188,917 267,392 456,308
At 30 June 2014
Cost 497,077 603,285 1,100,362
Accumulated depreciation and impairment (308,160) (335,893) (644,053)
Net carrying amount 188,917 267,392 456,308
Office Furniture, Fittings & Equipment
Research & Development Software
and Equipment Total
CONSOLIDATED A$ A$ A$
At 1 July 2012 net of accumulated depreciation and
impairment
Additions 224,997 31,257 256,254
Disposals 33,992 222,154 256,146
Depreciation charge for the year (77,288) (53,060) (130,348)
At 30 June 2013 net of accumulated depreciation and
impairment
181,701 200,351 382,052
At 30 June 2013
Cost 1,007,873 441,793 1,449,666
Accumulated depreciation and impairment (826,172) (241,442) (1,067,614)
Net carrying amount 181,701 200,351 382,052
Property, plant and equipment still in use that has been fully depreciated at 30 June 2014 has a cost of $160,306 (2013: $161,721).
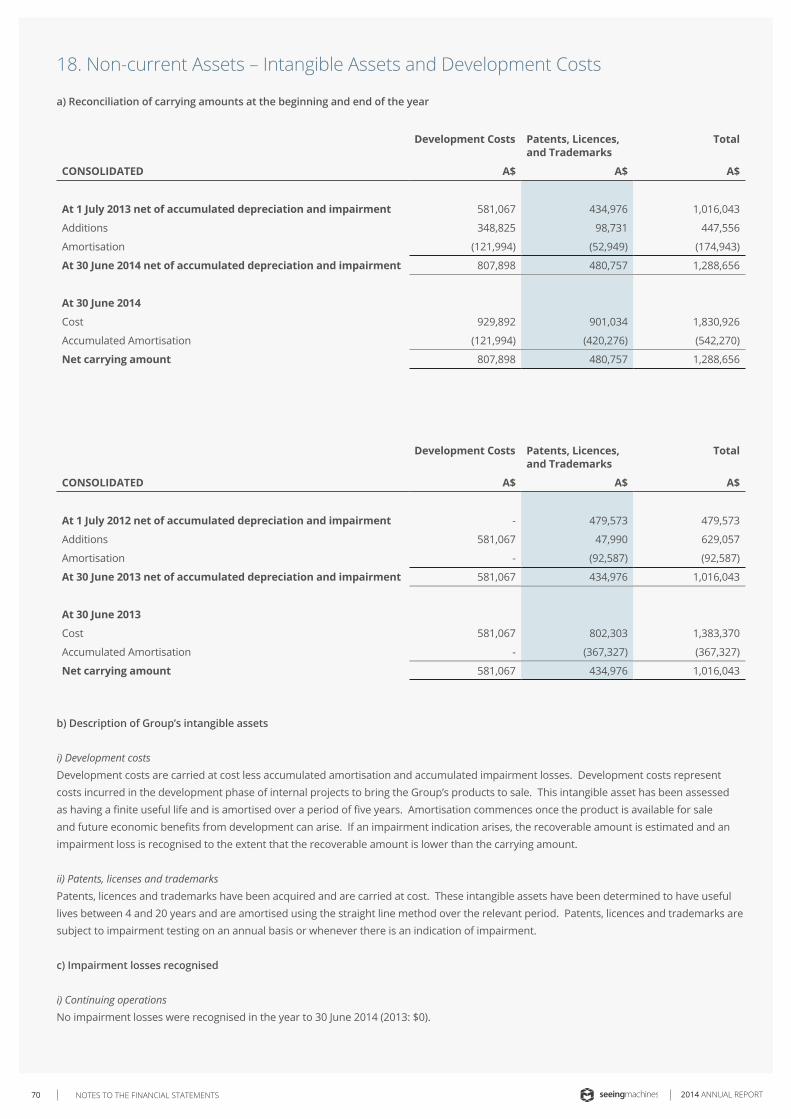
NOTES TO THE FINANCIAL STATEMENTS70 2014 ANNUAL REPORT
18. Non-current Assets – Intangible Assets and Development Costs
a) Reconciliation of carrying amounts at the beginning and end of the year
Development Costs Patents, Licences, and Trademarks
Total
CONSOLIDATED A$ A$ A$
At 1 July 2013 net of accumulated depreciation and impairment 581,067 434,976 1,016,043
Additions 348,825 98,731 447,556
Amortisation (121,994) (52,949) (174,943)
At 30 June 2014 net of accumulated depreciation and impairment 807,898 480,757 1,288,656
At 30 June 2014
Cost 929,892 901,034 1,830,926
Accumulated Amortisation (121,994) (420,276) (542,270)
Net carrying amount 807,898 480,757 1,288,656
Development Costs Patents, Licences, and Trademarks
Total
CONSOLIDATED A$ A$ A$
At 1 July 2012 net of accumulated depreciation and impairment - 479,573 479,573
Additions 581,067 47,990 629,057
Amortisation - (92,587) (92,587)
At 30 June 2013 net of accumulated depreciation and impairment 581,067 434,976 1,016,043
At 30 June 2013
Cost 581,067 802,303 1,383,370
Accumulated Amortisation - (367,327) (367,327)
Net carrying amount 581,067 434,976 1,016,043
b) Description of Group’s intangible assets
i) Development costsDevelopment costs are carried at cost less accumulated amortisation and accumulated impairment losses. Development costs represent costs incurred in the development phase of internal projects to bring the Group’s products to sale. This intangible asset has been assessed as having a finite useful life and is amortised over a period of five years. Amortisation commences once the product is available for sale and future economic benefits from development can arise. If an impairment indication arises, the recoverable amount is estimated and an impairment loss is recognised to the extent that the recoverable amount is lower than the carrying amount.
ii) Patents, licenses and trademarksPatents, licences and trademarks have been acquired and are carried at cost. These intangible assets have been determined to have useful lives between 4 and 20 years and are amortised using the straight line method over the relevant period. Patents, licences and trademarks are subject to impairment testing on an annual basis or whenever there is an indication of impairment.
c) Impairment losses recognised
i) Continuing operationsNo impairment losses were recognised in the year to 30 June 2014 (2013: $0).

71NOTES TO THE FINANCIAL STATEMENTS2014 ANNUAL REPORT
19. Interest-bearing loans and borrowings
Interest rate Maturity 2014 2013
Interest-bearing loans and borrowings
%
Bank loan 6.4 August 2018 (50,851) -
Current (7,430) -
Non-current (43,421) -
Total Interest-bearing loans and borrowings (50,851)
Interest-bearing Loan was used for the purchase of motor vehicle specifically for the purposes of research.
Bank LoanThis loan is secured by the security on the motor vehicle.
Fair ValuesAs at 30 June 2014, the financial instruments held by the Group at carrying amounts reasonably represent their fair value adjusted for any capitalised borrowing costs.
Quantitative disclosure of fair value measurement hierarchy for liabilities as at 30 June 2014:
Fair value measurement using:
Date of valuation Total Quoted price in active
markets (Level 1)
Significant observable
inputs (Level 2)
Significant unobservable
inputs (Level 3)
Liabilities for which fair values are disclosed
Interest-bearing loans and borrowings: Fixed rate borrowing
30 June 2014 49,147 - 49,147 -
There have been no transfers between level 1 and level 2 during the period.
The fair value of the financial assets and liabilities is included at the amount at which the instrument could be exchanged in a current transaction between willing parties, other than in a forced or liquidation sale. The following methods and assumptions were used to estimate the fair values:
Fair values of the Group’s interest-bearing loans and borrowings are determined by using DCF method using discount rate that reflects the issuer’s borrowing rate as at the end of the reporting period. The own non-performance risk as at 30 June 2014 was assessed to be insignificant.
20. Current Liabilities – Trade and Other PayablesConsolidated
2014 2013
FOR THE YEAR ENDED 30 JUNE 2014 A$ A$
Trade payables 1,048,007 1,025,633
Other payables 1,536,659 1,474,249
Total 2,584,666 2,499,882
(Continues on next page)
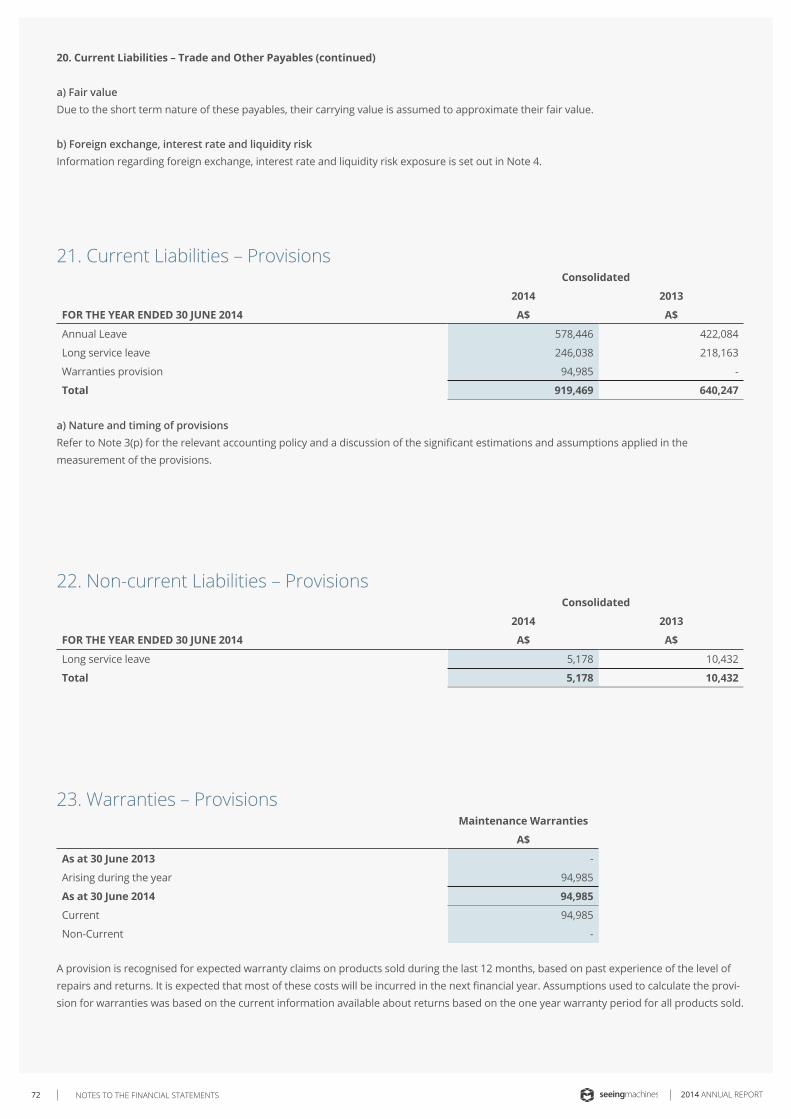
NOTES TO THE FINANCIAL STATEMENTS72 2014 ANNUAL REPORT
20. Current Liabilities – Trade and Other Payables (continued)
a) Fair valueDue to the short term nature of these payables, their carrying value is assumed to approximate their fair value.
b) Foreign exchange, interest rate and liquidity riskInformation regarding foreign exchange, interest rate and liquidity risk exposure is set out in Note 4.
21. Current Liabilities – ProvisionsConsolidated
2014 2013
FOR THE YEAR ENDED 30 JUNE 2014 A$ A$
Annual Leave 578,446 422,084
Long service leave 246,038 218,163
Warranties provision 94,985 -
Total 919,469 640,247
a) Nature and timing of provisionsRefer to Note 3(p) for the relevant accounting policy and a discussion of the significant estimations and assumptions applied in the measurement of the provisions.
22. Non-current Liabilities – ProvisionsConsolidated
2014 2013
FOR THE YEAR ENDED 30 JUNE 2014 A$ A$
Long service leave 5,178 10,432
Total 5,178 10,432
23. Warranties – ProvisionsMaintenance Warranties
A$
As at 30 June 2013 -
Arising during the year 94,985
As at 30 June 2014 94,985
Current 94,985
Non-Current -
A provision is recognised for expected warranty claims on products sold during the last 12 months, based on past experience of the level of repairs and returns. It is expected that most of these costs will be incurred in the next financial year. Assumptions used to calculate the provi-sion for warranties was based on the current information available about returns based on the one year warranty period for all products sold.
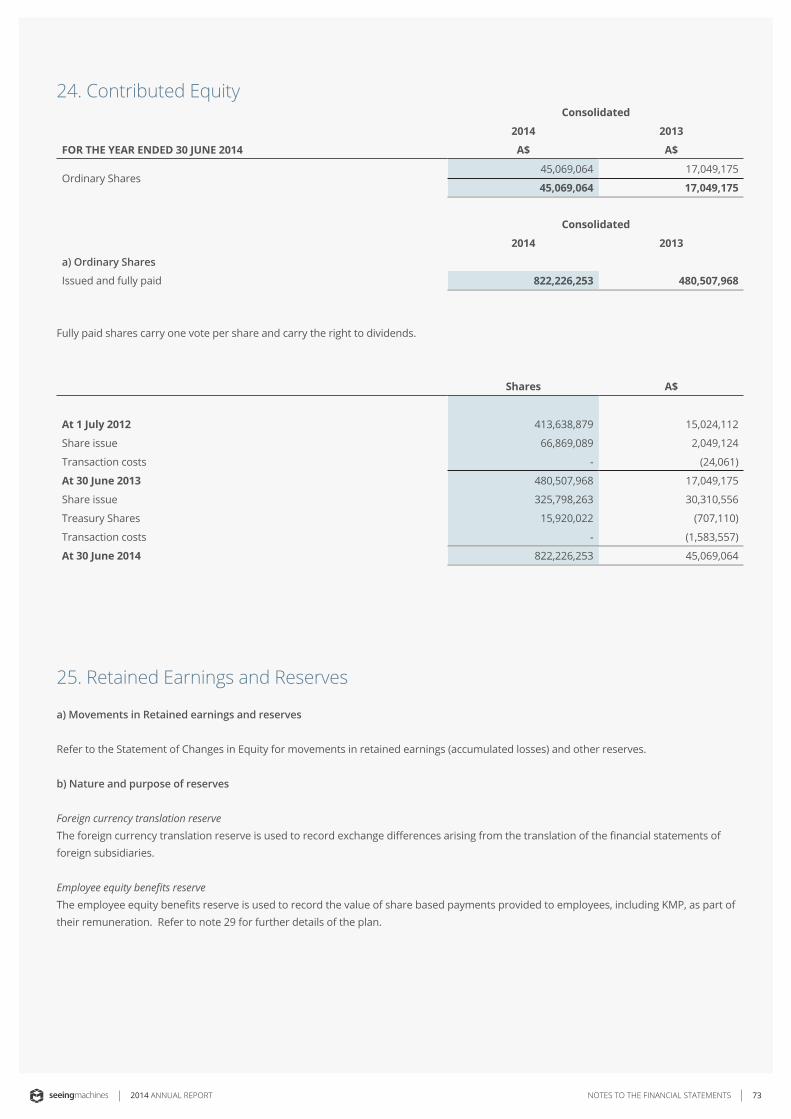
73NOTES TO THE FINANCIAL STATEMENTS2014 ANNUAL REPORT
24. Contributed EquityConsolidated
2014 2013
FOR THE YEAR ENDED 30 JUNE 2014 A$ A$
Ordinary Shares45,069,064 17,049,175
45,069,064 17,049,175
Consolidated
2014 2013
a) Ordinary Shares
Issued and fully paid 822,226,253 480,507,968
Fully paid shares carry one vote per share and carry the right to dividends.
Shares A$
At 1 July 2012 413,638,879 15,024,112
Share issue 66,869,089 2,049,124
Transaction costs - (24,061)
At 30 June 2013 480,507,968 17,049,175
Share issue 325,798,263 30,310,556
Treasury Shares 15,920,022 (707,110)
Transaction costs - (1,583,557)
At 30 June 2014 822,226,253 45,069,064
25. Retained Earnings and Reserves
a) Movements in Retained earnings and reserves
Refer to the Statement of Changes in Equity for movements in retained earnings (accumulated losses) and other reserves.
b) Nature and purpose of reserves
Foreign currency translation reserveThe foreign currency translation reserve is used to record exchange differences arising from the translation of the financial statements of foreign subsidiaries.
Employee equity benefits reserveThe employee equity benefits reserve is used to record the value of share based payments provided to employees, including KMP, as part of their remuneration. Refer to note 29 for further details of the plan.
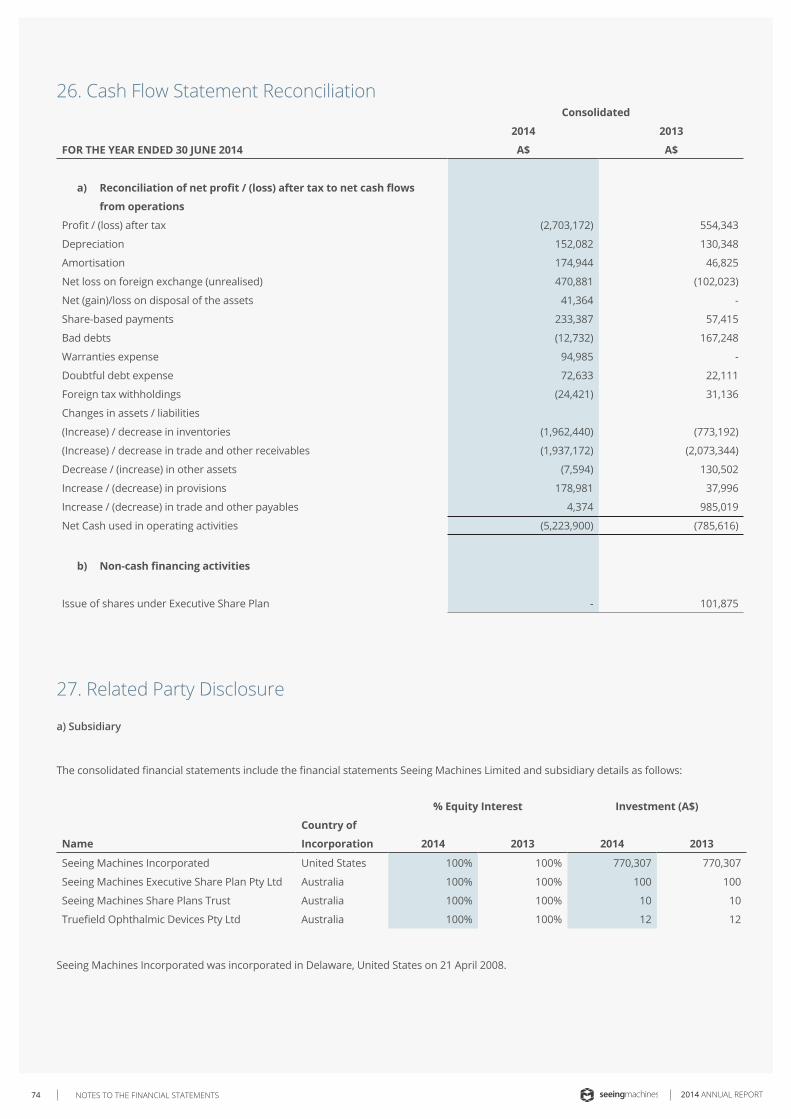
NOTES TO THE FINANCIAL STATEMENTS74 2014 ANNUAL REPORT
26. Cash Flow Statement ReconciliationConsolidated
2014 2013
FOR THE YEAR ENDED 30 JUNE 2014 A$ A$
a) Reconciliation of net profit / (loss) after tax to net cash flows
from operations
Profit / (loss) after tax (2,703,172) 554,343
Depreciation 152,082 130,348
Amortisation 174,944 46,825
Net loss on foreign exchange (unrealised) 470,881 (102,023)
Net (gain)/loss on disposal of the assets 41,364 -
Share-based payments 233,387 57,415
Bad debts (12,732) 167,248
Warranties expense 94,985 -
Doubtful debt expense 72,633 22,111
Foreign tax withholdings (24,421) 31,136
Changes in assets / liabilities
(Increase) / decrease in inventories (1,962,440) (773,192)
(Increase) / decrease in trade and other receivables (1,937,172) (2,073,344)
Decrease / (increase) in other assets (7,594) 130,502
Increase / (decrease) in provisions 178,981 37,996
Increase / (decrease) in trade and other payables 4,374 985,019
Net Cash used in operating activities (5,223,900) (785,616)
b) Non-cash financing activities
Issue of shares under Executive Share Plan - 101,875
27. Related Party Disclosure
a) Subsidiary
The consolidated financial statements include the financial statements Seeing Machines Limited and subsidiary details as follows:
% Equity Interest Investment (A$)
Name
Country of
Incorporation 2014 2013 2014 2013
Seeing Machines Incorporated United States 100% 100% 770,307 770,307
Seeing Machines Executive Share Plan Pty Ltd Australia 100% 100% 100 100
Seeing Machines Share Plans Trust Australia 100% 100% 10 10
Truefield Ophthalmic Devices Pty Ltd Australia 100% 100% 12 12
Seeing Machines Incorporated was incorporated in Delaware, United States on 21 April 2008.
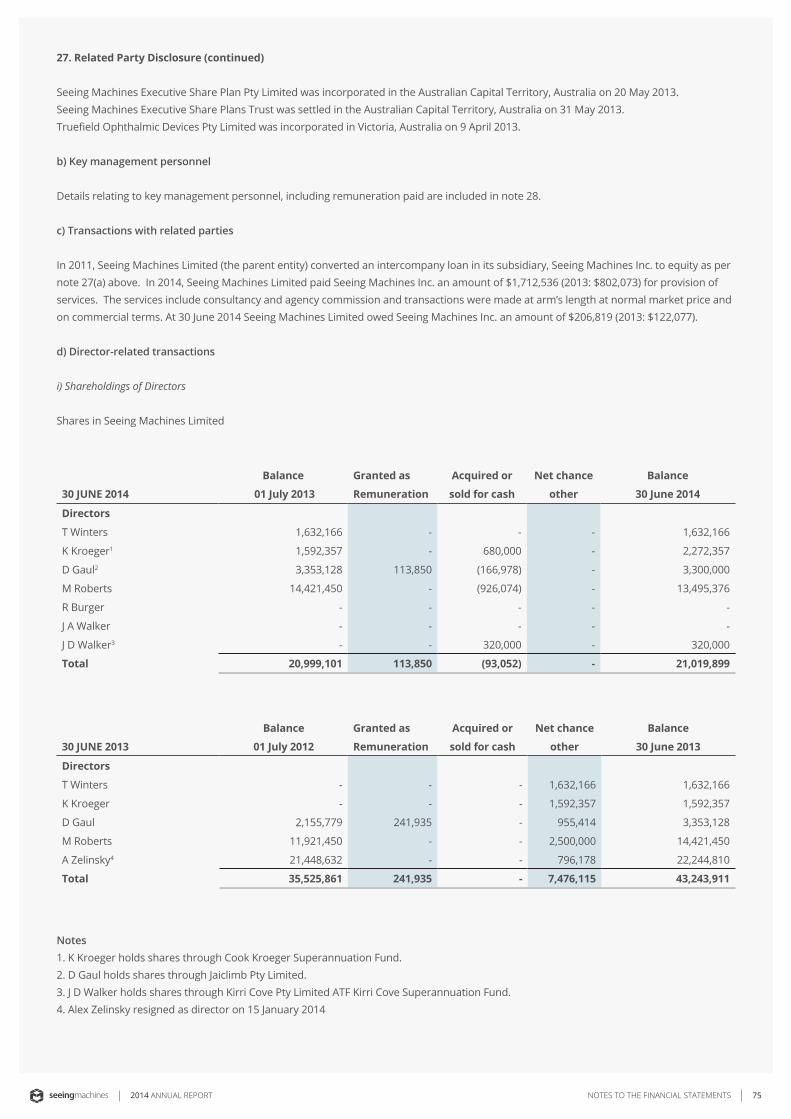
75NOTES TO THE FINANCIAL STATEMENTS2014 ANNUAL REPORT
27. Related Party Disclosure (continued)
Seeing Machines Executive Share Plan Pty Limited was incorporated in the Australian Capital Territory, Australia on 20 May 2013. Seeing Machines Executive Share Plans Trust was settled in the Australian Capital Territory, Australia on 31 May 2013. Truefield Ophthalmic Devices Pty Limited was incorporated in Victoria, Australia on 9 April 2013.
b) Key management personnel
Details relating to key management personnel, including remuneration paid are included in note 28.
c) Transactions with related parties
In 2011, Seeing Machines Limited (the parent entity) converted an intercompany loan in its subsidiary, Seeing Machines Inc. to equity as per note 27(a) above. In 2014, Seeing Machines Limited paid Seeing Machines Inc. an amount of $1,712,536 (2013: $802,073) for provision of services. The services include consultancy and agency commission and transactions were made at arm’s length at normal market price and on commercial terms. At 30 June 2014 Seeing Machines Limited owed Seeing Machines Inc. an amount of $206,819 (2013: $122,077).
d) Director-related transactions
i) Shareholdings of Directors
Shares in Seeing Machines Limited
30 JUNE 2014
Balance
01 July 2013
Granted as
Remuneration
Acquired or
sold for cash
Net chance
other
Balance
30 June 2014
Directors
T Winters 1,632,166 - - - 1,632,166
K Kroeger1 1,592,357 - 680,000 - 2,272,357
D Gaul2 3,353,128 113,850 (166,978) - 3,300,000
M Roberts 14,421,450 - (926,074) - 13,495,376
R Burger - - - - -
J A Walker - - - - -
J D Walker3 - - 320,000 - 320,000
Total 20,999,101 113,850 (93,052) - 21,019,899
30 JUNE 2013
Balance
01 July 2012
Granted as
Remuneration
Acquired or
sold for cash
Net chance
other
Balance
30 June 2013
Directors
T Winters - - - 1,632,166 1,632,166
K Kroeger - - - 1,592,357 1,592,357
D Gaul 2,155,779 241,935 - 955,414 3,353,128
M Roberts 11,921,450 - - 2,500,000 14,421,450
A Zelinsky4 21,448,632 - - 796,178 22,244,810
Total 35,525,861 241,935 - 7,476,115 43,243,911
Notes1. K Kroeger holds shares through Cook Kroeger Superannuation Fund.2. D Gaul holds shares through Jaiclimb Pty Limited.3. J D Walker holds shares through Kirri Cove Pty Limited ATF Kirri Cove Superannuation Fund.4. Alex Zelinsky resigned as director on 15 January 2014
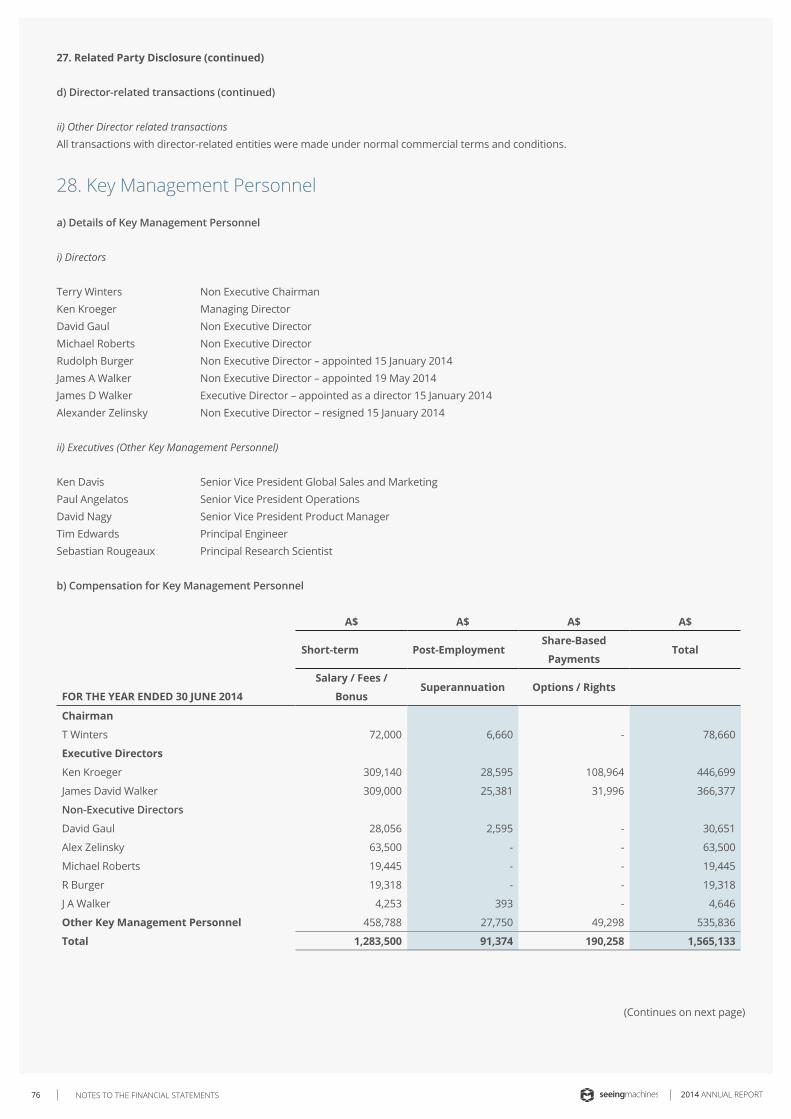
NOTES TO THE FINANCIAL STATEMENTS76 2014 ANNUAL REPORT
27. Related Party Disclosure (continued)
d) Director-related transactions (continued)
ii) Other Director related transactionsAll transactions with director-related entities were made under normal commercial terms and conditions.
28. Key Management Personnel
a) Details of Key Management Personnel
i) Directors
Terry Winters Non Executive ChairmanKen Kroeger Managing DirectorDavid Gaul Non Executive DirectorMichael Roberts Non Executive DirectorRudolph Burger Non Executive Director – appointed 15 January 2014James A Walker Non Executive Director – appointed 19 May 2014James D Walker Executive Director – appointed as a director 15 January 2014Alexander Zelinsky Non Executive Director – resigned 15 January 2014
ii) Executives (Other Key Management Personnel)
Ken Davis Senior Vice President Global Sales and MarketingPaul Angelatos Senior Vice President OperationsDavid Nagy Senior Vice President Product ManagerTim Edwards Principal EngineerSebastian Rougeaux Principal Research Scientist
b) Compensation for Key Management Personnel
A$ A$ A$ A$
Short-term Post-EmploymentShare-Based
PaymentsTotal
FOR THE YEAR ENDED 30 JUNE 2014
Salary / Fees /
BonusSuperannuation Options / Rights
Chairman
T Winters 72,000 6,660 - 78,660
Executive Directors
Ken Kroeger 309,140 28,595 108,964 446,699
James David Walker 309,000 25,381 31,996 366,377
Non-Executive Directors
David Gaul 28,056 2,595 - 30,651
Alex Zelinsky 63,500 - - 63,500
Michael Roberts 19,445 - - 19,445
R Burger 19,318 - - 19,318
J A Walker 4,253 393 - 4,646
Other Key Management Personnel 458,788 27,750 49,298 535,836
Total 1,283,500 91,374 190,258 1,565,133
(Continues on next page)
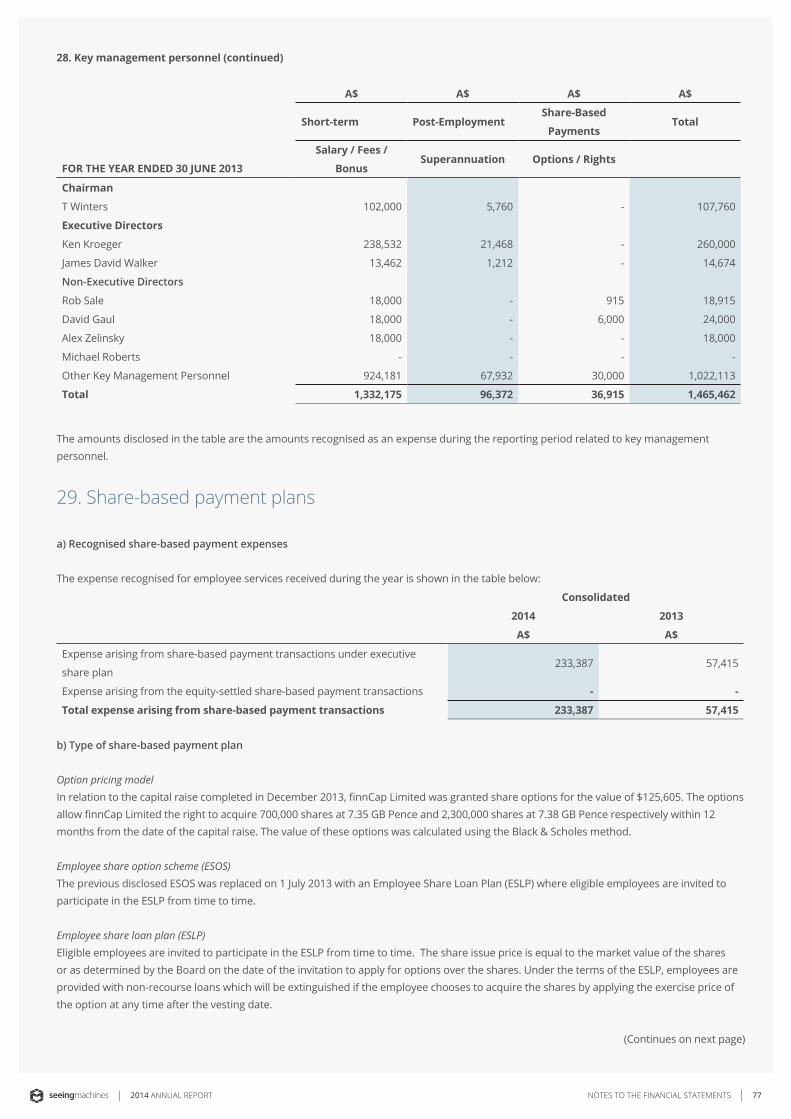
77NOTES TO THE FINANCIAL STATEMENTS2014 ANNUAL REPORT
28. Key management personnel (continued)
A$ A$ A$ A$
Short-term Post-EmploymentShare-Based
PaymentsTotal
FOR THE YEAR ENDED 30 JUNE 2013
Salary / Fees /
BonusSuperannuation Options / Rights
Chairman
T Winters 102,000 5,760 - 107,760
Executive Directors
Ken Kroeger 238,532 21,468 - 260,000
James David Walker 13,462 1,212 - 14,674
Non-Executive Directors
Rob Sale 18,000 - 915 18,915
David Gaul 18,000 - 6,000 24,000
Alex Zelinsky 18,000 - - 18,000
Michael Roberts - - - -
Other Key Management Personnel 924,181 67,932 30,000 1,022,113
Total 1,332,175 96,372 36,915 1,465,462
The amounts disclosed in the table are the amounts recognised as an expense during the reporting period related to key management personnel.
29. Share-based payment plans
a) Recognised share-based payment expenses
The expense recognised for employee services received during the year is shown in the table below:
Consolidated
2014 2013
A$ A$
Expense arising from share-based payment transactions under executive
share plan233,387 57,415
Expense arising from the equity-settled share-based payment transactions - -
Total expense arising from share-based payment transactions 233,387 57,415
b) Type of share-based payment plan
Option pricing modelIn relation to the capital raise completed in December 2013, finnCap Limited was granted share options for the value of $125,605. The options allow finnCap Limited the right to acquire 700,000 shares at 7.35 GB Pence and 2,300,000 shares at 7.38 GB Pence respectively within 12 months from the date of the capital raise. The value of these options was calculated using the Black & Scholes method.
Employee share option scheme (ESOS)The previous disclosed ESOS was replaced on 1 July 2013 with an Employee Share Loan Plan (ESLP) where eligible employees are invited to participate in the ESLP from time to time.
Employee share loan plan (ESLP)Eligible employees are invited to participate in the ESLP from time to time. The share issue price is equal to the market value of the shares or as determined by the Board on the date of the invitation to apply for options over the shares. Under the terms of the ESLP, employees are provided with non-recourse loans which will be extinguished if the employee chooses to acquire the shares by applying the exercise price of the option at any time after the vesting date.
(Continues on next page)
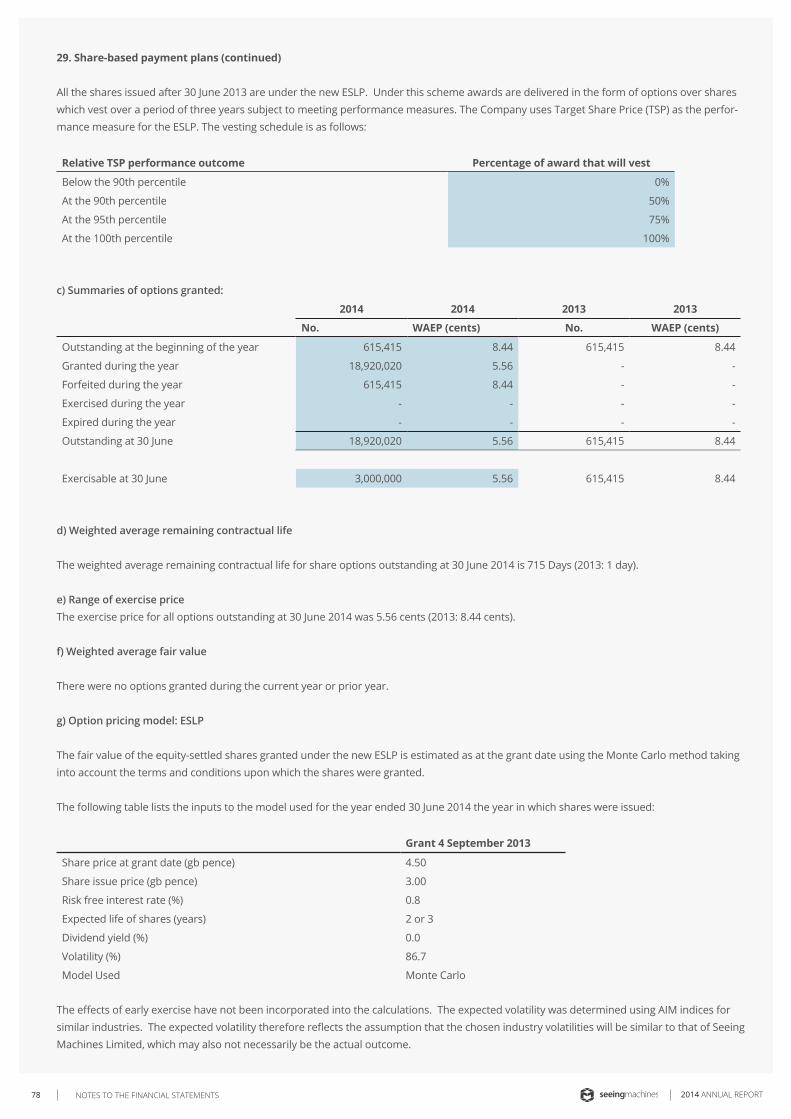
NOTES TO THE FINANCIAL STATEMENTS78 2014 ANNUAL REPORT
29. Share-based payment plans (continued)
All the shares issued after 30 June 2013 are under the new ESLP. Under this scheme awards are delivered in the form of options over shares which vest over a period of three years subject to meeting performance measures. The Company uses Target Share Price (TSP) as the perfor-mance measure for the ESLP. The vesting schedule is as follows:
Relative TSP performance outcome Percentage of award that will vest
Below the 90th percentile 0%
At the 90th percentile 50%
At the 95th percentile 75%
At the 100th percentile 100%
c) Summaries of options granted:
2014 2014 2013 2013
No. WAEP (cents) No. WAEP (cents)
Outstanding at the beginning of the year 615,415 8.44 615,415 8.44
Granted during the year 18,920,020 5.56 - -
Forfeited during the year 615,415 8.44 - -
Exercised during the year - - - -
Expired during the year - - - -
Outstanding at 30 June 18,920,020 5.56 615,415 8.44
Exercisable at 30 June 3,000,000 5.56 615,415 8.44
d) Weighted average remaining contractual life
The weighted average remaining contractual life for share options outstanding at 30 June 2014 is 715 Days (2013: 1 day).
e) Range of exercise priceThe exercise price for all options outstanding at 30 June 2014 was 5.56 cents (2013: 8.44 cents).
f) Weighted average fair value
There were no options granted during the current year or prior year.
g) Option pricing model: ESLP
The fair value of the equity-settled shares granted under the new ESLP is estimated as at the grant date using the Monte Carlo method taking into account the terms and conditions upon which the shares were granted.
The following table lists the inputs to the model used for the year ended 30 June 2014 the year in which shares were issued:
Grant 4 September 2013
Share price at grant date (gb pence) 4.50
Share issue price (gb pence) 3.00
Risk free interest rate (%) 0.8
Expected life of shares (years) 2 or 3
Dividend yield (%) 0.0
Volatility (%) 86.7
Model Used Monte Carlo
The effects of early exercise have not been incorporated into the calculations. The expected volatility was determined using AIM indices for similar industries. The expected volatility therefore reflects the assumption that the chosen industry volatilities will be similar to that of Seeing Machines Limited, which may also not necessarily be the actual outcome.
(Continues on next page)
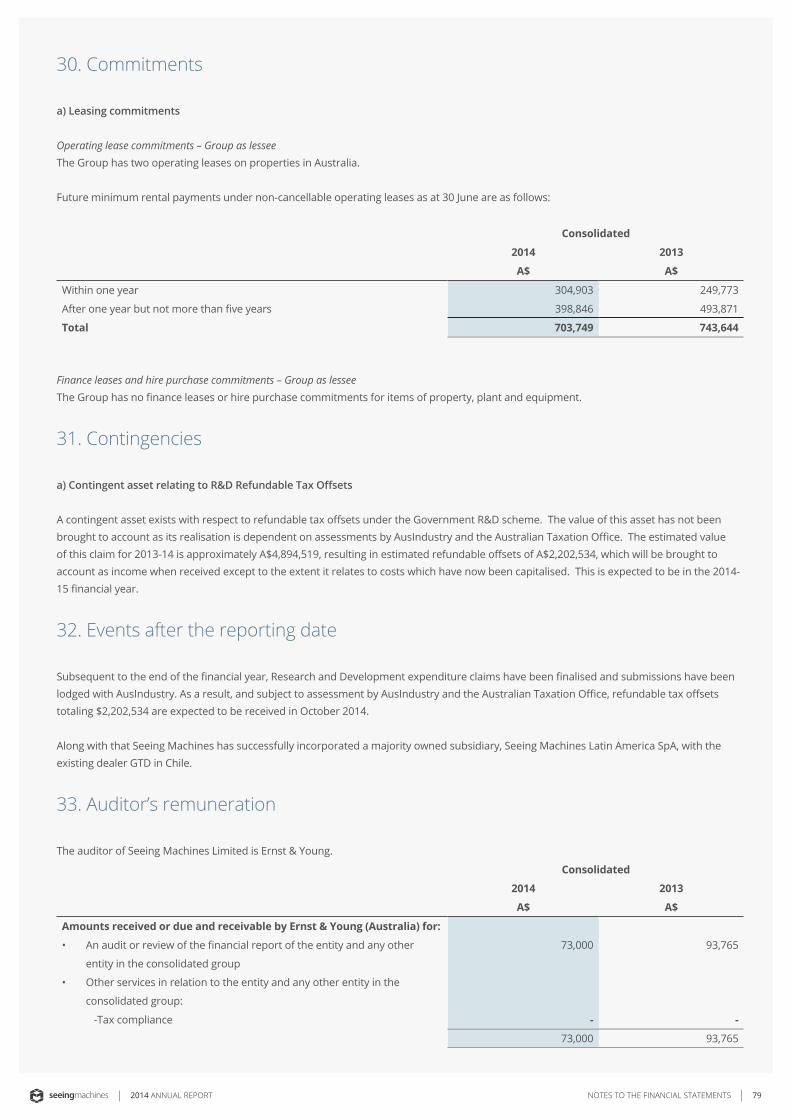
79NOTES TO THE FINANCIAL STATEMENTS2014 ANNUAL REPORT
30. Commitments
a) Leasing commitments
Operating lease commitments – Group as lesseeThe Group has two operating leases on properties in Australia.
Future minimum rental payments under non-cancellable operating leases as at 30 June are as follows:
Consolidated
2014 2013
A$ A$
Within one year 304,903 249,773
After one year but not more than five years 398,846 493,871
Total 703,749 743,644
Finance leases and hire purchase commitments – Group as lesseeThe Group has no finance leases or hire purchase commitments for items of property, plant and equipment.
31. Contingencies
a) Contingent asset relating to R&D Refundable Tax Offsets
A contingent asset exists with respect to refundable tax offsets under the Government R&D scheme. The value of this asset has not been brought to account as its realisation is dependent on assessments by AusIndustry and the Australian Taxation Office. The estimated value of this claim for 2013-14 is approximately A$4,894,519, resulting in estimated refundable offsets of A$2,202,534, which will be brought to account as income when received except to the extent it relates to costs which have now been capitalised. This is expected to be in the 2014-15 financial year.
32. Events after the reporting date
Subsequent to the end of the financial year, Research and Development expenditure claims have been finalised and submissions have been lodged with AusIndustry. As a result, and subject to assessment by AusIndustry and the Australian Taxation Office, refundable tax offsets totaling $2,202,534 are expected to be received in October 2014.
Along with that Seeing Machines has successfully incorporated a majority owned subsidiary, Seeing Machines Latin America SpA, with the existing dealer GTD in Chile.
33. Auditor’s remuneration
The auditor of Seeing Machines Limited is Ernst & Young.
Consolidated
2014 2013
A$ A$
Amounts received or due and receivable by Ernst & Young (Australia) for:
• An audit or review of the financial report of the entity and any other
entity in the consolidated group
• Other services in relation to the entity and any other entity in the
consolidated group:
73,000 93,765
-Tax compliance - -
73,000 93,765
80 DIRECTORS’ DECLARATION 2014 ANNUAL REPORT
Directors’ DeclarationIn accordance with a resolution of the directors of Seeing Machines Limited, I state that:
1. In the opinion of the directors:
a) The financial statements and notes of the consolidated entity is in accordance with the Corporations Act 2001, including:
i) Giving a true and fair view of the consolidated entity’s financial position as at 30 June 2014 and of its performance for the year ended on that date; and
ii) Complying with Accounting Standards (including Australian Accounting Interpretations) and Corporations Regulations 2001.
b) The financial statements and notes comply with the international financial reporting Standards as disclosed in note 3 (b); and
c) There are reasonable grounds to believe that the company will be able to pay its debts as and when they become due and payable.
2. This declaration has been made after receiving the declarations required to be made to the directors in accordance with section 295A of the Corporations Regulations 2001 for the financial year ending 30 June 2014.
On behalf of the Board
Chairman
Canberra, 12 September 2014

81INDEPENDENT AUDITOR’S REPORT TO THE MEMBERS OF SEEING MACHINES LIMITED2014 ANNUAL REPORT
INDEPENDENT AUDITOR’S REPORT TO THE MEMBERS OF SEEING MACHINES LIMITED82 2014 ANNUAL REPORT