sedimentation study of dickinson bayou tidal (segment 1103)
TRANSCRIPT

1 Sedimentation Study of Dickinson Bayou Tidal (Segment 1103)
Sedimentation Study of Dickinson Bayou Tidal (Segment 1103) Prepared in cooperation with the Texas Commission on Environmental Quality Project ID: 582-9-90440-04
EIH Final Report # 12-003
10/4/2012
Environmental Institute of Houston
University of Houston – Clear Lake

2 Sedimentation Study of Dickinson Bayou Tidal (Segment 1103)
Sedimentation Study of Dickinson Bayou Tidal (Segment 1103)
Prepared by Environmental Institute of Houston, University of Houston – Clear Lake
George Guillen, Executive Director Jenny Oakley, Environmental Scientist
Misty Shepard, Research Associate Kristen Vale, Research Associate
Principal Investigator
George Guillen, Executive Director ([email protected])
Environmental Institute of Houston
University of Houston – Clear Lake
2700 Bay Area Blvd.
Box 540
Houston, TX., 77058
Prepared in cooperation with and for the Texas Commission on Environmental Quality
Roger Miranda, Project Manager ([email protected])
12100 Park 35 Circle
MC 203
Austin, TX 78753

3 Sedimentation Study of Dickinson Bayou Tidal (Segment 1103)
Table of Contents
Executive Summary ...................................................................................................................... 10
Introduction ................................................................................................................................... 12
Problem Statement .................................................................................................................... 12
Study Area ................................................................................................................................. 13
Study Objective ......................................................................................................................... 18
Methods......................................................................................................................................... 19
Site Selection and Description .................................................................................................. 19
Sampling Dates ......................................................................................................................... 21
Sampling Methods..................................................................................................................... 23
Precipitation and Stream Stage .............................................................................................. 23
Streamflow and Water Quality Sampling .............................................................................. 24
Stream Sediment Collection .................................................................................................. 26
Sediment Deposition Sampling ............................................................................................. 26
Laboratory Analysis .................................................................................................................. 31
Data Analysis ............................................................................................................................ 32
Results ........................................................................................................................................... 36
Meteorology and Hydrology ..................................................................................................... 36
Precipitation and Stream Water Levels 2011 ........................................................................ 36
Precipitation and Stream Water Levels 2012 ........................................................................ 37
Streamflow and Velocity Profiles 2011 ................................................................................. 45
Streamflow and Velocity Profile 2012 .................................................................................. 45
Water Quality Results ............................................................................................................... 69
Sediment Results ....................................................................................................................... 76
Sediment Trap Results .............................................................................................................. 76
Conclusions and Recommendations ............................................................................................. 89
Literature Cited ............................................................................................................................. 94
Appendix 1. Field Data ................................................................................................................. 98
Appendix 2. Flow Data ................................................................................................................. 99

4 Sedimentation Study of Dickinson Bayou Tidal (Segment 1103)
Appendix 3. Sonde Calibration ................................................................................................... 100
Appendix 4. Photographic Record .............................................................................................. 101
Appendix 5. Rainfall Data .......................................................................................................... 102
Appendix 6. Tide Data ................................................................................................................ 103

5 Sedimentation Study of Dickinson Bayou Tidal (Segment 1103)
List of Figures
Figure 1. Dickinson Bayou, Texas watershed depicting TCEQ designated segment boundaries
and watershed area. ....................................................................................................................... 14
Figure 2. Location of permitted discharges within the Dickinson Bayou watershed. .................. 17
Figure 3. Location of sedimentation sampling sites in Dickinson Bayou ................................... 20
Figure 4. Sedimentation chambers used during USGS studies.................................................... 27
Figure 5. Original sediment collector design used at sites 2 and 3 during the study. ................... 28
Figure 6. Alternative shallow water sediment sampler used at site 1 (TCEQ Station 11464). .... 30
Figure 7. Flow chart showing the routine processing of sediment deposition collector samples
during the study............................................................................................................................. 31
Figure 8. Description of boxplot used in report. ........................................................................... 32
Figure 9. Drought severity index produced by USDA for March 2011. ..................................... 38
Figure 10. Drought severity index for the wet weather sampling period starting June 21, 2011.
Dickinson Bayou was within the exceptional drought zone. ........................................................ 39
Figure 11. Daily precipitation recorded from 2/1/11 to 7/1/12 at the League City National
Weather Station, League City, Texas. .......................................................................................... 40
Figure 12. Standardized gage staff levels measured during 2011. Blue and red rectangles denote
dry and wet weather sampling periods respectively. .................................................................... 40
Figure 13. Standardized staff gage levels versus cumulative 24 hour precipitation levels recorded
at the League City National Weather Station during monitoring conducted in 2011. .................. 41
Figure 14. Standardized staff gage levels versus cumulative 3 day precipitation levels recorded at
the League City National Weather Station, during monitoring conducted in 2011. ..................... 41
Figure 15. NOAA Dickinson Bay tide gage and TROLL water level gage measurements at HWY
3 during February 14 through September 29, 21011. ................................................................... 42
Figure 16. Relationship between NOAA tide gage (8771013 Eagle Point, TX) and water level
readings from the TROLL gage at SH 3, collected during 2011.. ................................................ 42
Figure 17. Water level fluctuations recorded at the SH 3 bridge with the TROLL gage on June
22, 2011 during the wet weather sampling event. ........................................................................ 43
Figure 18. Relationship of recorded water level with TROLL gage versus tide levels in
Dickinson Bayou recorded by the NOAA tide gage (8771013 Eagle Point, TX). ...................... 43
Figure 19. Daily precipitation recorded from 3/1/112 to 4/20/12 at the League City National
Weather Station, League City, Texas.. ......................................................................................... 44
Figure 20. Relationship of recorded water level with Troll level gage at Hwy 3 and tide levels
recorded at Eagle Point in Dickinson Bay by the NOAA (8771013 Eagle Point, TX) tide gage..
....................................................................................................................................................... 44
Figure 21. Streamflow measured at each site during the study period. Blue boxplots and areas in
the rectangles represent wet weather sampling periods. ............................................................... 46

6 Sedimentation Study of Dickinson Bayou Tidal (Segment 1103)
Figure 22. River surveyor velocity profiles obtained during site 1 dry weather sediment sampler
deployment on April 20, 2011. ..................................................................................................... 47
Figure 23. River surveyor velocity profiles obtained during site 2 dry weather sediment sampler
deployment on April 29, 2011. ..................................................................................................... 48
Figure 24. River surveyor velocity profiles obtained during site 3 dry weather sediment sampler
deployment on April 20, 2011. ..................................................................................................... 49
Figure 25. River surveyor velocity profiles obtained during site 1 dry weather sediment sampler
retrieval on April 25, 2011. ........................................................................................................... 50
Figure 26. River surveyor velocity profiles obtained during site 2 dry weather sediment sampler
retrieval on May 4, 2011. .............................................................................................................. 51
Figure 27. River surveyor velocity profiles obtained during site 3 dry weather sediment sampler
retrieval on April 25, 2011. ........................................................................................................... 52
Figure 28. River surveyor velocity profiles obtained during site 1 wet weather sediment sampler
deployment on June 22, 2011. ...................................................................................................... 53
Figure 29. River surveyor velocity profiles obtained during site 2 wet weather sediment sampler
deployment on June 22, 2011. ...................................................................................................... 54
Figure 30. River surveyor velocity profiles obtained during site 3 wet weather sediment sampler
deployment on June 22, 2011. ...................................................................................................... 55
Figure 31. River surveyor velocity profiles obtained during site 1 wet weather sediment sampler
retrieval on June 24, 2011. ............................................................................................................ 56
Figure 32. River surveyor velocity profiles obtained during site 2 wet weather sediment sampler
retrieval on June 24, 2011. ............................................................................................................ 57
Figure 33. River surveyor velocity profiles obtained during site 3 wet weather sediment sampler
retrieval on June 24, 2011. ............................................................................................................ 58
Figure 34. River surveyor velocity profiles obtained during site 1 wet weather sediment sampler
deployment on March 20, 2012. ................................................................................................... 59
Figure 35. River surveyor velocity profiles obtained during site 2 wet weather sediment sampler
deployment on March 20, 2012. ................................................................................................... 60
Figure 36. River surveyor velocity profiles obtained during site 3 wet weather sediment sampler
deployment on March 20, 2012. ................................................................................................... 61
Figure 37. River surveyor velocity profiles obtained during site 1 wet weather sediment sampler
retrieval on March 22, 2012. ......................................................................................................... 62
Figure 38. River surveyor velocity profiles obtained during site 2 wet weather sediment sampler
retrieval on March 22, 2012. ......................................................................................................... 62
Figure 39. River surveyor velocity profiles obtained during site 1 dry weather sediment sampler
deployment on April 24, 2012. ..................................................................................................... 63
Figure 40. River surveyor velocity profiles obtained during site 2 dry weather sediment sampler
deployment on April 24, 2012. ..................................................................................................... 64

7 Sedimentation Study of Dickinson Bayou Tidal (Segment 1103)
Figure 41. River surveyor velocity profiles obtained during site 3 dry weather sediment sampler
deployment on April 24, 2012. ..................................................................................................... 65
Figure 42. River surveyor velocity profiles obtained during site 1 dry weather sediment sampler
retrieval on April 27, 2012. ........................................................................................................... 66
Figure 43. River surveyor velocity profiles obtained during site 2 dry weather sediment sampler
retrieval on April 27, 2012. ........................................................................................................... 67
Figure 44. River surveyor velocity profiles obtained during site 3 dry weather sediment sampler
retrieval on April 27, 2012. ........................................................................................................... 68
Figure 45. Specific conductance (uS) measured at each site during 2011 and 2012, during wet
and dry sampling events at bottom (B), middle (M) and surface (S) depths. ............................... 70
Figure 46. Salinity measured at each site during 2011 and 2012, during wet and dry sampling
events at bottom (B), middle (M) and surface (S) depths. ............................................................ 70
Figure 47. Secchi disk transparency (SD) measured at each site during 2011 and 2012, during
wet and dry sampling events. ........................................................................................................ 71
Figure 48. Turbidity (NTU) measured at each site during 2011 and 2012, during wet and dry
sampling events. ............................................................................................................................ 71
Figure 49. The pH measured at each site during 2011 and 2012, during wet and dry sampling
events at bottom (B), middle (M) and surface (S) depths. ............................................................ 72
Figure 50. Dissolved oxygen (mg/L) measured at each site during 2011 and 2012, during wet
and dry sampling events at bottom (B), middle (M) and surface (S) depths. ............................... 72
Figure 51. Total suspended solids (mg/L) measured at each site during 2011 and 2012, during
wet and dry sampling events. ........................................................................................................ 73
Figure 52. Volatile suspended solids (mg/L) measured at each site during 2011 and 2012, during
wet and dry sampling events. ........................................................................................................ 73
Figure 53. Relationship between VSS and TSS levels measured on samples collected in
Dickinson Bayou during wet and dry weather sampling during 2011 and 2012. ......................... 74
Figure 54. Total organic carbon (mg/L) measured at each site during 2011 and 2012, during wet
and dry sampling events................................................................................................................ 74
Figure 55. Dissolved organic carbon (mg/L) measured at each site during 2011 and 2012, during
wet and dry sampling events. ........................................................................................................ 75
Figure 56. Relationship between DOC and TOC levels measured on samples collected in
Dickinson Bayou during wet and dry weather sampling during 2011 and 2012. ......................... 75
Figure 57. Percent grain size < 0.0625 mm diameter (silt and clay fraction) in settled solids from
each sediment sampler during April, May and June 2011 monitoring. ........................................ 77
Figure 58. Percent grain size < 0.0625 to 2.0 mm diameter in settled solids from each sediment
sampler during April, May and June 2011 monitoring. ................................................................ 77
Figure 59. Percent grain size > 2.0 mm diameter in settled solids from each sediment sampler
during April, May and June 2011 monitoring. ............................................................................. 78

8 Sedimentation Study of Dickinson Bayou Tidal (Segment 1103)
Figure 60. Total solids collected in each sedimentation sampler during March and April 2012 dry
and wet weather monitoring.......................................................................................................... 82
Figure 61. Estimated sediment deposition rates at each sedimentation sampler during March and
April 2012 dry and wet weather monitoring. ................................................................................ 82
Figure 62. Percent total volatile solids (TVS) in deposited sediment at each sedimentation
sampler during March and April 2012 dry and wet weather monitoring. .................................... 83
Figure 63. Estimated total carbon deposition rates at each sedimentation sampler during March
and April 2012 dry and wet weather monitoring. ......................................................................... 83
Figure 64. Estimated total organic carbon deposition rates at each sedimentation sampler during
March and April 2012 dry and wet weather monitoring............................................................... 84
Figure 65. Estimated sediment-associated silicate deposition rates at each sedimentation sampler
during March and April 2012 dry and wet weather monitoring. .................................................. 84
Figure 66. Estimated sediment-associated total phosphorus deposition rates at each
sedimentation sampler during March and April 2012 dry and wet weather monitoring. ............. 85
Figure 67. Estimated sediment-associated total nitrogen deposition rates at each sedimentation
sampler during March and April 2012 dry and wet weather monitoring. .................................... 85
Figure 68. Relationship between average flow and estimated total solids deposition rate........... 86
Figure 69. Relationship between estimated total solids and sediment-associated total carbon
deposition rates. ............................................................................................................................ 86
Figure 70. Relationship between estimated total solids and sediment-associated total organic
carbon deposition rates. ................................................................................................................ 87
Figure 71. Relationship between estimated total solids and sediment-associated total phosphorus
deposition rates. ............................................................................................................................ 88
Figure 72. Relationship between estimated total solids and sediment-associated total nitrogen
deposition rates. ............................................................................................................................ 88
Figure 73. Example of estuarine turbidity maxima showing zone of maximum turbidity and
deposition. ..................................................................................................................................... 90
Figure 74. Influence of tides and freshwater inflow on the position of the estuarine turbidity
maxima. ......................................................................................................................................... 91
Figure 75. Relationship of tide height, tidal amplitude and freshwater inflow on the location of
the turbidity maxima. .................................................................................................................... 92
Figure 76. Influence of turbidity maxima on suspended sediment levels and measurements of
turbidity. ........................................................................................................................................ 92

9 Sedimentation Study of Dickinson Bayou Tidal (Segment 1103)
List of Tables
Table 1. Permitted wastewater facilities in the Dickinson Bayou watershed. .............................. 16
Table 2. Location of sampling sites on Dickinson Bayou. ........................................................... 19
Table 3. Sampling dates, sites and sample types collected during the Dickinson Bayou
sedimentation study.. .................................................................................................................... 22
Table 4. Field sampling and handling procedures used during the project, including container
types, minimum sample volume, preservation requirements, and holding times (Texas
Commission on Environmental Quality 2007, 2008b). ................................................................ 25
Table 5. Measurement performance specifications for water and sediment quality parameters
evaluated during the study. ........................................................................................................... 33
Table 6. Summary data on measured streamflow during 2011 and 2012 sedimentation sampler
deployment and retrieval periods. ................................................................................................. 46
Table 7. Bulk stream bed sediment physical and chemical properties collected at each site on
April 20, 2011. .............................................................................................................................. 76
Table 8. Measured physical and chemical characteristics of sediment collected in sedimentation
samplers during March and April, 2012. ...................................................................................... 80
Table 9. Calculated sedimentation and chemical flux rates of sediment associated chemicals
based on measured physical and chemical characteristics of sediment collected by sedimentation
samplers during March and April, 2012. ...................................................................................... 81
Table 10. Summary of sediment and associated chemical deposition rates. ................................ 89

10 Sedimentation Study of Dickinson Bayou Tidal (Segment 1103)
Executive Summary
The Texas Commission on Environmental Quality (TCEQ) is in the process of refining ongoing
total maximum daily load (TMDL) modeling efforts associated with Dickinson Bayou Tidal
(segment 111) to better understand sediment-associated nutrient and dissolved oxygen dynamics.
In particular this data is needed to derive needed input for the Environmental Fluid Dynamic
Code (EFDC) sediment process model. The EFDC sediment process model incorporates three
basic processes including (1) depositional flux of particulate organic matter (POM), (2)
diagenesis of POM, and (3) the resulting nutrient flux from sediments. The sediment model is
driven by net settling of particulate organic carbon, nitrogen, phosphorus, and silica from the
overlying water to the sediments (depositional flux).
The primary goal of this project was to collect necessary water, sediment and sediment chamber
data that will be used in future TMDL development tasks including refinement of the EFDC
model. The primary objective of this study was to measure total sediment and organic carbon
deposition rates at three separate areas of Dickinson Bayou Tidal (segment 1103) during, at least,
two sampling events. In order to complete this objective, the University of Houston Clear Lake –
Environmental Institute of Houston (UHCL-EIH) collected and analyzed 1) ambient water, 2)
stream bottom sediment, and 3) recently deposited sediment and particulate-associated total and
organic carbon, and nutrients (phosphorus and nitrogen), using sediment traps deployed in
segment 1103 during four sampling events, including two wet weather and two dry weather
event. These data were used to produce estimates of the sedimentation rates and constants
necessary to calibrate dynamic water and sediment quality models. One site was located near the
upper boundary with Dickinson Bayou Above Tidal (segment 1104). This site was used to
represent upper boundary conditions within segment 1103. The other two sites were located in
the middle portion of the segment 1103, where depressed dissolved oxygen conditions have been
documented. The sampling sites are described in Table 2 and shown in Figure 3. Except where
noted in this report, all field sampling and laboratory analyses were conducted in accordance
with the project QAPP.
Due to the extensive state-wide drought occurring in Texas during 2011 and errors committed
during laboratory analysis we relied primarily on data generated during March and April 2012
for generating estimates of sedimentation during wet and dry weather conditions. Estimates of
sedimentation rates for total solids, total carbon, total organic carbon, total nitrogen and
phosphorus were successfully generated during this study. The results of this study provide
critical information on the physical and chemical composition of suspended sediment and
deposited sediment in the upstream reaches of Dickinson Bayou Tidal. Information and estimates
of deposition rates of total solids, total carbon, total organic carbon, total nitrogen and total
phosphorus are provided in Table 9 and Table 10 and Figure 60-Figure 67. These estimates
varied according to site and streamflow regime. In general deposition rates of total solids were
higher during wet weather events during the descending limb of the hydrograph versus dry
weather events. However, with the exception of particulate-associated carbon, deposition rates
of sediment-associated TOC, silicates, TN and TP were higher during dry weather events. This
was due to the higher percentage of sediment-associated forms of these chemical constituents
during dry weather conditions. This may be due to processes occurring at higher flows, during
which the particulate forms of these chemicals are composed of both resuspended bottom
sediments and new sediments that have runoff into the bayou.

11 Sedimentation Study of Dickinson Bayou Tidal (Segment 1103)
A major process that may influence the dynamics of sediment deposition in Dickinson Bayou is
the presence and magnitude of turbidity maxima. This occurs at the frontal zone between the
fresh and saline water. In a wide range of estuaries, stable turbidity maxima can be observed at
the upstream tip of the salt wedge. These estuarine turbidity maxima (ETM) are formed by high
concentrations of suspended particulate matter where increased deposition occurs. Reduced and
reversing current velocities due to tides, changes in flow velocity due to stream morphology, and
changes in pH and salinity have all been cited as primary mechanisms for this phenomenon. The
presence of the estuarine turbidity maxima can complicate the estimation of deposition rates
since immediately upstream and downstream of this zone, deposition rates can change
significantly. Future studies focused on determining the possible presence and lateral extent of
this zone may be appropriate for gaining a better understanding of suspended sediment dynamics
in Dickinson Bayou.
The methodology used by this investigation proved to be adequate for accomplishing the study
objectives. Future studies should include concurrent deployment of automated salinity and
turbidity meters, and sediment deposition samplers in a vertical array to gain a better
understanding of depositional processes within the waterbody.
12 Sedimentation Study of Dickinson Bayou Tidal (Segment 1103)
Introduction
Problem Statement
Historical surface water quality monitoring indicates that dissolved oxygen (DO) concentrations
in Dickinson Bayou Tidal (TCEQ Segment 1103) are lower than the criteria used to evaluate
attainment of the high aquatic life use designated to Segment 1103 and the intermediate aquatic
life use designated in Segment 1104 (TCEQ 2008a). Hypoxia (dissolved oxygen levels below 3.0
mg/L) and anoxia (lack of dissolved oxygen) have been documented in tidal portions of
Dickinson Bayou since the early 1970’s (Knudson and Belaire 1975). These early studies
documented frequent oxygen depletion and related fish kills, caused by dense algal blooms,
which occurred during summers in the six-kilometer portion of Dickinson Bayou directly
upstream from two sewage treatment plants near state highway 3. Elevated nutrients were cited
as a major cause of impairment and eutrophication in this portion of Dickinson Bayou
(Kirkpatrick 1986b, a). Associated conditions including numerous algae blooms and depressed
dissolved oxygen have continued, although the frequency of fish kills have declined (Quigg et al.
2009). Physical conditions including relatively deep (> 10 feet) bottom depths and low tidal
flushing rates have been identified as major contributing factors associated with ongoing hypoxia
events.
Dickinson Bayou Tidal (Segment 1103) was first officially identified as a water body exhibiting
impaired water quality for low dissolved oxygen in 1992 (Texas Water Commission 1992).
Portions the non-tidal segment of Dickinson Bayou (segment 1104), were also recently listed for
not meeting dissolved oxygen standards starting in 2006(Texas Commission on Environmental
Quality 2008a). Dickinson Bayou is currently listed on the 2008 and draft 2010 Texas 303(d)
list for non-attainment of dissolved oxygen criteria (Texas Commission on Environmental
Quality 2008a, 2010). This is based in part on historical surface water quality monitoring data
which indicates that dissolved oxygen (DO) concentrations in Dickinson Bayou are lower than
the criteria used to evaluate attainment of the high aquatic life use designated in Segment 1103
and the intermediate aquatic life use designated in Segment 1104 (Texas Commission on
Environmental Quality 2008a).
In response to these documented conditions, a total maximum daily load (TMDL) project was
initiated to evaluate causes and the effects of low dissolved oxygen on aquatic life and to
determine the actions necessary to maintain water quality in the non-tidal and tidal portions
(Segments 1103 and 1104) of Dickinson Bayou (Texas Commission on Environmental Quality
2008c). The draft total maximum daily load (TMDL) for dissolved oxygen in both Dickinson
Bayou segments was issued in 2008 (Texas Commission on Environmental Quality 2008c). The
TMDL described the relationship of pollutants associated with dissolved oxygen (DO) in
Dickinson Bayou Tidal (Segment 1103) and Dickinson Bayou above Tidal (Segment 1104). The
TMDL analysis also showed that the bottom depth pattern of Dickinson Bayou contributed
significantly to the non-attainment of DO criteria as currently applied to the bayou and
recommended a reassessment of the criteria or the criteria assessment methodology applied to
the bayou. During the public review of the draft TMDL, TCEQ decided that additional data on
sedimentation rates and associated processes including sediment nutrient levels and fluxes were
needed to refine the Environmental Fluid Dynamics Code (EFDC) model predictions (Tetra Tech
Inc. 2006, 2007a, b, Rifai 2010).

13 Sedimentation Study of Dickinson Bayou Tidal (Segment 1103)
In a parallel effort, the TCEQ has partnered with the steering committee of the Dickinson Bayou
Watershed Partnership and AgriLife Extension to develop a watershed protection plan (WPP) for
Dickinson Bayou (Dickinson Bayou Watershed Partnership 2009). In May 2009, the TCEQ
accepted the Dickinson Bayou Watershed Partnership’s WPP and submitted it to the EPA for
approval. The EPA recommended several revisions to the plan, but gave preliminary approval to
implement several major projects included in the plan.
The TCEQ concluded that additional data was needed for estimation of sedimentation rates and
partitioning of nutrients. To obtain this information additional field collection of ambient water,
stream bed sediment and recently deposited sediments was needed. Therefore plans were made
to collect these data in 2011 and later in 2012 at several sites extending from the upper to middle
portions of the tidally-influenced segment of Dickson Bayou (Segment 1103). This data will be
used to determine sedimentation rates and associated water quality parameters in the upper and
middle portions of the tidally-influenced segment of Dickinson Bayou (TCEQ Segment 1103).
This data was needed by TCEQ for refinement of ongoing TMDL modeling associated with this
segment to better understand nutrient and associated dissolved oxygen dynamics. In particular
this data is needed to derive needed input for the Environmental Fluid Dynamics Code (EFDC)
model (Tetra Tech Inc. 2006, 2007a, b).
Study Area
The study area is located within TCEQ Segment 1103, Dickinson Bayou Tidal. This segment is
part of the Dickinson Bayou watershed which is located within the San Jacinto-Brazos Coastal
Basin. Dickinson Bayou originates near the city of Alvin, south of Houston, and flows east
through Dickinson before discharging into Dickinson Bay, a tributary of the Galveston Bay
system (
Figure 1). Dickinson Bayou is a 22.7 mile long. The Dickinson Bayou watershed has a drainage
area of 105 square miles (Dickinson Bayou Watershed Partnership 2009). It encompasses
portions of nine cities (Alvin, Dickinson, Friendswood, Kemah, League City, Manvel, San Leon,
Santa Fe and Texas City) and two counties (Galveston and Brazoria).
Dickinson Bayou is composed of two TCEQ “designated” segments: the non-tidal portion,
Segment 1104, which is approximately 7 miles in length, and the tidally influenced portion,
Segment 1103 (Dickinson Bayou Watershed Partnership 2009). The Texas Surface Water
Quality Standards describe the non-tidal Segment 1104 as flowing “from a point 4.0 km (2.5
miles) downstream of FM 517 in Galveston County to FM 528 in Galveston County” (30 TAC
§307, Appendix C). The tidal segment, 1103, is defined as located “from the Dickinson Bay
confluence 2.1 km (1.3 miles) downstream of SH 146 in Galveston County to a point 4.0 km (2.5
miles) downstream of FM 517 in Galveston County”.

14 Sedimentation Study of Dickinson Bayou Tidal (Segment 1103)
Figure 1. Dickinson Bayou, Texas watershed depicting TCEQ designated segment boundaries and watershed
area. Map source: (Dickinson Bayou Watershed Partnership 2009).
The climate in the Dickinson Bayou watershed is classified as subtropical, which is defined as
having hot, humid summers and dry winters. The Dickinson Bayou watershed is within the Gulf
Coastal Prairies and Marshes ecoregion, an area characterized as containing nearly level, un-
dissected plains with native vegetation types composed of tall grass prairie and post oak savanna
(Dickinson Bayou Watershed Partnership 2009). About 55% of the watershed is within the 100-
year flood plain (the area of the flood plain which has a 1% chance of flooding in any given
year). Two major irrigation canals (the Gulf Coast Water Authority’s American Canal and
Galveston System) cross the watershed (Dickinson Bayou Watershed Partnership, 2009).
Dickinson Bayou is perennial throughout most of its course. Dickinson Bayou Above Tidal
(Segment 1104) is a small coastal prairie stream. Flow in the uppermost reaches of Segment
1104 is sustained by wastewater effluent generated southeast of the City of Friendswood
(WQ0013632-001 Meadowland Utility Corp. and WQ12935-001 K.C. Utilities-Pine Colony).
Rainfall runoff from rural creeks and ditches north of the City of Alvin and south of the City of
Friendswood results in large seasonal flow variations. Flow velocities are typical of a shallow
coastal prairie stream but decrease dramatically downstream of the confluence with Segment
1103 as depth increases and the stream becomes tidally influenced.
The entire Dickinson Bayou watershed has been undergoing increased drainage modification and
urbanization over the past 20 years (Dickinson Bayou Watershed Partnership 2009). Dickinson
Bayou above Tidal has been highly modified, and serves as a portion of the water conveyance

15 Sedimentation Study of Dickinson Bayou Tidal (Segment 1103)
system for the Galveston County Consolidated Water Drainage District. Rice farming in the area
created many diversion canals in this segment. Prior to 1990, irrigation return flows from rice
farming and other irrigated row crop production in this portion of the watershed also produced
high seasonal flows (Texas Water Quality Board (TWQB) 1976). Since 1990, rice farming has
diminished significantly in this portion of the watershed and irrigation return flows currently
account for only a small portion of flow in the segment. Within the watershed, the major land
development is concentrated in Segment 1103 around the cities of Dickinson and League City
and along the Interstate 45 corridor. The remainder of the watershed is rural and undeveloped.
Commercial development is light to medium industrial and office warehouses along with retail
merchandizing. The dominant land use classification for the Dickinson Bayou watershed is open
space/agriculture (≤1 dwelling unit per 20 acres), which accounts for approximately 50% of land
use in the watershed (Dickinson Bayou Watershed Protection Plan, 2009).
There are five active discharge permits in Dickinson Bayou for domestic wastewater (sewage)
treatment facilities and five active permits for discharge of industrial wastewater (Texas
Commission on Environmental Quality 2008c, Dickinson Bayou Watershed Partnership
2009)(Table 1 and Figure 2). The permit issued to Galveston County WCID #1 allows the largest
discharge of wastewater into Dickinson Bayou at 4.8 million gallons per day (MGD). The next
largest permitted discharge is for 0.95 MGD held by R. West Development Co., Inc. although
this facility is not currently in operation. The remaining permitted domestic wastewater facilities
currently in operation in the watershed each have permitted flows below 0.1 MGD.
As previously mentioned, Dickinson Bayou tidal has experienced low dissolved oxygen levels
which do not support the designated aquatic life uses (Houston Galveston Area Council 2006,
Texas Commission on Environmental Quality 2008a, c). Various factors influence dissolved
oxygen dynamics in surface water bodies, including in-situ production, biochemical oxygen
demand (BOD), point and non-point source pollution, reaeration, sediment oxygen demand,
suspended sediments and sedimentation, temperature, and streamflow/tidal regime. However,
other factors that control the deposition of sediment in surface water bodies also affect dissolved
oxygen dynamics indirectly. The water quality of the tidal portion of Dickinson Bayou can also
change due to changes associated with tidal movement and changing salinity regime. Salinity in
this portion of the bayou near the study area have ranged between 0.2 and 16.9 ppt with a median
value of 6 ppt (Houston Galveston Area Council 2006). Salinity is however vertically stratified
and may form a distinct halocline (salt wedge) which can alter the vertical movement of some
dissolved and suspended constituents. For example, the presence of a salt wedge is also often
associated with a “turbidity maximum,” which is a zone of maximum sediment flocculation and
deposition due to cancellation of particle charges and deposition of fine sediments (Dyer 1997).
The turbidity maximum is a zone of high concentrations of suspended sediment, higher than in
the river or in the estuary, downstream. Turbidity maxima are located at, or near, the head of the
tidal salt intrusion. Historical data collected in the tidal portion of Dickinson Bayou has
documented the presence of a distinct vertical salinity gradient which is most pronounced during
dry weather and low streamflow (Houston Galveston Area Council 2006).

16 Sedimentation Study of Dickinson Bayou Tidal (Segment 1103)
Table 1. Permitted wastewater facilities in the Dickinson Bayou watershed. Data sources: (Texas Commission on Environmental Quality 2008c) cited
in: (Dickinson Bayou Watershed Partnership 2009).
TPDES Permit Number Facility
Average
Discharge
2007 (MGD)
Permitted
Discharge
Limit (MGD)
CBOD5
(mg/L)
Total
Suspended
Solids (mg/L)
Ammonia-N
(mg/L)
Dissolved
Oxygen (mg/L)
Description of
Discharge
WQ0013632-001Meadowland Utility Corp 0.007 0.0234 10.0 15.0 3.0 4.0
Treated Domestic
Wastewater
WQ0012935-001
KC Utilities, Pine Colony
Wastewater Treatment
Facility
0.03 0.05 10.0 15.0 3.0 4.0Treated Domestic
Wastewater
WQ0014440-001
R. West Development Co
Incna 0.95 10.0 15.0 3.0 4.0
Treated Domestic
Wastewater
WQ0003416-000
West Management of
Texas, Inc.0.13 Report na na na na
Storm water/ground
water
WQ0010173-001Galveston Co. WCID1 2.26 4.8 7.0 15.0 1.5 6.0
Treated Domestic
Wastewater
WQ0000377-000
Penreco (outfall 001) 0.06 0.075
14.6
(lbs/day)
BOD 5
20.0 na na Process water
WQ0014570-001Marline Atlantis White na 0.5 5.0 15.0 3.0 4.0
Treated Domestic
Wastewater
WQ0014326-001CRVC Via Bayou LLC. 0.001 0.02 10.0 15.0 3.0 4.0
Treated Domestic
Wastewater
WQ0003749-000
Hillman Shrimp & Oyster
Co0.003 0.07 10.0 15.0 3.0 4.0 Process water
WQ0003479-000
Sea Lion Technology
(outfall 201)0.07 0.02 10 BOD 5 na 3.0 na
Treated Domestic
Wastewater
WQ0004086-000 Duratherm Inc. 0.08 Report na na na na Treated stormwater
WQ0014804-001South Central Water Co. na 0.95 10.0 15.0 3.0 4.0
Treated Domestic
Wastewater

17 Sedimentation Study of Dickinson Bayou Tidal (Segment 1103)
Figure 2. Location of permitted discharges within the Dickinson Bayou watershed. Map and data sources: (Dickinson Bayou Watershed Partnership
2009).

18 Sedimentation Study of Dickinson Bayou Tidal (Segment 1103)
Study Objective
The TCEQ concluded that additional data was needed for estimation of sedimentation rates,
including carbon and nutrients. This data will be used to develop sediment partitioning models
needed to conduct a TMDL. To obtain this information additional field collection of ambient
water, bulk stream bed sediment and recently deposited sediments was needed. Therefore plans
were made to collect these data in 2011 and if needed 2012 at several sites extending from the
upper to middle portions of the tidally influenced segment of Dickson Bayou (segment 1103).
This data will be used to determine sedimentation rates and associated water quality parameters
in the upper and middle portions of the tidally influenced segment of Dickinson Bayou (TCEQ
Segment 1103). This data was needed by TCEQ for refinement of ongoing TMDL modeling
associated with this segment to better understand nutrient and associated dissolved oxygen
dynamics. In particular this data is needed to derive needed input for the EFDC sediment process
model (Tetra Tech Inc. 2006, 2007a, b). The EFDC sediment process model incorporates three
basic processes including (1) depositional flux of particulate organic matter (POM), (2)
diagenesis of POM, and (3) the resulting sediment flux (DiToro and Fitzpatrick 1993, Park et al.
1995, United States Environmental Protection Agency 2005). The sediment model is driven by
net settling of particulate organic carbon, nitrogen, phosphorus, and silica from the overlying
water to the sediments (depositional flux).
The primary goal of this project is to collect necessary water, sediment and sediment chamber
data that will be used in future TMDL development tasks including refinement of the EFDC
model. The primary study objective of this project was to measure the total sediment and
organic carbon deposition rates at three separate areas of Segment 1103 during at least two
sampling events including a wet and dry weather event. In order to complete this objective, the
University of Houston Clear Lake – Environmental Institute of Houston (UHCL-EIH) collected
and analyzed total sediment and organic carbon deposited in sediment traps deployed in Segment
1103 during four sampling events, including two wet weather and two dry weather events, during
April-June 2011 and March-April 2012 in order to produce estimates of the sedimentation rates
and constants necessary to calibrate a dynamic water-sediment quality model. Ultimately due to
errors in laboratory analysis the majority of data used for this analysis was derived from the data
collected during the 2012 monitoring events. The furthest upstream location sampled was located
near the upper boundary with Segment 1104. This site was used to represent upper boundary
conditions within Segment 1103. The other two sites were located in the middle portion of the
Segment 1103, where depressed dissolved oxygen conditions have been documented. Additional
data on total nitrogen and phosphorus levels and flux rates were also measured and calculated for
recently deposited sediment. Particles size distribution in bottom sediment and sediment traps
were also determined to differentiate cohesive particles (<0.0625 mm) from non-cohesive
sediment (> 0.0625 mm)(Milburn and Krishnappan 2003, Huang et al. 2006). All field sampling
and laboratory analyses were conducted in accordance with the project’s quality assurance
project plan (QAPP)(Guillen 2012).

19 Sedimentation Study of Dickinson Bayou Tidal (Segment 1103)
Methods
Site Selection and Description
The sampling design rationale for this study was to select several sites within the water body,
extending from the upper portion to the middle portion of Segment 1103 (Table 2 and Figure 3).
These represent main-stem sites and include three previously established TCEQ monitoring
stations that have been used to assess water quality in Dickinson Bayou in the past. The use of
these three sites provides critical information on intra-bayou variability and spatial trends in
measured water and sediment quality variables. This is extremely important for deriving
important process variables that will be used in future modeling efforts. These locations span the
upstream extent of the tidal portion of this water body and are located at mid-stream near the
thalweg and deepest portion of the stream. These sites were selected in consultation with the
TCEQ project manager to insure that data collected during this effort is representative of stream
conditions.
Table 2. Location of sampling sites on Dickinson Bayou.
Site TCEQ Site
ID Site Description Latitude Longitude TCEQ
Segment 1 11464 Dickinson Bayou tidal at Arcadia-Cemetery Road north of Arcadia 29.429613 -95.114744 1103 2 18649 Dickinson Bayou 1.20 km upstream of I 45 Bridge and 140 M
downstream of County Ditch No 9 Confluence NR Chapparal Rec Assn Golf Club at Ave J
29.439848 -95.082001 1103
3 11461 Dickinson Bayou Tidal at Benson Bayou Confluence 29.456511 -95.057452 1103

20 Sedimentation Study of Dickinson Bayou Tidal (Segment 1103)
Figure 3. Location of sedimentation sampling sites in Dickinson Bayou. (refer to Table 2 for site descriptions).

21 Sedimentation Study of Dickinson Bayou Tidal (Segment 1103)
Sampling Dates
Between April and June of 2011, UHCL collected water, suspended sediment and bottom
sediment samples in Dickinson Bayou as part of this project and under the version of the
project’s QAPP document approved in March of 2011 (Table 3). Although the water and bottom
sediment samples collected by UHCL were analyzed in accordance with the methods specified in
the QAPP, several of the results of the analyses of suspended sediment samples did not meet the
quantification limits and/or the precision requirements specified in the (2011) QAPP. Moreover,
the analysis of particle-associated total carbon (TC) and total organic carbon (TOC) collected
during the wet weather event of June 24, 2011 was not usable, because the wrong method was
used to analyze these samples (i.e., the samples were analyzed as water samples instead of
sediment samples).
UHCL re-sampled the settled sediment under one dry and one wet weather condition in March
and April 2012 to collect the data to replace the 2011 data that was rendered un-useable due to
the laboratory deficiencies and non-conformances described above. Two sampling events
occurred during a period of relatively low flows, stable water levels and no precipitation for at
least 3 days prior to sample collection (Table 3). The other two sampling events occurred during
wet weather conditions. Wet weather was considered an event where recent rainfall was
sufficient to increase water levels and increase suspended sediment within a short period of time
(a single or prolonged storm event within a 24 hour period which produced observable storm
influenced hydrology such as increased downstream velocity and rise in water level). Ambient
water sampling was also conducted during all events. Duplicate ambient water and sediment trap
samples were collected at each site. During 2011, bulk stream bed samples were also collected
once during dry weather conditions.

22 Sedimentation Study of Dickinson Bayou Tidal (Segment 1103)
Table 3. Sampling dates, sites and sample types collected during the Dickinson Bayou sedimentation study. River kilometers (km) are approximate and
based on GIS analysis.
Date Wet/ Dry Site Number TCEQ Station ID Site Description Lati tude Longiti tude River kmSediment
Sample
Water
Sample
Sediment
Trap
Sample
1 11464 Dickinson Bayou at Cemetary Road 29.42961 - 95.114744 21.21 X X X
2 18649 Dickinson Bayou at Ditch # 9 29.4398 - 95.082000 17.42 X X X
3 11461 Dickinson Bayou downstream of Bensons Bayou 29.45651 - 95.057452 14.00 X X X
1 11464 Dickinson Bayou at Cemetary Road 29.42961 - 95.114744 21.21 X X
2 18649 Dickinson Bayou at Ditch # 9 29.4398 - 95.082000 17.42 X X
3 11461 Dickinson Bayou downstream of Bensons Bayou 29.45651 - 95.057452 14.00 X X
1 11464 Dickinson Bayou at Cemetary Road 29.42961 - 95.114744 21.21 X X
2 18649 Dickinson Bayou at Ditch # 9 29.4398 - 95.082000 17.42 X X
3 11461 Dickinson Bayou downstream of Bensons Bayou 29.45651 - 95.057452 14.00 X X
1 11464 Dickinson Bayou at Cemetary Road 29.42961 - 95.114744 21.21 X X
2 18649 Dickinson Bayou at Ditch # 9 29.4398 - 95.082000 17.42 X X
3 11461 Dickinson Bayou downstream of Bensons Bayou 29.45651 - 95.057452 14.00 X X
April 20-
May 5, 2011
June 22- 24,
2011
March 20-
22, 2012
April 24- 27,
2012
Dry
Wet
Wet
Dry

23 Sedimentation Study of Dickinson Bayou Tidal (Segment 1103)
Sampling Methods
Precipitation and Stream Stage
The primary source of information on forecasts, current and historical weather used for this study
was the National Weather Service. Data on precipitation that occurred prior to and during
sampling was obtained from the League City National Weather Service (NWS) Station
(DickinsonWFO:http://www.srh.noaa.gov/productview.php?pil=HGXCF6HGX&version=9&ma
x=61). This site is located close to the three project sampling sites. Rainfall at this station is
considered representative of the Dickinson Bayou watershed and has been used in previous
hydrological and water quality studies (East and Hogan 2006). Data from at least the previous 7
days prior to sampling was compiled to document site conditions. Wet weather conditions
occurring after significant local thunderstorms were targeted for two of the sampling events. We
attempted to conduct wet weather sampling during the period after the peak flow occurring
during the descending portion of the hydrograph. Wet weather is broadly defined as a rain event
within the watershed that causes a significant rise in water levels in the tidal portion of Dickinson
Bayou. We mobilized monitoring resources and deployed sediment traps whenever a storm had
occurred where a single or prolonged storm event within a 24 hour period which produced
observable storm influenced hydrology such as increased downstream velocity and rise in water
level after a period of at least 72 hours without rain. The instrumentation and sediment traps
were deployed as soon as possible after peak flows were observed.
Relative water level (gage height) was measured at the Dickinson Bayou at a previously installed
continuous monitoring TCEQ station deployed at a bridge on State Highway 3 (see Figure 3 for
location of State Highway 3 in relation to the sampling stations). The primary intent of water
level monitoring is to document and validate hydrological conditions during each sampling
event. The gage site on State Highway 3 is tidally influenced. Gage height (stage) is defined as
the water surface measured in feet above a local reference point, or “gage datum.” For the
Dickinson Bayou the gage datum was arbitrarily chosen and referenced to a temporarily installed
staff gage nearby. Gage height data was measured using pressure transducers manufactured by
In-Situ Inc. A vented pressure transducer, level TROLL 500, was used (In-Situ Inc. 2010) to
measure water levels. These instruments are extremely sensitive to changes in water depth, with
accuracy of 1 cm or less (0.1% full-scale) (In-Situ Specification sheet, http://www.in-
situ.com/force_download.php?file=985, accessed July 2010 and In-Situ Inc. 2010). Water level
was electronically recorded at 15-minute intervals by internal data-collection software over the
period of surveillance. Data was downloaded from the instruments into a computer using the
Win-Situ software package and processed and analyzed for trends.
Because a stage-discharge relationship cannot be developed for Dickinson Bayou at State
Highway 3, due to the fact that the bayou is tidally influenced in this location and also due to the
non-standard methodology used to obtain data for relative stage measurements, this data was not
reported to the TCEQ’s SWQMIS database.
In addition, metallic staff gages were installed at each of the monitoring sites to evaluate relative
24 Sedimentation Study of Dickinson Bayou Tidal (Segment 1103)
water levels during each sampling event. These values were standardized, that is an initial
reading was set to zero and all subsequent measurements converted to differences from the initial
reading or delta values, to increase the comparability of site readings with TROLL gage
readings.
Streamflow and Water Quality Sampling
The project included simultaneous monitoring of streamflow, ambient water, bottom sediment,
and suspended sediment deposition samples collected from static sampling tubes (i.e., sediment
traps) at three sites during four sampling events in Dickinson Bayou. The University of
Houston-Clear Lake followed the field sampling procedures documented in the TCEQ Surface
Water Quality Monitoring Procedures Volume 1: Physical and Chemical Monitoring Methods
for Water, Sediment and Tissue for the collection of hydrology, ambient water quality and
bottom stream sediments (Texas Commission on Environmental Quality 2008b). Amounts of
sample required, containers, preservation and holding time are listed in Table 4. Additional field
sampling procedures outlined in this section reflect specific monitoring requirements under this
TMDL Project. These additional procedures are consistent with TCEQ field sampling
procedures. All sampling was conducted in accordance with the project QAPP.
During deployment and retrieval of sediment traps, and collection of water and stream sediment
samples, vertical profiles of water quality, including water temperature, conductivity, salinity,
pH and dissolved oxygen were conducted with a multi-parameter water quality meter to
characterize site conditions that might affect ambient samples. Surface turbidity was
characterized using a secchi tube and a nephelometer. Stream velocity profiles and streamflow
were estimated using a Sontek River Surveyor M9 instrument (SonTek/YSI 2009). Multiple
velocity transects were conducted at each monitoring site which yielded replicate stream velocity
profiles and streamflow estimates. Stream velocity profiles were extracted and total streamflow
(Q) was estimated for each transect using Sontek River Surveyor Live v.1 software. Average
streamflow (Q) was then calculated using this information.

25 Sedimentation Study of Dickinson Bayou Tidal (Segment 1103)
Table 4. Field sampling and handling procedures used during the project, including container types,
minimum sample volume, preservation requirements, and holding times (Texas Commission on
Environmental Quality 2007, 2008b).
Parameter Matrix Container
Preservation
(includes Ice)
Sample
Volume
Holding
Time
Residue, Total
Nonfilterable
water Plastic or glass Cool to < 6°C but not
frozen
1000 ml 7 days
Volatile
Suspended Solids
water Plastic or glass Cool to < 6°C but not
frozen
1000 ml 7 days
Carbon,
Dissolved
Organic, DNPC
(DOC)
Water Plastic or glass 2 mL 1:1 H2SO4 to pH
< 2 and cool to < 6oC
but not frozen
100 ml 28 days
Carbon, Total
Organic, NPOC
(TOC)
water Plastic or glass 2 mL 1:1 H2SO4 to pH
< 2 and cool to < 6oC
but not frozen
100 ml 28 days
Solids Volatile in
sediment Sediment &
Sediment Trap
Plastic or glass Ice, Cool to < 6°C,
dark
500 grams 28 days
Total Organic
Carbon Sediment &
Sediment Trap Plastic or glass Ice, Cool to < 6°C,
dark
500 grams 28 days
Total Carbon Sediment &
Sediment Trap Plastic or glass Ice, Cool to < 6°C,
dark
500 grams 28 days
Solids in
sediment, percent
by weight (dry)
Sediment &
Sediment Trap Plastic or glass Ice, Cool to < 6°C,
dark
500 grams 28 days
Phosphorus
Total, Bottom
Deposits
Sediment &
Sediment Trap Plastic or glass Ice, Cool to < 6°C,
dark
500 grams 28 days
Organic
Phosphorus,
Total, Bottom
Deposits
Sediment &
Sediment Trap Plastic or glass Ice, Cool to < 6°C,
dark
500 grams 28 days
Nitrogen,Total,
Bottom Deposits
Sediment &
Sediment Trap Plastic or glass Ice, Cool to < 6°C,
dark
500 grams 28 days
Organic
Nitrogen, Total,
Bottom Deposits
Sediment &
Sediment Trap Plastic or glass Ice, Cool to < 6°C,
dark
500 grams 28 days
Silica Sediment &
Sediment Trap Plastic or glass Ice, Cool to < 6°C,
dark
500 grams 28 days
Sediment Particle
Size
Sediment &
Sediment Trap Plastic or glass Ice, Cool to < 6°C,
dark
500 grams 28 days
26 Sedimentation Study of Dickinson Bayou Tidal (Segment 1103)
Stream Sediment Collection
Stream bed sediment samples were collected during dry weather events in 2011 using either an
Ekman or Ponar dredge following standard sediment sampling methods (Texas Commission on
Environmental Quality 2008b)(Table 4). These water quality and sediment bed samples were
collected in part to evaluate the comparability and representativeness of data obtained from
sediment traps and to develop estimates for model processes. Clean sampling containers were
provided by the contract laboratory.
Sediment Deposition Sampling
Sediment trap sampling procedures used in this study to estimate sediment and carbon flux rates
are not listed in the current TCEQ standard monitoring procedures manuals (Texas Commission
on Environmental Quality 2008b). Instead, we adopted and used, with minor modifications, a
research method developed by the USGS for sediment trap sampling (Kiesling 2006, Roussel et
al. 2007). The USGS study was conducted under contract to the TCEQ and had an approved
QAPP (Kiesling 2006). The non-standard protocols used in this project included the estimation
of volume and settling velocity of suspended solids and organic carbon. To accomplish this
sedimentation traps were used to estimate carbon flux from the euphotic zone into bottom waters
and general sedimentation rates. Sediment traps typically collect dead phytoplankton and
zooplankton, fecal pellets of zooplankton and fish, sediment, and detritus. All of these items
contribute to the total amount of suspended solids that ultimately settle out of the water column.
Sedimentation is the vertical rate of flux of particulate materials from the water column to the
solid bed underlying it. The rate at which material settles in the water column is of critical
importance to estimates of material flux and algal mortality within the context of water quality
models. Sedimentation rates represent the transport of particulate chemical species vertically
through the water column with the assumption that these materials reach the sediments.
Sediment traps were used to measure the deposition of particulates over a set period by
integrating particle rain through time inside the trap chamber.
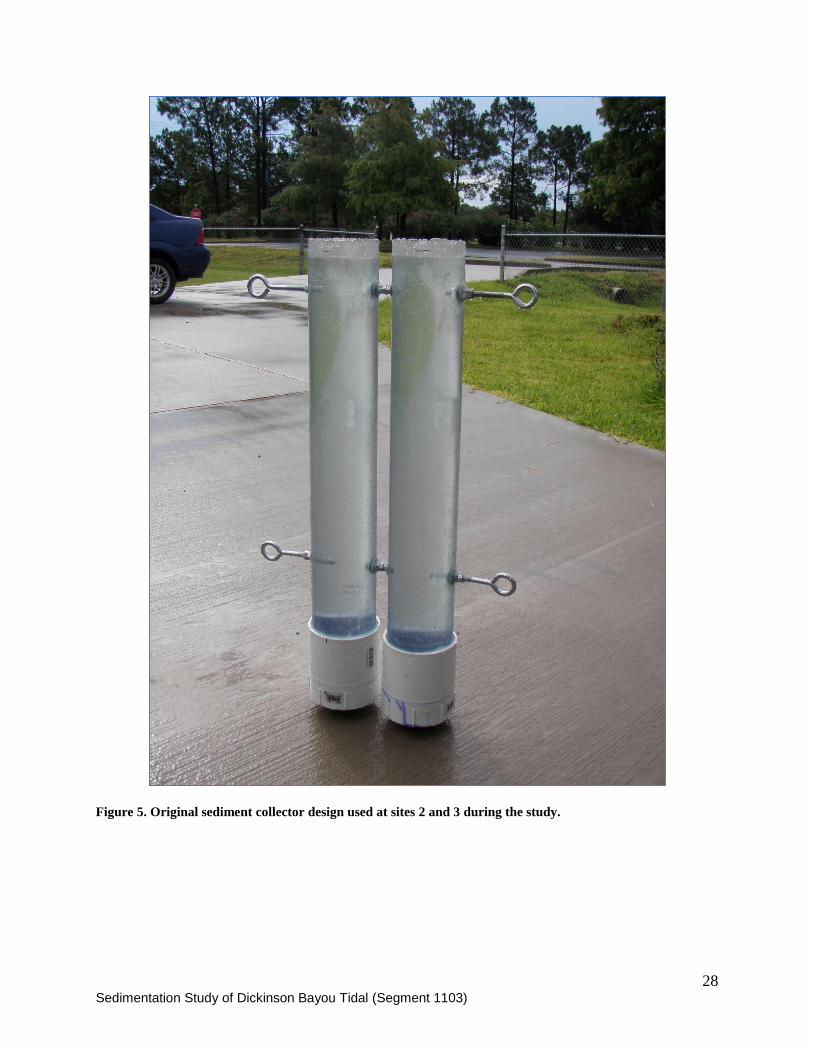
The sediment sampler used in this study was modeled after units used by the USGS on the
Arroyo Colorado (Kiesling 2006, Roussel et al. 2007)(Figure 4). Our original sediment collector
consisted of two cylindrical sediment traps connected together. Cylindrical traps of similar ratios
(diameter:length) have been shown to produce the most accurate vertical sedimentation rates
(Bale 1998). Based on the scientific literature the recommended ideal ratio is 1:7
(diameter:length) which is the ratio we used (Hargrave and Burns 1979, Bloesch and Burns
1980, Mudroch and MacKnight 1994). Our traps were constructed with clear PVC to facilitate
visual inspection of the contents (Figure 5). This sampler design was used at sites 2 and 3 and is

27 Sedimentation Study of Dickinson Bayou Tidal (Segment 1103)
described in the following pages along with its physical dimensions including surface areas and
volumes.
Figure 4. Sedimentation chambers used during USGS studies (Roussel, et al. 2007).
28 Sedimentation Study of Dickinson Bayou Tidal (Segment 1103)
Figure 5. Original sediment collector design used at sites 2 and 3 during the study.

29 Sedimentation Study of Dickinson Bayou Tidal (Segment 1103)
Original sedimentation collector
1 collector = two large tube traps bound together
Surface opening inner diameter of one tube trap = 4.00” = 10.16 cm; radius = 5.08 cm
Height of a trap = 71.12 cm
Ratio D/H of trap = 10.16/71.12 = 1/7 = 0.143
Surface area of trap opening = πr2 (area of circle) = π* (5.08)
2 = 81.07319 cm
2 = 0.0081073 m
2
Total surface area of openings for 2 trap tubes = 1 collector = (πr2* 2) = 81.07319 cm
2 * 2 = 162.1464 cm
2 =
0.0162146 m2
Inner cylinder surface area of trap = (πr2 * 2 = area of ends) + (2πrh =area of the inner wall of tube trap) = (162.1464
cm2 ) + (2 * π * 5.08 cm*71.12 cm) = 2,270.05 cm
2
Total inner cylinder area for two trap cylinders = 4540.10 cm2
Total volume of one trap cylinder = πr2h = π (5.08)
2(71.12) = 5,765.93 cm
3 = 5.76593 L
Total volume of two trap cylinders = 1 collector = 2 * 5,765.93 = 11,531.85 cm3 = 11.53185 L
Shallow water sedimentation collector
Due to shallow depths encountered at site 1, UHCL/EIH re-engineered the sediment collector
array used at this site by reducing the total height of the tubes, using narrower tubes, but also
adding more tubes (eight) to the array (Figure 6). In addition, white PVC pipe was used, because
the clear was not readily available. The resulting dimensions, areas and volumes for each PVC
sediment trap tube and sampler (8 total tubes per sampler) were calculated using the formulas
below.
1 collector = 8 cylinder traps bound together
Inner Diameter of trap = 2.00” = 5.08 cm; radius = 2.54 cm
Height of trap = 14” = 35.56 cm
Ratio D/H of trap = 5.08/35.56 = 1/7 = 0.142
Surface area of opening of trap = πr2 = (area of circle) = π*(2.54)
2 = 20.2683 cm
2 = 0.0020268 m
2
Surface Area for opening of 8 cylinder traps = 8* 20.2683 = 162.1464 cm2 = 0.0162146 m
2
Inner cylinder surface area = (πr2 = area of circle) x 2 + (2πrh = area of side) = 608.04 cm
2
Total inner cylinder surface area of 8 cylinders in one sampler = 4,864.3918 cm2
Total volume for one cylinder trap = πr2h = π(2.54)
2(35.56) = 720.7407 cm
3 = 0.0720740 L
Total volume for all 8 cylinder traps = one collector = 5765.9256 cm3 = 5.765926 L

30 Sedimentation Study of Dickinson Bayou Tidal (Segment 1103)
Figure 6. Alternative shallow water sediment sampler used at site 1 (TCEQ Station 11464).
The samplers, consisting of paired sediment traps or bundled, were suspended near the
sediment/water interface by attaching them to a line that had floats on the surface and a weight at
the bottom to keep the samplers vertical. At each site, duplicate samplers were deployed within
10-20 feet of each other. After a specified period of time, approximately 120 hours for dry
weather and 48 hours for wet weather the traps were retrieved. For wet weather events we
attempted to collect sediment throughout the declining portion of the hydrograph since
suspension and deposition of sediments will vary asymmetrically due to hysteresis (Knighton
1998). The exact time of deployment and retrieval were noted for each trap to allow for the
computation of a flux. For retrieval, traps were pulled to the surface, ensuring the collectors
remained vertical. The cylinders were then emptied into 7.6-liter carboys. Distilled water was
used to rinse the cylinders as needed to ensure that all solid material collected was transferred to
the carboys. The number of carboys needed per replicate sampler and site varied but were noted
in the chain of custody records. These 7.6 liter carboys were delivered to the laboratory for
chemical and physical analysis of settled material and sediment. Prior to analysis, the contents
from each carboy within each replicate sample were composited to yield one composite sample
per replicate sampler per site.

31 Sedimentation Study of Dickinson Bayou Tidal (Segment 1103)
Figure 7. Flow chart showing the routine processing of sediment deposition collector samples during the
study.
Laboratory Analysis
Ambient water, stream bed sediment and sediment collector samples were submitted to the
primary contract laboratory, Eastex Environmental for measurement of chemical and physical
variables listed in Table 5. The material in the carboys was allowed to settle and the overlying
supernatant was decanted. The settled material was transferred to centrifuge vials and
centrifuged for a period of at least 10 minutes. The centrifuge vials was decanted and their
settled content transferred manually to trays of known weight. The samples were dried and
weighed to obtain dry weights. The samples were then analyzed for their physical and chemical
composition (Figure 7).
For some parameters, the samples were sent from Eastex Environmental to subcontract
laboratories operated by Anacon and Accutest. Particles size distribution in bottom sediment and
sediment traps was determined by the laboratory to differentiate cohesive particles (<0.0625
mm) from non-cohesive sediment (> 0.0625 mm)(Milburn and Krishnappan 2003, Huang et al.
2006). Sediment cohesiveness is one of the major parameters evaluated by the EFDC model.
Replicate Samplers Deployedat each sample site by EIH field team
Samplers Retrievedby EIH field team
Samples transferred to 2 gallon Nalgene Carboys by EIH field team
Site & Rep & (No. carboys)Site DB-1 Rep A (1), Site DB-1 Rep B (1) Site DB-2 Rep A (2), Site DB-2 Rep B (2) Site DB-3 Rep A (2), Site DB-3 Rep B (2)
Nalgene Carboys transferred to Sub-Contracted Eastex Environmental Laboratory
Nalgene bottles from same rep and site are composited.
Samples allowed to fully precipitate, water decanted by Eastex Env. Lab leaving remaining
slurry consisting primarily of sediment
Concentrated sediment slurry centrifuged into true sediments samples, then split for shipment to sub/sub-contract labs.
Parameters: TP, TN, TS, TVS, TON, TOP ran by Sub Contract lab:
Eastex Environmental Laboratory
Data sent to EIH for submittal
Parameters: Grain Size, Silicaran by Sub/Sub-Contract lab:
Anacon Laboratory
Data send to Eastex for submittal
Sediment Sampler Flow Chart
Eastex Laboratory reports data results to EIH for analysis and submittal to TCEQ
Parameters: TOC, TCran by Sub/Sub-Contract lab:
Acutest Laboratory.
Data sent to Anacon for submittal

32 Sedimentation Study of Dickinson Bayou Tidal (Segment 1103)
Data Analysis
Data collected during this study is provided in Appendices 2-4, including both information
reported to SWQMIS and non-standard parameters not reported to SWQMIS. Variables
measured during this study are summarized in tabular and graphical format in the following
sections. Graphical presentation of important variables by site, date, depth and rainfall/flow
regime are presented to facilitate comparison of site and collection conditions. This included the
use of boxplots to describe the distribution of data (Figure 08). Formal statistical correlation
analysis and regression analysis were also used to evaluate the relationship of selected variables.
All statistical analyses were conducted with the Minitab® statistical software package.
Figure 8. Description of boxplot used in report.
Calculated flux rates of sediment, organic carbon and nutrients were calculated from laboratory
values, duration of deployment and the surface area of the opening to the sediment collector
surface. The mass of collected material divided by the collection area and the deployment time
of the traps was used to compute the sedimentation flux. The quantity of material collected by
the sediment trap divided by the collection area and the time the traps were deployed gives the
sedimentation rate or particle flux (Equation 1).
Equation 1. Calculation of sedimentation flux rates
Weight/area/time (flux) = weight of accumulated sediment ÷ time sampler/collectors deployed ÷ area of sampler
opening
In addition, by analyzing the amount of sediment-associated nutrients and total carbon (TC) and
total organic carbon (TOC) we were also able to estimate the deposition rate of sediment-
associated organic carbon, and nutrients. Original and derived data including estimated flux rates
may be used as input for future TMDL models. The particular model that is being considered by
TCEQ for TMDL development is the Environmental Fluid Dynamic Code (EFDC) model (Tetra
Tech Inc. 2006, 2007a, b). Collected data will be used to estimate partitioning and sedimentation
rates of various forms of nitrogen, phosphorus, carbon, silica and suspended sediments. These
estimated rates of deposition are needed to run EFDC’s sediment process sub-model. In addition,
the potential influence of salinity gradients and associated estuarine sediment maxima and the
differential transport of suspended sediments throughout the stormwater hydrograph (hysteresis)
are discussed in the following sections.

33 Sedimentation Study of Dickinson Bayou Tidal (Segment 1103)
Table 5. Measurement performance specifications for water and sediment quality parameters evaluated
during the study.
Parameter Units Method Parameter
Codes Matrix AWRL
Limit of
Quan-
titation
(LOQ)
LOQ
Check
Standard
%Rec
Precision
(RPD of
LCS/
LCSD)
BIAS
(% Rec.
LCS/
LCSD
mean)
Laboratory
Performing
Analysis
Field Parameters
pH s.u. EPA 150.1and
TCEQ SOP v1 00400 Water NA NA NA NA NA field
DO mg/L EPA 360.1and
TCEQ SOP v1 00300 Water NA NA NA NA NA field
Specific
Conductance
(Conductivity)
uS/cm EPA 120.1and
TCEQ SOP v1 00094 Water NA NA NA NA NA field
Temperature C EPA 170.1and
TCEQ SOP v1 00010 Water NA NA NA NA NA field
Transparency,
Secchi Disc
(meters)
meters TCEQ SOP v1 00078 Water NA NA NA NA NA field
Days since last
significant
precipitation
Days TCEQ SOP v1 72053 Other NA NA NA NA NA field
Flow Stream,
Instantaneous
(cubic feet per
second)
cfs TCEQ SOP v1 00061 Water NA NA NA NA NA field
Flow
measurement
method
1-gage, 2-
electric, 3-
mechanical, 4-
weir/flume, 5-
doppler
TCEQ SOP v1 89835 Other NA NA NA NA NA Field
Flow Severity
1-no flow,2-
low,3-
normal,4-flood,
5-high,6-dry
TCEQ SOP v1 01351 Water NA NA NA NA NA Field
Salinity ppt SM 2520 and
TCEQ SOP v1 00480 Water NA NA NA NA NA Field
Depth of bottom
of water body at
sample site
Meters TCEQ SOP v2 82903 Water NA NA NA NA NA Field

34 Sedimentation Study of Dickinson Bayou Tidal (Segment 1103)
Parameter Units Method Parameter
Codes Matrix AWRL
Limit of
Quan-
titation
(LOQ)
LOQ
Check
Standard
%Rec
Precision
(RPD of
LCS/
LCSD)
BIAS
(% Rec.
LCS/
LCSD
mean)
Laboratory
Performing
Analysis
Conventional Parameters – Water
Residue, Total
Nonfilterable,
mg/l ***
mg/L SM 2540 D 00530 Water 4.0 1 NA 20 NA Eastex
Residue, Volatile
Nonfilterable
mg/l ***
mg/L EPA 160.4 00535 Water 4.0 1 NA 20 NA Eastex
Carbon,
Dissolved
Organic, DNPC
(DOC) mg/l
mg/L SM5310 00681 Water 1.0 1 70-130 20 70-130 Eastex
Carbon, Total
Organic, NPOC
(TOC) mg/l
mg/L SM5310 00680 Water 1.0 1 70-130% 20 70-130 Eastex
Conventional Parameters
Sediment trap and sediment*
Solids volatile in
sediment (%)*** % SM 2540 G 85207 Sed. NA 0.1 NA 20 NA Eastex
Total Solids
Collected (dry
weight)
mg NA NA** Sed. NA NA NA NA NA Eastex
Total Organic
Carbon,
NPOC(TOC),
Sed Dry Wt,
mg/kg
mg/kg EPA 9060 NA** Sed. NA 1000**** 70-130 20 70-130 ACCUTEST
Total Carbon ** mg/kg EPA 9060 NA** Sed. NA 1000**** 70-130 20 70-130 ACCUTEST
Solids in
sediment,
percent by
weight (dry) ***
% SM2540G 81373 Sed. NA 0.1 NA 20 NA Eastex
Phosphorus,
Total, Bottom
Deposits (mg/kg
dry wt.)
mg/kg SM 4500 P E 00668 Sed. NA 0.06**** 70-130 20 70-130 Eastex

35 Sedimentation Study of Dickinson Bayou Tidal (Segment 1103)
Parameter Units Method Parameter
Codes Matrix AWRL
Limit of
Quan-
titation
(LOQ)
LOQ
Check
Standard
%Rec
Precision
(RPD of
LCS/
LCSD)
BIAS
(% Rec.
LCS/
LCSD
mean)
Laboratory
Performing
Analysis
Organic
Phosphorus,
Total, Bottom
Deposits (mg/kg
dry wt.)**
mg/kg SM 4500 P E NA** Sed. NA 0.06**** 70-130 20 70-130 Eastex
Nitrogen, Total,
Bottom
Deposits(mg/kg-
n dry wt)
mg/kg SM 4500 NC 00603 Sed. NA 0.05**** 70-130 20 70-130 Eastex
Organic
Nitrogen, Total,
Bottom Deposits
(mg/kg-n dry wt)
mg/kg
SM 4500
N org A
NA** Sed. NA 0.05**** 70-130 20 70-130 Eastex
Silica ** ug/kg SW 846-6010 NA** Sed. NA 20,000***
* 70-130 20 70-130 Anacon
Sediment
prtcl.size class
>2.0mm gravel
%dry wt
% fraction ASTM422 80256 Sed. NA NA NA NA NA Anacon
Sediment
prctl.size class,sand .0625-
2mm % drywt
% fraction ASTM422 89991 Sed. NA NA NA NA NA Anacon
Sediment
prtl.size class.<
.0625 mm
silt and clay
%dry wt**
% fraction ASTM422 NA** Sed. NA NA NA NA NA Anacon
* Sediment trap data will not be reported to SWQMIS database; it was used to calculate model parameters. However the analytical methods are
identical to those shown for the (bottom sample) sediment analysis methods. ** No TCEQ parameter code available; only data with a valid TCEQ parameter code was stored in SWQMIS.
*** These parameters do not have LCS/LCSD associated with them. Where no LCS/LCSD is analyzed the RPD limit will apply to the precision
between sample and sample duplicate results. **** LOQ is the reportable value of the instrument in mg/L. Lowest reportable value for samples will vary depending on the percent solid of the
sample and the volume of the sample analyzed.
References for Laboratory Methodology:
(American Public Health Association (APHA) et al. 1998)
(American Society for Testing and Materials (ASTM) 2007)
(United States Environmental Protection Agency 1983)
(United States Environmental Protection Agency 2010)

36 Sedimentation Study of Dickinson Bayou Tidal (Segment 1103)
The methodology and data quality requirements used for development of the EFDC TMDL
model are outlined in the TCEQ-approved QAPP submitted to the TCEQ by the University of
Houston on October 6, 2010 and approved by the TCEQ on October 20, 2010 (Rifai 2010). The
sediment process sub-model, simulates the diagenesis and resulting fluxes of inorganic
substances (ammonium, nitrate, phosphate and silica) and sediment oxygen demand on the water
column of particulate organic matter deposited from the overlying water column (Tetra Tech Inc.
2007b). The coupling of the sediment process model with the water quality model not only
enhances the model's predictive capability of water quality parameters but also enables it to
simulate the long-term changes in water quality conditions in response to changes in nutrient
loadings.
Results
Meteorology and Hydrology
Precipitation and Stream Water Levels 2011
A major challenge faced by this study was the prolonged intense drought that had occurred in
Texas and continued throughout the initial study period from March to August 2011 (Figures 9
and 10). Beginning in October 2010, the Houston-Galveston region had been suffering from one
of the worst droughts on record (Houston Galveston Area Council 2012). Though the rains in
late 2011 and early 2012 made significant progress toward overcoming the rain deficit, as of
February 21, 2012, most of the region was still classified as being under drought conditions
(Houston Galveston Area Council 2012). The drought severity was moderate and increased to
exceptional levels by the end of the study period. We had established late June 2011 as the
deadline to accomplish the wet weather sampling during 2011 in order to allow time to obtain
laboratory analysis results and to conduct our data analysis and review and report preparation.
Rainfall recorded in the Dickinson Bayou watershed documents the influence of the drought on
precipitation and the occurrence of a minor rainstorm on June 22, 2011 (Figure 11).
It was very difficult to determine the response of Dickinson Bayou water levels to the wet
weather event during June 2011. Water levels, although elevated on June 22, 2011 during the
rainstorm event, were not outside the range of conditions previously observed during dry weather
conditions (Figures 13 and 14). Based on our analysis of tide and stream levels a large
percentage of the variation in fluctuations in water level was probably due to normal tide
fluctuation (Figures 15 and 16). During June 22, 2011, the highest water levels were recorded at
11:00 following peak rainfall amounts that morning (Figure 17). However, the fluctuation in
water level appears to be driven primarily by tidal variation (Figure 18). The observed pattern
suggests that there was a 1 ½ hour delay between high tide in Dickinson Bay and the observed
maximum water levels at Dickinson Bayou at SH 3. Therefore based on the observed rainfall
pattern, tide, and river levels it is likely that the rainstorm that occurred on June 22, 2011 only
slightly affected stream water levels.

37 Sedimentation Study of Dickinson Bayou Tidal (Segment 1103)
Precipitation and Stream Water Levels 2012
During 2012, precipitation appeared to increase over comparable periods in 2011 (Figure 19).
We identified and monitored one wet and one dry weather monitoring event during March and
April 2012, respectively. Water levels measured at State Highway 3 with the TROLL gage
increased in response to elevated rainfall during March 11, March 21, April 4, and April 16 and
April 20 (Figure 20). However, similar to monitoring results in 2011, stream water levels in
Dickinson Bayou were also strongly correlated with tide levels in Dickinson Bay.

38 Sedimentation Study of Dickinson Bayou Tidal (Segment 1103)
Figure 9. Drought severity index produced by USDA for March 2011. Dickinson Bayou was
within the moderate drought zone.

39 Sedimentation Study of Dickinson Bayou Tidal (Segment 1103)
Figure 10. Drought severity index for the wet weather sampling period starting June 21, 2011.
Dickinson Bayou was within the exceptional drought zone. Source: USDA.

40 Sedimentation Study of Dickinson Bayou Tidal (Segment 1103)
Figure 11. Daily precipitation recorded from 2/1/11 to 7/1/12 at the League City National
Weather Station, League City, Texas. Wet and dry weather monitoring dates are denoted by
blue and red dots respectively.
Figure 12. Standardized gage staff levels measured during 2011. Blue and red rectangles
denote dry and wet weather sampling periods respectively.
07/ 01/ 201106/ 01/ 201105/ 01/ 201104/ 01/ 201103/ 01/ 201102/ 01/ 2011
2.5
2.0
1.5
1.0
0.5
0.0
Date
Da
ily
Pre
cip
ita
tio
n (
in)
7/ 1/ 116/ 1/ 115/ 1/ 114/ 1/ 113/ 1/ 112/ 1/ 11
0.9
0.8
0.7
0.6
0.5
0.4
0.3
0.2
0.1
0.0
Date Collected
Sta
nd
ard
ize
d S
taff
Ga
ge
Le
vel
(m)
1
2
3
Station ID
Comparison of Standardized 2011 Gage Levels (m)

41 Sedimentation Study of Dickinson Bayou Tidal (Segment 1103)
Figure 13. Standardized staff gage levels versus cumulative 24 hour precipitation levels
recorded at the League City National Weather Station during monitoring conducted in 2011.
Figure 14. Standardized staff gage levels versus cumulative 3 day precipitation levels
recorded at the League City National Weather Station, during monitoring conducted in 2011.
2.52.01.51.00.50.0
6.5
6.0
5.5
5.0
4.5
4.0
24 hr Precipitation ( in)
Sta
ff G
ag
e L
ev
el
(ft)
11461
11464
18649
TCEQ ID
Standardized Gage Readings vs 24 hr Precipitation
2.52.01.51.00.50.0
6.5
6.0
5.5
5.0
4.5
4.0
3 day Precipitation ( in)
Sta
ff G
ag
e L
ev
el
(ft)
11461
11464
18649
TCEQ ID
Standardized Gage Readings vs. 3 day Precipitation

42 Sedimentation Study of Dickinson Bayou Tidal (Segment 1103)
Figure 15. NOAA Dickinson Bay tide gage and TROLL water level gage measurements at
HWY 3 during February 14 through September 29, 21011.
Figure 16. Relationship between NOAA tide gage (8771013 Eagle Point, TX) and water level
readings from the TROLL gage at SH 3, collected during 2011. (r) = 0.979; p-value = 0.000.
9/29
/ 11 2
2:30:
00
9/7/
11 4:
30:0
0
8/15
/ 11
10:30
:00
7/23
/ 11 1
6:30
:00
6/30
/ 11 2
2:30
:00
6/ 8/ 1
1 4:3
0:00
5/16
/ 11 1
0:30:
00
4/ 23/
11 16
:30:
00
3/31/
11 2
2:30
:00
3/9/
11 3
:30:
00
2/ 14/
11 10
:00:
00
1.5
1.0
0.5
0.0
- 0.5
Date
Tid
e D
ep
th a
nd
Re
lati
ve
Wa
ter
Le
ve
l (m
)
Troll Gage
Tide Gage
Variable
NOAA Tide Gage and Troll Water Level Gage Trends
1.000.750.500.250.00- 0.25- 0.50
1.6
1.4
1.2
1.0
0.8
0.6
0.4
0.2
0.0
Tide Depth (m)Re
lati
ve
Wa
ter
De
pth
(m
) M
ea
su
red
wit
h T
roll
Pro
be
Relationship of Tide Gage and Troll Water Level Gage Readings

43 Sedimentation Study of Dickinson Bayou Tidal (Segment 1103)
Figure 17. Water level fluctuations recorded at the SH 3 bridge with the TROLL gage on
June 22, 2011 during the wet weather sampling event.
Figure 18. Relationship of recorded water level with TROLL gage versus tide levels in
Dickinson Bayou recorded by the NOAA tide gage (8771013 Eagle Point, TX). Data suggests
a lag period of 1.5 hours between tide levels and water depth/levels measured at Hwy 3.
6/ 26/ 116/ 25/ 116/ 24/ 116/ 23/ 116/ 22/ 116/ 21/ 116/ 20/ 11
1.3
1.2
1.1
1.0
0.9
0.8
Date and Time
De
pth
(m
)
6/ 20/ 2011
6/ 21/ 2011
6/ 22/ 2011
6/ 23/ 2011
6/ 24/ 2011
6/ 25/ 2011
Date11:00 June 22
0:0020:0016:0012:008:004:000:00
1.4
1.2
1.0
0.8
0.6
0.4
0.2
Time
Le
ve
l (m
)
Depth (m)
Actual tide (m)
Variable
Water Depth vs. Actual tide - June 22, 2011
11:00
09:30
14:00
15:30

44 Sedimentation Study of Dickinson Bayou Tidal (Segment 1103)
Figure 19. Daily precipitation recorded from 3/1/112 to 4/20/12 at the League City
National Weather Station, League City, Texas. Wet and dry weather monitoring
dates are denoted by blue and red dots respectively.
Figure 20. Relationship of recorded water level with Troll level gage at Hwy 3 and
tide levels recorded at Eagle Point in Dickinson Bay by the NOAA (8771013 Eagle
Point, TX) tide gage. Areas in blue and red squares denote wet and dry weather
sampling periods. Pearson correlation ( r ) of tide (m) and depth (m) = 0.979 p-value
≤ 0.000.
05/ 01/ 201204/ 21/ 201204/ 11/ 201204/ 01/ 201203/ 21/ 201203/ 11/ 201203/ 01/ 2012
2.0
1.5
1.0
0.5
0.0
Date
Da
ily
Pre
cip
ita
tio
n (
in)
5/ 01/ 20124/ 21/ 20124/ 11/ 20124/ 01/ 20123/ 21/ 20123/ 11/ 2012
1.8
1.6
1.4
1.2
1.0
0.8
0.6
0.4
0.2
0.0
Date and Time
Re
lati
ve W
ate
r L
eve
l o
r D
ep
th (
m)
Tide (m)
Depth (m)
Variable

45 Sedimentation Study of Dickinson Bayou Tidal (Segment 1103)
Streamflow and Velocity Profiles 2011
During 2011 streamflow was elevated during June 22-24, 2011 when wet weather sampling was
conducted (Figure 21). However, streamflow at site 1, which is the furthest downstream, was
near zero or negative indicating a strong tidal influence or weak stream flow. The highest
streamflow was observed at site 3. In contrast the dry weather event monitored during April and
early May 2011 occurred during a period when streamflow was negative suggesting a strong
tidal (flood tide) influence.
We evaluated the velocity field generated from the ADCP during wet and dry weather sampling
in 2011 (Figures 21 - 33). During dry weather monitoring the majority of water columns at all
sites were dominated by negative flow velocities (Figures 22 - 27). The most extreme negative
velocities were generally observed at mid-depth and near the bottom. However, velocity
direction was often observed fluctuating horizontally and vertically. The fluctuating direction
may be indicative of the upstream extent of a salt wedge.
Streamflow and Velocity Profile 2012
During 2012 streamflow was elevated during March 20-22, 2012 when wet weather sampling
was conducted (Figure 21 and Table 6). These levels were even greater than those observed
during the June 2011 wet weather sampling event. Highest flows were observed at site 3 during
2012. In contrast, the dry weather event monitored during April 24 - 27, 2012 occurred during a
period when streamflow was low or negative suggesting a strong tidal (flood tide) influence.
We evaluated the velocity fields generated from the ADCP during wet and dry weather sampling
in 2012 (Figures 34- 44). During March 2012 the majority of velocity fields yield positive
values throughout the water column (Figures 34- 38). During dry weather monitoring the
majority of water column at all sites were dominated by negative flow velocities (Figures 39-
44). The most extreme negative velocities were generally observed at mid-depth. However,
velocity direction was often observed fluctuating horizontally and vertically. The fluctuating
velocity direction may be indicative of the upstream extent of a salt wedge influencing the
hydrology at the sites.

46 Sedimentation Study of Dickinson Bayou Tidal (Segment 1103)
Figure 21. Streamflow measured at each site during the study period. Blue boxplots and
areas in the rectangles represent wet weather sampling periods.
Table 6. Summary data on measured streamflow during 2011 and 2012 sedimentation
sampler deployment and retrieval periods.
Date
Site
4/27/ 2
012
4/24/ 2
012
3/22/ 2
012
3 /20/ 2
012
6/24 / 2
011
6/22 / 2
011
5/ 5/ 2
011
4/29/ 2
011
4 /25/ 2
011
4 /20/ 2
011
321321321321321321321321321321
30
20
10
0
- 10
- 20
To
tal
Q (
cfs
)
Deploy Retrieve Avg (both)
2011 Dry 1 -8.95 -0.471 -0.66
2011 Wet 1 -4.117 -0.983 -2.55
2011 Dry 2 -1.87 -3.107 -2.399
2011 Wet 2 8.12 2.95 5.54
2011 Dry 3 -2.26 -11.426 -7.35
2011 Wet 3 18.26 3.19 9.65
2012 Dry 1 -0.253 0.605 0.176
2012 Wet 1 8.957 2.1375 5.55
2012 Dry 2 -3.173 -3.07 -3.121
2012 Wet 2 18.073 2.93 15.04
2012 Dry 3 -6.27 -7.33 -6.799
2012 Wet 3 27.47 * 27.47
Average Flow
Year Type Site

47 Sedimentation Study of Dickinson Bayou Tidal (Segment 1103)
Figure 22. River surveyor velocity profiles obtained during site 1 dry weather sediment sampler deployment on April 20, 2011.
Track 2
Track 3
Track 4

48 Sedimentation Study of Dickinson Bayou Tidal (Segment 1103)
Figure 23. River surveyor velocity profiles obtained during site 2 dry weather sediment
sampler deployment on April 29, 2011.
Track 3
Track 4
Track 2
Track 1

49 Sedimentation Study of Dickinson Bayou Tidal (Segment 1103)
Figure 24. River surveyor velocity profiles obtained during site 3 dry weather sediment
sampler deployment on April 20, 2011.
Track 1
Track 2
Track 3
Track 4

50 Sedimentation Study of Dickinson Bayou Tidal (Segment 1103)
Figure 25. River surveyor velocity profiles obtained during site 1 dry weather sediment
sampler retrieval on April 25, 2011.
Track 1
Track 2
Track 3
Track 4
Track 5

51 Sedimentation Study of Dickinson Bayou Tidal (Segment 1103)
Figure 26. River surveyor velocity profiles obtained during site 2 dry weather sediment sampler retrieval on May 4, 2011.
Track 1
Track
Track 3

52 Sedimentation Study of Dickinson Bayou Tidal (Segment 1103)
Figure 27. River surveyor velocity profiles obtained during site 3 dry weather sediment
sampler retrieval on April 25, 2011.
Track 1
Track 2
Track 3
Track 4

53 Sedimentation Study of Dickinson Bayou Tidal (Segment 1103)
Figure 28. River surveyor velocity profiles obtained during site 1 wet weather sediment
sampler deployment on June 22, 2011.
Track 1
Track 2
Track 3
Track 4

54 Sedimentation Study of Dickinson Bayou Tidal (Segment 1103)
Figure 29. River surveyor velocity profiles obtained during site 2 wet weather sediment
sampler deployment on June 22, 2011.
Track 1
Track 2
Track 3
Track 4

55 Sedimentation Study of Dickinson Bayou Tidal (Segment 1103)
Figure 30. River surveyor velocity profiles obtained during site 3 wet weather sediment sampler deployment on June 22, 2011.
Track 1
Track 2
Track 3

56 Sedimentation Study of Dickinson Bayou Tidal (Segment 1103)
Figure 31. River surveyor velocity profiles obtained during site 1 wet weather sediment
sampler retrieval on June 24, 2011.
Track 1
Track 2
Track 3
Track 4

57 Sedimentation Study of Dickinson Bayou Tidal (Segment 1103)
Figure 32. River surveyor velocity profiles obtained during site 2 wet weather sediment
sampler retrieval on June 24, 2011.
Track 1
Track 2
Track 3
Track 4

58 Sedimentation Study of Dickinson Bayou Tidal (Segment 1103)
Figure 33. River surveyor velocity profiles obtained during site 3 wet weather sediment
sampler retrieval on June 24, 2011.
Track 1
Track 2
Track 3
Track 4

59 Sedimentation Study of Dickinson Bayou Tidal (Segment 1103)
Figure 34. River surveyor velocity profiles obtained during site 1 wet weather sediment
sampler deployment on March 20, 2012.
Track 1
Track 2
Track 3
Track 4
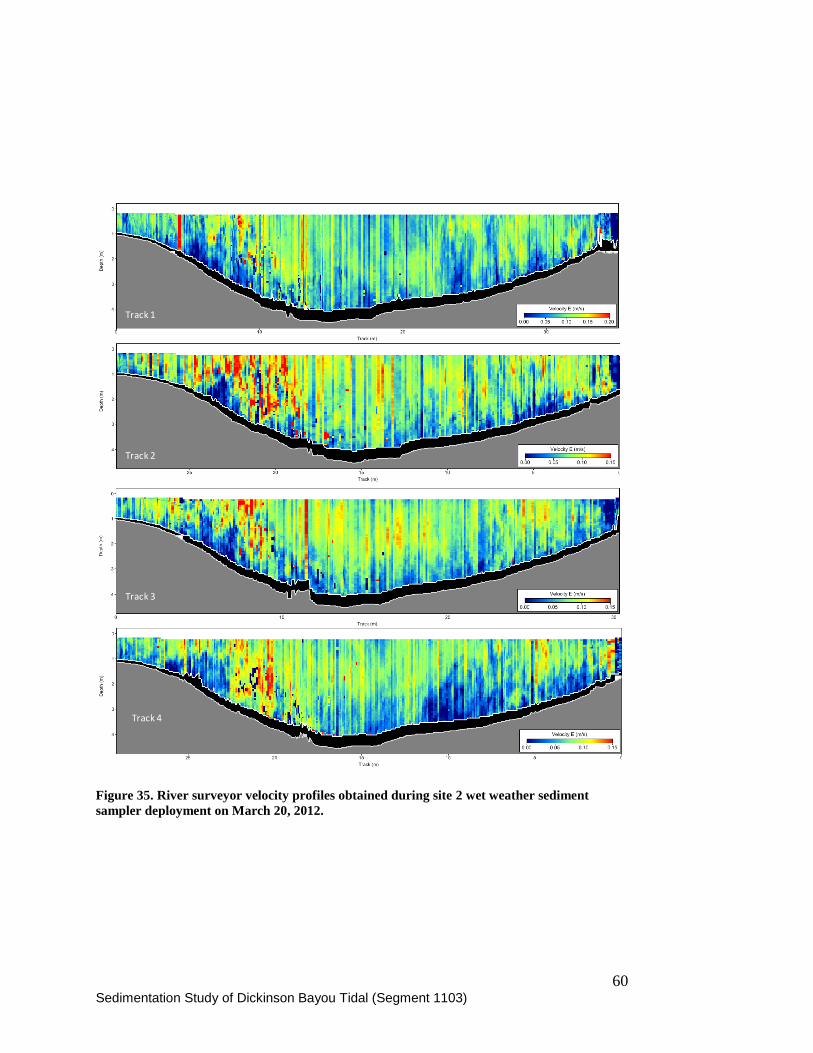
60 Sedimentation Study of Dickinson Bayou Tidal (Segment 1103)
Figure 35. River surveyor velocity profiles obtained during site 2 wet weather sediment
sampler deployment on March 20, 2012.
Track 1
Track 2
Track 3
Track 4

61 Sedimentation Study of Dickinson Bayou Tidal (Segment 1103)
Figure 36. River surveyor velocity profiles obtained during site 3 wet weather sediment sampler deployment on March 20, 2012. Only two transects
were monitored due to loss of battery power.
Track 1
Track 2

62 Sedimentation Study of Dickinson Bayou Tidal (Segment 1103)
Figure 37. River surveyor velocity profiles obtained during site 1 wet weather
sediment sampler retrieval on March 22, 2012. Flow samples were not taken at sites
2 and 3 due to loss of battery power.
Figure 38. River surveyor velocity profiles obtained during site 2 wet weather
sediment sampler retrieval on March 22, 2012. This site was incompletely sampled
due to loss of battery. Flow samples were not taken at site 3 due to continued loss of
power.
Track 1
Track 2
Track 3
Track 4

63 Sedimentation Study of Dickinson Bayou Tidal (Segment 1103)
Figure 39. River surveyor velocity profiles obtained during site 1 dry weather sediment
sampler deployment on April 24, 2012.
Track 1
Track 2
Track 3
Track 4

64 Sedimentation Study of Dickinson Bayou Tidal (Segment 1103)
Figure 40. River surveyor velocity profiles obtained during site 2 dry weather sediment
sampler deployment on April 24, 2012.
Track 1
Track 2
Track 3
Track 4

65 Sedimentation Study of Dickinson Bayou Tidal (Segment 1103)
Figure 41. River surveyor velocity profiles obtained during site 3 dry weather sediment
sampler deployment on April 24, 2012.
Track 1
Track 2
Track 3
Track 4

66 Sedimentation Study of Dickinson Bayou Tidal (Segment 1103)
Figure 42. River surveyor velocity profiles obtained during site 1 dry weather sediment
sampler retrieval on April 27, 2012.
Track 1
Track 2
Track 3
Track 4

67 Sedimentation Study of Dickinson Bayou Tidal (Segment 1103)
Figure 43. River surveyor velocity profiles obtained during site 2 dry weather sediment
sampler retrieval on April 27, 2012.
Track 1
Track 2
Track 3
Track 4
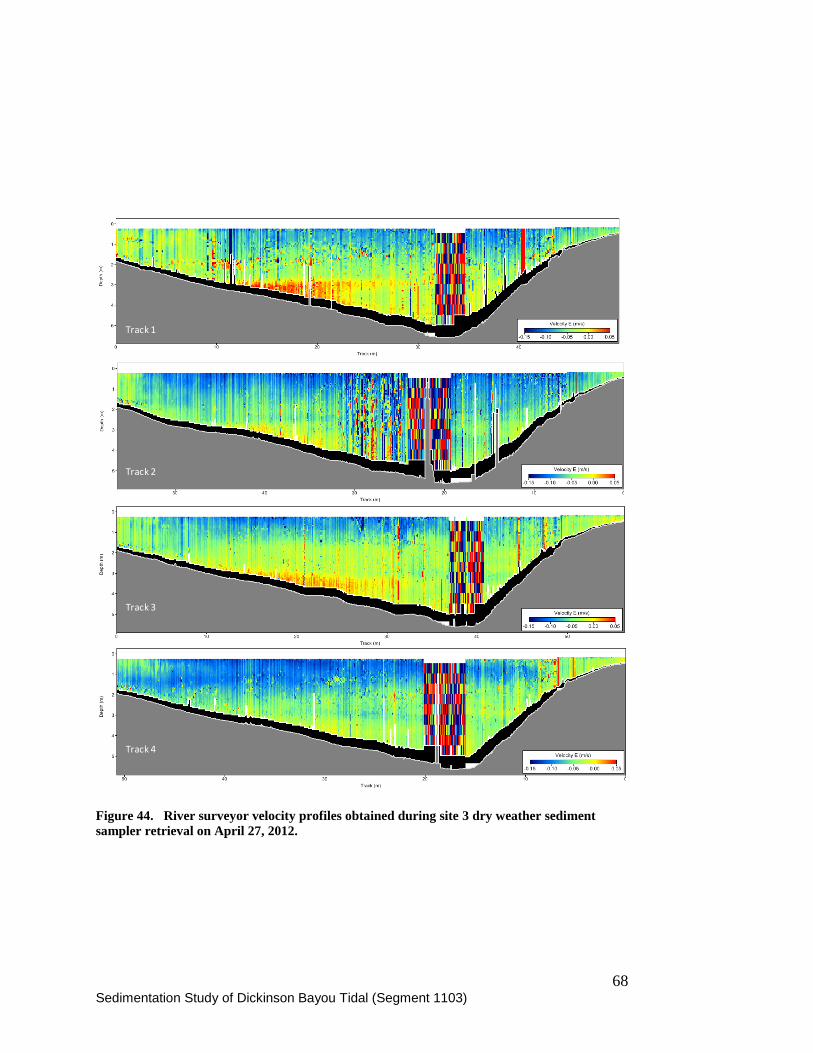
68 Sedimentation Study of Dickinson Bayou Tidal (Segment 1103)
Figure 44. River surveyor velocity profiles obtained during site 3 dry weather sediment
sampler retrieval on April 27, 2012.
Track 1
Track 2
Track 3
Track 4

69 Sedimentation Study of Dickinson Bayou Tidal (Segment 1103)
Water Quality Results
A summary of important water quality variables measured during the sedimentation study are
discussed below. Specific conductance (uS) and salinity (psu or ppt) generally increased in a
downstream direction from site 1 to 3 during 2011 (Figures 45 and 46). Specific conductance and
salinity also increased with depth, ranging between 1 to 3 PSU (ppt) from surface to bottom.
Interestingly, higher specific conductance and salinity in general were observed during the wet
sampling period in June 2011 versus the April-May 2011 dry period, further reinforcing the
concept that water fluctuations during the 2011 sampling events were more likely due to tidal
forcing versus runoff from rain. This may also reflect the movement of freshwater over marine
water.
During both years of the study, surface measurements of secchi disk transparency (SD) were
generally higher during dry versus wet weather periods at sites 1 and 2 (Figure 47). Little
difference was seen at site 3, the most downstream location. This provides evidence that, during
wet weather events, sediment loads were most likely higher causing lower transparency. Also,
the lower overall transparency values recorded in 2012, in contrast to 2011, indicates a higher
degree of sediment resuspension most likely due to elevated streamflow, but also possibly due to
higher overall primary productivity in the second year.
As expected, surface turbidity (NTU) followed similar spatial and temporal trends to secchi disk
transparency (Figure 48). During both years of the study, turbidity was generally lower during
dry versus wet weather periods at sites 1 and 2. Little difference was seen at site 3, the most
downstream location. This provides evidence that, during wet weather events, sediment loads
were most likely higher causing greater turbidity. Also, the higher overall turbidity values
recorded in 2012, in contrast to 2011, may indicate a higher degree of sediment resuspension
most likely due to elevated streamflow, but also possibly due to higher overall primary
productivity in the second year.
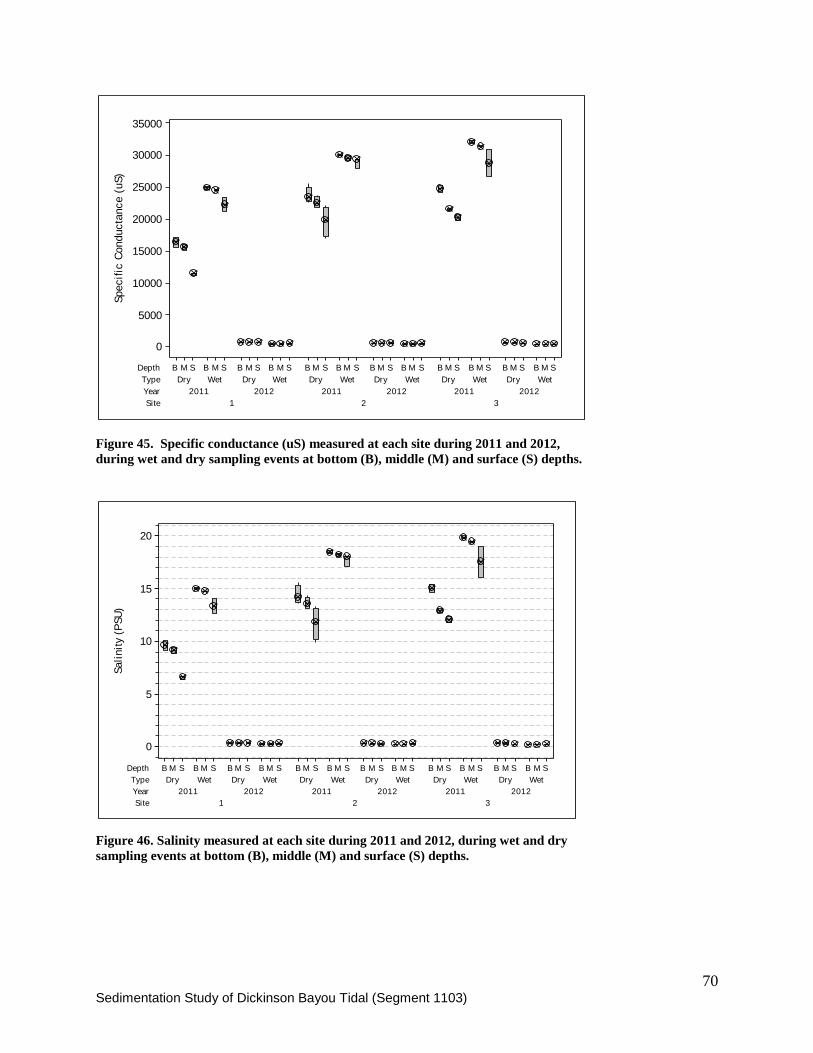
70 Sedimentation Study of Dickinson Bayou Tidal (Segment 1103)
Figure 45. Specific conductance (uS) measured at each site during 2011 and 2012,
during wet and dry sampling events at bottom (B), middle (M) and surface (S) depths.
Figure 46. Salinity measured at each site during 2011 and 2012, during wet and dry
sampling events at bottom (B), middle (M) and surface (S) depths.
Site
Year
Type
Depth
321
201220112012201120122011
WetDryWetDryWetDryWetDryWetDryWetDry
SMBSMBSMBSMBSMBSMBSMBSMBSMBSMBSMBSMB
35000
30000
25000
20000
15000
10000
5000
0
Specif
ic C
onducta
nce (
uS)
Site
Year
Type
Depth
321
201220112012201120122011
WetDryWetDryWetDryWetDryWetDryWetDry
SMBSMBSMBSMBSMBSMBSMBSMBSMBSMBSMBSMB
20
15
10
5
0
Sali
nit
y (P
SU
)

71 Sedimentation Study of Dickinson Bayou Tidal (Segment 1103)
Figure 47. Secchi disk transparency (SD) measured at each site during 2011 and
2012, during wet and dry sampling events.
Figure 48. Turbidity (NTU) measured at each site during 2011 and 2012, during wet
and dry sampling events.
Site
Year
Type
321
201220112012201120122011
WetDryWetDryWetDryWetDryWetDryWetDry
1.2
1.0
0.8
0.6
0.4
0.2
0.0
Secchi
Dis
k T
ransp
arn
ecy
(m)
Si te
Year
Type
321
201220112012201120122011
WetDryWetDryWetDryWetDryWetDryWetDry
100
80
60
40
20
0
Turb
idit
y (N
TU
)

72 Sedimentation Study of Dickinson Bayou Tidal (Segment 1103)
Figure 49. The pH measured at each site during 2011 and 2012, during wet and dry sampling
events at bottom (B), middle (M) and surface (S) depths.
Figure 50. Dissolved oxygen (mg/L) measured at each site during 2011 and 2012, during wet
and dry sampling events at bottom (B), middle (M) and surface (S) depths.
Site
Year
Type
Depth
321
201220112012201120122011
WetDryWetDryWetDryWetDryWetDryWetDry
SMBSMBSMBSMBSMBSMBSMBSMBSMBSMBSMBSMB
8.2
8.0
7.8
7.6
7.4
7.2
7.0
pH
Site
Year
Type
Depth
321
201220112012201120122011
WetDryWetDryWetDryWetDryWetDryWetDry
SMBSMBSMBSMBSMBSMBSMBSMBSMBSMBSMBSMB
10
8
6
4
2
0
Dis
solv
ed O
xygen (
mg/L)

73 Sedimentation Study of Dickinson Bayou Tidal (Segment 1103)
Figure 51. Total suspended solids (mg/L) measured at each site during 2011 and
2012, during wet and dry sampling events.
Figure 52. Volatile suspended solids (mg/L) measured at each site during 2011 and
2012, during wet and dry sampling events.
20122011
160
140
120
100
80
60
40
20
0
Year
TSS (
mgL)
1 Dry
1 Wet
2 Dry
2 Wet
3 Dry
3 Wet
Site Type
20122011
50
40
30
20
10
0
Year
VSS (
mgL)
1 Dry
1 Wet
2 Dry
2 Wet
3 Dry
3 Wet
Site Type

74 Sedimentation Study of Dickinson Bayou Tidal (Segment 1103)
Figure 53. Relationship between VSS and TSS levels measured on samples collected
in Dickinson Bayou during wet and dry weather sampling during 2011 and 2012.
Figure 54. Total organic carbon (mg/L) measured at each site during 2011 and 2012,
during wet and dry sampling events.
140120100806040200
50
40
30
20
10
0
TSS (mgL)
VS
S (
mg
L)
2012 2 Wet
2012 3 Dry
2012 3 Wet
2011 1 Dry
2011 1 Wet
2011 2 Dry
2011 2 Wet
2011 3 Dry
2011 3 Wet
2012 1 Dry
2012 1 Wet
2012 2 Dry
Year Site Type
VSS mg/ L = 3.623 + 0.238 TSS mg/ L r- sq = 63.7
20122011
14
12
10
8
6
4
2
Year
TO
C (
mgL)
1 Dry
1 Wet
2 Dry
2 Wet
3 Dry
3 Wet
Site Type
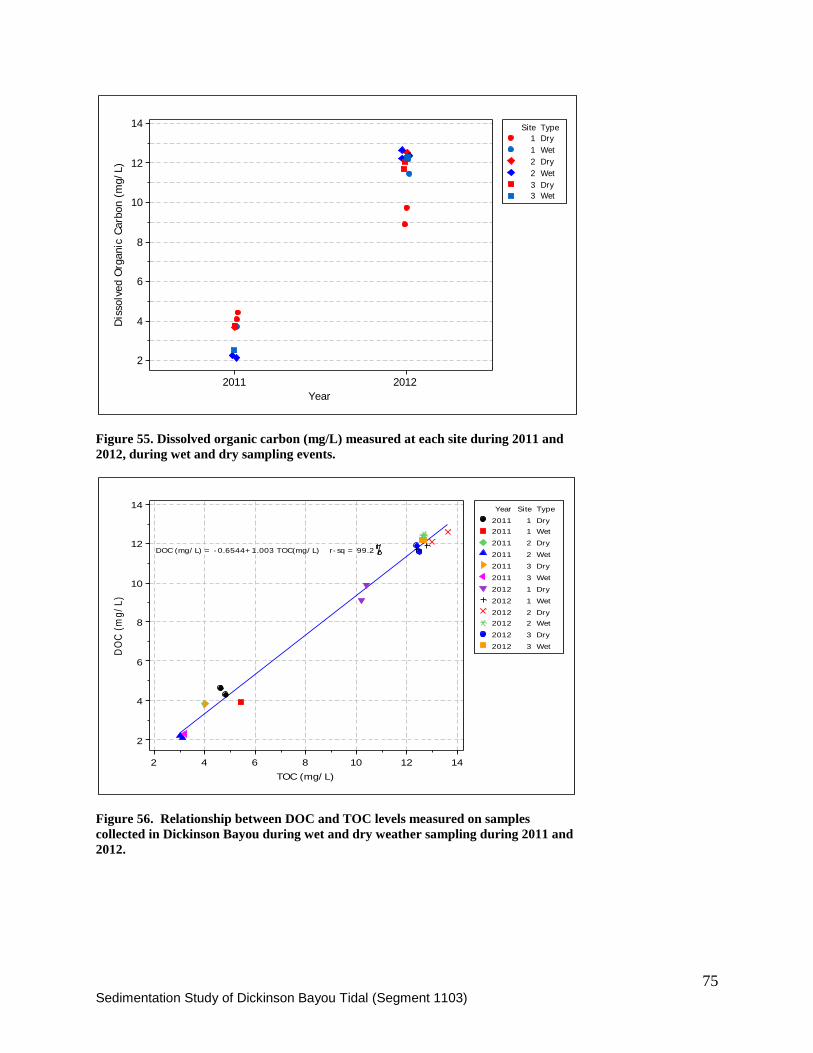
75 Sedimentation Study of Dickinson Bayou Tidal (Segment 1103)
Figure 55. Dissolved organic carbon (mg/L) measured at each site during 2011 and
2012, during wet and dry sampling events.
Figure 56. Relationship between DOC and TOC levels measured on samples
collected in Dickinson Bayou during wet and dry weather sampling during 2011 and
2012.
20122011
14
12
10
8
6
4
2
Year
Dis
solv
ed O
rganic
Carb
on (
mg/L)
1 Dry
1 Wet
2 Dry
2 Wet
3 Dry
3 Wet
Site Type
1412108642
14
12
10
8
6
4
2
TOC (mg/ L)
DO
C (
mg
/L
)
2012 2 Wet
2012 3 Dry
2012 3 Wet
2011 1 Dry
2011 1 Wet
2011 2 Dry
2011 2 Wet
2011 3 Dry
2011 3 Wet
2012 1 Dry
2012 1 Wet
2012 2 Dry
Year Site Type
DOC (mg/ L) = - 0.6544+ 1.003 TOC(mg/ L) r- sq = 99.2

76 Sedimentation Study of Dickinson Bayou Tidal (Segment 1103)
Sediment Results
During April 2011, stream bed sediment sampling was conducted at the 3 sites (Table 7). The
majority (85.9-96.5%) of sediment present was fine clays and silts (grain size < 0.0626 mm). The
amount of silicates measured further documents the low amount of sand in sediment.
Approximately 6.9 to 9.6% of the bed sediment is composed of volatile solids. A high amount of
the sediment is composed of carbon of which at least 78.6% to 97% is organic. The majority
(>96%) of nitrogen in stream sediment consisted of organic forms at all three sites. In contrast,
only 83 to 62 percent of the total phosphorus is in the organic form. These data suggest that
Dickinson Bayou stream bed sediments are primarily composed of fine clays and silt containing
high amounts of organic material. During high flow periods many of these sediments would be
easily remobilized into suspension due to their small size and low settling velocities (Brown et
al. 1999). This would suggest that the predominant uncompacted bottom sediment present in
Dickinson Bayou is highly susceptible to erosion at relatively low stream velocities.
Table 7. Bulk stream bed sediment physical and chemical properties collected at each site on April 20, 2011.
Sediment Trap Results
Due to laboratory errors associated with post sample processing of sediment trap samples, much
of the sediment trap data collected during 2011 is not usable for the purposes of this study. For
example, the total sediment estimates were contaminated with excessive moisture (i.e. wet
sediment weight) versus properly concentrated (centrifuged) and dried weights. However, some
laboratory measurements were properly conducted and where appropriate and useful for
interpreting sediment dynamics, we have included this data in our analysis and it is presented in
this section. All data, however, is provided in the electronic appendices that accompany this
report.
Due to the low amount of sediment collected overall, only samples during 2011 and two wet
weather samples collected at site 1 in March 2012 provided a sufficient amount of sediment to
calculate size distribution (Figures 57 - 59). Based on the data collected the largest fraction of
sediment collected was very fine (<0.0625 mm) cohesive silts and clay particles (Figure 57).
This sediment size distribution measured in the collectors (85.9 to 96.5 %) was similar to the
values obtained from the bulk stream bed sediment samples (82 to 99.6%) (Table 7). Therefore,
it appears that the sediment deposition samplers collected sediment that was similar in physical
composition to recently deposited stream bottom sediments (Table 7). The percentage of fine
sediment (<0.0625) was higher in wet weather collections (Figure 57). Conversely, the
percentage of larger sediment size classes declined during wet weather monitoring (Figure 58).
Larger sediment (>2.0 mm) fractions were absent in all sediment trap samples (Figure 59).
SiteDate
Collected
% Total
Solids
GS >2.0
mm (%)
GS 0.0625 -
2.0 mm (%)
GS <0.0625
mm (%)
SiO2
(mg/kg)
TVS
(%)
TC
(mg/kg)
TOC
(mg/kg)
TN
(mg/kg)
TON
(mg/kg)
TP
(mg/kg)
TOP
(mg/kg)
1 4/20/11 29.4 0.2 9.50 90.3 1,460 6.90 26,900 26,300 3,238 3,095 105 74.40
2 4/20/11 25.2 3.2 10.9 85.9 1,310 7.10 36,700 32,000 3,433 3,317 171 141.20
3 4/20/11 19.6 0.0 3.50 96.5 2,120 9.60 42,600 33,500 2,200 2,032 135 84.00

77 Sedimentation Study of Dickinson Bayou Tidal (Segment 1103)
Figure 57. Percent grain size < 0.0625 mm diameter (silt and clay fraction) in settled
solids from each sediment sampler during April, May and June 2011 monitoring.
Figure 58. Percent grain size < 0.0625 to 2.0 mm diameter in settled solids from each
sediment sampler during April, May and June 2011 monitoring.
Site
Type
321
WetDryWetDryWetDry
100
95
90
85
80
Perc
ent
gra
in s
ize <
0.0
625 m
m
Si te
Type
321
WetDryWetDryWetDry
20
15
10
5
0
Perc
ent
gra
in s
ize 0
.0625 t
o 2
.0 m
m

78 Sedimentation Study of Dickinson Bayou Tidal (Segment 1103)
Figure 59. Percent grain size > 2.0 mm diameter in settled solids from each sediment
sampler during April, May and June 2011 monitoring.
Site
Type
321
WetDryWetDryWetDry
0.5
0.4
0.3
0.2
0.1
0.0
Perc
ent
Gra
in S
ize >
2.0
mm

79 Sedimentation Study of Dickinson Bayou Tidal (Segment 1103)
The remainder of the sedimentation collector data is based solely on data collected during 2012.
Summary tables showing the distribution of measured values and estimated deposition rates are
provided (Tables 8 and 9). During dry weather sampling the sediment collectors were deployed
for a range of 70.7 to 71.2 hours. Wet weather sampling ranged between 45.8 to 46.7 hours.
The total amount of sediments collected by each sampler array at each site is summarized in
Figure 60 and Table 8. In general, the highest amount of total solids was collected during wet
weather sampling. The highest amount of solids was collected at site 1 during wet weather
sampling. The calculated sedimentation rates during this study ranged between 1.860 to 4.740
g/hr/m2 during dry weather conditions, and 10.5 to 66.7 g/hr/m
2 during wet weather (Figure 61).
The majority of the deposited sediment was composed of non-volatile fractions (Figure 62).
Volatile deposited sediment ranged between 2.5 and 14.4%. This is similar to the values
reported in this study for bulk bottom stream sediment (6.9 to 9.6%) (Table 7).
Deposition rates of total carbon (TC) associated with particulate sediment ranged between 25.7
and 38.9 mg/hr/m2 (Table 9 and Figure 63). Highest TC deposition rates were associated with
wet weather periods. Deposition rates of total organic carbon associated with particulate
sediment ranged 414 and 544.5 ug/hr/m2 (Table 9 and Figure 64). Highest rates were associated
with dry weather periods at site 2. Extremely low particulate-associated organic carbon was
observed at site 1 during dry weather monitoring (Figure 64). Deposition rates of sediment-
associated silicates ranged between 0.69 and 9.28 ug/hr/m2 (Table 9 and Figure 65). Highest
rates were associated with dry weather periods. This was primarily due to higher percentages of
particulate-associated silicates during dry weather monitoring and not from high overall
sediment deposition rates.
Deposition rates of total phosphorus associated with particulate sediment ranged between 0.30
and 17.88 ug/hr/m2 (Table 9 and Figure 66). Highest rates were observed during dry weather
periods. An extremely low particulate-associated phosphorus deposition rate (0.3 ug/hr/m2) was
observed at site 1 during wet weather monitoring (Figure 66). The lower rates observed during
dry weather periods reflect the lower amount of particulate-associated phosphorus during wet
weather sampling despite high total sediment deposition rates.
Deposition rates of total nitrogen associated with particulate sediment ranged between 6.64 and
72.55 ug/hr/m2 (Table 9 and Figure 67). Highest deposition rates were associated with dry
weather periods at all sites. This was due to the higher percentages of sediment-associated
nitrogen during dry weather sampling and not from lower total sediment deposition rates. A very
low rate of particulate-associated phosphorus deposition (6.64 ug/hr/m2) was observed at site 1
during wet weather monitoring (Figure 67).
Deposition rates of total solids were elevated at higher average stream flows (Figure 68).
However this rate was not linear and appeared to be highly influenced by location as well.
Deposition rates of total carbon did not appear to differ considerably between high and low
deposition rates of total solids, with the exception of site 1 (Figure 69).

80 Sedimentation Study of Dickinson Bayou Tidal (Segment 1103)
Table 8. Measured physical and chemical characteristics of sediment collected in sedimentation samplers during March and April, 2012.
ID Site Rep Type Time hr Area sq-m Depth m
Total
Solids g
TVS
(%)
TP
(mg/kg) DL
T-Org P
(mg/kg)
TKN
(mg/kg) DL
NO3+NO2
(mg/kg)
TN
(mg/kg)
T-Org N
(mg/kg)
SiO2
(mg/kg)
Total C
(mg/kg)
T-Org C
(mg/kg)
11464 1 A Wet 45.75 0.016206419 3.060 49.43 13 20 2 610.4 < 1.5 610.4 112 59.1 36800 28200
11464 1 B Wet 45.88 0.016206419 3.060 41.90 14.4 18 9 442.4 < 1.5 442.4 72.8 74.5 25700 27600
18649 2 A Wet 45.93 0.016206419 4.317 8.91 6.4 25 2 1098 < 1.5 1098 375.2 82.4 32200 31500
18649 2 B Wet 46.10 0.016206419 4.317 10.44 8.6 15 5 912.8 < 1.5 912.8 330.4 70.7 32000 31500
11461 3 A Wet 46.37 0.016206419 5.681 7.86 7.4 22 < 0.02 677.6 < 1.5 677.6 280 71.1 37400 35800
11461 3 B Wet 46.65 0.016206419 5.681 8.09 3 33 5 582.4 < 1.5 582.4 319.2 45.8 38900 36300
11464 1 A Dry 70.85 0.016206419 2.003 2.14 7.8 20 1 3252 2.44 3253 2915 * * 28700
11464 1 B Dry 71.02 0.016206419 2.003 2.76 7.5 12 2 4835 2.31 4837 4466 * * 30300
18649 2 A Dry 70.73 0.016206419 4.031 5.43 2.5 18 9 3214 2.31 3215 2888 573 31300 27800
18649 2 B Dry 71.08 0.016206419 4.031 4.21 9.1 63 60 3454 2.32 3456 3219 619 30900 28800
11461 3 A Dry 70.96 0.016206419 4.671 4.18 11.3 65 48 3639 2.43 3641 3404 407 36000 35200
11461 3 B Dry 71.20 0.016206419 4.671 5.07 8.3 22 2 2797 2.74 2799 2483 420 36300 36000

81 Sedimentation Study of Dickinson Bayou Tidal (Segment 1103)
Table 9. Calculated sedimentation and chemical flux rates of sediment associated chemicals based on measured physical and chemical characteristics of
sediment collected by sedimentation samplers during March and April, 2012. Note, for the estimated rates of chemical flux based on concentrations
with less than the detection limits, we used one half the detection limit as the quantity used. These values are highlighted in yellow.
ID Site Rep Type Time hr
Area sq-
m Depth m
Deposition
Rate
(g/hr/m2)
TP
(ug/hr/m2)
T- Org P
(ug/hr/m2)
TKN
(ug/hr/m2)
NO3+NO2
(ug/hr/m2)
Total N
(ug/hr/m2)
T-Org N
(ug/hr/m2)
SiO2
(ug/hr/m2)
TC
(ug/hr/m2)
TOC
(ug/hr/m2)
11464 1 A Wet 45.75 0.016206 3.060 66.67 0.3000 0.0300 9.1559 0.0112 9.1559 1.6800 0.8865 551.9953 422.9964
11464 1 B Wet 45.88 0.016206 3.060 56.35 0.3194 0.1350 6.6359 0.0112 6.6359 1.0920 1.1175 385.4967 413.9965
18649 2 A Wet 45.93 0.016206 4.317 11.97 2.0887 0.0300 16.4699 0.0112 16.4699 5.6280 1.2360 482.9959 472.4960
18649 2 B Wet 46.10 0.016206 4.317 13.97 1.0734 0.0750 13.6919 0.0112 13.6919 4.9560 1.0605 479.9959 472.4960
11461 3 A Wet 46.37 0.016206 5.681 10.46 2.1033 0.0001 10.1639 0.0112 10.1639 4.2000 1.0665 560.9952 536.9954
11461 3 B Wet 46.65 0.016206 5.681 10.70 3.0839 0.0750 8.7359 0.0112 8.7359 4.7880 0.6870 583.4950 544.4954
11464 1 A Dry 70.85 0.016206 2.003 1.86 10.7311 0.0150 48.7796 0.0366 48.7946 43.7246 * * 430.4963
11464 1 B Dry 71.02 0.016206 2.003 2.40 5.0040 0.0300 72.5244 0.0346 72.5544 66.9894 * * 454.4961
18649 2 A Dry 70.73 0.016206 4.031 4.74 3.7998 0.1350 48.2096 0.0346 48.2246 43.3196 8.5949 469.4960 416.9964
18649 2 B Dry 71.08 0.016206 4.031 3.65 17.2390 0.9000 51.8096 0.0348 51.8396 48.2846 9.2849 463.4960 431.9963
11461 3 A Dry 70.96 0.016206 4.671 3.63 17.8829 0.7200 54.5845 0.0364 54.6145 51.0596 6.1049 539.9954 527.9955
11461 3 B Dry 71.20 0.016206 4.671 4.39 5.0070 0.0300 41.9546 0.0411 41.9846 37.2447 6.2999 544.4954 539.9954

82 Sedimentation Study of Dickinson Bayou Tidal (Segment 1103)
Figure 60. Total solids collected in each sedimentation sampler during
March and April 2012 dry and wet weather monitoring.
Figure 61. Estimated sediment deposition rates at each sedimentation
sampler during March and April 2012 dry and wet weather monitoring.
Site
Type
321
WetDryWetDryWetDry
50
40
30
20
10
0
Tota
l Soli
ds
(g)
Si te
Type
321
WetDryWetDryWetDry
70
60
50
40
30
20
10
0
Sedim
ent
Depost
ion R
ate
(g/hr/
sq.
m)

83 Sedimentation Study of Dickinson Bayou Tidal (Segment 1103)
Figure 62. Percent total volatile solids (TVS) in deposited sediment at each
sedimentation sampler during March and April 2012 dry and wet weather
monitoring.
Figure 63. Estimated total carbon deposition rates at each sedimentation
sampler during March and April 2012 dry and wet weather monitoring.
Site
Type
321
WetDryWetDryWetDry
16
14
12
10
8
6
4
2
Perc
ent
Tota
l V
ola
tile
Soli
ds
Si te
Type
321
WetDryWetDryWetDry
600
500
400
300
200
100
0
Tota
l C
arb
on D
eposi
tion R
ate
(ug/hr/
sq.
m)

84 Sedimentation Study of Dickinson Bayou Tidal (Segment 1103)
Figure 64. Estimated total organic carbon deposition rates at each
sedimentation sampler during March and April 2012 dry and wet weather
monitoring.
Figure 65. Estimated sediment-associated silicate deposition rates at each
sedimentation sampler during March and April 2012 dry and wet weather
monitoring.
Site
Type
321
WetDryWetDryWetDry
560
540
520
500
480
460
440
420
400
To
tal
Org
an
ic C
arb
on
(u
g/
hr/
sq.
m)
Site
Type
321
WetDryWetDryWetDry
9
8
7
6
5
4
3
2
1
0
SiO
2 (
ug/hr/
sq.
m)

85 Sedimentation Study of Dickinson Bayou Tidal (Segment 1103)
Figure 66. Estimated sediment-associated total phosphorus deposition rates
at each sedimentation sampler during March and April 2012 dry and wet
weather monitoring.
Figure 67. Estimated sediment-associated total nitrogen deposition rates at
each sedimentation sampler during March and April 2012 dry and wet
weather monitoring.
Site
Type
321
WetDryWetDryWetDry
20
15
10
5
0
Tota
l P
hosp
horu
s (u
g/hr/
sq.
m)
Si te
Type
321
WetDryWetDryWetDry
80
70
60
50
40
30
20
10
0
Tota
l N
itro
gen (
ug/hr/
sq.
m)

86 Sedimentation Study of Dickinson Bayou Tidal (Segment 1103)
Figure 68. Relationship between average flow and estimated total solids deposition
rate. Average flow calculated from measurements taken during deployment and
retrieval of sampler.
Figure 69. Relationship between estimated total solids and sediment-associated total
carbon deposition rates.
3020100- 10
70
60
50
40
30
20
10
0
Average Flow (cfs)
Deposi
tion R
ate
Tota
l Soli
ds
(mg/hr/
sq.
m) 1 Dry
1 Wet
2 Dry
2 Wet
3 Dry
3 Wet
Site Type
706050403020100
600
500
400
300
200
100
0
Deposition Rate Total Solids (mg/ hr/ sq. m)
Tota
l C
arb
on D
eposi
tion R
ate
(ug/hr/
sq.
m) 1 Dry
1 Wet
2 Dry
2 Wet
3 Dry
3 Wet
Site Type

87 Sedimentation Study of Dickinson Bayou Tidal (Segment 1103)
Total carbon organic deposition rates did not appear to differ much between high and low total
solid deposition rates (Figure 70). Highest organic carbon deposition rates occurred at the
downstream site 3 at relatively low total solid deposition rates.
Total sediment-associated phosphorus deposition rates were considerably lower at high
deposition rates of total solids during wet weather conditions. (Figure 71). Highest total
phosphorus deposition rates occurred at sites 2 and 3 during dry weather conditions and low rates
of deposition of total solids. Finally, deposition rates of total sediment-associated nitrogen were
considerably lower at high deposition rates of total solids during wet weather conditions. (Figure
72).
Figure 70. Relationship between estimated total solids and sediment-associated total
organic carbon deposition rates.
706050403020100
560
540
520
500
480
460
440
420
400
Deposition Rate Total Solids (mg/ hr/ sq. m)
Tota
l O
rganic
Carb
on (
ug/hr/
sq.
m)
1 Dry
1 Wet
2 Dry
2 Wet
3 Dry
3 Wet
Site Type

88 Sedimentation Study of Dickinson Bayou Tidal (Segment 1103)
Figure 71. Relationship between estimated total solids and sediment-associated total
phosphorus deposition rates.
Figure 72. Relationship between estimated total solids and sediment-associated total
nitrogen deposition rates.
706050403020100
20
15
10
5
0
Deposition Rate Total Solids (mg/ hr/ sq. m)
Tota
l P
hosp
horu
s (u
g/hr/
sq.m
)
1 Dry
1 Wet
2 Dry
2 Wet
3 Dry
3 Wet
Site Type
706050403020100
80
70
60
50
40
30
20
10
0
Deposition Rate Total Solids (mg/ hr/ sq. m)
Tota
l N
itro
gen (
mg/hr/
sq.
m)
1 Dry
1 Wet
2 Dry
2 Wet
3 Dry
3 Wet
Site Type

89 Sedimentation Study of Dickinson Bayou Tidal (Segment 1103)
Conclusions and Recommendations
The results of this study provide critical information on the physical and chemical composition
of bed sediment and recently-deposited sediment in the upstream reaches of Dickinson Bayou
Tidal. Information and estimates of deposition rates of total solids, total carbon, total organic
carbon, total nitrogen and total phosphorus are provided in this report. These estimates varied
according to site and streamflow regime. In general deposition rates of total solids were higher
during wet weather events, during the descending limb of the hydrograph, versus dry weather
events. However, with the exception of particulate-associated carbon, deposition rates of
sediment-associated TOC, silicates, TN and TP were higher during dry weather events. This was
due to the higher percentage of sediment-associated forms of these chemical constituents during
dry weather conditions. This difference may be due to processes occurring at higher flows,
during which the particulate forms of these chemicals are composed of 1) resuspended bottom
sediments, 2) new sediments that have runoff into the bayou and 3) biogenically derived sources
such as sinking algal particles. This mixture may not contain the same amount of particulate-
associated chemicals compared to deposited sediment derived from new runoff and biogenically
derived sources occuring only during low flow dry conditions. The higher sediment-associated
nutrient and TOC values during dry conditions provide evidence that the majority of the
sediment being deposited during these conditions is dead algae. This suggests that deposited
sediments during dry periods may have originated primarily from land-derived sources and/or
sinking dead algal cells, versus resuspension of bottom stream sediments and runoff. In other
words, the initial influx of these sediment associated constituents probably originates from the
watershed during wet weather events. These constituents are then transformed in the sediment
bed and released back into the water column in dissolved form during dry conditions which
stimulates algal growth. Upon death the sinking algal cells along with minimal amounts of new
sediment derived from land runoff form the majority of particulate associated constituents that
are deposited during dry periods. Although this scenario is consistent with plausible transport
mechanisms, future studies are needed to confirm this. The estimated rates of sediment-
associated constituent deposition generated from this study are summarized below in Table 10.
Table 10. Summary of sediment and associated chemical deposition rates. rkm = river kilometer.
TCEQ ID Site rkm Rep Type
Total
Solids
(g/hr/m2)
Total P
(ug/hr/m2)
Total N
(ug/hr/m2)
SiO2
(ug/hr/m2)
Total
Carbon
(ug/hr/m2)
Total Org-C
(ug/hr/m2)
11464 1 21.2 A Wet 66.67 0.3000 9.1559 0.8865 551.9953 422.9964
11464 1 21.2 B Wet 56.35 0.3194 6.6359 1.1175 385.4967 413.9965
18649 2 17.42 A Wet 11.97 2.0887 16.4699 1.2360 482.9959 472.4960
18649 2 17.42 B Wet 13.97 1.0734 13.6919 1.0605 479.9959 472.4960
11461 3 14 A Wet 10.46 2.1033 10.1639 1.0665 560.9952 536.9954
11461 3 14 B Wet 10.70 3.0839 8.7359 0.6870 583.4950 544.4954
11464 1 21.2 A Dry 1.86 10.7311 48.7946 * * 430.4963
11464 1 21.2 B Dry 2.40 5.0040 72.5544 * * 454.4961
18649 2 17.42 A Dry 4.74 3.7998 48.2246 8.5949 469.4960 416.9964
18649 2 17.42 B Dry 3.65 17.2390 51.8396 9.2849 463.4960 431.9963
11461 3 14 A Dry 3.63 17.8829 54.6145 6.1049 539.9954 527.9955
11461 3 14 B Dry 4.39 5.0070 41.9846 6.2999 544.4954 539.9954

90 Sedimentation Study of Dickinson Bayou Tidal (Segment 1103)
A major process that can influence the dynamics of sediment deposition is the presence and
magnitude of any turbidity maxima (Dyer 1997). This occurs at the frontal zone between the
fresh and saline water. (Biggs et al. 1983) found that upstream turbidity maxima usually occurred
in Delaware at a salinity of 1 ppt. In many estuaries this front can be characterized by a salt
wedge moving in the upstream-downstream direction with the semidiurnal tidal cycle. In a wide
range of those estuaries, stable turbidity maxima can be observed at the tip of the salt wedge.
These estuarine turbidity maxima (ETM) are formed by high concentrations of suspended
particulate matter (SPM) where increased deposition occurs (Figures 73 - 76). Reduced and
reversing current velocities due to tides, changes in flow velocity due to stream morphology, and
changes in pH and salinity have all been cited as primary mechanisms for this phenomenon.
Figure 73. Example of estuarine turbidity maxima showing zone of maximum turbidity and deposition.
Diagram source:
http://upload.wikimedia.org/wikipedia/commons/thumb/c/c3/Turbidity_maximum_in_a_partially_mixed_est
uary.svg/602px-Turbidity_maximum_in_a_partially_mixed_estuary.svg.png
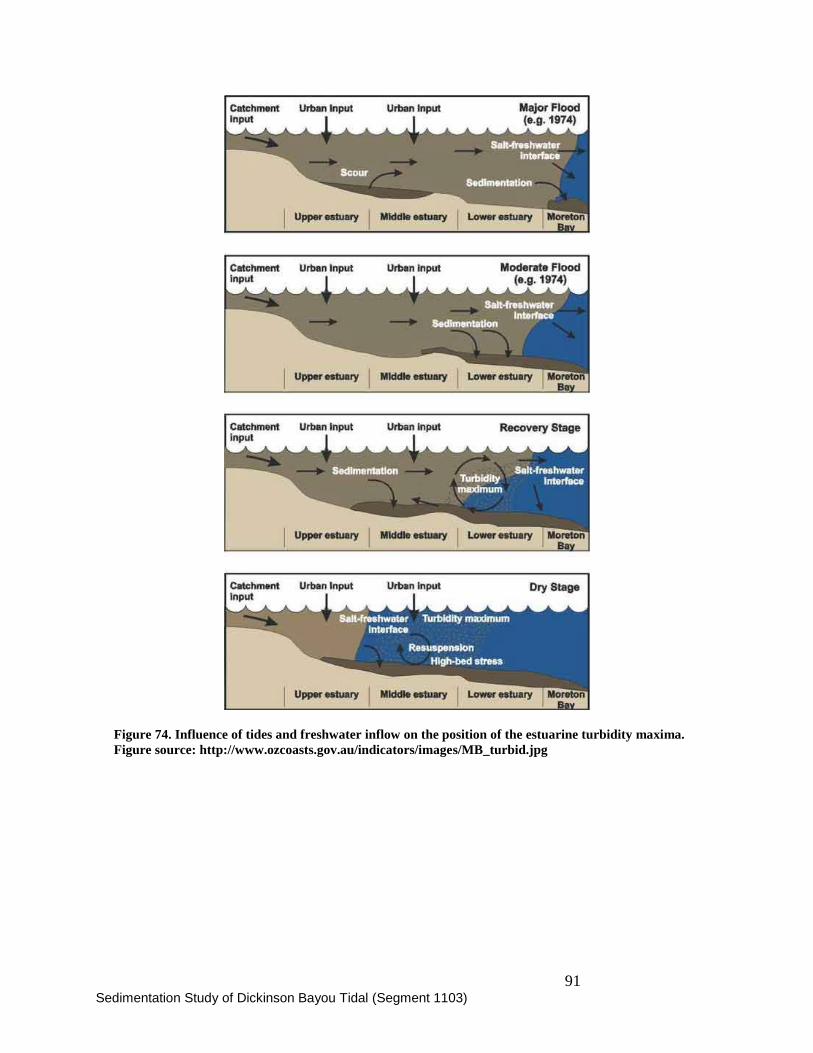
91 Sedimentation Study of Dickinson Bayou Tidal (Segment 1103)
Figure 74. Influence of tides and freshwater inflow on the position of the estuarine turbidity maxima.
Figure source: http://www.ozcoasts.gov.au/indicators/images/MB_turbid.jpg

92 Sedimentation Study of Dickinson Bayou Tidal (Segment 1103)
Figure 75. Relationship of tide height, tidal amplitude and freshwater inflow on the location of the
turbidity maxima. Figure source: http://www.scopenvironment.org/ downloadpubs/scope35/Fig13.5.gif
Figure 76. Influence of turbidity maxima on suspended sediment levels and measurements of turbidity.
Figure source: http://www.ozcoasts.gov.au/indicators/ images/turbidity_fwsw.gif

93 Sedimentation Study of Dickinson Bayou Tidal (Segment 1103)
The presence of the estuarine turbidity maxima can complicate the estimation of deposition rates
since immediately upstream and downstream of this zone, deposition rates can change
significantly. It appears that the upper tidal portion of Dickinson Bayou may be close to this
zone given the difference in surface and bottom salinities and the overall salinity pattern which is
approaching 1 ppt. Future studies focused on determining the possible presence and lateral
extent of this zone may be appropriate for gaining a better understanding of suspended sediment
dynamics in Dickinson Bayou.
The methodology used by this investigation proved to be adequate for accomplishing the study
objectives. Future studies should include concurrent deployment of automated salinity and
turbidity meters, and sediment deposition samplers in a vertical array to gain a better
understanding of depositional processes within the waterbody. For example, changes in
suspended solids and sediment deposition will vary according to when sampling is conducted
within the storm hydrograph due to the phenomenon of hysteresis (Knighton 1998). That is, the
concentration of suspended solids will not vary symmetrically around peak stream flows.

94 Sedimentation Study of Dickinson Bayou Tidal (Segment 1103)
Literature Cited
American Public Health Association (APHA), American Water Works Association
(AWWA), and Water Environment Federation (WEF), editors. 1998. Standard
Methods for the Examination of Water and Wastewater. 20th edition. APHA.
American Society for Testing and Materials (ASTM). 2007. Standard test method for
particle-size analysis of soils. D422-63 ASTM. , West Conoshohocken, Pennsylvania
Bale, A. J. 1998. Sediment trap performance in tidal waters: comparison of cylindrical and
conical collectors. Continental Shelf Research 18:1401-1418.
Biggs, R. B., J. H. Sharp, T. M. Church, and J. M. Tramontano. 1983. Optical properties,
suspended sediments, and chemistry associated with the turbidity maxima of the
Delaware Estuary. Canadian Journal of Fisheries and Aquatic Science 40:172-179.
Bloesch, J. and N. M. Burns. 1980. A critical review of sedimentation trap technique.
Schweiz Z. Hydrol. 42:15-55.
Brown, E., A. Colling, D. Park, and J. Wright. 1999. Waves, tides and shallow-water
processes. Butterworth Heinemann, Milton Keynes, England.
Dickinson Bayou Watershed Partnership. 2009. Dickinson Bayou Watershed Protection
Plan. Texas Agri-Life, Webster, Texas.
DiToro, D. M. and J. F. Fitzpatrick. 1993. Chesapeake Bay Sediment Flux Model.
HydroQual, Inc., Baltimore, MD.
Dyer, K. 1997. Estuaries: a physical introduction. Wiley, West Sussex, England.
Guillen, G. 2012. Sedimentation Study of Dickinson Bayou Tidal (Segment 1103): Quality
Assurance Project Plan Revision #1. Environmental Institute of Houston,
University of Houston Clear Lake, Austin, TX.
Hargrave, B. T. and N. M. Burns. 1979. Assessment of sediment trap collection efficiency.
Limnology and Oceanography 24:1124-1136.
Houston Galveston Area Council. 2006. Basin Summary Report, Houston, TX.
Houston Galveston Area Council. 2012. Where's the water? : 2012 Houston-Galveston
Area Council Basin Highlights Report. HGAC, Houston, TX.
Huang, J., R. C. Hilldale, and B. P. Greimann. 2006. Cohesive Sediment Transport.in
Bureau of Reclamation, editor. Erosion and Sedimentation Manual. Bureau of
Reclamation, Denver, Colorado.
95 Sedimentation Study of Dickinson Bayou Tidal (Segment 1103)
In-Situ Inc. 2010. Level TROLL Operators Manual. Level TROLL 300, Level TROLL
500, Level TROLL 700, BaroTROLL. In-Situ Inc., Fort Collins, Colorado.
Kiesling, R. L. 2006. Quality Assurance Project Plan: Productivity, biochemical oxygen
dynamics and nutrient cycling in the tidal segment of the Arroyo Colorado. United
States Geological Survey, Austin, Texas.
Kirkpatrick, J. 1986a. Intensive survey of Dickinson Bayou above tidal, segment 1104, May
6-7, 1985. Texas Water Commission, Austin, Texas.
Kirkpatrick, J. 1986b. Intensive survey of Dickinson Bayou tidal, segment 1103, November
27-29, 1984. Texas Water Commission, Austin, Texas.
Knighton, D. 1998. Fluvial forms and processes: a new perspective. Oxford University
Press, New York, NY.
Knudson, K. and C. E. Belaire. 1975. Causes and probable correctives for oxygen depletion
fish kills in the Dickinson Bayou estuary: a field study and simplified algal assay.
Contributions in Marine Science 19:37-48.
Milburn, D. and B. G. Krishnappan. 2003. Modeling erosion and depsosition of cohesive
sediments from Hay River, Northwest Territories, Canada. Nordic Hydrology
34:125-138.
Mudroch, A. and S. D. MacKnight. 1994. Handbook of techniques for aquatic sediment
sampling. 2nd edition. CRC Press, Boca Raton, Florida.
Park, K., A. Y. Kuo, J. Shen, and J. M. Hamrick. 1995. A three-dimensional
hydrodynamic-eutrophication model (HEM3D): description of water quality and
sediment processes submodels, Special Report 327. College of William and Mary,
Virginia Institute of Marine Science.
Quigg, A., L. Broach, W. Denton, and R. Miranda. 2009. Water quality in the Dickinson
Bayou watershed (Texas, Gulf of Mexico) and health issues. Marine Pollution
Bulletin 58:896-904.
Rifai, H. 2010. Total Maximum Daily Loads for Dissolved Oxygen in Dickinson Bayou
Quality Assurance Project Plan for Modeling. Revision # 1. Watershed Loading,
Hydrodynamic and Water Quality Modeling for Dickinson Bayou Segments 1103
and 1104. Revision and Recalibration of Watershed Inflow, Pollutant Loading,
Hydrodynamics and Water Quality Simulation Using the Hydrologic Simulation
Program - Fortran (HSPF) and Environmental Fluid Dynamics Code (EFDC):
FY2009-11 Categorical §106 Water Pollution Control Program. Federal Grant ID:
I988665305-0. Texas Commision on Environmental Quality, Austin, Texas.
Roussel, M. C., M. G. Canova, W. H. Asquith, and R. K. Kiesling. 2007. Water quality and
ancillary data collected from the Arroyo Colorado near Rio Hondo, Texas 2006.
U.S. Geological Survey
96 Sedimentation Study of Dickinson Bayou Tidal (Segment 1103)
SonTek/YSI. 2009. Stream velocity profiles and streamflow was estimated using a Sontek
River Surveyor M9 instrument. . SonTek/YSI Inc., San Diego, CA.
Tetra Tech Inc. 2006. The Environmental Fluid Dynamics Code Theory and Computation
Volume 3: Water Quality Module. Tetra Tech, Inc. 10306 Eaton Place. Suite 340,
Fairfax, Virginia.
Tetra Tech Inc. 2007a. The Environmental Fluid Dynamics Code Theory and Computation
Volume 1: Hydrodynamics and Mass Transport. Tetra Tech, Inc., Fairfax, VA.
Tetra Tech Inc. 2007b. The Environmental Fluid Dynamics Code Theory and Computation
Volume 2: Sediment and Contaminant Transport and Fate. Tetra Tech, Inc.,
Fairfax, VA.
Texas Commission on Environmental Quality. 2007. Surface Water Quality Monitoring
Procedures Volume 2: Methods for Collecting and Analyzing Biological Community
and Habitat Data. Texas Commission on Environmental Quality, Austin, Texas.
Texas Commission on Environmental Quality. 2008a. 2008 Texas 303(d) List Texas
Commission on Environmental Quality, Austin, Texas.
Texas Commission on Environmental Quality. 2008b. Surface Water Quality Monitoring
Procedures Volume 1: Physical and Chemical Monitoring Methods for Water,
Sediment and Tissue,. Texas Commission on Environmental Quality Austin, Texas.
Texas Commission on Environmental Quality. 2008c. Two Total Maximum Daily Loads for
Dissolved Oxygen in Dickinson Bayou Texas Commision on Environmental Quality,
Austin, Texas.
Texas Commission on Environmental Quality. 2010. 2010 Texas Integrated Report - Texas
303(d) List (Category 5) - Texas 303(d) List (Category 5)
http://www.tceq.texas.gov/assets/public/compliance/monops/water/10twqi/2010_303d.pdf
Texas Commission on Environmental Quality, Austin, Texas.
Texas Water Commission. 1992. 1992 303d list. Texas Water Commission, Austin, Texas.
Texas Water Quality Board (TWQB). 1976. Water Quality Segment Report for Segment
1103. . Texas Water Quality Board, Surveillance Section, Field Operations Division,
Austin, Texas.
United States Environmental Protection Agency. 1983. Methods for Chemical Analysis of
Water and Wastes. United States Environmental Protection Agency, Washington,
D.C.
United States Environmental Protection Agency. 2005. Model Report for Christina River
Basin, Pennsylvania, Delaware, and Maryland, High-Flow Nutrient and DO TMDL
Development. USEPA, Philadelphia, PA.

97 Sedimentation Study of Dickinson Bayou Tidal (Segment 1103)
United States Environmental Protection Agency. 2010. Test Methods for Evaluating Solid
Waste, Physical/Chemical Methods United States Environmental Protection
Agency.

98 Sedimentation Study of Dickinson Bayou Tidal (Segment 1103)
Appendix 1. Field Data
Electronic Supplement: included in attached compact disk
- Dickinson Sediment Database (Excel) - Dickinson Sediment Field Datasheets (PDF)
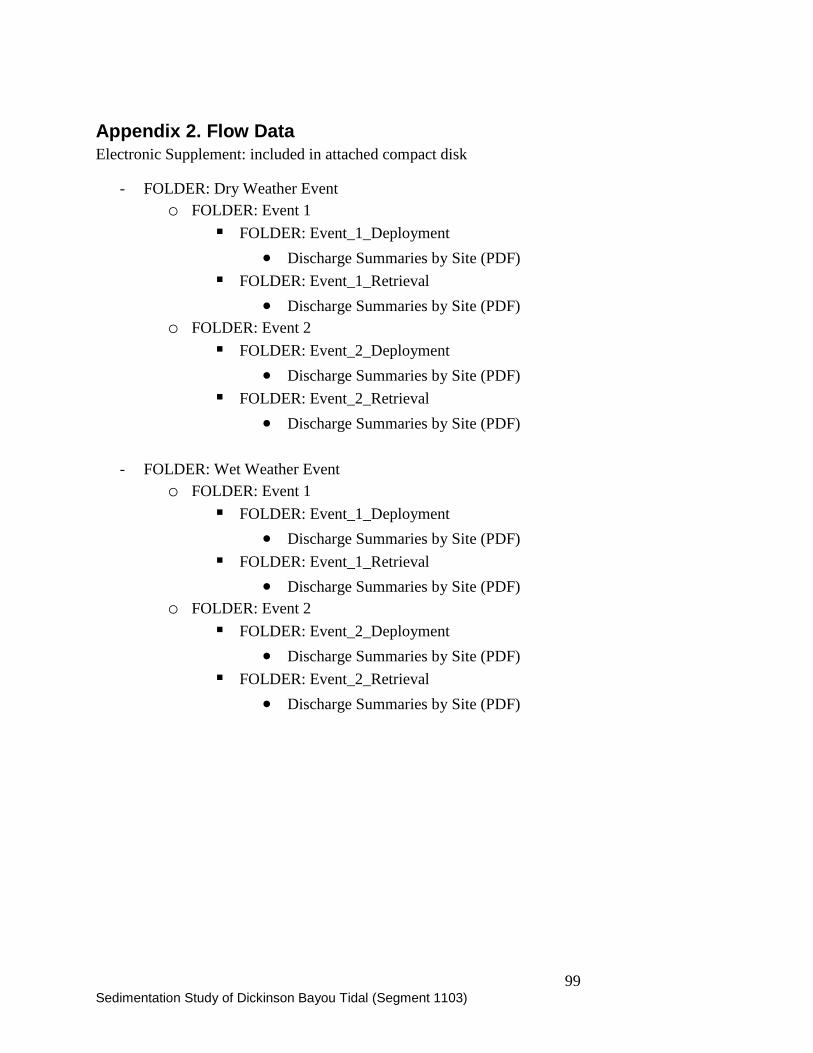
99 Sedimentation Study of Dickinson Bayou Tidal (Segment 1103)
Appendix 2. Flow Data
Electronic Supplement: included in attached compact disk
- FOLDER: Dry Weather Event o FOLDER: Event 1
FOLDER: Event_1_Deployment
Discharge Summaries by Site (PDF)
FOLDER: Event_1_Retrieval
Discharge Summaries by Site (PDF) o FOLDER: Event 2
FOLDER: Event_2_Deployment
Discharge Summaries by Site (PDF)
FOLDER: Event_2_Retrieval
Discharge Summaries by Site (PDF)
- FOLDER: Wet Weather Event
o FOLDER: Event 1
FOLDER: Event_1_Deployment
Discharge Summaries by Site (PDF)
FOLDER: Event_1_Retrieval
Discharge Summaries by Site (PDF) o FOLDER: Event 2
FOLDER: Event_2_Deployment
Discharge Summaries by Site (PDF)
FOLDER: Event_2_Retrieval
Discharge Summaries by Site (PDF)
100 Sedimentation Study of Dickinson Bayou Tidal (Segment 1103)
Appendix 3. Sonde Calibration
Electronic Supplement: included in attached compact disk
- Dickinson Sediment Calibration Logs (PDF) - Dickinson Sediment Sonde Calibration Log (Excel)

101 Sedimentation Study of Dickinson Bayou Tidal (Segment 1103)
Appendix 4. Photographic Record
Electronic Supplement: included in attached compact disk
- FOLDER: All Photos o Photos corresponding to Photo Record Sheet (JPEG)
- Dickinson Sediment Photo Record (Excel)
- Photographic Record Photo Contact Sheet (PDF)

102 Sedimentation Study of Dickinson Bayou Tidal (Segment 1103)
Appendix 5. Rainfall Data
Electronic Supplement: included in attached compact disk
- NWS LC Daily weather 2-2011 to 6-2012 (Excel)

103 Sedimentation Study of Dickinson Bayou Tidal (Segment 1103)
Appendix 6. Tide Data
Electronic Supplement: included in attached compact disk
- Compiled TROLL and Tide data 2-14-11 to 6-11-12 (Excel)
Reviewed: 7/29/2021