sediment load calculations from point measurements in...
TRANSCRIPT

International Journal of Sediment Research, Vol. 30, No. 1, 2015, pp. 1–12 - 1 -
International Journal of Sediment Research 30 (2015) 1-12
Sediment load calculations from point measurements in sand-bed rivers
Seema C. SHAH-FAIRBANK1 and Pierre Y. JULIEN2
Abstract
Point velocity and suspended sediment concentration measurements are used to calculate the total sediment
discharge in sand-bed rivers. Calculations with the Series Expansion of the Modified Einstein Point Procedure
(SEMEPP) depend on grain diameter ds and settling velocity ω, flow depth h, shear velocity u*, and sampling
depth hp. This procedure extends the applicability of the Modified Einstein Procedure (MEP) by using point
sediment concentration and velocity measurements. This procedure is tested using the laboratory data from
Coleman, and field measurements from the Enoree, Middle Rio Grande and Mississippi Rivers. Based on 801
point measurements over 124 verticals at flow depths ranging from 0.17 m to 33.5 m and sediment
concentrations less than 0.1 kg L-1, the accuracy of the calculations depends on u*/ω and hp/ds. Point
measurement techniques like SEMEPP are well-suited when u*/ω > 5 where at least 60% of the total sediment
load is measured when 90% of the flow depth is sampled. The determination of sediment discharge from point
measurements is most accurate in deep rivers when hp/ds > 10,000, and u*/ω > 10. Point measurements are not
well-suited for shallow rivers and laboratory flumes where h < 0.5 m and when u*/ω < 2.
Key Words: Point measurements, Concentration profiles, Velocity profiles, Total sediment load, Modified
Einstein Procedure
1 Introduction
Difficulties in calculating the total sediment load in sand-bed rivers from the combination of suspended and bed loads
continue to persist. Suspended sediment concentration profiles in open channels corroborate the theory of turbulent
mixing and the logarithmic velocity profile for turbulent flows (Rouse, 1937). The Rouse number */ uRo bkw= is
function of the fall velocity ω, the shear velocity u*, the momentum correction factor for sediment β and the von
Kármán constant κ. The Rouse number (Ro) is a ratio of the sediment property to the hydraulic characteristics of the
flow. High values of the Ro (greater than 5) describe bed-load sediment transport, while low values of Ro (less than 0.5)
result in near-uniform sediment concentration profiles and sediment transported in suspension (Dade and Friend, 1998;
Julien, 2010).
Einstein (1950) developed a method to determine the total sediment load in open channels. The method uses the bed
load function from Einstein (1942) and determines the suspended sediment concentration profiles from Rouse (1937).
The integral of the product of the logarithmic velocity and the Rouse concentration profiles resulted in the Einstein
integrals, which are analytically intractable. Recent developments through series expansions have improved the
accuracy of the estimation of the Einstein integrals (Guo and Julien, 2004), which are applied in this study. When the Einstein procedure was later applied to sand-bed rivers, inaccuracies emerged because this method could not
define the wash load, which comprises the transport of the very fine sediment particles not found in the bed. The
determination of the wash load concentration can only be accomplished through field measurements of suspended
sediment concentrations. The subsequent analysis of the measured suspended sediment concentration led to the
determination of the total sediment load using the Modified Einstein Procedure (MEP) developed by Colby and
Hembree (1955). The MEP uses a combination of the Einstein bed load function (Einstein, 1942; 1950) and an
extension of the velocity and concentration profiles in the unmeasured zone to estimate a total load as sketched in Fig. 1.
The original MEP used depth-integrated sediment concentration measurements and the particle size distribution of the
bed material to determine the total load. The MEP was first successfully tested with data from the Niobrara River
1 Assis. Prof. Dr., Department of Civil Engineering, California State Polytechnic University, Pomona, CA. 91765, U.S.A., E-mail:
[email protected]. 2 Prof. Dr., Department of Civil and Environmental Engineering, Colorado State University, Fort Collins, CO 80523, U.S.A.
E-mail: [email protected]
Note: The original manuscript of this paper was received in Apr. 2014. The revised version was received in May 2014. Discussion
open until Jan. 2016.

- 2 - International Journal of Sediment Research, Vol. 30, No. 1, 2015, pp. 1–12
(Colby and Hembree, 1955). However, further complications did arise when there is not enough overlap between
sediment particles sizes in suspension and in the bed material. For instance, the MEP could not calculate the total
sediment load for gravel-bed streams with sand sizes in suspension. Several modifications have thereafter been
proposed to determine the total sediment load transported in sand-bed rivers (Colby and Hubbell, 1961; Lara and
Pemberton, 1963; Ackers and White, 1973; Burkham and Dawdy, 1980; Shen and Hung, 1983; O’Brien, 2000).
Fig. 1. Definition sketch for sediment measurements in suspension
Point measurements of sediment concentration and flow velocity are useful in sand-bed rivers. When compared with
depth-integrated measurements, greater accuracy can be obtained with point measurements because of the larger
sampling volumes for the determination of sediment concentration as well as particle size distribution of suspended
sediment. Thus point measurements present definite advantages in the determination of the sediment load in deep
sand-bed channels.
The main purpose of this study is to determine the accuracy of total sediment load calculations based on point velocity
and sediment concentration measurements. In this article, a new procedure referred to as the Series Expansion of the
Modified Einstein Point Procedure (SEMEPP) is developed for the analysis of the total sediment load with point
measurements. This article employs the use of the series expansion to solve the Einstein integrals (Guo and Julien,
2004). The study provides an extension of the MEP to point samples by fitting the Rouse suspended sediment
concentration profiles and logarithmic velocity profiles to the measured point data. The new procedure is tested with
several data sets covering a wide range of flow and sediment conditions ranging from shallow laboratory experiments to
deep sand-bed rivers. The analysis aims at providing guidelines on the conditions required for an accurate determination
of the total sediment load. The most relevant questions addressed in this article include: (1) under what conditions can
total sediment load be accurately determined using point measurements of flow velocity and sediment concentration;
and (2) what percentage of the water column should be sampled for an accurate determination of the total sediment load.
The analysis of field measurements will also identify the minimum sampling depth needed to obtain accurate total load
calculations.
2 Total sediment load from point measurements
2.1 Measured total load
Point velocity and concentration measurements are collected at fixed locations along a vertical water column, as
sketched in Fig. 2a. At each point i, flow velocity vi and sediment concentration measurement Ci are taken. The data
from the point measurements allow for fitting the sediment concentration profile directly to the data set. In some cases,
the particle size distribution of each sample is collected at each point, which allows the determination of the suspended
sediment concentration for each size fraction. In general, suspended sediment concentration measurements cannot be
obtained at the bed or free surface (Edwards and Glysson, 1999). Sediment concentration is assumed to be zero at the
water surface and flow velocity is assumed zero at the bed. On the other hand the concentration at the bed and the
velocity at the free surface are assumed to be equal to the nearest measurement.
The sediment flux (sediment discharge per unit area imparted by the velocity current) is determined from the product
of flow velocity and sediment concentration as shown in Eq. (1). The unit sediment discharge is obtained from the
integral of the sediment flux. With point measurements, this is accomplished by using the trapezoidal rule as sketched in
Fig. 2b with p = 5. The measured total unit sediment discharge corresponds to the summation from 0 to p from the free
surface to the bed, or:

International Journal of Sediment Research, Vol. 30, No. 1, 2015, pp. 1–12 - 3 -
Fig. 2. Measured sediment load from point velocity and sediment concentration
( ) ( )1 1 1
0
0.5 v vp
tm i i i i i iq C C h h+ + += + -∑
(1)
where, qtm is the total measured unit sediment discharge based on p point samples, Ci and vi are respectively the
sediment concentration and flow velocity at a given point i, and hi+1 - hi is the vertical layer thickness.
By increasing the number of point measurements, the accuracy of the calculated total measured unit sediment
discharge is expected to increase. This occurs because the concentration and velocity profiles have a higher degree of
certainty. By including additional discrete points the summation of the measured sediment concentration profile will be
closer to the actual sediment discharge. However, when both the Rouse number Ro and the ratio of the lowest point
sampling depth to the water column depth (P = zp/h) are large, this approach can lead to highly inaccurate results.
When bed load is dominant (large Ro), most of the sediment transport will occur below the lowest sampling point
location (Dade and Friend, 1998; Julien, 2010). Thus, guidelines are needed to define the range of applicability of
point measurement techniques in terms of u*/ω (or Ro) and P. To quantify the accuracy of sediment transport from point
measurements, the concept of partial sediment discharge is introduced. The partial sediment load is the sediment
transported in the water column between the free surface and the lowest sampling point p. It may be interesting to point
out that the partial sediment load is normally called the measured load (Julien, 2010). However, the term “partial load”
is preferred in this article to avoid possible confusion between sediment quantities that have been measured and
calculated. Therefore, the measured partial unit sediment discharge qpm can be determined from 0 to p-1, using the
rectangular rule (Fig. 2b):
( )( )1
1 1 1
0
0.5 v vp
pm i i i i i iq C C h h
-
+ + += + -∑
(2)
In Section 3, the analysis of qpm/qtm will determine whether point sampling is appropriate to measure most of the
sediment load that is transported. Also, the investigation of zp (or P) will be used to quantify the increase in measured
sediment load as the sampling points get closer to the bed.
2.2 SEMEPP procedure
This analysis (SEMEPP) expands upon the Series Expansion of the Modified Einstein Procedure (SEMEP) developed
by Shah-Fairbank et al. (2011). While SEMEP was based on depth-integrated samples, the SEMEPP analysis is based
on point measurements. SEMEP has been shown to work well in sand-bed rivers (Shah-Fairbank et al., 2011). When the
suspended sediment concentration profiles became uniform (low Ro) the momentum correction factor for sediment β
and the von Kármán constant κ become irrelevant. One of the main features of SEMEPP has been to simply report the
results as a function of u* and ω. This parametric description does not require any assumption regarding the values of κ
and β. The ratio u*/ω is favored over the Rouse number as part of the overall improvements of the MEP procedure. For
the comparison of u*/ω with the Rouse number in this study, it has been assumed that β = 1 and κ = 0.4. The value of ω
is calculated as: [ ]{ }10139.01 8 5.0 3
* -+= dd
v
s
w .
The main features of SEMEPP include the following: (1) fit the concentration profile to the point concentration
measurements to determine the reference concentration Cb and Ro; (2) fit a logarithmic velocity profile to the point
velocity data to determine u* and depth of zero velocity zo; (3) use the series expansion algorithm of Guo and Julien
(2004) to solve the Einstein integrals; and (4) calculate the sediment load by integrating the advective flux of sediment
(Cv) using parts (1) and (2). SEMEPP is therefore an extension of the MEP to point measurements. The reason we
continue to refer to the procedure as the MEP is because the procedure uses field measurements and the Einstein
integrals. Improvements beyond the existing MEP are expected because point concentration measurements can define

- 4 - International Journal of Sediment Research, Vol. 30, No. 1, 2015, pp. 1–12
the sediment concentration profiles, which the depth-integrated samples of the original MEP could not do. The use of
the series expansion should improve the accuracy of calculating the Einstein integrals over other methods. Finally,
guidelines based on u*/ω will also remove any uncertainly associated with β and κ.
2.3 Sediment load calculation using SEMEPP
The SEMEPP procedure requires point measurements to define the velocity distribution and the sediment
concentration along a vertical profile (water column). The turbulent velocity profile (law of wall) within a river is based
on the logarithmic velocity distribution (Keulegan, 1938).
*v lno
u z
zk=
(3)
where v is the velocity at a distance z above the bed, u* is the shear velocity, κ is the von Kármán constant assumed
equal to 0.4, and zo is the vertical elevation where the velocity equals zero. In SEMEPP, the values of u* and zo are
determined by fitting Eq. (3) to the entire velocity profile obtained from the point velocity measurements.
Alternatively, when the friction slope Sf of the river is available, the shear velocity u* can be determined based on the
following relationshipfghSu =*
.
The sediment concentration profile is described by the Rouse equation (Rouse, 1937). The suspended sediment
distribution described in Eq.(4) provides the concentration at a specified distance z above the bed.
(4) Ro
bb
b
zh zC C
z h z
-= -
(4)
where C is the concentration at an elevation z above the bed, Cb is the concentration at the reference elevation zb = 2ds
above the bed and h is the total depth of flow. In SEMEPP, the values of Ro and Cb are determined by fitting the Rouse
power function [Eq. (4)] to the concentration measurements. Figure 3 shows a schematic of the calculation procedure
from SEMEPP.
Fig. 3 Sketch of the sediment load calculation from SEMEPP
The unit sediment discharge by advection is given by the depth-integration of the product of sediment concentration C
and flow velocity v. SEMEPP provides calculations of the unit total sediment discharge qt, the unit suspended sediment
discharge qs and the partial unit suspended sediment discharge qp respectively.
0
h
t
z
q Cvdz= ∫
(5a)
b
h
s
z
q Cvdz= ∫
(5b)
p
h
p
z
q Cvdz= ∫
(5c)
where h is the total flow depth, zb is the depth of the bed layer defined by Einstein as the reference depth of 2ds, and zp is
the elevation above the bed of the lowest point measurement. The values of qp and qt are sketched in Fig. 3. The ratio of
qp/qt defines the fraction of the total sediment load transported in the sampling depth as calculated by SEMEPP.
From SEMEPP, the partial unit sediment discharge is then evaluated from Eq. (5c), after considering Eqs. (3) and (4),
and can be expanded as follows:

International Journal of Sediment Research, Vol. 30, No. 1, 2015, pp. 1–12 - 5 -
∫
--=
h
z ob
bbp
p
dzz
zu
zh
z
z
zhCq ln*
Ro
k
(6)
+
-= PP
o
bp JJ
z
h
B
BhuCq 21
Ro
* ln1k
(7)
*
1 Ro
*
*1
1dz
z
zJ
P
P ∫
-=
(8)
*
1 Ro
*
**2
1ln dz
z
zzJ
P
P ∫
-=
(9)
where, qp is the partial unit sediment discharge calculated from SEMEPP, zb = 2ds is the reference elevation, zp is the
nozzle height above the bed for the lowest measured point sample (Fig. 3), the bed layer ratio is B = zb/h, the partial
depth ratio is P = zp/h, the integration variable is the relative depth z* = z/h, and J1P and J2P are the modified Einstein
integrals for the partial sediment load. In SEMEPP, u* and zo are determined from the velocity profile assuming κ =
0.4, while Ro and Cb are determined from the point concentration measurements. The Einstein integrals for partial
load J1P and J2P in Eqs. (8) and (9) are solved with the series expansion algorithm of Guo and Julien (2004).
The total unit sediment discharge is calculated based on the sum of the bed and suspended sediment discharge. The
bed load transport function qb in the bed layer of thickness zb = 2ds and the near-bed velocity vb are based on Einstein’s
bed load analysis (1942, 1950).
*; where v ; and v 11.6t b s b b b b bq q q q C z u= + = =
(10)
∫
--+=
h
z ob
bbbt
b
dzz
zu
zh
z
z
zhCqq ln*
Ro
k
(11)
Ro
*1 2v ln
1
bt b b b S S
o
C hu B hq C z J J
B zk = + + -
(12)
*
1 Ro
*
*1
1dz
z
zJ
B
S ∫
-=
(13)
*
1 Ro
*
**2
1ln dz
z
zzJ
B
S ∫
-=
(14)
where, qt is the total calculated unit sediment discharge, qb is the total unit bed load discharge, Vb is the flow velocity in
the bed layer of thickness zb = 2ds, B = zb/h = 2 ds /h, and J1S and J2S are the Einstein integrals for the suspended
sediment zone. SEMEPP uses u*, zo, Ro and Cb from the velocity and concentration profiles, and qb is determined from
Cb, vb = 11.6 u*. The Einstein integrals for the suspended sediment load J1S and J2S in Eqs. (13) and (14) are solved with
the series expansion algorithm developed by Guo and Julien (2004). 3 Experimental verification of -SEMEPP
3.1 Laboratory and field data
To validate SEMEPP, accurate point measurements were analyzed for both laboratory and river conditions. The data
sets listed in Table 1 include point measurements (velocity and concentration) from Coleman’s laboratory experiments,
the Enoree, Middle Rio Grande and Mississippi Rivers. These data sets were obtained from previously published
sources and compiled by Shah-Fairbank (2009). The total data sets include 124 verticals (water columns) and a total of
801 point velocity and point concentration measurements. These data sets were selected to provide a wide range in flow
depth (0.017 m < h < 33.5 m), unmeasured depth (0.006 m < zp < 2.2 m), measured total sediment transport
[(0.01 kg m-1﹒s
-1) < qt < (32 kg m
-1﹒s
-1)] and relative submergence (1,600 < h/ds < 530,000). This also allowed for a
continuous range of values for u*/ω and hp/ds to identify the domain of applicability of SEMEPP.
Coleman’s laboratory data were measured in a laboratory flume (15 m long by 33 cm wide). The flow velocity and
sand concentration profiles were collected for sand particles in suspension ranging in size from 0.088 mm to 0.5 mm
(Coleman, 1981, 1986).
The Enoree River data set is based on field measurements made in relatively regular and straight reach (Anderson,
1942). At the sampling location, the sand-bed river was 15 m wide with near vertical banks. Numerous samplers
regularly spaced on a sounding cable provided concurrent measurements of flow velocity and suspended sediment
concentrations. The particle measured in suspension ranged from 0.07 to 0.99 mm.

- 6 - International Journal of Sediment Research, Vol. 30, No. 1, 2015, pp. 1–12
Table 1 Main characteristics of the data set
Data Set No. of
verticals sampled
No. of
points samples h (m) zp (m) ds (mm) h/ds * 1000
Coleman Lab Data
(Coleman, 1986) 6 12 0.170 to 0.172 0.006 0.1 1.6
Enoree River, SC
(Anderson, 1942) 6 8 0.9 to 1.6 0.06 to 0.103 0.2 to 0.25 3.2 to 6.2
Middle Rio Grande at
Bernalillo, NM (Nordin
and Dempster, 1963)
4 4 0.7 to 0.8 0.27 to 0.37 0.07 11.5 to 12.5
Mississippi River. MS
(Akalin, 2002) 108 6 6.4 to 33.5 0.4 to 2.2 0.4 to 0.6 15 to 530
The United States Bureau of Reclamation took point suspended sediment and velocity measurements on the Middle
Rio Grande (Nordin and Dempster, 1963). The velocity measurements were taken using a Price current meter and the
suspended sediment measurements were obtained using a US P-46. The particle measured in suspension ranged from
less than 0.0625 to 0.5 mm, however the median particle size was always within the sand range.
The United States Army Corps of Engineers collected data near the Old River Control Complex of the Mississippi
River in 1998 by the Waterways Experiment Station. The equipment used for the measurements includes: Acoustic
Doppler Current Profiler, US P-63, drag bucket, Price current meter and depth sounder. Data at four sites (Union Point,
Line 13, Line 6 and Tarbert Landing) were used and compiled by Akalin (2002). The particle measured in suspension
ranged from 0.0625 to 2 mm.
3.2 Total sediment load comparison
The measured total sediment load was determined from Eq. (1). The calculated total sediment load was determined
from SEMEPP using Eq. (12). A comparison of the calculated and measured total loads is shown in Fig. 4 with each
river represented by a distinct symbol. A twenty five percent error band has been placed on the figure. As the measured
unit total sediment discharge increases, a higher degree of accuracy is achieved between measured and calculated
(SEMEPP) total sediment discharge.
Fig. 4 Total sediment load comparison
3.3 Applicability of SEMEPP
This section addresses the first issue raised in the introduction: under what conditions can the total sediment load be
accurately determined using point measurements. In other words, under what conditions can SEMEPP calculate most of
the sediment load transported in a sand-bed channel? The answer to this question is found in the ratio of the partial to
the total sediment load qp/qt. Point measurements can effectively measure most of the transport rate when the ratio is
high. On the other hand, low values of qp/qt describe conditions where most of the sediment is transported as bed load,
in which case, point measurement techniques would not be appropriate.
From the measurements, the ratio of the partial to total unit sediment discharge qpm/qtm is determined for each sample
based on Eqs. (1) and (2). SEMEPP is also used to determine the calculated values of the ratio of partial to total unit
International Journal of Sediment Research, Vol. 30, No. 1, 2015, pp. 1–12 - 7 -
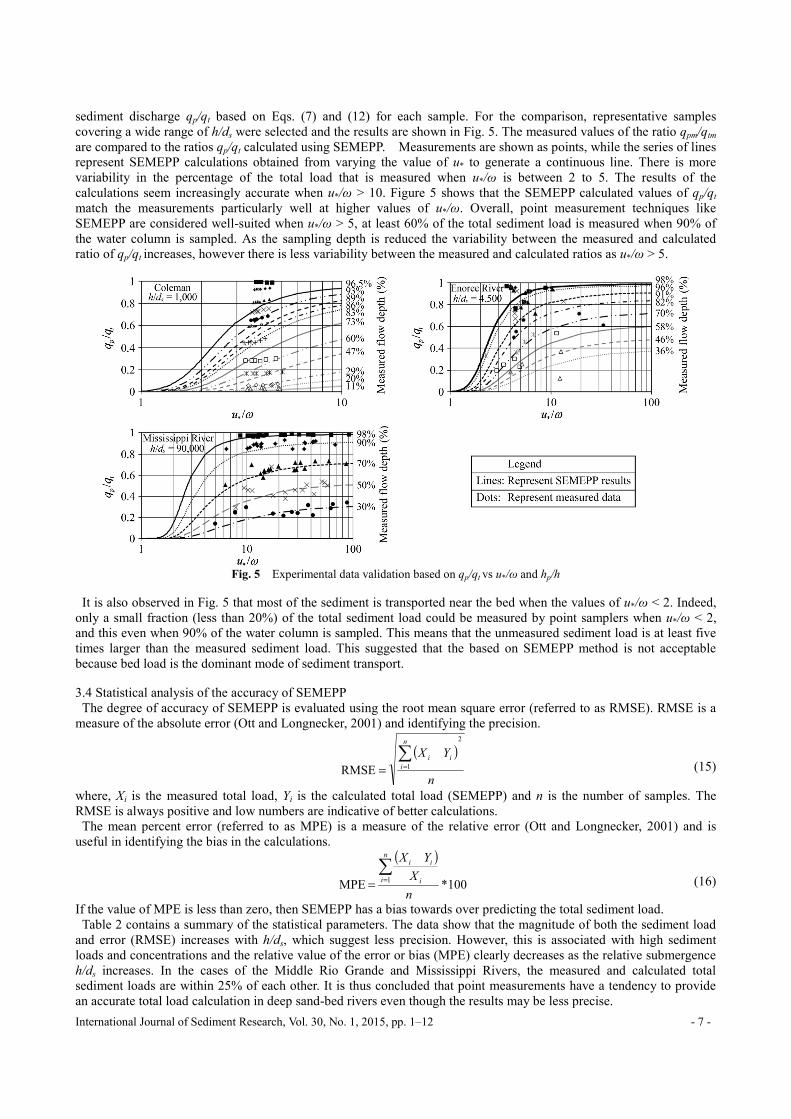
sediment discharge qp/qt based on Eqs. (7) and (12) for each sample. For the comparison, representative samples
covering a wide range of h/ds were selected and the results are shown in Fig. 5. The measured values of the ratio qpm/qtm
are compared to the ratios qp/qt calculated using SEMEPP. Measurements are shown as points, while the series of lines
represent SEMEPP calculations obtained from varying the value of u* to generate a continuous line. There is more
variability in the percentage of the total load that is measured when u*/ω is between 2 to 5. The results of the
calculations seem increasingly accurate when u*/ω > 10. Figure 5 shows that the SEMEPP calculated values of qp/qt
match the measurements particularly well at higher values of u*/ω. Overall, point measurement techniques like
SEMEPP are considered well-suited when u*/ω > 5, at least 60% of the total sediment load is measured when 90% of
the water column is sampled. As the sampling depth is reduced the variability between the measured and calculated
ratio of qp/qt increases, however there is less variability between the measured and calculated ratios as u*/ω > 5.
Fig. 5 Experimental data validation based on qp/qt vs u*/ω and hp/h
It is also observed in Fig. 5 that most of the sediment is transported near the bed when the values of u*/ω < 2. Indeed,
only a small fraction (less than 20%) of the total sediment load could be measured by point samplers when u*/ω < 2,
and this even when 90% of the water column is sampled. This means that the unmeasured sediment load is at least five
times larger than the measured sediment load. This suggested that the based on SEMEPP method is not acceptable
because bed load is the dominant mode of sediment transport.
3.4 Statistical analysis of the accuracy of SEMEPP
The degree of accuracy of SEMEPP is evaluated using the root mean square error (referred to as RMSE). RMSE is a
measure of the absolute error (Ott and Longnecker, 2001) and identifying the precision.
( )
n
YXn
i
ii
2
1RMSE
∑=
-=
(15)
where, Xi is the measured total load, Yi is the calculated total load (SEMEPP) and n is the number of samples. The
RMSE is always positive and low numbers are indicative of better calculations.
The mean percent error (referred to as MPE) is a measure of the relative error (Ott and Longnecker, 2001) and is
useful in identifying the bias in the calculations.
( )100*MPE
1
n
X
YXn
i i
ii∑=
-
=
(16)
If the value of MPE is less than zero, then SEMEPP has a bias towards over predicting the total sediment load.
Table 2 contains a summary of the statistical parameters. The data show that the magnitude of both the sediment load
and error (RMSE) increases with h/ds, which suggest less precision. However, this is associated with high sediment
loads and concentrations and the relative value of the error or bias (MPE) clearly decreases as the relative submergence
h/ds increases. In the cases of the Middle Rio Grande and Mississippi Rivers, the measured and calculated total
sediment loads are within 25% of each other. It is thus concluded that point measurements have a tendency to provide
an accurate total load calculation in deep sand-bed rivers even though the results may be less precise.

- 8 - International Journal of Sediment Research, Vol. 30, No. 1, 2015, pp. 1–12
Table 2 Statistical results for the measured vs calculated sediment load qt
Measured total load
(kg m-s-1)
Measured vs.
SEMEPP total load Data set h/ds % flow
measured hp/ds
Min Max MEP (%) RMSE (kg m-s-1)
Coleman Lab Data 1,000 96% 965 0.13 0.71 -13.1 0.064
Enoree River, SC 4,500 98% 4,410 0.01 0.12 -7.9 0.005
Middle Rio Grande, NM 12,000 87% 10,436 0.62 1.43 -5.9 0.073
Mississippi - Tarbert 55,000 98% 53,900 1.47 12.86 1.4 0.296
Mississippi - Union Point 75,000 98% 73,500 2.95 19.43 1.7 0.7
Mississippi - Line 6 90,000 98% 88,200 1.28 20.03 0.4 0.332
Mississippi - Line 13 110,000 98% 107,800 4.70 32.35 0.7 0.798
3.5 Analysis of the effect of sampling depth hp
This section addresses the second issue raised in the introduction: what percentage of the water column should be
sampled for an accurate determination of the total sediment load. Both the channel bed material and flow depth will
affect the results. Figure 5 readily shows an increase fraction of qp/qt as the sampling depth increases. The accuracy in
the calculations of sediment load increases with the value of u*/ω. Thus when u*/ω = 10, only 50% of the water column
of the Mississippi River needs to be sampled for measured and calculated total load to be within 35%. On the other
hand, 90% of the water column of the Enoree River will need to be sampled.
To probe deeper into the effect of sampling depth, a sensitivity analysis on the accuracy of partial sampling is performed
by varying the number of sediment concentration measurements used to fit the Rouse equation. The purpose of varying
the number of point sediment samples is to determine what partial sampling depth could yield reasonable results in deep
rivers. The total suspended sediment load using SEMEPP was re-calculated for the different sampling depths and the
RMSE and MPE were determined for the entire data set containing 668 data points. The total sediment load calculated
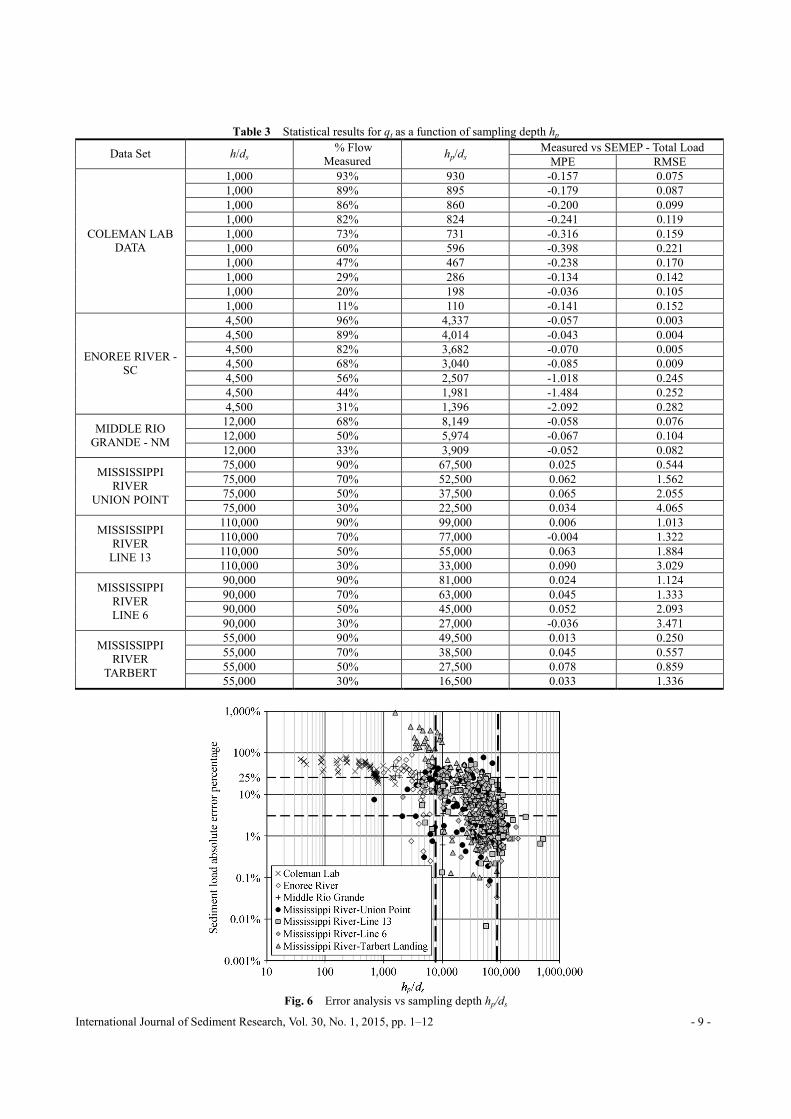
from SEMEPP was compared to the measured total load. Table 3 provides a representative summary of the RMSE and
MPE results for various sampling depths. In general, the RMSE and MPE tend to increase as the sampling depth
decreases. Under certain circumstances the statistical parameters decrease with reduced sampling depth. This occurs due
to lower surface concentrations. Shallow rivers with hp/h < 10,000 have a tendency to over predict total sediment load,
thus resulting in a negative MPE. The Enoree River has a high negative MPE value due to the ratio of u*/ω and the high
amounts of washload. The absolute percent error was determined for each of the 668 samples from:
i
ii
X
YXError
-=
*100%
(17)
Figure 6 provides a graphical display of all the results. Table 4 also summarizes the analysis of the average values of
the absolute error percentage as a function of hp/ds at each site. The analysis clearly shows that a higher percentage
(70%) of points have an error less than 25% when hp/ds increases.
This analysis shows that sediment load predictions in deep rivers are more accurate (lower error percentage) than
shallow rivers and laboratory flumes, as shown in Table 4. It is concluded that a value of hp/ds > 10,000 (Table 3 and Fig.
6) would result in sufficiently accurate sediment load calculations from SEMEPP because approximately 60% of the
samples have an absolute percent error less than 25%. This leads to results of practical significance. This implies that
for a grain diameter of 0.1 mm, accurate sediment load calculations from point measurements require a minimum
sampling depth in excess of 1 m.
4 Applicability of SEMEPP in sand-bed rivers
The domain of applicability of SEMEPP in shallow and deep sand-bed rivers is determined from a representative
application example. The particle size is kept constant at 0.2 mm (fine sand), and the values of qp/qt are calculated for
typical values of sampling depth. For instance, the value for zp = 10 cm corresponds to the nozzle height of standard
point samplers (e.g. P-61 and P-63). Based on the findings in Table 3, it is considered that point measurements would be
useful when that hp/ds > 10,000 which corresponds to a minimum flow depth of 2 m.
The results in Fig. 7 show that regardless of the river size, once the value of u*/ω > 5 it becomes possible to measure
most (qp/qt > 50%) of the total sediment load from a standard sampler, zp = 10 cm. For instance in Fig. 7c at a flow
depth of 20 m (measuring approximately 99.5% of the water column), over 90% of the total sediment load (qp/qt) would
be measured using point samples from 10 cm above the bed to the free surface when u*/ω = 5. In comparison, Fig. 7a
shows a shallow stream where a maximum of 80% of the water column is measured and only 53% of the total sediment
load being measured. This means that accurate sampling over a partial flow depth is best suited for deep rivers carrying
fine sediment while measurements become less accurate in shallow and small streams. The main contribution of this
article is that the percentage of the sediment load that is measured in shallow and deep sand-bed rivers can be
determined as a function of the sampling depth zp and u*/ω.
International Journal of Sediment Research, Vol. 30, No. 1, 2015, pp. 1–12 - 9 -
Table 3 Statistical results for qt as a function of sampling depth hp
Measured vs SEMEP - Total Load Data Set h/ds
% Flow
Measured hp/ds
MPE RMSE
1,000 93% 930 -0.157 0.075
1,000 89% 895 -0.179 0.087
1,000 86% 860 -0.200 0.099
1,000 82% 824 -0.241 0.119
1,000 73% 731 -0.316 0.159
1,000 60% 596 -0.398 0.221
1,000 47% 467 -0.238 0.170
1,000 29% 286 -0.134 0.142
1,000 20% 198 -0.036 0.105
COLEMAN LAB
DATA
1,000 11% 110 -0.141 0.152
4,500 96% 4,337 -0.057 0.003
4,500 89% 4,014 -0.043 0.004
4,500 82% 3,682 -0.070 0.005
4,500 68% 3,040 -0.085 0.009
4,500 56% 2,507 -1.018 0.245
4,500 44% 1,981 -1.484 0.252
ENOREE RIVER -
SC
4,500 31% 1,396 -2.092 0.282
12,000 68% 8,149 -0.058 0.076
12,000 50% 5,974 -0.067 0.104 MIDDLE RIO
GRANDE - NM 12,000 33% 3,909 -0.052 0.082
75,000 90% 67,500 0.025 0.544
75,000 70% 52,500 0.062 1.562
75,000 50% 37,500 0.065 2.055
MISSISSIPPI
RIVER
UNION POINT 75,000 30% 22,500 0.034 4.065
110,000 90% 99,000 0.006 1.013
110,000 70% 77,000 -0.004 1.322
110,000 50% 55,000 0.063 1.884
MISSISSIPPI
RIVER
LINE 13 110,000 30% 33,000 0.090 3.029
90,000 90% 81,000 0.024 1.124
90,000 70% 63,000 0.045 1.333
90,000 50% 45,000 0.052 2.093
MISSISSIPPI
RIVER
LINE 6 90,000 30% 27,000 -0.036 3.471
55,000 90% 49,500 0.013 0.250
55,000 70% 38,500 0.045 0.557
55,000 50% 27,500 0.078 0.859
MISSISSIPPI
RIVER
TARBERT 55,000 30% 16,500 0.033 1.336
Fig. 6 Error analysis vs sampling depth hp/ds

- 10 - International Journal of Sediment Research, Vol. 30, No. 1, 2015, pp. 1–12
Table 4 Summary of error analysis as a function of relative sampling depth hp/ds
hm/ds>1000 and % difference < 25% hm/ds >10,000 and % difference < 25% Data set
Number of
samples Number of
samples % of samples
Number of
samples % of samples
Coleman lab data 72 3 4.2% 0 0%
Enoree river, SC 43 23 53.5% 0 0%
Middle RIO GRande, NM 20 12 60.0% 3 15%
Mississippi - Tarbert 145 122 84.1% 104 71.7%
Mississippi - Union point 140 128 91.4% 116 82.9%
Mississippi - Line 6 115 99 86.1% 88 76.5%
Mississippi - Line 13 133 91 68.4% 91 68.4%
Total 668 478 71.6% 402 60.2%
Fig. 7 Point sampling efficiency for sand-bed rivers
5 Conclusions
This study determines under what conditions point velocity and sediment concentration measurements can be used to
calculate total sediment discharge in sand-bed rivers. A new total sediment discharge calculation algorithm based on the
Series Expansion of the Modified Einstein Point Procedure (SEMEPP) is presented. This procedure provides uses to use
point sediment data with the Modified Einstein approach for a high degree of reliability with evaluation of total
sediment load. The procedure is tested with a wide range of laboratory and field data totaling 801 point measurements
on 124 verticals at sediment concentrations less than 0.1 kg l-1
. The ratio of shear to fall velocities u*/ω is very
important to determine when point measurements can be effective in sand-bed rivers. Point measurement techniques
like SEMEPP are well-suited when u*/ω > 5, in such case, at least 60% of the total sediment load is measured when
90% of the flow depth is sampled. The determination of sediment discharge from point measurements is most accurate
in deep rivers when u*/ω > 10 and hp/ds > 10,000. The root mean square error (RMSE) increases (less precision) while
the relative error (MPE) decreases (less bias) as hp/ds increases. The effect of sampling depth has also been investigated.
For instance on the Mississippi at u*/ω = 10 from Fig. 5, only 36% of the total sediment load is measured when
sampling 50% of the flow depth. In comparison, more than 80% of the total sediment discharge can be measured when
sampling 90% of the water column. As illustrated in Fig. 7, the main contribution of this article is to quantify the
percentage of the sediment load that is measured in shallow and deep sand-bed rivers as a function of the sampling
depth zp and u*/ω. Finally, it is found that point measurements are not recommended for shallow rivers (h < 0.5 meters)
or when u*/ω < 2 because they only capture a small proportion of the total sediment load.
Acknowledgements
This research has been completed at Colorado State University under primary support from the Department of Defense
through the Center for Geosciences/Atmospheric Research at Colorado State University, under Cooperative Agreement
International Journal of Sediment Research, Vol. 30, No. 1, 2015, pp. 1–12 - 11 -
DAAD19-02-2-0005 with the Army Research Laboratory. The writers would also like to thank Dr. J. Guo at the
University of Nebraska and D. Baird and R. Padilla at the US Bureau of Reclamation. In addition, this work was
supported by the National Science Foundation under Grant No. 0548426 via an ADVANCE Institutional Transformation
(IT) Award. Any opinions, findings, and conclusions or recommendations expressed in this material are those of the
authors.
References
Ackers P. and White W. R. 1973, Sediment transport: new approach and analysis. Journal of Hydraulic Engineering., Vol. 99, No.
HY11, pp. 2041–2060.
Akalin S. 2002, Water temperature effect on sand transport by size fraction in the lower Mississippi River. Ph.D. dissertation.
Department of Civil Engineering. Colorado State University. Fort Collins, p. 218.
Anderson A. G. 1942, Distribution of suspended sediment in natural streams. Transactions American Geophysical Union, pp.
678–683.
Burkham D. E. and Dawdy D. R. 1980, General study of the Modified Einstein Method of computing total sediment discharge.
Washington, United States Geological Survey Professional Paper.
Colby B. R. and Hembree C. H. 1955, Computations of total sediment discharge, Niobrara River near Cody, Nebraska. Washington,
United States Geological Survey Professional Paper.
Colby B. R. and Hubbell D. W. 1961, Simplified method for computing total sediment discharge with the Modified Einstein
Procedure. Washington, United States Geological Survey Professional Paper.
Coleman N. L. 1981, Velocity profiles with suspended sediment. Journal of Hydraulic Research, Vol. 19, No. 3, pp. 211–229.
Coleman N. L. 1986, Effects of suspended sediment on the open channel velocity distribution. Water Resources Research, Vol. 22,
No. 10, pp. 1377–1384.
Dade W. B. and Friend P. F. 1998, Grain-Size, Sediment-Transport Regime and Channel Slope in Alluvial Rivers. Journal of
Geology, Vol 106, pp. 661–667.
Edwards T. K. and Glysson G. D. 1999, Field Methods for Measurement of Fluvial Sediment. US Geological Survey, Reston,
Virginia.
Einstein H. A. 1942, Formulas of the transportation of bed load. American Society of Civil Engineers, pp. 561–597.
Einstein H. A. 1950, The bed-load function for sediment transportation in open channel flows. Washington, DC, US Department of
Agriculture Soil Conservation Service.
Guo J. and Julien P. Y. 2004, Efficient algorithm for computing Einstein integrals. Journal of Hydraulic Engineering, pp. 1198–2001.
Julien P.Y. 2010, Erosion and Sedimentation. 2nd Edition, Cambridge University Press, New York, p. 371.
Keulegan G. H. 1938, Laws of turbulent flow in open channels. Journal of Research of the United States National Bureau of
Standards, Vol. 21, No. 6, p. 707
Lara J. M. and Pemberton E. L. 1963, Initial unit weight of deposited sediment. Denver, CO, Office of Assistant Commissioner and
Chief Engineer Bureau of Reclamation.
Nordin C. F. and Dempster G. R. 1963, Vertical distribution of velocity and suspended sediment, Middle Rio Grande, New Mexico,.
Washington, United States Geological Survey Professional Paper, p. 20.
O’Brien P. 2000, Development of techniques for estimating the unmeasured load in large rivers. M. S. Thesis, Department of Civil
and Environmental Engineering. New Orleans, University of New Orleans, p. 263.
Ott R. L. and Longnecker M. 2001, An introduction to statistical methods and data analysis, Fifth Edition, Duxbury Thomson
Learning.
Rouse H. 1937, Modern conceptions of the mechanics of turbulence. Transactions of the American Society of Civil Engineers, Vol.
102, pp. 463–505.
Shah-Fairbank S. C. 2009, Series expansion of the Modified Einstein Procedure. Ph.D. Dissertation. Civil and Environmental
Engineering Department. Colorado State University. Fort Collins, p. 238.
Shah-Fairbank S. C., Julien P.Y., and Baird D. C. 2011, Total Sediment Load from SEMEP Using Depth-Integrated Concentration
Measurements. Journal of Hydraulic Engineering, Vol. 137, No. 12, pp 1606–1614.
Shen H. W. and Hung C. S. 1983, Remodified Einstein procedure for sediment load. Journal of Hydraulic Engineering, Vol. 9, No. 4,
pp. 565–578.
Notation
B Ratio of bed layer thickness to flow depth B = zb /h = 2ds/h
C M L-3 Sediment concentration
Cb M L-3 Reference concentration at the reference depth of 2ds
Ci M L-3 Sediment concentration a location i
ds L Particle diameter
h L Total flow depth
h/ds Relative submergence
hp L Sampling depth from the free surface to the lowest sampling point
hp/ds Ratio of sampling depth to particle size
hp/h Relative sampling depth
i Sampling location with the vertical measured from the water surface
- 12 - International Journal of Sediment Research, Vol. 30, No. 1, 2015, pp. 1–12
J1S
∫
-1
*
Ro
*
*1
B
dzz
z first Einstein Integral for the suspended load
J1P
∫
-1
*
Ro
*
*1
P
dzz
z first Einstein Integral for the partial load
J2S
∫
-1
*
Ro
*
**
1ln
B
dzz
zz second Einstein Integral for the suspended load
J2P
∫
-1
*
Ro
*
**
1ln
P
dzz
zz second Einstein Integral for the partial load
MPE Mean Percent Error
n Total number of verticals used particular statistical analysis
p Number of sampling points along a vertical
P Ratio of sampler nozzle height to flow depth P = zp/h
qb M L-1T-1 Unit bed load discharge by mass in the bed layer 0 < z < zb
qpm M L-1T-1 Partial unit sediment discharge by mass from the point measurements
qp M L-1T-1 Partial unit sediment discharge by mass calculated from SEMEPP
qpm/qtm Measured ratio of partial to total sediment discharge
qp/qt Ratio of partial to total sediment discharge calculated from SEMEPP
qs M L-1T-1 Unit suspended sediment discharge by mass
qt M L-1T-1 Total unit sediment discharge by mass calculated from SEMEPP
qtm M L-1T-1 Total unit sediment discharge by mass from the point measurements
RMSE Root Mean Square Error
Ro Rouse number
u* L T-1 Shear velocity
fghSu =*
u*/ω Ratio of shear velocity to fall velocity
v L T-1 Velocity
vi L T-1 Velocity at i
vb L T-1 Velocity in the bed layer, υb =11.6 u*
Xi M L-1T-1 Measured sediment discharge
Yi M L-1T-1 Calculated sediment discharge
z L Vertical elevation above the bed
zb L Reference elevation of 2ds or bed layer thickness
zo L Elevation above the bed where the velocity is zero
zp L Nozzle elevation of the sampler above the bed
z* Ratio of z/h
β Momentum correction factor for sediment, assumed β = 1
κ Von Kármán constant, assumed κ = 0.4 in this study
ω L T-1 Fall velocity of sediment