sediment cleanup users manual ii: appendix b · dmmp clarification paper, originally implemented in...
TRANSCRIPT

Sediment Cleanup Users Manual II: Appendix B
Sediment Management Annual Review Meeting (SMARM) papers Publication No. 12-09-057 December 2013 Note: This appendix will be updated as new papers are added. Date above reflects latest revision date.

Publication and Contact Information
This report is available on the Department of Ecology’s website at https://fortress.wa.gov/ecy/publications/SummaryPages/1209057.html For more information contact: Toxics Cleanup Program P.O. Box 47600 Olympia, WA 98504-7600
Phone: 360-407-7170
Washington State Department of Ecology - www.ecy.wa.gov
o Headquarters, Olympia 360-407-6000
o Northwest Regional Office, Bellevue 425-649-7000
o Southwest Regional Office, Olympia 360-407-6300
o Central Regional Office, Yakima 509-575-2490
o Eastern Regional Office, Spokane 509-329-3400 To request materials in a format for the visually impaired, please call Ecology’s Toxic Cleanup Program at 360-407-7170. Persons with impaired hearing may call Washington Relay Service at 711. Persons with speech disability may call TTY at 877-833-6341.

Sediment Cleanup Users Manual II: Appendix B
Sediment Management Annual Review Meeting (SMARM) papers
Toxics Cleanup Program Washington State Department of Ecology
Olympia, Washington
Publication No. 12-09-057 December 2013
Note: This appendix will be updated as new papers are added.
Date above reflects latest revision date.


Appendix B
SCUM II December 2013 Page i
Appendix B Sediment Management Annual Review Meeting
(SMARM) papers
Program development clarification and issue papers
Inouye, L. 2010. Sediments exposed by dredging (Z-Layer) testing. DMMP clarification paper.
Fox, D., Hoffman, E., Gries, T. 2008. Quality of post-dredge surfaces (updated). DMMP clarification paper.
Gries, T. 2005. Evaluation of sediment quality for navigational dredging, contaminated sediment cleanup or both. DMMP/SMS issue paper.
Kendall, D., and Gries, T. 2003. Recency guideline exceedances: Guidelines for re-testing in high ranked areas. DMMP clarification paper.
Gries, T., Benson, T. Barton, J., and Malek, J. 2003. Determining when material above MHW/OHW will be characterized in DMMP. DMMP clarification paper.
Kendall, D. 2001. Clarifications to the DMMP Z-sample analysis guidance and/or post dredge monitoring policy (183-204-WAC). DMMP clarification paper.
Gries, T. H. 2001. Quality of post-dredge sediment surfaces. DMMP clarification paper.
Kendall, D. and Michelsen, T. 1997. Management of wood waste under Dredged Material Management Program (DMMP) and the Sediment Management Standards (SMS) Cleanup Program. DMMP clarification paper.
Barton, J. 1997. Beneficial use of dredged material. DMMP clarification paper.
Sampling and testing requirements issue papers
Sternberg, D. 2005. Reporting of sediment-bound contaminants: Standardization of sieving and analytical procedures. DMMP/SMS clarification paper.
Bragdon-Cook, K. 1993. Recommended methods for measuring TOC in sediments. DMMP clarification paper.

Appendix B
SCUM II December 2013 Page ii
Fox, D. 1993. Modifications to sampling requirements for deep native sediments.
Chemical testing
Michelsen, T. and Asher, C. 2012. Use of practical quantitation limits (PQLs) to establish cleanup standards for contaminated sediment sites under the Sediment Management Standards (SMS). SMS issue paper.
Inouye, L., Fox, D. 2011. Marine sediment quality screening levels: Adopting RSET marine SLs for use in DMMP. DMMP clarification paper.
DMMP. 2010. New interim guidelines for dioxins.
DMMP. 2010. Revised supplemental information on polychlorinated dioxins and furans (PCDD/DF) for use in preparing a quality assurance project plan (QAPP).
Hoffman, E., and Fox, D. 2010. Polychlorinated dioxins and furans (PCDD/DF): Revisions to the supplemental quality assurance project plan (SQAPP). DMMP clarification paper.
Stirling, S. 2008. Update on pyrethroids and PBDE analysis. DMMP status report.
Fox, D. and Hoffman, E. 2007. Chlordane analysis and reporting. DMMP clarification paper.
Betts, B. and Bragdon-Cook, K. 2001. Chemical analysis of archived sediment samples. DMMP/SMS clarification paper.
Kendall, D. R.1999. Blank correction for method blank contaminated chemical samples. DMMP clarification paper.
Hoffmann, E. 1998. TBT analysis: Clarification of interstitial water extraction and analysis methods –interim. DMMP clarification paper.
Michelsen, T., Shaw, T. C., and Stirling, S. 1996. Testing, reporting, and evaluation of TBT data in PSSDA and SMS Programs. PSSDA issue paper.
Betts, B. 1994. Use of alternate technologies under the Sediment Management Standards Chapter 173-204 WAC. DMMP clarification paper.
Bioassays
Kendall, D., McMillan, R., Gardiner, B., Hester, B., and Word, J.D. 2013. Bioassay endpoint refinements: Bivalve larval and Neanthes growth bioassays. DMMP/SMS clarification paper.
Stirling, S. 2008. Reference areas for freshwater bioassays. DMMP clarification paper.
Appendix B
SCUM II December 2013 Page iii
Kendall, D. 2005. Sediment larval test species recommended for toxicity testing by the DMMP program. DMMP clarification paper.
Kendall, D. and Barton, J. 2004. Ammonia and sulfide guidance relative to Neanthes growth bioassay. DMMP clarification paper.
Barton, J. 2002. Ammonia and amphipod toxicity testing. DMMP clarification paper.
Cole Warner, L. 2001. Reporting ammonia LC50 data for larval and amphipod bioassays. DMMP clarification paper.
Kendall, D. and McMillan, R. 1999. Clarification on the use of the amphipod, Eohaustorius estuarius, relative to grain size and salinity. DMMP clarification paper/SMS draft technical information memorandum.
Fox, F. F. and Michelsen, T. 1997. Selection of negative control sediment and use of control sediments as reference sediments. DMMP clarification paper/SMS draft technical information memorandum.
Michelsen T. and Shaw, T. C. 1996. Statistical evaluation of bioassay results. DMMP clarification paper/SMS draft technical information memorandum.
Kendall, D. 1996. Neanthes20-day bioassay- further clarification on negative control growth standard, initial size, and feeding protocol. PSDDA/SMS clarification paper.
Kendall, D. 1995. In-batch testing for reference sediments for PSDDA bioassays. PSSDA clarification paper.
Peeler, M. 1994. Restriction on exotic species importation. PSSDA clarification paper.
Fox, D. and Littleton, T. 1994. Interim revised performance standards for the sediment larval bioassay. PSSDA revised clarification paper.
Kendall, D. 1993. Species substitution for the 10-day amphipod bioassay. PSDDA clarification paper.
Fox, D. 1993. The Neanthes 20-day bioassay- requirements for ammonia/sulfides monitoring and initial weight. PSSDA clarification paper.
Kendall, D. and Fox, D. 1991. Modification to holding time for biological testing. PSSDA issue paper.
Kendall, D. 1991. Echinoderm embryo sediment bioassay protocol. PSSDA clarification paper.

Appendix B
SCUM II December 2013 Page iv
Fox, D. 1991. PSDDA requirement to collect and report amphipod reburial data. PSSDA clarification paper.
Wakeman, J. 1990. Wet sieving method for reference sediment grain size matching. Memorandum for the record.
Kendall, D. 1990. Requirements for analyzing sediment conventional in reference areas and water quality in bioassays. PSSDA clarification paper.
Barton, J. 1990. Activities to provide better reference areas. DMMP status report.
Bioaccumulation testing
Inouye, L. 2009. Metals BCOC list. DMMP clarification paper.
Kendall, D. and McMillan, R. 2009, Clarification paper. Bioaccumulation protocol clarifications. DMMP clarification paper, originally implemented in 2000, includes 2008 and 2009 updates.
Hoffman E. 2007. Technical basis for revisions to the DMMP bioaccumulation chemicals of concern list. DMMP technical support document, includes 1998 update.
Hoffman E. 2003. Revisions to the bioaccumulative chemicals of concern (BCOC) list. DMMP issue paper.
Hoffman E. 1998. Technical support document for revision of the DMMP bioaccumulative chemicals of concern list. DMMP technical support document.
Kendall, D. 1996. Sediment bioaccumulation testing refinements: Sample volume requirements, simultaneous co-testing of two species within a single aquarium, and species substitution. DMMP clarification paper.
Kendall, D. 1994. Refinements to bioaccumulation testing requirements: Adoption of a second test species for consistency with national guidance. DMMP issue paper.

SMARM Final: 6/30/2010
DMMP Clarification Paper
Sediments Exposed by Dredging (Z-layer) Testing
Prepared by Laura Inouye (Ecology) and the DMMP Agencies
Introduction
The DMMP agencies require that the sediment to be exposed by dredging (SED) be sampled to a depth of 1 ft below overdepth for all projects, regardless of rank, and archived pending the testing results for the overlying sediment. Chemical analysis of this archived material is required if the testing results for the overlying sediment are a) found to be unsuitable for unconfined aquatic disposal, or b) if any other project in the same water body has shown evidence of subsurface sediments with greater contamination than surface sediments, or c) if there is any other site-specific reason to believe that the SED may fail to meet the antidegradation policy. Although the DMMP has clarified when Z-sample analyses are required (DMMP 2001) and how the data will be interpreted (DMMP 2008), there have been no revisions since 2001 regarding how samples are collected, composited, and archived.
Problem Identification
Traditional analysis of the SED has relied on a one-foot section below the overdepth of a project. However, dredge projects do not leave a flat surface exactly at the lower boundary of the allowable overdepth. Dredging precision is affected by a variety of factors (ERDC, 2007) and the actual post-dredge surface may be slightly below the authorized overdepth. Recent discussions with applicants and with the Regional Sediment Evaluation Team have emphasized that traditional one-foot below dredge prism evaluations may not represent what is likely being exposed. In addition, the dredging process can be expected to disturb sediment well below the newly exposed surface (ERDC, 2007). For example, toothed buckets penetrate beyond the final exposed surface when loading, thereby mixing deeper and shallower sediment in the process.
Compositing of Z-samples has traditionally not been allowed. This makes sense when benthic toxicity is the driver, as typical benthic invertebrates (other than crabs) have a small home range and stay in a restricted area. However, this makes less sense when bioaccumulatives are being evaluated since the organisms being impacted are quite mobile (crab and fish). Thus, in cases where bioaccumulatives are the driver for Z-sample analysis, an average across the DMMU is more representative of the potential exposure.
Proposed Clarification
The DMMP proposes that Z-layer analyses should be representative of a two-foot section, starting at the lower boundary of the authorized overdepth and going two feet below the authorized overdepth. In cases where the applicant may wish to get more finely tuned characterization of the depth profile for a contaminant, one-foot increments may be archived and analyzed (to whatever depth the applicant may

SMARM Final: 6/30/2010
find useful) in addition to the 2-foot Z-layer. If applicants do not intend to dredge into the authorized overdepth, then the Z-layer should begin at the final depth expected for the project.
Compositing of Z-samples for a project will be based on the contaminants of concern. If the issue is chemical analysis to screen against the SQS for benthic toxicity, no compositing would be allowed. If the concern is bioaccumulatives, compositing of Z-samples within each DMMU may be allowed based on a number of considerations including project specifics and location. Compositing will only be allowed in coordination with DMMP. Since compositing may or may not be allowed depending on the nature of the chemicals of concern, all Z-samples should be archived individually.
REFERENCES
DMMP, 2001. CLARIFICATION TO THE DMMP Z-SAMPLE ANALYSIS GUIDANCE AND/OR POST DREDGE MONITORING POLICY.
DMMP, 2008. QUALITY OF POST-DREDGE SEDIMENT SURFACES (UPDATED)
ERDC, 2007. OVERDEPTH DREDGING AND CHARACTERIZATION DEPTH RECOMMENDATIONS.

Final: 6/10/08
DMMP CLARIFICATION PAPER QUALITY OF POST-DREDGE SEDIMENT SURFACES (UPDATED) Prepared by David Fox (U.S. Army Corps of Engineers), Erika Hoffman (U.S. Environmental Protection Agency) and Tom Gries (Washington Department of Ecology) for the Dredged Material Management Program (DMMP) agencies. INTRODUCTION Dredging operations can alter the condition of the surface sediments in the dredging area by exposing new sediments to direct contact with biota and the water column. Because the newly exposed surface may have greater sediment chemical concentrations than existed before dredging, this aspect of dredging must be considered in project planning, review and decision-making. From the inception of the Puget Sound Dredged Disposal Analysis program twenty years ago, the DMMP agencies have maintained an antidegradation policy with respect to sediment exposed by dredging (PSDDA, 1988). This policy was reinforced by the State of Washington Sediment Management Standards rule, which seeks to manage “sediment quality so as to protect existing beneficial uses and move towards attainment of designated beneficial uses” (SMS, 1995). This means that, if at all possible, post-dredge surface sediment should be closer to meeting the chemical and biological sediment quality standards than the pre-dredge surface sediment. In 2001, the DMMP agencies took steps to clarify the means by which compliance with the antidegradation policy would be determined for dredging projects (DMMP 2001a and 2001b). The guidance discussed in this paper is not intended to apply to projects that are part of, or in process of becoming, a cleanup project. These projects are under the regulatory authority of the Sediment Management Standards, the Model Toxics Control Act and/or CERCLA. Additionally, coordination with Ecology and EPA cleanup programs will be triggered for any project where either SMS exceedences paired with bioassay failures or CSL exceedences are observed. PROBLEM IDENTIFICATION Continuing experience with application of the antidegradation policy has resulted in the need to further refine the procedures used to evaluate post-dredge surface sediment quality. PROPOSED DMMP CLARIFICATION The DMMP agencies propose to use the following guidance regarding post-dredge sediment quality:
1

Final: 6/10/08
New Sediment Surface Exposed by Dredging. The DMMP agencies require that the sediment to be exposed by dredging (SED) be sampled to a depth of 1 ft below overdepth for all projects, regardless of rank, and archived pending the testing results for the overlying sediment (DMMP 2001b). Chemical analysis of this archived material is required if the testing results for the overlying sediment are a) found to be unsuitable for unconfined aquatic disposal, or b) if any other project in the same waterbody has shown evidence of subsurface sediments with greater contamination than surface sediments, or c) if there is any other site-specific reason to believe that the SED may fail to meet the antidegradation policy. In the event that testing of the archived sediment is required, there are a number of possible outcomes that need to be considered: 1. The SED exceeds no DMMP screening levels (SL) or bioaccumulation triggers (BT) or
SMS sediment quality standards (SQS). In this case, the dredging proponent (hereafter referred to as the “dredger”) has no requirement under the Dredged Material Management Program concerning the fate of the post-dredge surface sediments.
2. The dredging operation may result in SED that has higher chemical concentrations
than those in the upper lift of dredged material (typically, but not always, 0-4 feet). The following scenarios are possible:
a. The SED exceeds one or more SLs or SQSs but is less than 1) DMMP BTs and maximum levels (ML) and 2) SMS cleanup screening levels (CSL). In this case the DMMP agencies will determine whether bioassays1 are required. The decision to resample and conduct bioassays will be based on factors such as the magnitude of elevation of chemical concentrations compared to the surface lift of dredged material and the results of bioassays on the overlying sediment.
− If bioassays are conducted but the results do not exceed the biological SQS, the dredger has no requirement under the dredging program concerning the fate of the post-dredge surface sediments,
− If bioassays are conducted and exceed the biological SQS, the dredger will be required by DMMP to overdredge and/or cap the new sediment surface.
b. The SED exceeds one or more BTs (note that SLs and/or SQSs would likely also
be exceeded in this scenario, in which case the provisions in scenario 2a would also apply). Similar to the case with bioassays, the DMMP agencies will determine whether bioaccumulation testing is required.
− If bioaccumulation testing is conducted but the bioaccumulation potential is less than that of the surface lift of dredged material and no human health guidelines are exceeded, the dredger has no requirement under the dredging program concerning the fate of the post-dredge surface sediments.
2

Final: 6/10/08
− If bioaccumulation testing results for the SED indicate higher bioaccumulation potential than the surface lift of dredged material, or exceed human health guidelines for bioaccumulation, then the dredger will be required by DMMP to overdredge and/or cap the new sediment surface.
c. The SED exceeds one or more DMMP MLs or SMS CSLs. Projects that would
result in SED that exceeds MLs or CSLs are not in compliance with the DMMP and/or SMS antidegradation policy. In such cases, the DMMP will require the dredger to overdredge and/or cap the new sediment surface.
3. The dredging operation may result in SED that has lower chemical concentrations than
those in the surface lift of dredged material. The following scenarios are possible:
a. The SED exceeds one or more SLs, BTs or SQSs but is less than MLs and CSLs. In this case the DMMP agencies will determine whether bioassays or bioaccumulation testing are required.
− If, based on biological testing results or best professional judgment, the DMMP agencies determine that the SED will have lower toxicity and less bioaccumulation potential than was initially present, the dredger has no requirement under the Dredged Material Management Program concerning the fate of the exposed sediments.
− If, based on biological testing results, the DMMP agencies determine that the SED will have higher toxicity or higher bioaccumulation potential than was initially present, the dredger will be required by DMMP to overdredge and/or cap the new sediment surface.
b. The SED exceeds one or more MLs or CSLs. As in 2c (above), any SED
exceeding one or more MLs or CSLs is not in compliance with the DMMP and/or SMS antidegradation policy. In such cases, the DMMP will require the dredger to overdredge and/or cap the new sediment surface.
Best Professional Judgment The complexity of dredging projects varies considerably. Not every scenario can be foreseen or easily captured in words. Thus, best professional judgment will be exercised by the DMMP agencies in making decisions regarding the need for additional testing and/or overdredging/capping of SED. Examples of situations where best professional judgment may be required include the following:
1. Some chemicals of concern may have higher concentrations in the SED compared to the surface lift of dredged material, while other COCs may have lower concentrations.
2. Carbon-normalized concentrations could produce comparative results different from those of dry-weight-normalized concentrations.
3. In those cases where the SED is resampled to collect sediment for biological testing, the resampled SED must undergo DMMP chemical testing to provide a synoptic dataset.
3

Final: 6/10/08
4
Chemical results from the resampled SED may be different from the results from the originally sampled SED.
4. Compact native material may restrict the ability to collect z-samples. 5. Some COCs, such as dioxin, currently do not have SMS standards or DMMP numerical
guidelines. 6. A reason-to-believe that the SED may be degraded relative to the surface lift, based on
historical data or other site-specific considerations, may dictate that additional z-samples be taken from deeper sediment. For example, z-samples from 0-1, 1-2 and 2-3 feet below the overdredge depth might be required.
7. Due to time constraints or other considerations the dredging proponent may desire to forego biological testing of the z-layer and proceed directly to overdredging and/or capping the new sediment surface.
8. Projects in freshwater will need to use freshwater guidelines. Upland Disposal For some dredging, especially along the Columbia River, upland disposal (without return flow) may be proposed. In such cases there is no requirement under Section 404 of the Clean Water Act to test the dredged material2. However, an evaluation of the SED must still be made in order to ensure compliance with the State’s antidegradation policy. The DMMP agencies may require that one or more samples of the existing surface sediment (0-10 cm) be analyzed and compared to the SED to make an antidegradation determination. REFERENCES DMMP, 2001a. Quality of Post-Dredge Sediment Surfaces – A DMMP Clarification Paper. Prepared by Thomas Gries for the DMMP agencies, 2001. DMMP, 2001b. Clarifications to the DMMP Z-Sample Analysis Guidance and/or post dredge monitoring policy – A DMMP Clarification Paper. Prepared by David Kendall for the DMMP agencies, 2001. PSDDA, 1988. Evaluation Procedures Technical Appendix – Phase I, Prepared by the Puget Sound Dredged Disposal Analysis agencies: U.S. Army Corps of Engineers, U.S. Environmental Protection Agency, Washington State Department of Ecology, Washington State Department of Natural Resources, 1988. SMS, 1995. Sediment Management Standards, 173-204 Washington Administrative Code. Washington Department of Ecology, revised 1995. 1 A decision to conduct bioassays will likely necessitate re-sampling of the SED due to holding time restrictions. 2 Note that testing may be required by local public health departments/solid waste officials to determine what beneficial use or disposal options are appropriate.

04/26/05
Page 1
DMMP/SMS ISSUE PAPER EVALUATION OF SEDIMENT QUALITY FOR NAVIGATIONAL DREDGING, CONTAMINATED SEDIMENT CLEANUP OR BOTH Prepared by Tom Gries (Ecology/Toxics Cleanup Program/Sediment Management Unit) for the Dredged Material Management Program (DMMP) agencies and Ecology’s Sediment Management Standards (SMS) program Background/Introduction The early PSDDA program, perhaps prior to 1994, usually involved evaluation of maintenance dredging projects located in uncontaminated areas. Sediment quality of the dredged material was generally characterized as suitable for unconfined, open-water disposal (1). During the same period, relatively few contaminated sediment cleanup sites were being actively investigated under the new Sediment Management Standards rule (2), while a few large EPA Superfund sites were well characterized (3,4). During the last half of the 1990’s, there was a gradual increase in the number of navigation dredging projects located either in more contaminated areas or associated in some manner with cleanup sites. As a consequence, more material was found unsuitable for open-water disposal (5). Simultaneously, there was much more activity investigating areas of sediment known or suspected to be more highly contaminated, in part because Ecology published a list of 49 contaminated (marine) sediment sites (6) and cleanup programs had matured. Evaluations of sediment quality for both navigation and cleanup projects, in many respects, have become routine over the years. Evaluation procedures such as sampling methods, analytical protocols and toxicity test result interpretations have all became more familiar. In other respects, such evaluations have become considerably more complex. Some of the reasons for this complexity include a) locations being studied having greater environmental heterogeneity, b) increased concern about common but less “familiar” sediment contaminants, c) rapidly evolving analytical methods, and d) need to assess risk not only to benthic communities but also to wildlife, endangered species and humans. It was apparent by the year 2000 it was becoming increasingly clear that risk to wildlife and humans could be just as important as risk to benthic communities in determining sediment cleanup levels. Examples of these complexities are cited below.
• Regulators found a heterogeneous distribution of suitable and unsuitable material in the area of the Puget Sound Naval Shipyard located in Bremerton, Washington, that was proposed for new construction and maintenance dredging (7)
• Unexplained toxicity at some sites led to the realization that tributyltin (TBT) was fairly ubiquitous in the sediments of more urban areas of Puget Sound. Whole sediments with high concentrations of Total TBT sometimes showed no toxicity or accumulation, so how to best evaluate risk from TBT became (and remains) an issue (8)
• Where concentrations of sediment PCBs are of concern, there have been lengthy discussions about how to measure PCBs, in part because of a national trend toward
04/26/05
Page 2
analyzing and assessing sediment risk based on concentrations of only a limited set of PCB congeners (9).
• For the recently listed Lower Duwamish Waterway Superfund site, the risk to human health is being evaluated using standard equations, but with significant debate over many of the assumptions and parameters, including fish/shellfish consumption rates, how and where to measure fish/shellfish tissue contaminants, etc. (10)
Other factors complicating sediment evaluations include: lack of clarity on the purpose(s) of the project, uncertainty about the regulatory authority or authorities under which it should be evaluated, legitimate receptors of concern, important exposure pathways, appropriate approaches to sampling and testing sediment quality, etc. These have played a role in numerous recent projects. The reality is that DMMP and cleanup staff has found it increasingly difficult to distinguish whether a project is being conducted for the purpose of navigation, cleanup or both. This is exemplified by the following projects:
• East Waterway (Seattle - Harbor Island). The “Stage II” area, first evaluated under the DMMP, recently became part of the Harbor Island Superfund site and is being remediated under authority of the CERCLA program.
• Harris Avenue Shipyard (Bellingham Bay). This is a MTCA cleanup site that also requires dredging for navigational purposes and is therefore being evaluated by both the DMMP and Ecology’s MTCA/SMS program.
• Glacier Northwest and South Park Marina (Seattle - Lower Duwamish). These are two sites that need to be dredged for maintaining navigation depth but located within the Lower Duwamish CERCLA sediment cleanup site. Exposing a contaminated surface was an issue at the former site, so the DMMP and cleanup programs coordinated on a plan to overdredge, place and monitor an interim sand cap. The latter site overlaps with a sub-area in the Duwamish designated as a CERCLA non-time-critical removal. Sediment evaluation at the latter site required substantial interagency coordination to finalize a complex analysis plan (SAP) that met the needs of both navigation and cleanup programs.
• Manke Lumber (Tacoma - Commencement Bay). This is a MTCA wood waste cleanup site with maintenance dredging needs. Areas of sediment/wood debris were characterized by both programs.
• Fisherman’s Terminal (Seattle - Ship Canal). This project is located in an area of known and suspected contamination, and is on Ecology’s sediment cleanup list as part of the greater Lake Union sediment cleanup site. But it has recently been characterized solely as a navigation project because there is no existing plan to conduct a cleanup investigation in this specific area.
• Dakota Creek Industries (Anacortes). This project was evaluated as a navigation project and received a suitability determination in 2004?. DMMP staff subsequently learned that there was an active MTCA cleanup investigation on adjacent uplands and that a potential source of dioxins had not been disclosed. The SD was rescinded and further investigations are ongoing.
• U.S. Navy - Puget Sound Naval Shipyard (Sinclair Inlet). This project was a maintenance/construction dredging project evaluated and conducted under the DMMP that was coordinated with a CERCLA remediation effort.

04/26/05
Page 3
• Pope and Talbot (Port Gamble) and Port Townsend Paper (Port Townsend). Both of these projects claimed a need for maintenance dredging but also contained significant wood waste areas of interest to Ecology’s Toxics Cleanup Program (MTCA/SMS). The first project was characterized under both programs and the second project was characterized only under the DMMP.
Problem Statement It is not always easy to determine the appropriate authority under which to develop a SAP and evaluate the results of various sediment quality analyses. This is exemplified by the numerous projects described above. Therefore, the agencies believe there is need to provide general and/or specific guidance on how to determine whether or not an evaluation of sediment quality should be conducted a) under the DMMP using its guidelines, b) under a cleanup authority, e.g., CERCLA or MTCA/SMS, using different requirements and guidance, or c) under both types of sediment management programs using a combination of guidelines and requirements. This paper draws from many of the above project experiences to provide such clarifying guidance. Proposed Clarifications A. Recommended Regulatory Processes DMMP Process
1. The need for navigation-related dredging usually results in a) submittal of a JARPA to various entities, b) a Corps pre-application meeting, and/or c) the Corps permit application itself. One of these should mark the start of a navigation dredging project. 2. DMMP staff works with permit applicants to develop and approve a SAP that will result in sediment quality adequate to determine suitability for open-water disposal. 3. Development of the SAP should always include communication with both Ecology and staff from appropriate EPA cleanup programs to determine whether or not a) the project is located in or near one or more listed or suspected cleanup sites, b) there is known or suspected contaminated sediment in or near the site, and c) there are known or suspected sources of contaminants that could be expected to influence the site.
• If the site is being actively investigated under a cleanup authority, e.g., a preliminary site assessment is underway, then DMMP staff should communicate and coordinate with cleanup project managers to develop one or more SAPs that are mutually satisfactory. For clarity and transparency, the agencies recommend a single, joint program SAP.
• If the site is not being actively investigated but there is known or suspected sediment contamination or issues related to source control and investigations are being planned under a cleanup authority, then DMMP staff should communicate with cleanup site managers to determine the timeline for investigations. If planned investigations are imminent or to be initiated in the near-term, e.g., <1-2 years, then DMMP staff should negotiate an agreed strategy for developing the SAP with both the applicant and other regulators.

04/26/05
Page 4
• If the site is on a cleanup list but ranked as a low priority, or is located in an area of concern but there is no plan to investigate it in the near future, then DMMP staff should proceed to develop a SAP that meets DMMP guidelines.
Cleanup Process 1. Existing environmental data, knowledge of historic or ongoing sources of contamination
incidents such as a spills, and/or public complaints can lead to a requirement to investigate a cleanup site. The site may be located in an area that also needs navigation dredging.
2. If the site is or will soon be actively investigated, the cleanup project manager should determine through communication with appropriate parties, e.g., land owners, ports, and DMMP staff, whether or not it is located in an area that also needs navigation dredging in the near future, e.g., <1-2 years.
• If navigation dredging may be needed at the site in the near future, then the cleanup site manager should contact DMMP staff and work with them to develop a SAP that meets the general needs and specific guidelines of both programs.
• If the site has no need for navigation dredging in the near future, then a SAP should be developed according to cleanup program guidance.
B. Required SAPs - A Summary DMMP SAPs are required …
• Whenever dredging is proposed to meet navigation needs in a specific location a) not listed as a cleanup site, b) with no known or suspected sediment contamination, and c) with no known or suspected sources of sediment contamination in the vicinity.
• Whenever dredging is proposed to meet navigation needs within a cleanup area but cleanup investigations are planned only in the distant future (e.g., > 1-2 years) or not at all.
Cleanup Program SAPs are required … • Whenever there is need to characterize the in situ risk associated with exposure to surface
and subsurface sediments in a sediment cleanup area, with no near-term need for navigation dredging.
“Hybrid” SAPs are required … • Whenever dredging is proposed to meet navigation needs within or near a cleanup area
and planned cleanup investigations are either ongoing or planned for the near future (e.g., <1-2 years).
• Whenever there is need to characterize the in situ risk from exposure to surface and subsurface sediments in a sediment cleanup area and there is an immediate or near-future need for navigation dredging (e.g., <1-2 years).
C. Purposes and Approaches to Sampling
• Characterizing sediment quality using samples composited to resemble the dredged material that will potentially be placed at open-water disposal sites is not equivalent to characterizing in situ sediment quality to assess risk from exposure to contaminants in surface sediment (or sediment at a proposed new surface).
04/26/05
Page 5
• DMMP sampling and testing guidelines are designed to characterize the “average” sediment quality within the area and depth of a proposed dredge prism. The guidelines are not intended to represent the in situ surface sediment quality.
• Cleanup sampling and testing requirements and guidance are intended to result in data representative of in situ sediment quality. This is because the major pathways of in situ exposure, hence dose and risk, begin in the surface sediment. Cleanup programs often characterize subsurface sediment quality at a site, but usually to a much lesser extent and for different reasons. Subsurface sediment quality data helps determine a) the spatial extent/volume of material needing remediation, and b) the feasibility and cost of alternative remedial actions.
D. A Final Link Between Programs It may be appropriate for contaminated sediment cleanup projects that have already carefully characterized risk associated with exposures to surface sediment contaminants, and where it has already been determined the preferred management alternatives include removing contaminated sediment from at least some portion of the site, to then sample and test the material according to DMMP guidelines to also determine if any of it is suitable for open-water disposal. References (STILL DRAFT) (1) PSDDA, 1992. Minutes from Annual Review Meeting. (2) Chapter 173-204 WAC. (3) EPA, 1989. Record of Decision for the Commencement Bay Nearshore Tideflats Superfund
Site. (4) EPA, 198x. Record of Decision for the Eagle Harbor Superfund Site. (5) Corps, 2005. Personal communication with Dr. David Kendall. (6) Ecology, 1996. Contaminated Sediment Site List. (7) U.S. Navy, 1995 and 1998. Sediment quality evaluations for Puget Sound Naval Shipyard -
Bremerton. (8) EPA, 199x. Sediment quality site evaluations for Harbor Island, Sediment Operable Unit. (9) DMMP, 199x. Minutes to 199x SMARM. (10) Lower Duwamish Work Group, 2003. Phase I Remedial Investigation Report, Appendix B,
Human Health Risk Assessment.

Final
1
DMMP CLARIFICATION PAPER RECENCY GUIDELINE EXCEEDANCES: GUIDELINES FOR RETESTING IN HIGH RANKED AREAS Prepared by David R. Kendall (U.S. Army Corps of Engineers) and Tom Gries (Washington State Department of Ecology) for the DMMP agencies. INTRODUCTION This paper builds on the 2002 clarification paper entitled Recency Guidelines: Program Considerations. Dredging/construction projects in high ranked areas are having difficulty completing their dredging within a 2-year time frame and are faced with the potential requirement to retest all or portions of the suitable material before they can initiate or complete their dredging. The 2002 clarification paper stipulated that when reviewing projects with recency exceedances, the DMMP agencies will review 1) previous characterization data, 2) new data from the dredge site or vicinity, and 3) site use and character, on a project specific basis, to evaluate whether recency periods can be extended or additional testing will be required. The purpose of this paper is to clarify retesting guidelines, when the DMMP agencies concur that retesting is required to recharacterize sediment compared to the initial DMMP characterization. BACKGROUND During the first 10 years of the Puget Sound Dredged Disposal Analysis (PSDDA) program implementation, most dredging projects were initiated in areas with relatively “better” sediment quality, and recency exceedances were generally not a problem. However, during the last five years more complex dredging projects have been initiated in high concern areas, including some within or adjacent to CERCLA or MTCA cleanup areas. Projects conducted within high concern areas must be completed within 2 years to adhere to DMMP recency guidelines. Also adding to the permit process timelines and permitted project construction delays is the required consultation with the National Oceanic and Atmospheric Administration (NOAA) and U. S. Fish and Wildlife Service (USFWS) under the Endangered Species Act, for protected species such as Chinook salmon (Oncorhynchus tshawytscha) and bull trout (Salvelinus confluentus). The necessary coordination coupled with conservation measures to protect these species have reduced dredging work windows and extended the time required to plan and complete dredging projects.
Final
2
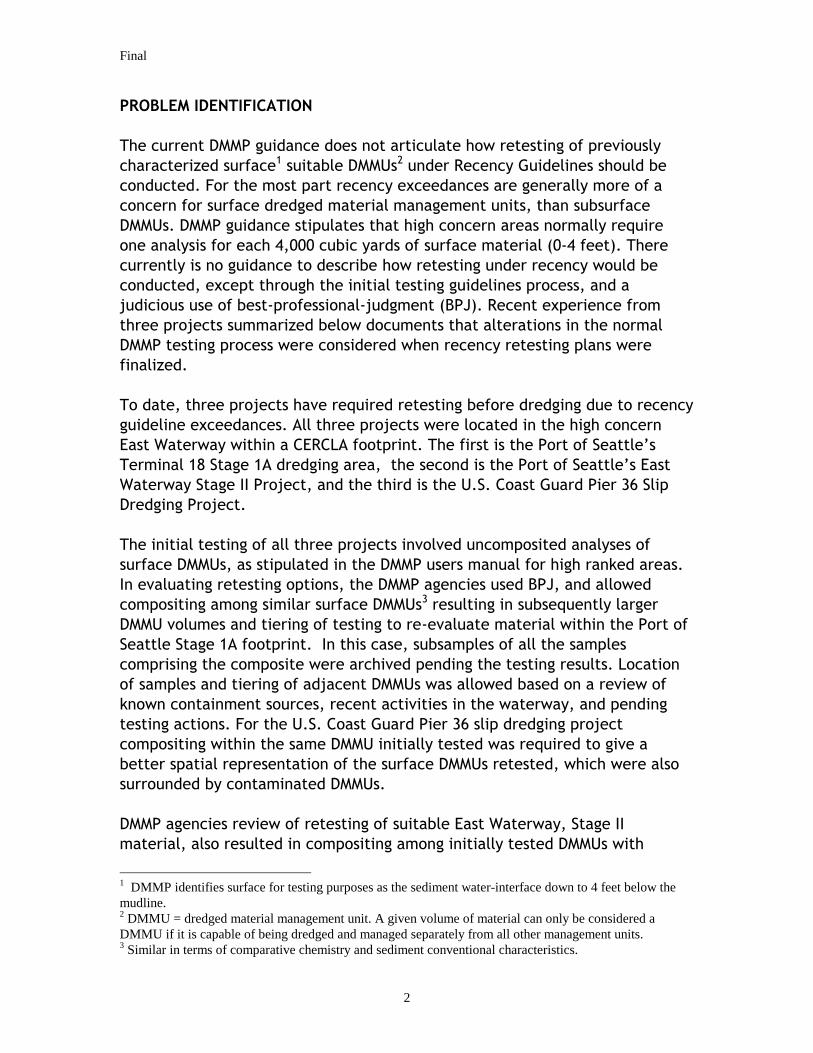
PROBLEM IDENTIFICATION The current DMMP guidance does not articulate how retesting of previously characterized surface1 suitable DMMUs2 under Recency Guidelines should be conducted. For the most part recency exceedances are generally more of a concern for surface dredged material management units, than subsurface DMMUs. DMMP guidance stipulates that high concern areas normally require one analysis for each 4,000 cubic yards of surface material (0-4 feet). There currently is no guidance to describe how retesting under recency would be conducted, except through the initial testing guidelines process, and a judicious use of best-professional-judgment (BPJ). Recent experience from three projects summarized below documents that alterations in the normal DMMP testing process were considered when recency retesting plans were finalized. To date, three projects have required retesting before dredging due to recency guideline exceedances. All three projects were located in the high concern East Waterway within a CERCLA footprint. The first is the Port of Seattle’s Terminal 18 Stage 1A dredging area, the second is the Port of Seattle’s East Waterway Stage II Project, and the third is the U.S. Coast Guard Pier 36 Slip Dredging Project. The initial testing of all three projects involved uncomposited analyses of surface DMMUs, as stipulated in the DMMP users manual for high ranked areas. In evaluating retesting options, the DMMP agencies used BPJ, and allowed compositing among similar surface DMMUs3 resulting in subsequently larger DMMU volumes and tiering of testing to re-evaluate material within the Port of Seattle Stage 1A footprint. In this case, subsamples of all the samples comprising the composite were archived pending the testing results. Location of samples and tiering of adjacent DMMUs was allowed based on a review of known containment sources, recent activities in the waterway, and pending testing actions. For the U.S. Coast Guard Pier 36 slip dredging project compositing within the same DMMU initially tested was required to give a better spatial representation of the surface DMMUs retested, which were also surrounded by contaminated DMMUs. DMMP agencies review of retesting of suitable East Waterway, Stage II material, also resulted in compositing among initially tested DMMUs with
1 DMMP identifies surface for testing purposes as the sediment water-interface down to 4 feet below the mudline. 2 DMMU = dredged material management unit. A given volume of material can only be considered a DMMU if it is capable of being dredged and managed separately from all other management units. 3 Similar in terms of comparative chemistry and sediment conventional characteristics.

Final
3
similar chemistry. Subsamples of each subsample station comprising the composite were archived pending the testing results. This testing is ongoing and has not been completed at this time. The overall testing outcomes validated the need to retest as 36.6 % of the material from the Port of Seattle’s Terminal 18 Stage 1A dredging project and 66.5% of the material from the U.S. Coast Guard Pier 36 slip dredging project were found to be unsuitable for unconfined-open water disposal. PROPOSED CLARIFICATION The DMMP agencies propose the following clarification to recency retesting sampling and analysis guidance. The DMMP acknowledges that some projects in high concern areas are exceeding recency guidelines. Project proponents must be aware of recency considerations and contact the Dredged Material Management Office if this issue arises for their project. If the DMMP agencies determine that recency extension is not feasible and retesting is required, the following general guidance will be implemented. 1. The DMMP will use BPJ on a project specific basis to evaluate recency
retesting sampling and analysis requirements including sampling designs and approvals.
2. The DMMP agencies will consider allowing compositing to re-evaluate
surface sediment quality of previously suitable DMMUs after first conducting a careful review of the project specific data collected during the initial characterization and any additional data the project applicant may provide, including DMMU proximity to adjacent sources and activities. The DMMP agencies may allow compositing among generally adjacent DMMUs with comparative levels of chemistry and sediment conventional characteristics. The DMMP agencies are concerned that compositing not be used as a means of diluting samples for analysis. Subsamples of material collected at each station comprising the composited DMMU will be archived pending analysis results from the composited sample.
3. Using BPJ, the DMMP agencies will determine whether the results from
composited analyses are sufficient to characterize the original or newly combined surface DMMU, or if analyses of the archived subsamples samples will be required to render a determination of suitability.
4. Archiving and tiering of analyses of adjacent DMMUs may be considered on a
project specific basis by the DMMP agencies. Analysis of archived samples

Final
4
may be required if analysis results for adjacent samples indicate that the material is no longer suitable for unconfined-open-water disposal.
REFERENCES EPTA, 1988. Evaluation Procedures Technical Appendix. Prepared by the Corps of Engineers in cooperation with the Environmental Protection Agency, Region 10, and the Washington State Departments of Ecology and Natural Resources. GHWBUM4, 1995. Dredged Material Evaluation Procedures and Disposal Site Management Manual: Grays Harbor and Willapa Bay, Washington. Prepared by the Corps of Engineers in cooperation with the Environmental Protection Agency, Region 10, and the Washington State Departments of Ecology and Natural Resources. MPR, 1988. Puget Sound Dredged Disposal Analysis (PSDDA) Management Plan Report, Unconfined Open-Water Disposal of Dredged Material, Phase I (Central Puget Sound). Prepared by the Corps of Engineers in cooperation with the Environmental Protection Agency, Region 10, and the Washington State Departments of Ecology and Natural Resources. MPR, 1989. Puget Sound Dredged Disposal Analysis (PSDDA) Management Plan Report, Unconfined Open-Water Disposal of Dredged Material, Phase II (North and South Puget Sound). Prepared by the Corps of Engineers in cooperation with the Environmental Protection Agency, Region 10, and the Washington State Departments of Ecology and Natural Resources.
4 GHWBUM = Grays Harbor, Willapa Bay Dredged Material Users Manual.

DMMP CLARIFICATION PAPER DETERMINING WHEN MATERIAL ABOVE MEAN/ORDINARY HIGH WATER WILL BE CHARACTERIZED UNDER THE DMMP Prepared by Tom Gries and Ted Benson (Washington State Department of Ecology), Justine Barton and John Malek (U.S. Environmental Protection Agency, Region 10), and other contributors, for the DMMP agencies. INTRODUCTION Since 1989, dredged material in the Puget Sound region has been managed mainly by the Dredged Material Management Program (DMMP) - formerly the Puget Sound Dredged Material Disposal Analysis program (PSDDA). The intent of the program was to provide a regulatory framework and sediment quality evaluation procedures, as well as regional open-water disposal capacity and guidelines for managing disposal sites. These features, which were largely lacking in already-established regulatory programs, have facilitated consistent, environmentally sound and timely decisions on management of dredged material in Washington. The focus of the original PSDDA program and current DMMP has been dredging projects that support navigation and commerce. However, the participating agencies1 recognize that program guidelines can also be applied to projects whose primary purpose for dredging is environmental restoration or other economic development. Dredging projects that create valuable new aquatic habitat, or enhance existing habitat, are generally desirable. So too are projects that enable new commercial enterprise. In recent years, the DMMP has evaluated an increasing number of projects that propose dredging for all of these reasons - navigation, restoration and development. Some of these projects begin to blur the line between the dredging of sediments from areas of Puget Sound, as originally intended by the program, and the excavation of upland soils. Definition of “Dredged Material” The DMMP derives much of its authority from Section 404 of the Clean Water Act, which applies both to “dredged material” and material used as “fill”. The federal definition of dredged material is “material that is excavated or dredged from the waters of the United States” (40 CFR 232.2). The Evaluation Procedures Technical Appendix or
∗ U.S. Army Corps of Engineers Seattle District and Environmental Protection Agency, Washington Departments of Ecology and Natural Resources 1 U.S. Army Corps of Engineers Seattle District and Environmental Protection Agency, Washington Departments of Ecology and Natural Resources

Final Clarification Paper November 17, 2003
2
“EPTA” (PSDDA, 1988) provides a similar definition in its glossary: “sediments excavated from the bottom of a waterway or water body”. A strict interpretation of the federal definition would limit dredged material to that which lies waterward of a vertical line intersecting the Mean or Ordinary High Water mark (Figure 1, 1a). However, such a vertical cut results in slumping of bank material lying above the “reasonable angle of repose” (1b and 1c), so EPTA also considers this to be dredged material.
Figure 1. Cross-section of a dredging prism. Taken from EPTA, 1988, page I-13 EPTA makes two further statements:
• “… bank material excavated from below the angle of repose (i.e., areas labeled 2 and 3 …), or other land excavation material, has been permitted, and will continue to be included, as dredged material only if there would be an ecological benefit (e.g., habitat improvement) at the disposal site.”
• “bank material …(excavated from below the angle of repose) … also should be considered dredged material for possible open-water disposal if an ecological benefit can be shown at the dredging site.”
Thus, dredged material is broadly defined and can include some volume of material excavated from upland locations (sections 2 and 3 in Figure 1 above) as long as projects have demonstrable ecological benefits to either the dredging or disposal site. Examples of ecological benefits to the dredging site include enhancing fish habitat by replacing sheet pile with riprap and “fish mix”, replacing riprap with even more fish-friendly material, reworking fish passage structures, daylighting culverted creeks, removing contaminated sediment and rerouting stormwater. Creating more open water area by cutting the shoreline back and reinstalling a similar sheet pile seawall may or may not impart substantial ecological benefit to the project site. This determination will be made in consultation with resource agencies and other entities. Examples of ecological benefits

Final Clarification Paper November 17, 2003
3
of placing dredged or excavated material at an open-water disposal site include “capping” it with material having fewer contaminants and, possibly, adding organic carbon or nutrient content that enhances re-colonization and leads to greater benthic community diversity. The original PSDDA program may have anticipated dredging for purposes other than maintaining navigation and commerce, but it was not intended to regulate or manage upland soils at open-water disposal sites. Chapter 332-30-166 of Washington Administrative Code (WAC) states:
“Open water disposal sites. (1) Open water disposal sites are established primarily for the disposal of dredged material obtained from marine or fresh waters. These sites are generally not available for disposal of material derived from upland or dryland excavation except when such materials would enhance the aquatic habitat.”
Regulation of excavated soils as solid wastes should occur under authorities of the Resource Conservation and Recovery Act (RCRA, Title 42 Chapter 82) and Washington statutes and regulations (e.g., 70.95 RCW, Chapters 173-304, 173-350 WAC). In summary, “dredged material” as currently defined in DMMP documents is:
• below mean or ordinary high water • defined in a broad/practical manner • managed primarily under DMMP because other programs lack an adequate
regulatory framework, evaluation procedures, and/or other pertinent features • managed primarily to maintain navigation and commerce, but also to encourage
creation of aquatic habitat and economic development • managed primarily at open-water disposal sites established to receive dredged
material, not upland soils or other fill material, unless the latter has ecological benefits to either the dredging or disposal site
PROBLEM IDENTIFICATION Recent and proposed dredging projects have resulted in the DMMP agencies needing to clarify the program’s working definition of dredged material and, perhaps more importantly, the process for determining that a project will be reviewed by the DMMP. Several of these projects took place in the Blair Waterway, Tacoma, and resulted in substantial dredged material found suitable for open-water disposal and placed at the nearby Commencement Bay site. Some 237,000 cubic yards (cy) of material characterized for the Blair Graving Dock Project was found suitable for open-water disposal in 1994. The 1995 West Blair Terminal Development Project and the 2001 Pierce County Terminal Project (PCT) involved approximately 525,000 cy and 2,100,000 cy, respectively. In all these cases, the agencies used the guidance provided in EPTA to determine if these projects involved “dredged material” and met the intent of the program. The agencies
Final Clarification Paper November 17, 2003
4
documented their decision more carefully for the PCT project (USACE, 2000) because the extent of the proposed shoreline cutback and volume of material involved was so great. The letter listed the following lines of evidence for a weight-of-evidence determination that the project could be evaluated under the DMMP:
• the project site was within the DNR harbor line on former mudflat that had been filled with side-cast dredged material earlier this century
• the project was believed to have environmental benefits to Commencement Bay that included conversion of uplands to aquatic habitat, exposing a portion of Wapato Creek and various stormwater improvements
• all work was to be conducted adjacent to the waterway • all dredging was to be done by water-based mechanical dredge • the sediment was too fine and damp to be used for structural fill
However, it should also be noted that a) conducting marine toxicity tests was complicated by presence of terrestrial material, b) substantial work was done using land-based equipment, and c) there were two modifications of the original project to “dredge” further inland. The DMMP agencies have only recently learned of a second phase of the PCT project. The work proposed for Phase II would widen portions of the Blair Waterway by cutting back sections of both western and eastern shores, removing approximately 2.5 million cubic yards of material and potentially placing up to 3 million cubic yards of material at the Commencement Bay open-water disposal site. With increasing maritime commerce and the need for dredging/excavation to accommodate it, it seems likely that the DMMP will be asked to review more large-scale expansion projects. PROPOSED CLARIFICATION The DMMP agencies have carefully reviewed and discussed the existing definition of dredged material, together with the text that accompanies it, and do not find sufficient reason to amend EPTA at this time. Staff does believe there is a need to propose a process and clarify the factors that will be used on a site-specific basis to determine whether or not a future project will be evaluated as dredged material by the DMMP. Proposed Process The earliest formal communication between permit applicants and regulators usually occurs in a pre-application meeting. DMMP staff recommends that applicants identify at that meeting whether or not they propose to excavate or dredge any material above MHW that lies beyond the “reasonable angle of repose” 2 (Figure 1). If not, then the project will be evaluated under the DMMP. However, if the proposed project was preceded by other shoreline cutbacks, then the DMMP may require additional information for its Tier I “reason-to-believe” evaluation. For example, site use history and/or results from soil 2 The DMMP agencies may, on a site-specific basis, require the project proponent to justify the default slope of 1 vertical : 2 horizontal (30o) as a “reasonable angle of repose”.

Final Clarification Paper November 17, 2003
5
borings and groundwater testing becomes more important for a dredging project that once was clearly well above MHW. The DMMP might require measurement of additional chemicals of concern, depending on site use history. If it is learned at the pre-application meeting that the proposed work involves shoreline cut back or other excavation that lies beyond the reasonable angle of repose, then the permit applicant must provide to the DMMP agencies information relating to the factors listed below. The major factors that the DMMP agencies will use on a site-specific basis to determine whether or not expansion-type dredging projects involve dredged material include:
• There must be ecological benefit to either the dredging or disposal site. o The original PSDDA program and EPTA guidance was developed in part
to facilitate creation/enhancement of aquatic habitat. But benefit to the dredging site was not intended to extend beyond the dredging site itself. Thus, benefit to the dredging site does not include those associated with required off-site mitigation3. It also might not include additional hard-armored open water habitat.
o Benefits to the disposal site are considered relative to the condition of the open-water site before being routinely used for dredged material disposal.
• There must be ample reason to believe that the characteristics of the material to be dredged or excavated are substantively similar to the marine/estuarine sediments that are the basis of regional sediment quality criteria and guidelines. Some reasons are:
o the material was once dredged from a nearby waterway and placed in its current location as fill
o the work is located in or adjacent to an existing water body and will be conducted from the water (generally, only de minimis land-based excavation will be allowed)
o groundwater/interstitial water is influenced by the adjacent water body (from which dredging would occur)
o there is little evidence for or reason to suspect presence of toxic compounds/elements other than those on the PSDDA/DMMP list of chemicals of concern
o total organic carbon of the dredged material is similar in quantity and quality to that found in sediments of the adjacent water body
Open-water disposal capacity exists and is provided on a regional basis, so available capacity of the nearest open-water disposal site should not be a factor in this determination. The DMMP evaluation of expansion-type dredging projects determined to involve dredged material may require a new definition of dredged material management units
3 The DMMP agencies may consider a future amendment to EPTA explicitly stating that the enhancement or creation of off-site aquatic habitat within the local environs (but not at the actual dredging site) may constitute “ecological benefit”. This would potentially enable additional material that lies beyond the “reasonable angle of repose” to be evaluated as dredged material.

Final Clarification Paper November 17, 2003
6
(DMMU) and/or measurement of a different suite of suspected contaminants that are each appropriate for the specific site. If the DMMP agencies determine that excavating material lying beyond the reasonable angle of repose does not have clear ecological benefits to either the dredging or selected disposal site, then that material will not be reviewed for suitability for disposal at an open-water site. The applicant will be notified as soon as this determination is made. In this event, the agencies could still evaluate the dredged material if the applicant proposes that it be used in some other beneficial manner, e.g., off-site habitat enhancement, slope stabilization, etc. REFERENCES PSDDA, 1988. Evaluation Procedures Technical Appendix – Phase I (Central Puget Sound). U.S. Army Corps of Engineers – Seattle District, 2000. Letter to Ms. Sally Fisher, (GeoEngineers) representing the Port of Tacoma, August 10, 2000.

Final: 10/3/01
1
DMMP CLARIFICATION PAPER CLARIFICATIONS TO THE DMMP Z-SAMPLE ANALYSIS GUIDANCE AND/OR POST DREDGE MONITORING POLICY Prepared by David R. Kendall (U.S. Army Corps of Engineers) for the DMMP agencies. INTRODUCTION During sediment characterization, the Dredged Material Management Program (DMMP) requires the collection and archiving of a sample (Z-sample) of the top one-foot of material extending beyond the proposed project dredging depth. This sample reflects the new surface sediment quality that would be exposed following dredging (EPTA, 1988, page I-14; Phase I MPR, 1988, page A-12; and Phase II MPR, page 5-34; Grays Harbor and Willapa Bay Dredged Material Users Manual, pages 57-581). In practice, over the past twelve years of implementation, z-samples were only required for projects in high ranked areas, or in dredging areas where there was a concern for groundwater contamination. The initial guidance stipulated a tiered testing process, whereby archived Z-samples would only be analyzed if there was a “reason-to-believe” that the underlying sediments reflecting the new surface following dredging might be contaminated (e.g., if the immediately overlying sediments were unsuitable for aquatic disposal). During the early years of the Puget Sound Dredged Disposal Analysis (PSDDA) program implementation, most dredging projects were generally initiated in areas with better sediment quality, whereas during the last five years more dredging projects are being initiated in or adjacent to CERCLA or MTCA cleanup areas. . PROBLEM IDENTIFICATION Recent characterization activities in the Blair Waterway (Pierce County Terminal Expansion Project) and East Waterway (Corps/Port of Seattle project; near the mouth of the Duwamish Waterway) have highlighted the need to clarify the rationale for the collection and analysis of z-samples for projects in areas with complex surface and subsurface chemical contamination. Proposed dredging in the Blair Waterway, a low ranked project, found unexpectedly high levels of subsurface contamination (PCB’s and DDT). In the Corps/Port of Seattle construction project in the East Waterway (Stages I and II), subsurface contamination generally was lower than existing surface contamination, but still showed chemical contamination which exceeded the SQS and in some cases the Cleanup Screening Level (CSL). 1 Z-sample collection and analysis requirements are being added to the PSDDA Users Manual and will be posted prior to the 2001 SMARM.

Final: 10/3/01
2
A portion of the East Waterway project (Stage I) was dredged in 2000. Z-samples were collected but not analyzed as part of the initial Stage I East Waterway dredging project characterization. Because no Z-samples were analyzed, the predredge sediment quality of the Z-sample layer (new surface) was not known prior to dredging. Subsequent monitoring conducted by the Port of Seattle to assess postdredge sediment quality showed that the newly exposed surface was contaminated (exceeding the chemistry and/or bioassay interpretation CSL) in many areas. Further characterization of these areas will be required to clarify whether contamination is due to recontamination of the surface from the dredging operation, an extension of the contaminated sediment layer below the characterized sediments, or a combination of the two. Lastly, sediments characterized from the Stage II East Waterway proposed dredging area but not yet dredged, also showed a similar pattern of increasing surface to subsurface contamination at some locations. At one location the Z-sample was analyzed and showed a Hg concentration exceeding the surface concentration (Figure 1). Thus, complex surface and subsurface sediment contamination issues identified from this project and others briefly described above have highlighted the need to clarify Z-sample collection and analysis requirements of the DMMP. The clarification below will ensure that the DMMP agencies, especially Ecology, will be able to evaluate the postdredge sediment surface for compliance with Washington State’s “anti-degradation” policy2. PROPOSED CLARIFICATION The DMMP agencies propose the following clarification to the Z-sample collection and analysis guidance. 1. Z-samples will be collected and archived for every core sampling location for all projects in
areas ranked from low to high, unless there is recent sediment quality data (e.g., within recency guideline specifications) to verify that contaminants are restricted to the surficial sediment layer (< 4 feet, or less than the depth cut plus overdredge proposed for dredging) of the sediments proposed for dredging.
2. If a surface dredged material management unit (DMMU) is found to be contaminated (e.g.,
unsuitable for unconfined-open-water disposal), and the underlying DMMU either is contaminated also or has not been adequately characterized, then archived Z-samples must be analyzed to verify the sediment quality of the Z-horizon.
2 The new postdredge sediment surface can not be more contaminated than the existing predredge surface.

Final: 10/3/01
3
3. Z-sample analyses will initially consist of sediment conventional and chemical analyses. If the results of these analyses indicate exceedances of SMS-SQS or CSL chemicals of concern within the Z-sample horizon, the dredging applicant may be required to remobilize and resample those given Z-sample locations in order to perform required biological testing (bioassays and/or bioaccumulation testing). The evaluation standard for interpreting the Z-sample sediment quality data will be the Sediment Management Standards “Sediment Quality Standard”.
4. The postdredged sediment surface (top 10 cm) may be subject to sediment quality
evaluation at the discretion of the DMMP and/or SMS programs for any project where either overlying surface or subsurface DMMU’s were found to be unsuitable for unconfined open-water disposal.
REFERENCES EPTA, 1988. Evaluation Procedures Technical Appendix. Prepared by the Corps of Engineers in cooperation with the Environmental Protection Agency, Region 10, and the Washington State Departments of Ecology and Natural Resources. GHWBUM3, 1995. Dredged Material Evaluation Procedures and Disposal Site Management Manual: Grays Harbor and Willapa Bay, Washington. Prepared by the Corps of Engineers in cooperation with the Environmental Protection Agency, Region 10, and the Washington State Departments of Ecology and Natural Resources. MPR, 1988. Puget Sound Dredged Disposal Analysis (PSDDA) Management Plan Report, Unconfined Open-Water Disposal of Dredged Material, Phase I (Central Puget Sound). Prepared by the Corps of Engineers in cooperation with the Environmental Protection Agency, Region 10, and the Washington State Departments of Ecology and Natural Resources. MPR, 1989. Puget Sound Dredged Disposal Analysis (PSDDA) Management Plan Report, Unconfined Open-Water Disposal of Dredged Material, Phase II (North and South Puget Sound). Prepared by the Corps of Engineers in cooperation with the Environmental Protection Agency, Region 10, and the Washington State Departments of Ecology and Natural Resources.
3 GHWBUM = Grays Harbor, Willapa Bay Dredged Material Users Manual.

Final: 10/3/01
5
Figure 1. East Waterway Project (Stage II)
Surface/Subsurface Mercury Comparisions
*1998 Subsurface composited D7 resampled in 1999 and reanalyzed as individual uncomposited samples.
ED-12
ED-16
ED-17
0 0.5 1 1.5 2 2.5
0-4 ft (1998)
4-8 ft (1998 composite)
4-8 ft (1999)*
Z-Sample

Final: 10/05/01 DMMP CLARIFICATION PAPER QUALITY OF POST-DREDGE SEDIMENT SURFACES Prepared by Thomas H. Gries (Washington Department of Ecology) for the Dredged Material Management Program (DMMP) agencies. INTRODUCTION One of the objectives established in the original Puget Sound Dredged Disposal Analysis (PSDDA) program was that the sediment surface exposed by dredging must meet acceptable sediment quality guidelines. For most dredging projects, the Evaluation Procedures Technical Appendix (EPTA) defined acceptable post-dredge sediment quality as chemical contamination below the maximum level guidelines (MLs) or as meeting appropriate State sediment quality standards (1). EPTA envisioned such standards in 1988, but they had not yet been promulgated. In 1991, Washington State adopted a Sediment Management Standards (SMS) rule that contains both narrative and numeric sediment quality standards or SQS (2). Part I of the rule contains general information on authorities, purpose, applicability and administrative policies. The rule establishes “standards for the quality of surface sediments” in Part III. It also provides sediment source control standards in Part IV and sediment cleanup standards in Part V. The latter addresses minimum acceptable standards for sediment quality subsequent to cleanup actions. PROBLEM IDENTIFICATION Experience with several recent projects has resulted in the need to better define what is considered acceptable sediment quality for surfaces that remain after completing navigation or cleanup dredging projects. One project is known to have post-dredge surface sediment quality that exceeds DMMP MLs, DMMP biological guidelines, SMS chemical and/or SMS biological standards. A different project is believed to have unacceptable sediment quality at a depth that will become exposed by the dredging that is planned. Unfortunately, it is not completely clear in either of the cases cited above which post-dredge surfaces comply with the DMMP guidance found in EPTA or the SMS rule. There are at least two reasons for this uncertainty. First, the language in EPTA does not define what is acceptable post-dredge sediment quality in terms of biological effects, e.g., observed toxicity or bioaccumulation. This appears to be inconsistent with other DMMP guidelines and SMS standards. Second, opinions differ regarding post-dredge surface sediment quality that fully complies with the SMS rule.

Final: 10/05/01 PROPOSED DMMP CLARIFICATION The DMMP agencies propose the following revisions to the guidance on acceptable post-dredge sediment quality found in EPTA. The original text is preserved in Italics, while deletions appear in strikeout font and additions in bold.
2.3 New Sediment Surface Exposed by Dredging. Dredging operations can alter the condition of the surface sediments in the dredging area by exposing new sediments to direct contact with biota and the water column. Because the exposed surfaces may result in greater surface sediment chemical concentrations than existed before dredging, this aspect of dredging must be considered in project planning, review and decision-making. A variety of options were considered for sampling of material that might be left following a dredging operation. EPWG specified that the new exposed surfaces be sampled to a depth of 1 ft below overdepth, and that the composited sample be archived. Chemical analyses of this material would only be required of the dredger if the sediment above the exposed surface indicated potentially elevated chemical concentrations. Several options for disposition of, and responsibility for, material that might be left following a dredging operation were discussed. Resolution of this issue was as follows, with three separate cases considered: 1. Material with unacceptable chemical concentrations may be present adjacent to a
dredged area, but in an area that is not proposed to be dredged. In such cases, the dredger has no requirement under the PSDDA program to address the fate of the sediment in the adjacent area.
2. The dredging operation may result in exposure of sediment that has higher elevated
chemical concentrations, greater toxicity, more bioaccumulation or higher risk than the material that was dredged. The concentrations of chemicals in the exposed sediment could: The following three scenarios are possible:
a. be less than the chemical ML for unconfined, open water disposal; b. exceed the chemical ML for unconfined, open water disposal, but not the in
situ sediment standard for chemical concentrations (i.e., a chemical guideline requiring evaluation of potential remedial action; such a guideline has not yet been established; or
c. exceed the in situ sediment standard for chemical concentration as well as the chemical ML for unconfined, open water disposal.
The dredger must overdredge or cap the exposed sediment if chemical concentrations in the sediment exceed the ML for unconfined open-water disposal (see section II-8.2 and table II-11.1). Dredging that causes surface chemical concentrations to exceed this level is unacceptable.

Final: 10/05/01 a. The post-dredge surface sediment exceeds no DMMP chemical or biological
guidelines and no SMS chemical or biological criteria or standards. In this case, the dredger has no requirement under the dredging program concerning the fate of the exposed sediments.
b. The post-dredge surface sediment quality exceeds the chemical or biological SQS and/or minimum cleanup levels (MCUL). In this case, the dredger is not in compliance with the antidegradation policy in the SMS rule (WAC 173-204-120) and the dredger will be required by the SMS to 1) evaluate the impacts to beneficial resources, 2) apply for a sediment impact zone, and/or 3) determine the technical feasibility, cost and net environmental effects of overdredging and/or capping the new sediment surface. Henceforth, the DMMP supports the antidegradation policy contained in the SMS rule by also managing “sediment quality so as to protect existing beneficial uses and move towards attainment of designated beneficial uses”. This means that post -dredge surface sediment should be closer to meeting the chemical and biological SQS than the pre-dredge surface sediment.
c. The post-dredge surface sediment exceeds one or more DMMP MLs or biological guidelines for unconfined open-water disposal. In this case, the dredging causes the post-dredge surface sediment quality to exceed acceptable DMMP guidelines and the dredger must overdredge and/or cap the exposed sediment (see section II-8.2 and table II-11.1).
3. The dredging operation may leave material that contains lower chemical
concentrations, less toxicity, less bioaccumulation and less associated risk than was initially present. In this case, the dredger has no requirement under the dredging program concerning the fate of the exposed sediments. However, there may be other regulatory programs that request or require additional dredging in this, and other cases. For example, the dredger may be determined to be responsible for discharge of the chemicals of concern and be required under a State or Federal regulation to conduct additional dredging as a remedial measure. However, while the post-dredge surface sediment may meet the intent of the antidegradation and designated use policies of the SMS rule (Section 120), additional dredging and/or capping of the exposed sediment may still be required by the SMS as part of an agreed cleanup or source control actions if post-dredge surface sediment quality still exceeds SMS chemical or biological sediment quality criteria or standards.
REFERENCES 1. EPTA, 1988. Evaluation Procedures Technical Appendix. Prepared by the Corps of
Engineers in cooperation with the Environmental Protection Agency, Region 10, and the Washington State Departments of Ecology and Natural Resources.
2. Sediment Management Standards, 1991. 173-204 Washington Administrative Code.
Washington Department of Ecology, revised 1995.
Final 9/30/97
1
MANAGEMENT OF WOOD WASTE UNDER DREDGED MATERIALMANAGEMENT PROGRAMS (DMMP) AND THE SEDIMENTMANAGEMENT STANDARDS (SMS) CLEANUP PROGRAM
DMMP CLARIFICATION PAPERSMS TECHNICAL INFORMATION MEMORANDUM
Prepared by David Kendall (U.S. Army Corps of Engineers) and Teresa Michelsen(Washington Department of Ecology).
INTRODUCTION
Wood waste is commonly encountered in the aquatic environment of the PacificNorthwest, due to the prevalence of lumber, pulp, and paper industries. Log rafting, barkstripping, and other wood processing activities often result in wood waste entering theaquatic environment. In some cases, wood waste has been used as fill along shorelines orotherwise deposited into intertidal and subtidal areas. The phrase “wood waste”, as usedin this paper, may include any natural or processed material of woody origin, ranging fromlarge logs, branches, and pieces of bark lying on top of sediments, to thick deposits ofsawdust, wood chips, or similar materials, to highly decomposed fibrous materialsthoroughly mixed with sediments. In some cases, wood waste is the only issue. In otherlocations, wood waste may be mixed with petroleum, wood preservatives, or othercontaminants.
Wood waste has been increasingly encountered by the agencies responsible for sedimentmanagement activities, including dredged material disposal, aquatic lands leasemanagement, and sediment site cleanup. Questions have arisen regarding the potentialadverse effects of wood waste, the agencies’ regulatory authority to address wood waste,and the approach that will be taken to manage wood waste. This memorandum providesbackground information on these topics and clarifies the approach taken by the agenciestoward regulation of wood waste in the aquatic environment.
PROBLEM STATEMENT
Wood waste can have a variety of physical and chemical adverse impacts on aquatic life,depending on its form. Wood waste, like any organic waste, creates a biological oxygendemand in sediments as it decomposes, and excessive amounts can reduce or eliminate theaerobic zone (Pease, 1974; Schaumberg 1973). A lack of oxygen in sediments limits thesurvival of benthic organisms, and can produce a shift in the benthic community towardspecies tolerant of organic enrichment (Schuytema and Shankland, 1976). In addition,compounds such as sulfides, ammonia, and methane can build up in anaerobic sedimentsdue to natural biological processes to levels that are toxic to many benthic organisms

Final 9/30/97
2
(Hansen et al., 1971; Conlan and Ellis, 1979; Freese and O’Clair, 1987). Somecompounds, such as sulfides, form primarily in marine waters, while others, such asmethane, are more likely to be present in freshwater systems (Mitsch and Gosselink, 1993;Libes, 1992).
Wood waste leaches and/or degrades into some compounds that can be toxic to aquaticlife, such as phenols and methylated phenols, benzoic acid and benzyl alcohol, terpenes,and tropolones (Buchanan et al., 1976; Peters et al., 1976; Pease, 1974; Lewin andGoldstein, 1991; Benedict, 1971; Schermer and Phipps, 1976; WDF, 1960). Several ofthese compounds have SMS criteria due to documented adverse effects on aquatic life inPuget Sound; others have been determined through laboratory studies to be toxic tosalmon and other fish. Different types of wood and bark leach different chemicals andshow varying degrees of toxicity in laboratory bioassays (Graham and Schaumberg, 1969;Schaumberg, 1973; Schuytema and Shankland, 1976; Kai, 1991; Laks, 1991). Certain ofthese compounds (e.g., terpenes and tropolenes) are much more bioavailable in freshwaterthan in marine waters (Pease, 1974).
Finally, large masses of wood waste may provide an inappropropriate physical substratefor benthic colonization, spawning, and other habitat needs, and may smother aquaticplants and benthic organisms (Harris et al., 1985; Chang and Levings, 1976; Schultz andBerg, 1976; Conlan and Ellis, 1979; Jackson, 1986; Servizi et al., 1971; O’Clair andFreese, 1988). Large accumulations of wood waste are slow to degrade and may persistin the aquatic environment for decades (Ellis, 1970; Conlan, 1977; Schultz and Berg,1976; Harmon et al., 1986). Additional information on the impacts of wood waste can befound in recent literature reviews prepared by TetraTech (1996), Floyd & Snider andPentec (1997), and Pentec (1997).
For all of these reasons, wood waste is considered a deleterious substance that may haveadverse effects on aquatic life. However, there are occasions when lesser amounts ofuncontaminated large woody debris can provide habitat benefits (Schaumberg, 1973;Pease, 1974; Pentec, 1994). The severity of wood waste effects in sediments dependsdirectly on its physical form, its degree of incorporation into sediments, the amount ofwood waste present, the amount of flushing in the area, the habitat (freshwater or marine),and the type of wood from which the waste was derived. Therefore, the adverse impactsof wood waste are largely site-specific, and may vary considerably even within a smallarea. This has led to considerable discussion of the best approach to regulating woodwaste in the aquatic environment.
REGULATORY AUTHORITIES
Authorities for Addressing Wood Waste under the Dredged Material ManagementPrograms.
Dredging and disposal authorities do not specifically address woodwaste, but specifyregulation of dredged and fill material in “waters of the United States”. The Clean Water

Final 9/30/97
3
Act prohibits the discharge of dredged or fill material except in compliance with section404. Section 404 sets up a procedure for issuing permits specifying discharge sites anddischarge conditions ... The permitting authority (either the Corps of Engineers or anapproved State program) approves discharges at particular sites through application of thesection 404(b)(1) Guidelines, which are the substantive criteria for dredged and fillmaterial discharges under the Clean Water Act. The guidelines at 40 CFR 230.10(c) statein part that “...no discharge of dredged or fill shall be permitted which will cause orcontribute to significant degradation of the waters of the U.S. Findings of significantdegradation related to the proposed discharge shall be based upon appropriate factualdeterminations, evaluations and tests ...”. Wood waste is often associated with dredgedmaterial and has been used as fill for projects in this region.
Congress granted to the states the responsibility for certifying under Section 401 of theCWA that a proposed discharge will comply with all applicable provisions of State andFederal water quality laws. Ecology and EPA Region 10 have interpreted these laws toinclude sediment quality as an aspect of water quality. This certification is required fromany applicant for a Federal permit (or Federal project) to conduct any activity which mayresult in any discharge into State waters. Compliance with Section 401 also ensures thatany such discharges will comply with the applicable provisions of Sections 301, 302, 303,306, and 307 of the CWA. In particular, Section 303 allows states to establish waterquality standards and provides that discharges meet these standards.
Ecology also establishes guidelines for State and local administration of the WashingtonShoreline Management Act (SMA), which provides guidance on regulating woodwaste(RCW 90.58) . Ecology ensures that permits issued by local governments are consistentwith the intent of the act.
Authorities for Addressing Wood Waste under SMS
The Sediment Management Standards derive their authority from both the State WaterPollution Control Act (Chapter 90.48 RCW) and the Model Toxics Control Act (Chapter70.105D RCW). Chapter 90.48 provides authority for the department to promulgateregulations that set standards to protect the waters of the state, and regulate discharges ofpolluting substances. Pollution is defined in RCW 90.48.020 as any “contamination ... ordischarge of any liquid, ... solid, ... or other substance into any waters of the state as willor is likely to ... render such waters harmful, detrimental or injurious to the public health ...fish, or other aquatic life.” The Model Toxics Control Act provides authority for thedepartment to set cleanup standards and require cleanup of hazardous substances on landand in water. Hazardous substances are defined in RCW 70.105D.020(7)(e) to include“Any substance ... including solid waste decomposition products, determined by thedirector by rule to present a threat to human health or the environment”.
The Sediment Management Standards provide authority in WAC 173-204-520(5) torequire cleanup of “other deleterious substances” on a case-by-case basis. This sectionstates that the cleanup level for such substances shall be “at or below levels which cause

Final 9/30/97
4
minor adverse effects in marine biological resources, or which correspond to a significanthealth risk to humans, as determined by the department.” The term “other toxic,radioactive, biological, or deleterious substances” is defined in WAC 173-204-200(17),and specifically includes organic debris within the definition. This definition by rule oforganic debris as a deleterious substance meets the Model Toxics Control Act requirementcited above.
PROPOSED ACTIONS
The following sections describe proposed actions to address wood waste under theDMMP and the SMS cleanup program.
Dredged Material Management Program
Collection of sediments in the field should include a visual assessment of wood debris1
fractions (logs, branches, bark, saw dust, silt-clay sized wood fragments in the sample).This analysis typically would not include the larger woody debris, such as logs, orbranches that can be selectively removed during dredging as part of debris removal by thedredging contractor. The PSDDA program requires debris removal prior to disposal, anddoes not allow disposal of debris greater than 24” X 24” at the open-water disposal sites.Sediments with larger pieces of woody debris may require debris removal by passing thedredged material through a 24” X 24” steel screen. Anything passing through a 24” X24” screen must be considered as part of the sample/wood debris volume estimationexercise, which could include bark, or smaller pieces of woody residue grading fromgravel sized to silt and clay sized particles. This fraction of the sample should beobjectively analyzed in the laboratory to quantify the wood fraction as described below.
Wood debris can be quantified in the laboratory on either a volume or a weight-specificbasis. While quantifying wood debris in sediments on a volumetric basis may be moreecologically meaningful, it is much more difficult and less accurate than quantifying it on aweight specific basis. Therefore, dredged material assessment of wood debris will beaccomplished on a dry weight-specific basis, then converted to a volumetric basis bymultiplying the weight-based number by two2 (example: 25% by weight @ 50% by 1 Debris is currently defined by the PSDDA agencies as (Phase II MPR, pages 6-3 and 6-6):
"... material that could cause interference with particular uses. Floatable debris comprisesmaterial, such as logs, that could cause navigation hazards or solids, such as plastic or woodchunks, that could foul beaches. Non-floatable debris comprises material that could reasonablybe expected to cause conflicts with bottom net or trawl fishing. Because functional definitions ofdebris are used, dredged material, if consolidated into large chunks, could itself be considereddebris if, for example, it could snag nets and thus interfere with fishing activities."
The current policy as specified in the PSDDA Management Plan Report (Phase II) requires selectiveremoval of debris from dredged material suitable for unconfined open-water disposal.
2 Observed ratio from Port of Everett/South Terminal Dredging Project reported in Floyd & Snider andPentec (1997).

Final 9/30/97
5
volume). Ecology in the past has regulated dredged material with wood debris volumesgreater than 50% by weight under Section 401 (water quality certification) as generallybeing unsuitable for unconfined open-water disposal. The proposed guidance stipulatesthat dredged material containing significant amounts of woody material/debris will now betested to quantify the organic fraction3. Dredged material containing an organic fractiongreater than 25% dry weight will be required to undergo biological testing to assess thesuitability of the material for unconfined open-water disposal. Likewise, dredged materialcontaining an organic fraction less than 25% dry weight will be considered suitable forunconfined open-water disposal without further testing unless one or more chemicals ofconcern exceed chemical screening levels.
When samples with significant quantities of wood debris are subjected to biological testingsome toxicity associated with ammonia, sulfides, and methane generated from naturalbiological processes in the sediments may occur. In these cases, applicants may wish toconsider monitoring interstitial ammonia levels before initiating bioassays to ensure thattotal ammonia levels are equal to or less than 20 mg/l. If ammonia levels exceed 20 mg/l,the EPA/ACOE protocol for reducing ammonia levels may be followed before initiatingbioassays (EPA/COE, 1993).
Sediment grainsize is an important consideration when selecting the species to be used inthe amphipod test and choosing appropriate reference sediments. Therefore, in addition toconventional grainsize analysis, applicants should analyze the residue left from themodified Total Volatile Solids analysis for grain size. The organic-free particle sizedistribution should be used in conjunction with the conventional particle size distributionin selecting the appropriate amphipod species and reference sediment.
SMS Cleanup Program
Because of its potential to cause adverse impacts to aquatic life, Ecology will requirewood waste cleanup at sites when it is demonstrated to be harmful. However, because thetoxicity of wood waste varies considerably depending on the factors described above,Ecology is not proposing to develop a specific chemical criterion (such as a TOC level)above which cleanup would be required.
Instead, like any other contaminant for which chemical criteria are not available, sedimentscontaminated with wood waste and the chemical byproducts of the breakdown of woodwaste will be assessed through the biological testing procedures listed in SMS (bioassaysand/or benthic studies) as described in the PSEP protocols. Results of the biological testswill be compared to biological SQS and CSL levels currently established in the SMS rule.Because a portion of the in situ toxicity of wood waste is associated with the production
3 One method recently applied to a dredging project involved a weight based method: quantification bymodified Total Volatile Solids (TVS) analysis (ASTM D-2974C ) protocol, where the sample size wasincreased to 100-300 grams of sample. Other methods may be proposed by the applicant in lieu of thisapproach, but must be approved by the agencies with jurisdiction over dredging and disposal.

Final 9/30/97
6
of ammonia and sulfides in sediments, for the purpose of assessing sediment compliancewith the biological SQS and CSL, modifications to the PSEP protocols should not bemade that would reduce the toxicity of these chemicals to bioassay species (e.g., purgingor flow-through testing). However, modified bioassay tests may be proposed under thealternative technologies rule to evaluate the contribution to toxicity from conventionalpollutants vs. toxic/persistant chemicals, since these classes of chemicals may requiredifferent technologies to effectively remediate.
During several recent site investigations, Ecology has found that sediment vertical profileimaging (SVPI), or other similar technology, may be useful as a screening tool to helpfocus the selection of areas for bioassay testing. Because the adverse impacts of woodwaste are typically associated with anaerobic sediments, mapping of the thickness of theaerobic zone, production of methane, and presence or absence of benthic organismsthrough SVPI can be helpful in cost-effectively screening areas that are unimpacted(similar to reference) and areas that are clearly heavily impacted by wood waste and/orother organic contamination. Alternatively, areas likely to be impacted may be screenedthrough analysis of conventional parameters, such as TOC, and comparison of these levelsto reference areas. Biological testing can then be focused on those areas with intermediatelevels of impact to identify the SQS/CSL boundaries. These or other screening processesmay be proposed under the alternative technologies rule during a site investigation toreduce the costs of bioassay testing.
At some sites, wood wastes may be present in sufficient quantities that they may beclassified as solid wastes rather than sediments. In accordance with solid wasteregulations, Ecology may require in such a case that the deposits of wood waste (or anyother solid waste materials encountered) be removed from the aquatic environment anddisposed of in a permitted solid waste facility, even when toxicity to aquatic life is low.Various screening methods can be used to map areas with heavy deposits of wood waste,including visual inspection of van Veen or core samples, diver- or remotely-operated videotransects, side-scan sonar surveys, SVPI, and/or analysis of organic residue by weight, asdescribed for the dredging program.
Although several commenters requested clarification on the relationship between the solidwaste and sediment cleanup program, it is not possible to provide additional specificity atthis time, since solid waste rules and policies regarding wood wastes are evolving. Pleasesee the responsiveness summary for additional information.
REFERENCES
Benedict, A.H. (1971). An investigation of the effects of bark leaching and benthaldecomposition on receiving water quality. National Council of the Paper Industry for Airand Stream Improvement, New York, NY. Technical Bulletin Number 247.

Final 9/30/97
7
Buchanan, D.V., P.S. Tate, and J.R. Morning. (1976). Acute toxicities of spruce andhemlock bark extracts to some estuarine organisms in southeastern Alaska. Journal of theFisheries Research Board of Canada 33:1188-1192.
Chang, B.D. and C.D. Levings. (1976). Laboratory experiments on the effects of burialon the heart cockle (Clinocardium nuttalli) and the Dungeness crab (Cancer magister).Fish. Mar. Ser. Res. Dev. Technical Report 662. 170 pp.
Conlan, K.E. (1977). The effects of wood deposition from a coastal log handlingoperation on the benthos of a shallow sand bed in Saanich Inlet, British Columbia.Master’s Thesis, University of Victoria, British Columbia.
Conlan, K.E. and D.V. Ellis. (1979). Effects of wood waste on sand-bed benthos. Mar.Poll. Bull. 10:262-267.
Ellis, R.J. (1970). Ecological problems: Report on a study of effects of log rafting anddumping on marine fauna in southeast Alaska. U.S. Fish and Wildlife Service, Juneau,AK, unpublished report. 7 pp.
Floyd & Snider and Pentec. (1997). Review of the significance of log handling and wooddebris in the marine environment. Draft Report. Prepared for the Hylebos Wood DebrisGroup (Louisiana-Pacific Corp., Manke Lumber Company, and Weyerhaeuser Company),Tacoma, WA.
Freese, J.L. and C.E. O’Clair. (1987). Reduced survival and condition of the bivalvesProtothaca staminea and Mytilus edulis buried by decomposing bark. MarineEnvironmental Research 23:49-64.
Graham, J.L. and F.D. Schaumberg. (1969). Pollutants leached from selected species ofwood in log storage waters. Papers presented at the 24th Purdue Industrial WasteConference, Lafayette, Indiana.
Hansen, G., G. Carter, W. Towne, and G. O’Neal. (1971). Log storage and rafting inpublic waters. Task Force Report, Pacific Northwest Pollution Control Council, Olympia,WA.
Harmon, M.E., J.F. Franklin, F.J. Swanson, P. Sollins, S.V. Gregory, J.D. Lattin, N.H.Anderson, S.P. Cline, N.G. Aumen, J.R. Sedell, G.W. Lienkaemper, K. Cromack, Jr., andK.W. Cummins. (1986). Ecology of coarse woody debris in temperate ecosystems.Advances in Ecological Research 15:133-302.
Harris, R.P. (1985). Log transfer facility siting, construction, operation, andmonitoring/reporting guidelines. Prepared for the Governor of Alaska by the LTFGuidelines Technical Committee, Juneau, AK. 57 pp.

Final 9/30/97
8
Jackson, R.G. (1986). Effects of bark accumulation on benthic infauna at a log transferfacility in southeast Alaska. Mar. Poll. Bull. 17(6):258-262.
Kai, Y. (1991). Chemistry of extractives. In: Wood and Cellulosic Chemistry. N.-S.Han, D. and N. Shiraishi (Eds). Marcel Dekker, New York, NY. pp. 215-255.
Laks, P.E. (1991). Chemistry of bark. In: Wood and Cellulosic Chemistry. N.-S. Han,D. and N. Shiraishi (Eds). Marcel Dekker, New York, NY. pp.257-330.
Lewin, M. and I.S. Goldstein, Eds. (1991). Wood structure and composition.International Fiber Science and Technology Series, Version 11. Marcel Dekker, NewYork, NY.
Libes, S.M. (1992). An introduction to marine biogeochemistry. John Wiley & Sons,New York, NY.
Mitsch, W.J. and J.G. Gosselink. (1993). Wetlands. Van Nostrand Reinhold, New York,NY. 722 pp.
O’Clair, C.E. and J.L. Freese. (1988). Reproductive condition of Dungeness crabs,Cancer magister, at or near log transfer facilities in southeastern Alaska. MarineEnvironmental Research 26:57-81.
Pease, B.C. (1974). Effects of log dumping and rafting on the marine environment ofsoutheast Alaska. U.S. Forest Service General Technical Report PNW-22, Juneau, AK.58 pp.
Pentec Environmental. (1994). Port of Port Angeles, proposed marine safety andresource center preliminary environmental assessment and conceptual mitigation plan.Prepared for the Port of Port Angeles, WA.
Pentec Environmental. (1997). Log storage in fresh water. Prepared for ReTec, Seattle,WA. Unpublished report. 5 pp.
Peters, G.B., H.J. Dawson, B.F. Hrutfjord, and R.R. Whitney. (1976). Aqueous leachatefrom western red cedar: Effects on some aquatic organisms. Journal of the FisheriesResearch Board of Canada 33:2703-2709.
Schaumberg, F.D. (1973). The influence of log handling on water quality. U.S.Environmental Protection Agency Report EPA-R2-73-085, Washington D.C. 105 pp.
Schermer, E.D. and J.B. Phipps. (1976). A study of woodwaste leachate. WashingtonDepartment of Ecology, Olympia, WA.

Final 9/30/97
9
Schultz, R.D. and R.J. Berg. (1976). Some effects of log dumping on estuaries. NationalMarine Fisheries Service, Juneau, AK. 64 pp.
Schuytema, G.S. and R.D. Shankland. (1976). Effects of log handling and storage onwater quality. U.S. Environmental Protection Agency, Office of Research andDevelopment, Industrial Environmental Research Laboratory, Cincinnati, Ohio. EPA300/2-76-262.
Servizi, J.A., D.W. Martens, and R.W. Gordon. (1971). Toxicity and oxygen demand ofdecaying bark. Journal Water Pollution Control Federation 43:278-292.
TetraTech. (1996). Ocean discharge criteria evaluation of the NPDES general permit forAlaskan log transfer facilities. Prepared for U.S. Environmental Protection Agency,Region 10, Seattle, WA. 121 pp.
WDF. (1960). Toxic effects of organic and inorganic pollutants on young salmon andtrout. Washington Department of Fisheries, Research Bulletin No. 5. 264 pp.

BENEFICIAL USE OF DREDGED MATERIAL
DMMP CLARIFICATION PAPER
Prepared by Justine Barton (U.S. Environmental Protection Agency, Region 10) for the DMMP agencies.
INTRODUCTION
"Beneficial use" is the placement or use of dredged material for some productive purpose. While the term "beneficial" indicates some "benefit" is gained by a particular use, the term has come to generally mean any "reuse" of dredged material. As part of overall sediment management in Washington, the regulatory agencies responsible for sediment management support the productive reuse of dredged material. To this end, a work group was established as part of the Cooperative Sediment Management Program Interagency Agreement. The work group consisted of regulatory agencies, local government, port representatives, and a tribal representative and met over the course of a year. Based on the meeting discussions, a draft users manual has been produced. Excerpts from this manual are presented here to clarify portions of the proposed process for beneficial use. The purpose of the manual is to promote beneficial uses and to provide a clear process that encourages a wide variety of beneficial uses. A separate report to the agency heads will suggest future work to be performed by agency staff including resolution of agency policy differences that affect beneficial uses.
PROBLEM IDENTIFICATION
While a number of beneficial use projects have been pursued in Washington over the last ten years, no clear process has been developed for project proponents and agency reviewers wishing to promote these types of projects. Projects are handled on a case by case basis.
TECHNICAL BACKGROUND AND DISCUSSION
Generally the proposed process utilizes existing cooperative models and fora for handling beneficial uses project management and review. In this clarification paper, aspects of pre-application, sediment characterization, and a suitability determination process are outlined. These processes are generally consistent with the way beneficial use projects are currently handled, that is, on a case by case basis. Other issues such as prioritization for use of material are handled in the draft manual and will be further discussed during public review of the draft manual.
PROPOSED CLARIFICATIONS
Pre-application for Material.

When the Washington Department of Natural Resources (DNR) owns dredged material desired for reuse, the project proponent should contact DNR and the Corps early in the project planning process. In this pre-application process, DNR and/or Corps agency representatives will present potential beneficial use projects at the interagency Cooperative Sediment Management Program (CSMP) monthly forum. It is likely the project proponent will be asked to provide either a brief written project description, or provide a presentation of the proposed project. In some dredging years conflicts among potential users of dredged material may arise. In these situations a CSMP interagency subgroup and project proponents will likely have separate meetings to discuss potential projects, resolve conflicts, and determine priority for use of the material.
(Note: A table specifying material ownership and contact numbers is available in the draft manual and will be updated annually at the SMARM.)
When DNR is not the owner of the material, a project proponent should approach the material owner and negotiate for its use. If a beneficial use project is agreed upon and will be brought forward for permitting, the project should be coordinated via the Corps at the interagency Cooperative Sediment Management Program monthly forum.
Sediment Characterization.
Sediment characterization is required in order to determine whether a particular dredged material is suitable for a proposed reuse. Characterization may include determining physical characteristics (such as grain size) and chemical characteristics via sampling and testing. The amount of information already known about an area and its dredged material, as well as the proposed reuse, will dictate the amount and types of characterization required.
Unconfined aquatic projects (such as beach nourishment, habitat restoration, and in-situ capping) are projects where dredged material may come directly into contact with the surrounding aquatic environment. For these projects dredged material is compared to existing numeric and narrative standards of the Washington State Sediment Management Standards (SMS) in Chapters 173-204-320 through 173-204-340 WAC.
Material <= SQS (including bioassays) is appropriate for most projects
Material >SQS but less than CSL may be appropriate on a case-by-case basis due to site specific considerations
(SQS are the sediment quality standards located at Chapter 173-204-320 WAC)
PSDDA Comparisons.
In Washington state many dredgers initially test their dredged material via the Puget Sound Dredged Disposal Analysis (PSDDA) process or the Grays Harbor/Willapa Dredged Material Evaluation Procedures. These programs determine if dredged material

is suitable for unconfined open-water disposal at specific sites. The suitability of dredged material for unconfined open-water disposal at designated open-water sites is documented in a signed interagency "Suitability Determination." If a proposed beneficial use project falls through, a dredger with a PSDDA Suitability Determination could still use the PSDDA unconfined, open-water disposal sites for disposal.
At present, a PSDDA or Grays Harbor/Willapa Suitability Determination for open-water disposal alone is not adequate for an aquatic beneficial use project. A specific analysis and comparison of testing results to the Washington State Sediment Management Standards must be performed. This means that data obtained under programs such as PSDDA or Grays Harbor/Willapa must be repackaged to allow comparison to Washington State SMS. Separate actions are underway to more closely align PSDDA/Grays Harbor/Willapa chemical guidelines for sediments with the SMS.
Suitability Determination Process.
In order to provide for efficient consideration of project data and to document suitability of material for beneficial use, the suggested process is to utilize the existing Corps Dredged Material Management Office (DMMO) coordination and suitability determination process for aquatic beneficial use projects. Using the Corps DMMO as the clearinghouse, the agencies will encourage applicants to consider beneficial use up front in their sampling and analysis plan and ensure data collected will allow for repackaging for SMS interpretation. If a project's sediments are <=SQS, the agencies will sign a suitability determination indicating that the material meets SQS and as such is generally appropriate for "exposed" aquatic beneficial use. Similar to current PSDDA suitability determinations, the beneficial use section of the suitability determination would contain a caveat that the suitability determination is NOT a permit and that other factors such as antidegradation, etc. will be applied during permit processes.
The use of the suitability determination process and repackaging of PSDDA and other data when necessary requires an interagency commitment to use of Best Professional Judgment. Some potential repackaging complications between the existing open water disposal programs (PSDDA and Grays Harbor/Willapa) and SMS include detection limits, use of TOC normalization, and slightly different lists of chemicals of concern. These issues should be considered up front when the applicant initially prepares a sampling and analysis plan. If complications arise during repackaging for SMS comparisons, they will be handled using best professional judgment, depending on the project and issues at hand.

Final: 10/30/06
DMMP/SMS CLARIFICATION PAPER REPORTING OF SEDIMENT-BOUND CONTAMINANTS: STANDARDIZATION OF SIEVING AND ANALYTICAL PROCEDURES Prepared by David Sternberg (WA State Department of Ecology) for the Dredged Material Management Program (DMMP) agencies and Ecology’s Sediment Management Standards (SMS) Program. INTRODUCTION Evaluation of contaminated sediments using defensible methods is critical to the assessment of ecological and potential human health risks associated with COPCs. Proper evaluation of certain physical and chemical properties of sediment is critical for determining the potential for them to harbor chemicals of potential concern (COPCs). The mass and concentration of COPCs found in sediment deposits depend on certain physical and chemical properties of the sediment. It is generally accepted that the majority of contaminants in fluvial systems end up in depositional areas associated with the fine-grained fraction of the bed sediment. Studies performed on contaminated sediments normally focus on the sand, clay and silt fractions because of their prevalence in depositional areas and they are known to contain the majority of the anthropogenic contaminants. For marine and estuarine systems, most sediment tends to be of a finer- grain size as well. Many reservoirs created by dams may also be dominated by finer-grained sediments, but this is not the case for all aquatic ecosystems. In higher energy fluvial systems common to the western U.S., for example, sorting of sediments may be poor, e.g., finer-grained material can readily mix with coarser-grained clasts of the gravel to boulder size. This is precisely the case in the Spokane River, for example, which is the site subject of significant ongoing investigation and cleanup work. PROBLEM IDENTIFICATION The purpose of this paper is to clarify existing guidance for sieving sediment samples, prior to sample preparation and chemical analysis, and for reporting all analytical results for COPCs in a manner is representative and consistent. Although total organic carbon (TOC) concentrations are typically higher in the silt/clay portion of sediment relative to fine sand (250µm), elevated carbon concentrations and associated toxicants may also occur in coarse sand due to the presence of organic debris (Ghosh et al., 2000). Organic debris in the very coarse-sand size range (1- 2 mm) may contain high levels of contaminants and is of particular interest in higher energy carbon-starved river systems. Contaminants typically associated with organic carbon in sediments may bind to organic debris in carbon starved systems. The increase in organic particles and the contaminants bound to them is quantifiable and accurate, provided that the sediment is analyzed on a dry-weight basis and diligent sample collection and sieving procedures are followed. In some cases, provided care is
Final: 10/30/06
taken to collect and analyze all the sediment particles, TOC concentrations in the coarser sand-sized grains approach those seen in the silt/clay fraction of sediments (Anderson et al 1981). This organic debris frequently contains contaminants at similar concentrations to those found in the silt/clay constituents of sediment (Ghosh et al., 2001). The manner in which organic matter may disperse among all the coarser fraction of fine-grained sediments (<2mm) and the important role that organic carbon may play in sequestering environmental toxicants in silt/clay portions of sediments necessitates inclusion of both the fines (silt/clay) and sand fractions in studies designed to characterize contaminated sediments. Inclusion of gravel or larger and more inert clasts (> 2mm) in sediment samples designated for chemical analysis leads to results with an inappropriately low bias. Regulatory authorities continue to revise standard operating procedures (SOPs) for evaluating sediment quality based on the consensus scientific opinion that recognizes COPCs are generally associated with smaller grained particles (<2 mm). Federal and state agencies charged with managing contaminated sediment sites use chemistry data reported on a dry-weight or organic carbon-normalized basis to make regulatory decisions, e.g., cleanup and restoration. Although there is general agreement that sediment fines behave as sinks and/or sources of contaminants, further guidance is required to ensure appropriate sample preparation procedures are followed in order to make certain that consistent and comparable grain-sizes are used in the evaluation and reporting of COPCs relative to the total sample (e.g., a bulk sample). It is an accepted practice for field and laboratory personnel to remove larger clasts and debris from sediment samples, as long as they provide a record of their activities. The flexibility of field personnel to make these decisions, based on their best professional judgment, needs to be maintained. However, regulatory decisions should be made on samples processed in a consistent manner and inter-laboratory differences, due to variations in sample handling methods, should be minimized whenever possible. Establishing SOPs for the removal of larger-grained gravels/objects prior to chemical analysis and defining the fraction of finer sediments analyzed for COPCs will ensure spatial and temporal consistency in sediment chemistry values. PROPOSED ACTION/MODIFICATION Based on the aforementioned characteristics of sediments, DMMP and Ecology staff propose clarifying sampling and data reporting guidelines to better standardize sediment chemistry analysis relative to specific grain size fractions of sediment samples. This is of particular concern in the higher energy fluvial systems where well sorted, fine-grained deposits often are not the norm. Adherence to a common framework/guideline will enable Ecology and other agencies to compare data within and between sites on a statewide and regional basis. Creation of comparable data will also increase our understanding of the relationship between sediment grain size, contaminant concentrations, and toxicity. The agencies are also coordinating with the Regional Sediment Evaluation Team (RSET) to advance this initiative on a more expansive regional basis.
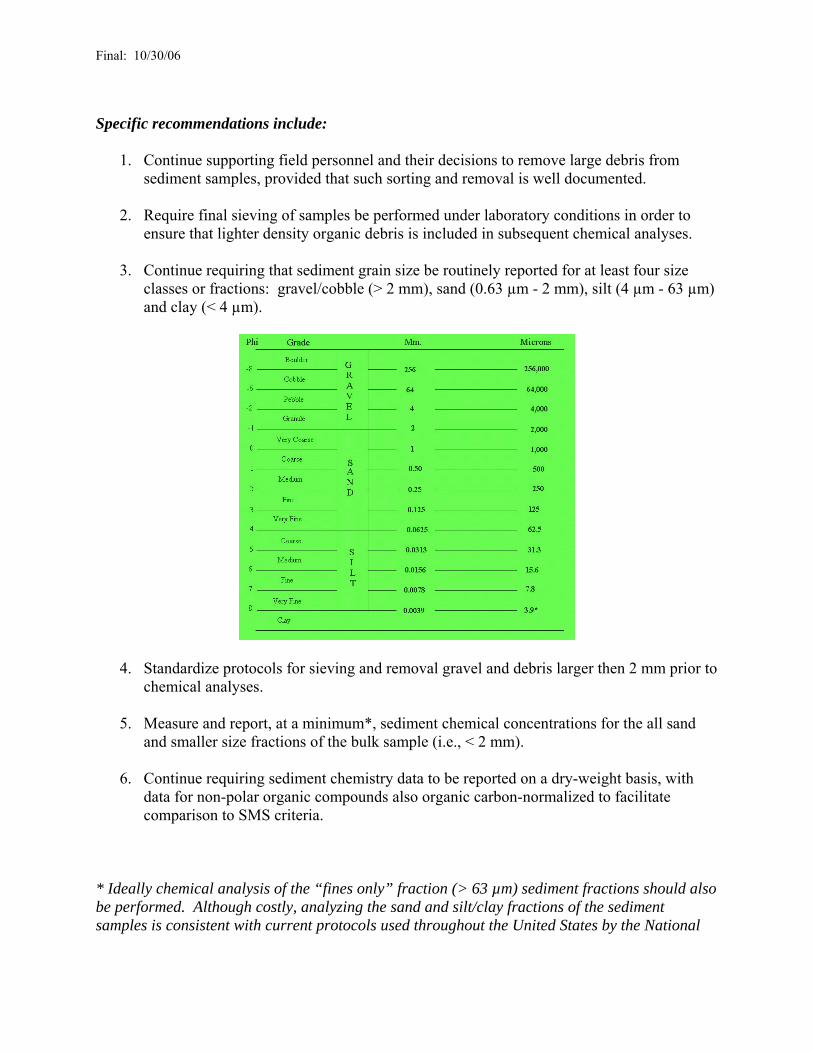
Final: 10/30/06
Specific recommendations include:
1. Continue supporting field personnel and their decisions to remove large debris from sediment samples, provided that such sorting and removal is well documented.
2. Require final sieving of samples be performed under laboratory conditions in order to ensure that lighter density organic debris is included in subsequent chemical analyses.
3. Continue requiring that sediment grain size be routinely reported for at least four size classes or fractions: gravel/cobble (> 2 mm), sand (0.63 µm - 2 mm), silt (4 µm - 63 µm) and clay (< 4 µm).
4. Standardize protocols for sieving and removal gravel and debris larger then 2 mm prior to chemical analyses.
5. Measure and report, at a minimum*, sediment chemical concentrations for the all sand and smaller size fractions of the bulk sample (i.e., < 2 mm).
6. Continue requiring sediment chemistry data to be reported on a dry-weight basis, with
data for non-polar organic compounds also organic carbon-normalized to facilitate comparison to SMS criteria.
* Ideally chemical analysis of the “fines only” fraction (> 63 µm) sediment fractions should also be performed. Although costly, analyzing the sand and silt/clay fractions of the sediment samples is consistent with current protocols used throughout the United States by the National
Final: 10/30/06
Water Quality Assessment Program of the U.S. Geological Survey (NAWQA-USGS) (Shelton and Capel, 1994). Adoption of these recommendations and the continued refinement of SOPs for sediments will enable all agencies involved in the RSET to have greater confidence in data when comparing sediment from various watersheds throughout the region. In fact, this clarification paper attempts to formalize practices that are already commonly used in sediment laboratories. These recommendations are technically defensible and account for physical/chemical factors that affect the concentration, bioavailability, and ecological effects of COPCs in sediments. REFERENCES Anderson, J. R., Storey, K. J., and Carolane, R. 1981. Macrobenthic fauna and sediment data for eight estuaries on the south coast of New South Wales. Technical Memorandum 81/22, CSIRO Institute of Biological Resources, Division of Land Use Research, Canberra, p7. DMEF. 1998. Dredged Material Evaluation Framework-Lower Columbia River Management Area. U.S. Environmental Protection Agency Region 10, U.S. Army Corps of Engineers Northwestern Division (Portland and Seattle District), Washington State Department of Ecology, Oregon Department of Environmental Quality, and Washington State Department of Natural Resources. Ghosh, U., J.W. Talley, and R.G. Luthy. 2001. Particle-scale investigation of PAH desorption kinetics and thermodynamics from sediment. Environ.Sci. Technol. 35:3468–3475. Shelton L.R. and P.D. Capel. 1994. Guidelines for collecting and processing samples of stream bed sediment for analysis of trace elements and organic contaminants for the National Water-Quality Assessment Program. U.S. Geological Survey. Open-File Report 94-458.

CLARIFICATION
RECOMMENDED METHODS FOR MEASURING TOC IN SEDIMENTS
Prepared by Kathryn Bragdon-Cook (Department of Ecology) for the PSDDA agencies.
INTRODUCTION
Current PSEP protocols for measuring total organic carbon (TOC) in sediment call for drying a sediment sample at 70 degrees C in order to minimize the loss of volatile organic compounds. HCl is then added to the dried sample to remove inorganic carbon and dried again at 70 degrees C. The sample is then combusted using cupric oxide fines as a catalyst at 950 degrees C. A preweighed, ascarite-filled tube is used to capture the resulting CO2 upon combustion. The tube is then weighed once more to determine the concentration of CO2 which is used to calculate the TOC in percent dry weight based on total solids in the sample.
Ecology's Technical Information Memorandum, "Organic Carbon Normalization of Sediment Data", recommends Methods 5310A-D, slightly modified, from the 18th Edition of Standard Methods for the Examination of Water and Wastewater (Franson, 1992). These include a wet chemical oxidation method (5310D) and a combustion method (5310B), both using infrared detection (IR). The Department of Ecology Manchester Environmental Laboratory recommends Method 5310B for measuring TOC in wastewater or, with some modification, in sediments. Test Methods for Evaluating Solid Waste (EPA 1986) SW-846 Method 9060 also references Standard Methods for the Examination of Water and Wastewater for measuring TOC levels of solid and hazardous waste.
These methods require some modification for measuring TOC in sediment. Standard Method 5310B calls for the sample to be treated with HCl to convert inorganic carbon to CO2 which is then purged using purified gas. The sample is homogenized and diluted as necessary. A portion is injected with a blunt-tipped syringe into a heated reaction chamber (packed with a catalyst) of a carbon analyzer using infrared detection. Needle size is selected to be consistent with particle size. Some accredited laboratories have adapted this technique to sediment by drying the sample at 70 degrees C and using an instrument attachment to the carbon analyzer designed specifically for sediment samples (Dohrman sludge/sediment boat sampler attachment, Model 183, for use with the Dohrman DC-80 TOC analyzer). The sample is then combusted and organic carbon in the sediment converted to CO2 and transported in carrier gas streams to be measured by an infrared detector.
Method 5310D describes the wet-oxidation method where the sample is acidified and purged as above and oxidized with persulfate in an autoclave from 116 to 130 degrees C. Again, the resultant CO2 is measured by infrared spectrometry. Adaptation of this method to sediments may be problematic. Reagents and analytical techniques may be adjusted by the laboratory, however, to increase oxidation of organic carbon in sediments.
The carbon analyzer/infrared detection used in these methods identifies characteristic spectral fingerprints as light in the infrared spectrum passes through various molecules. This instrument offers greater sensitivity than the ascarite-filled tube collector for measuring low levels of CO2.
PROBLEM IDENTIFICATION
The combustion method dries the sediment sample at 70 degrees C to minimize the loss of organic compounds, but 70 degrees C is not enough to drive off all of the moisture in the sample. A minimum
Page 1 of 3CLARIFICATION
03/28/2002file://Y:\OD_DMMO\5th_arm\toc_93.htm

temperature of 104 degrees C is needed to ensure a truly dry sample for total solids calculations. At 104 degrees C, however, a significant loss of volatile organics occurs.
In addition, the ascarite-filled tube used to detect CO2 in the PSEP method is less sensitive than the infrared detector of the standard methods, limiting accurate detection of low TOC concentrations. Comparative data between the two methods are not yet available.
PSDDA Reports, Development of Sediment Quality Values for Puget Sound, lists the 50%, 75%, and 90% TOC percentile concentrations for Puget Sound at 1.31%, 2.30%, and 4.50% respectively. TOC levels for individual test sites, however, vary greatly with some concentrations well below these averages. Low level detection of TOC in these areas is less accurate using the PSEP method.
Because the Ecology sediment clean up program and PSDDA program may overlap on projects, the need exists for consistency in the method used to measure TOC in sediments.
PROPOSED ACTION/MODIFICATION
Standard Method 5310B and SW-846 Method 9060 provide for more sensitive measurement of TOC concentrations in sediment. SW-846 Method 9060 (as modified by Laucks Laboratories for example) can detect TOC in sediments below 0.1%. Analytical precision for the PSEP method is not given in the protocols. For these reasons, utilization of Method 5310B or SW-846 Method 9060 using infrared detection is strongly recommended. Under conditions described below the PSEP method is acceptable.
Based on the lack of analytical error data for the PSEP method and greater instrument sensitivity of the combustion/IR method, the following guideline is given.
Prior to method selection, consideration should be given to the condition of the test site regarding probable TOC levels. When possible, historical data of particular sites should be reviewed to identify probable TOC concentration ranges.
When TOC concentrations are above 2% either method described could be used. Standard Method 5310B or SW-846 Method 9060 should be used for areas where TOC levels below 2% are likely. PSDDA applicants should state in their sampling and analysis plan which method for measuring TOC in sediment is proposed and provide detailed justification.
To correct for true dry weight with either method, the corresponding total solids analysis should be run twice, once at 70 degrees C and once at 104 degrees C, and the TOC calculation based on dry weight at 104 degrees C.
This document serves as an addendum to Ecology's Technical Information Memorandum (TIM) noted above. An errata sheet to replace page 3 of this TIM can be obtained by calling the Department of Ecology.
REFERENCES
Franson, M.H., ed. 1992. Standard Methods for the Examination of Water and Wastewater. American Public Health Association, American Water Works Assn., and Water Environment Federation, Washington D.C. 18th Edition. pp 5-10 - 5-15.
Laboratory Users Manual. Revised July 1991. Washington Department of Ecology, Manchester
Page 2 of 3CLARIFICATION
03/28/2002file://Y:\OD_DMMO\5th_arm\toc_93.htm
Environmental Laboratory. Edited by Dickey Huntamer and Janet Hyre. pp 203.
Laucks Testing Laboratories, Inc. March 1993. Standard Operating Procedure LX-0049. The Determination of Total Organic Carbon in Soil/Sediment Samples. Prepared by Roger Heather and Mike Nelson. pp 3-16.
Michelsen, Teresa C. Technical Information Memorandum. Dec. 1992. Organic Carbon Normalization of Sediment Data. Washington Department of Ecology, Sediment Management Unit. pp 3.
PSDDA Reports. Sept. 1986. Development of Sediment Quality Values for Puget Sound. Prepared by Tetra Tech Inc. for Puget Sound Dredged Disposal Analysis and Puget Sound Estuary Program. pp 75.
PSEP. 1986. Recommended Protocols for Measuring Conventional Sediment Variables in Puget Sound. Prepared by Tetra Tech Inc. for Puget Sound Estuary Program, U.S. Environmental Protection Agency, Region 10, Office of Puget Sound, Seattle, WA. pp 23-26.
Test Methods for Evaluating Solid Waste. Revised Sept. 1986. Physical/Chemical Methods. Prepared by U.S. Environmental Protection Agency. SW-846. pp 9060 1-4.
Page 3 of 3CLARIFICATION
03/28/2002file://Y:\OD_DMMO\5th_arm\toc_93.htm

CLARIFICATION
MODIFICATIONS TO SAMPLING REQUIREMENTS FOR DEEP NATIVE SEDIMENTS
Prepared by David Fox (Corps of Engineers) for PSDDA agencies.
INTRODUCTION
PSDDA provides guidelines for calculating the number of field samples and laboratory analyses which must be used in the characterization of proposed dredged material. These guidelines are based on the project area ranking and volumes of surface (0-4 feet) and subsurface (>4 feet) material to be dredged.
PROBLEM IDENTIFICATION
Under current PSDDA guidelines, the entire volume of material to be dredged is included in calculating the number of field samples and laboratory analyses required. This includes deep sediments in native soils. The problem is that sampling costs for deep sediments may be appreciably higher than those associated with shallower sediments. In the case of deep native sediments, the potential for chemicals of concern to be present is very low and the additional cost associated with sampling deep sediments seems unjustified. Unnecessary costs associated with PSDDA testing must be controlled to maintain the purpose and viability of the PSDDA process.
PROPOSED CLARIFICATION
At the second PSDDA annual review meeting it was determined that, for native materials, best professional judgment should be applied in determining the number of samples and analyses to be required. When the existence of large volumes of native material could be substantiated through exploratory testing or from site-specific historical dredging records, then testing requirements could be relaxed.
It is proposed that on a case-by-case basis, where deep native sediments exist and can be similarly substantiated, the requirement to sample to the maximum depth of the dredging prism may be relaxed by a collective decision of the PSDDA agencies after applying and documenting best professional judgment considerations.
Page 1 of 1CLARIFICATION
03/28/2002file://Y:\OD_DMMO\3rd_arm\nativ_91.htm

Approach for Establishing a PQL-Based Cleanup Standard, Final: 8/30/12
1
USE OF PRACTICAL QUANTITATION LIMITS (PQLs) TO ESTABLISH CLEANUP STANDARDS FOR CONTAMINATED SEDIMENT SITES UNDER THE SEDIMENT MANAGEMENT STANDARDS (SMS)
SMS ISSUE PAPER
Sediment Management Annual Review Meeting, May 2, 2012 Prepared by Teresa Michelsen and Chance Asher (Washington Department of Ecology, Toxics Cleanup Program) INTRODUCTION This issue paper describes challenges associated with developing cleanup standards based on practical quantitation limits (PQLs), existing rules and guidance, a proposed approach for developing cleanup standards based on PQLs, and analytical considerations for remedial investigations at sediment sites. Human health risk‐based cleanup standards based on the seafood ingestion pathway are frequently below both natural background concentrations as defined in the Model Toxics Control Act (MTCA) Cleanup Regulation (Chapter 173‐340 WAC) and PQLs. This is particularly true for carcinogenic chemicals detected even in nonanthropogenically impacted areas of Puget Sound and other parts of the state, including dioxins/furans, PCB congeners, carcinogenic PAHs, mercury, and arsenic. With increasing emphasis on protection of human health for sediment cleanup, it is likely this will be an issue at the majority of sediment cleanup sites contaminated with bioaccumulative chemicals. The MTCA rule requires that cleanup standards be established at concentrations that are the highest of 1) the risk‐based concentration (this would be the lowest risk based concentration for protection of both ecological and human health), 2) natural background, and 3) the PQL. The Sediment Management Standards (SMS) rule (Chapter 173‐204 WAC) is silent on the use of cleanup standards based on PQLs. Therefore, the MTCA requirements apply because it is the more specific rule on this issue. Under the MTCA rule, the PQL is defined as follows (WAC 173‐340‐200):
… the lowest concentration that can be reliably measured within specified limits of precision, accuracy, representativeness, completeness, and comparability during routine laboratory operating conditions, using department approved methods.
The SMS rule is currently under revision to address the issues of human and ecological risk from bioaccumulatives and how to incorporate natural background concentrations and PQLs when establishing cleanup standards. Supporting guidance is being developed on assessing human health risk and calculating background for sediment cleanup to support these rule revisions. This issue paper provides guidance on using the third element, PQLs, to develop cleanup standards.
Nothing in this guidance is intended to limit the selection of individual laboratories or PQLs during remedial investigations for purposes of analysis, quality assurance, and data interpretation based on site‐specific conditions. The following guidance applies only to the development of cleanup standards based on PQLs. Analytical PQLs used during the RI/FS or for monitoring may differ from the PQL‐based cleanup standards.

Approach for Establishing a PQL-Based Cleanup Standard, Final: 8/30/12
2
PROBLEM STATEMENT The following issues have arisen in using PQLs to develop cleanup standards at sediment sites:
Terminology. Various laboratories, programs, guidance documents, and methods have different terminology for similar concepts. Conversely, the same term may not be used for the same thing in all contexts. Notwithstanding the MTCA rule definition above, this continues to be a challenge when working with PQLs. In general, there is a lower limit at which a chemical may be detected, and a higher limit at which a chemical concentration may be quantified. This higher limit may be termed the PQL or Limit of Quantitation (LOQ). There may also be method‐specified reporting limits (MRLs), which may or may not be similar in concept to a PQL. Finally, these values may be 1) sample‐specific, 2) “typical” values for the method that can be achieved by a specific laboratory, or 3) contract‐required limits such under EPA’s Contract Laboratory Program (CLP). Thus, identifying the specific value closest to that defined by rule can be a challenge.
Selecting PQLs for Use in Establishing Cleanup Standards. Ecology maintains a list of accredited laboratories for each analytical procedure. However, these laboratories may not all have the same PQLs, even if they are all using the same terminology, for a given analyte. Ecology must select among this range of available PQLs in developing a cleanup standard, and that selection may affect 1) the protectiveness of the cleanup standard for that site, and 2) how many laboratories will have PQLs below that standard and thus can participate in future monitoring at that site. Ecology will also consider the capacity and potential cost of the few laboratories that can meet very low PQLs, as well as marketplace impacts, should low PQL‐based standards be selected.
Recency. Analytical methods change over time and PQLs may decline, which affects a number of aspects of the process. First, it is important that Ecology have recent information on PQLs prior to selecting a PQL‐based cleanup standard for a sediment site. Second, because the PQL‐based standard would in this case represent a risk level that is higher than that mandated by rule, the site manager must carefully consider what may happen if the PQL changes in the future and whether there is another alternative that could be chosen. Unlike most other cleanup standards, the permanence of the remedy could ultimately be called into question.
Remedial Investigation Data Reporting. Despite the likely increased use of PQL‐based cleanup standards for sediment sites in the future, Ecology wishes to re‐emphasize its long‐standing policy of requiring all remedial investigation data between the MDL and the PQL to be reported at face value and qualified appropriately. Ecology staff have noticed a recent trend in which many laboratories are reporting all data between the MDL and the PQL as undetected at the PQL. This limits the ability of site managers and contractors to perform needed evaluations of data that are frequently at these very low levels, including comparisons to natural background distributions, calculation of TEQs and human health risk evaluations, chemical fingerprinting, and trend analyses. As we deal more with natural background and human health evaluations for carcinogenic chemicals, concentrations of chemicals at these levels will become increasingly important to decision‐making at sediment sites. Ecology believes that while these concentrations may be qualified and more uncertain than concentrations above the PQL, using the qualified data in these evaluations is preferable to substitution methods with even less statistical validity. In addition, simply knowing whether a

Approach for Establishing a PQL-Based Cleanup Standard, Final: 8/30/12
3
chemical is present at all (at the MDL) is valuable information that is lost when all concentrations are qualified as undetected at the PQL. This may inform us, for example, as to whether a more specialized analytical method is needed in a subsequent round of analyses. All of these uses are considered exploratory and deliberative in nature, as opposed to setting a cleanup standard, which necessitates use of a more accurate, precise, and achievable value such as the PQL.
EXISTING RULES AND GUIDANCE Both the SMS and MTCA rules include provisions for situations where the calculated cleanup levels for protection of human health are below 1) natural background as defined in the MTCA rule or 2) non‐anthropogenically affected background as defined in the SMS rule. Specifically:
The SMS rule states that “…the existing sediment chemical and biological quality shall be identified on an area‐wide basis as determined by the department, and used in place of the sediment quality standards of WAC 173‐204‐320(6).
The MTCA rule specifies that “the cleanup level shall be established at a concentration equal to the practical quantitation limit or natural background concentration, whichever is higher” (WAC 173‐340‐700).
The SMS rule does not currently provide specific requirements or directives for addressing situations where human health risk‐based or background levels are at concentrations that cannot be reliably quantified; therefore, the procedures set forth in MTCA are applicable to sediment sites. The MTCA rule also requires that, where the PQL is used as a cleanup level, it must meet the more stringent of the following conditions (WAC 173‐340‐707(2)(a) and (b)):
The PQL is no greater than ten times the method detection limit (MDL).
The PQL is no greater than that established by the U.S. EPA and used to establish requirements in 40 CFR 136, 40 CFS 141‐143, or 40 CFR 260‐270.
The MTCA rule further requires that sites where the cleanup level was set at the PQL shall undergo periodic reviews, and that the availability of improved analytical techniques should be considered during the periodic review (WAC 173‐340‐707 (4)). APPROACH Ecology intends to take the following approach to identifying, selecting, and applying PQL‐based cleanup standards at sediment cleanup sites under the SMS:
Definitions. The PQL will continue to be defined as in the MTCA rule, which is not currently open for revision. When conducting surveys of laboratories, Ecology will take care to understand the various levels the laboratory may be using and how they relate to the rule definition. In general, Ecology is seeking to identify the lowest level at which each laboratory can reliably quantify the

Approach for Establishing a PQL-Based Cleanup Standard, Final: 8/30/12
4
chemical concentration on a method‐specific basis, as distinguished from either a contract‐required reporting limit or a sample‐specific quantification limit.
Identifying PQLs in Current Use. To identify the commercially available range of PQLs from which PQL based cleanup standards will be derived, Ecology will periodically survey Ecology‐accredited laboratories for a chemical or chemicals of interest. Information on all available analytical methods will be requested. Ecology will specify that method‐specific MDLs and PQLs should be provided that represent what the laboratory can actually and routinely achieve using each method that it runs for that chemical.
Programmatic Approach for Developing PQL‐Based Cleanup Standards. On a program‐wide basis, Ecology will review the available PQLs and identify a representative value from the distribution of PQLs that is reasonably achievable and reliably attainable by most accredited laboratories using appropriate analytical methods. Ecology may choose not to include particularly high PQLs (e.g., that represent EPA CLP contract‐required reporting limits) or particularly low PQLs (e.g., that only a few specialty or research labs can achieve) in the distribution. For chemicals that are identified program‐wide to have high human health or ecological risks at natural background or PQL concentrations, a more sensitive commercially available method may be used to establish the distribution of PQLs. To select a specific PQL‐based cleanup standard, a central tendency value such as a median or mean of the distribution will be used and rounded to one significant digit. For compound classes that are normally reported as TEQs (e.g., dioxins/furans/coplanar PCBs, carcinogenic PAHs), PQL‐based cleanup standards will also be reported as TEQs by applying the appropriate TEFs to the PQLs for individual congeners and summing them. As required by MTCA, this value will be no more than 10 times the MDL and no higher than the EPA CLP. Ecology recognizes that it may not always be possible in practice for the PQL to be 10x the MDL, particularly given the evolving nature of these definitions in the industry. PQL‐based cleanup standards for such chemicals would be developed on a case‐by‐case basis using the latest available science. Ecology will make each chemical‐specific evaluation available through the Sampling and Analysis Plan Appendix or the Sediment Management Annual Review Meeting. In general, analytical PQLs should be reviewed every 3‐5 years to ensure that they are still accurate and that cleanup standards derived from them are still appropriate.
Site‐Specific Approach for Selecting a PQL‐Based Cleanup Standard or a Cleanup Standard below the PQL. PQL‐based cleanup standards, as with other cleanup standards, are selected at the end of the RI process, and do not necessarily reflect the PQLs used during the RI for analytical purposes. Site managers may require site‐specific PQLs during the remedial investigation for the purposes of laboratory selection, data analysis, quality assurance, and data evaluation. Such analytical PQLs may be higher or lower than the PQL‐based cleanup standard, depending on the conceptual site model and other site‐specific considerations. There may be circumstances in which a site manager needs to select a site‐specific PQL‐based cleanup standard that is different from the programmatic PQL‐based standard, for example:
o If a new method or improvement to a method comes into widespread commercial use.
Approach for Establishing a PQL-Based Cleanup Standard, Final: 8/30/12
5
o If the existing programmatic PQL‐based cleanup standard for a chemical is more than 3‐5 years old.
o If a PQL‐based cleanup standard has not been developed for a chemical of concern at the site.
o If the sediment matrix at the site is sufficiently unusual to affect the achievable PQL. o The conditions in WAC 173‐340‐830(2)(e) apply.
In these cases, the programmatic PQL‐based cleanup standards may need to be updated or established and the site manager will work with the program to update the PQL‐based cleanup standard needed for the site using the process above (or a simplified version of it for one or a few chemicals).
In addition, a site manager may wish to set a cleanup standard below the PQL on a site‐specific basis if it would provide greater finality or protectiveness (e.g., based on human health risk, protection of ESA species, or natural background). This can be accomplished in one of two ways:
o Ecology and the liable party may negotiate a cleanup standard between the MDL and the PQL based on natural background or environmental/human health risk.
o A cleanup action may be selected that would achieve any reasonably foreseeable cleanup standard (e.g., dredging to native sediments).
Site managers should carefully consider the implications of selecting a PQL‐based cleanup standard, including the possibility that the PQL may fall over time to below natural background or risk‐based levels. An understanding of how decisions or actions could change if this occurs during the periodic reviews would be important to reach in cooperation with the PLP(s) prior to finalizing the Cleanup Action Plan.
Comparison of Natural Background or Risk‐Based Concentration to PQLs. In determining whether the cleanup standard should be based on PQLs under MTCA/SMS, the site manager will determine whether the risk‐based concentration and/or natural background concentration is below the programmatic PQL. These comparisons will be based on bright‐line values rather than distributions, e.g., the statistic representing natural background that would be selected as the cleanup standard is compared directly to the PQL‐based cleanup standard to determine which is higher.
Remedial Investigation Data Reporting. Ecology will continue to require that all data collected as part of the RI/FS process be reported at face value to the sample‐specific detection limit, appropriately qualified. Data falling between the detection limit and the quantification limit (however defined) may not be U‐qualified.
1
June 20, 2011 Final DMMP CLARIFICATION PAPER Marine Sediment Quality Screening Levels: Adopting RSET Marine SLs for Use in DMMP Prepared by Laura Inouye (Ecology) and David Fox (Corps) INTRODUCTION One purpose of the RSET Sediment Evaluation Framework is to “provide a regionally consistent framework for evaluating the suitability of dredged material for in-water disposal.” However, with publication of the Sediment Evaluation Framework in 2009, the RSET marine SLs for 15 compounds now differ from those used by the DMMP (Table 3). To help maintain a regionally consistent framework, the Dredged Material Management Program (DMMP) is committed to adopting the RSET guidance where possible. However, before adopting the updated SLs, the DMMP agencies needed to review the technical feasibility of the new SLs and the potential impacts to projects in Washington State and the environment. BACKGROUND Apparent Effect Threshold values (AETs) derived in the late 1980s (Barrick et al., 1988) are the basis of numeric guidelines adopted by the Puget Sound Dredged Disposal Analysis (PSDDA) program (PSDDA,1988; 1989) and also numeric sediment quality standards adopted by the State of Washington in the Sediment Management Standards (Ecology 1991). In an effort to keep the regional AETs current, the Department of Ecology (Ecology) incorporated new chemistry and toxicity data into the AET database in 1994 and recalculated dry weight- and organic carbon-normalized AETs (Gries and Waldow, 1996). A regulatory workgroup reviewed the recalculated AETs in a series of workshops in 1996 and 1997 and provided recommendations to the DMMP agencies. The DMMP agencies updated the program’s numeric guidelines using the 1994 amphipod AETs as recommended by the workgroup, but declined to use the echinoderm-based AETs until more work could be done (DMMP, 1997). In 1998, a sediment larval workshop was held in an attempt – among other things – to resolve issues related to the use of the 1994 echinoderm AETs (DMMP, 1998). That same year, Ecology developed AETs based on inhibition of growth in Neanthes arenaceodentata juveniles. However, further work was terminated before technical and policy issues could be resolved (Ecology, 1999). For this and other reasons, the 1994 echinoderm and 1998 Neanthes AETs have not been used to amend the SMS rule or update the DMMP numeric guidelines. Between 2003 and 2005, the Regional Sediment Evaluation Team (RSET) Chemistry subcommittee met to review existing information on freshwater and marine chemistry. In 2009, RSET adopted some of

2
the 1994 AET values – including echinoderm – as screening level guidelines (SLs). The changes focused on revising DMMP SLs that were based on detection limits or where chemicals did not have a defined toxicity threshold. The RSET marine SLs are listed in the final Sediment Evaluation Framework document (RSET, 2009). PROBLEM IDENTIFICATION There are 15 compounds for which RSET and DMMP guidelines differ. The reasons for this divergence fall into two groups: Group 1: Presently on DMMP list but not adopted by RSET Group 1 includes eight compounds for which RSET did not establish SLs due to a lack of correlation between sediment chemistry and toxicity. These compounds were not included in the RSET SL list since they do not have a defined toxicity threshold. Washington State standards had not been established for these compounds for the same reason. These compounds include nickel, 1,3-Dichlorobenzene, hexachloroethane, lindane, and all volatile organics presently on the DMMP chemicals of concern (CoC) list, as shown in Table 1. Table 1. Group 1 compounds.
Chemical DMMP Marine RSET Marine
SL (dry weight) SL (dry weight) Metals (mg/kg) Nickel 140 --- Chlorinated Hydrocarbons (µg/kg) 1,3-Dichlorobenzene 170 --- Volatile Organic Compounds (µg/kg) Trichloroethene 160 --- Tetrachloroethene 57 --- Ethylbenzene 10 --- Total Xylene 40 --- Miscellaneous Extractables (µg/kg) Hexachloroethane 1400 --- Pesticides/PCBs (µg/kg) gamma-BHC (Lindane) 10 ---
To be entirely consistent with RSET, the DMMP would drop all these chemicals from their CoC list. But before dropping these compounds the DMMP agencies need to ensure that exceedances of the DMMP SLs for these compounds in past dredging projects have not been associated with bioassay failures.
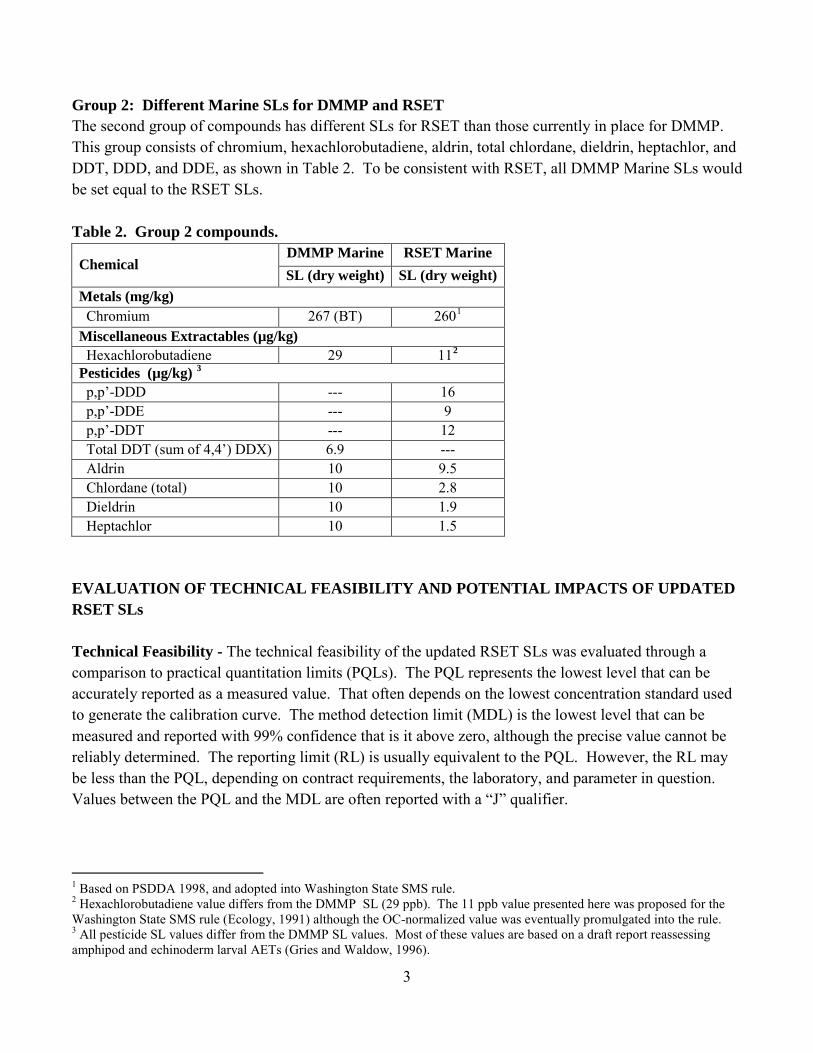
3
Group 2: Different Marine SLs for DMMP and RSET The second group of compounds has different SLs for RSET than those currently in place for DMMP. This group consists of chromium, hexachlorobutadiene, aldrin, total chlordane, dieldrin, heptachlor, and DDT, DDD, and DDE, as shown in Table 2. To be consistent with RSET, all DMMP Marine SLs would be set equal to the RSET SLs. Table 2. Group 2 compounds.
Chemical DMMP Marine RSET Marine SL (dry weight) SL (dry weight)
Metals (mg/kg) Chromium 267 (BT) 2601
Miscellaneous Extractables (µg/kg)
Hexachlorobutadiene 29 112
Pesticides (µg/kg)
3
p,p’-DDD
--- 16 p,p’-DDE --- 9 p,p’-DDT --- 12 Total DDT (sum of 4,4’) DDX) 6.9 --- Aldrin 10 9.5 Chlordane (total) 10 2.8 Dieldrin 10 1.9 Heptachlor 10 1.5
EVALUATION OF TECHNICAL FEASIBILITY AND POTENTIAL IMPACTS OF UPDATED RSET SLs Technical Feasibility - The technical feasibility of the updated RSET SLs was evaluated through a comparison to practical quantitation limits (PQLs). The PQL represents the lowest level that can be accurately reported as a measured value. That often depends on the lowest concentration standard used to generate the calibration curve. The method detection limit (MDL) is the lowest level that can be measured and reported with 99% confidence that is it above zero, although the precise value cannot be reliably determined. The reporting limit (RL) is usually equivalent to the PQL. However, the RL may be less than the PQL, depending on contract requirements, the laboratory, and parameter in question. Values between the PQL and the MDL are often reported with a “J” qualifier.
1 Based on PSDDA 1998, and adopted into Washington State SMS rule. 2 Hexachlorobutadiene value differs from the DMMP SL (29 ppb). The 11 ppb value presented here was proposed for the Washington State SMS rule (Ecology, 1991) although the OC-normalized value was eventually promulgated into the rule. 3 All pesticide SL values differ from the DMMP SL values. Most of these values are based on a draft report reassessing amphipod and echinoderm larval AETs (Gries and Waldow, 1996).

4
Potential Impacts– The DMMP agencies utilized two primary sources of data in the evaluation of potential environmental and project impacts: 1. The Corps’ Dredged Analysis Information System (DAIS) database, which includes data for
approximately 260 projects and 20 disposal site monitoring events; and 2. DMMP suitability determinations for the dredging projects. Evaluations are summarized for each compound or class of compounds below. Analysis of Group 1 Chemicals Nickel: This metal is abundant in crustal material (soils) and is nearly always detected in sediments. However, The DMMP has observed exceedances of the 140 mg/kg SL in only four projects (three of which were in Squalicum Waterway in Bellingham Bay). Three of these projects had at least one dredged material management unit (DMMU) for which nickel was the only SL exceedance. In two of these cases, the DMMP agencies did not require bioassays because the lowest apparent effects threshold (LAET), upon which the SL was based, was not a well-established number (it was listed as > 140 mg/kg). In the third case, bioassays were performed for three DMMUs for which nickel was the only SL exceedance. All three DMMUs passed the guidelines for non-dispersive disposal. One of these DMMUs was found unsuitable for dispersive disposal. Nickel was also found at concentrations above the SL at the Bellingham Bay non-dispersive disposal site in the 1993 monitoring event, but was not shown to be associated with toxicity, as the full suite of bioassays passed. Lindane: This compound has been detected in numerous projects, but only twice above the existing DMMP SL of 10 ug/kg. There was only one DMMU for which Lindane was the only SL exceedance, but bioassays were not run on this DMMU for other reasons. It was also detected at levels exceeding the maximum level (ML) of 31 ug/kg at the Commencement Bay non-dispersive disposal site in the 2003 monitoring event, but was not shown to be associated with toxicity, as the full suite of bioassays passed. 1,3-Dichlorobenzene, hexachloroethane, trichloroethene and tetrachloroethene: These compounds have only been detected in a few projects (three projects for 1,3-dichlorobenzene, trichloroethene, tetrachloroethene; five projects for hexachloroethane). None of these detections have been SL exceedances. There have been no exceedances of the DMMP SL at any of the non-dispersive disposal sites. Ethylbenzene and total xylenes: Ethylbenzene has been detected in 11 projects, four of which had exceedances of the DMMP SL of 10 ug/kg, and one of which exceeded the DMMP ML of 50 ug/kg. Xylenes have been detected in 20 projects, four of which had exceedances of the DMMP SL of 40 ug/kg, and three of which exceeded the DMMP ML of 160 ug/kg. There have been no exceedances of the DMMP SL at any of the non-dispersive disposal sites. Although bioassays were triggered and failures were observed in several projects, in no case was ethylbenzene or total xylenes the only CoC involved. In each case, there were multiple exceedances of other SLs and MLs. Based on this

5
experience, it is highly likely that elevated concentrations of ethylbenzene and total xylenes will be accompanied by SL exceedances for other COCs. These latter SL exceedances will still result in the performance of bioassays, so that dropping ethylbenzene and total xylenes would have no adverse effect on the ability of chemical testing to detect potentially toxic sediments. Analysis of Group 2 Chemicals Chromium: The RSET SL is 260 mg/kg and is the 1988 AET for benthic community effects. This is also the value adopted for the SQS in the Washington State Sediment Management Standards rule (Ecology, 1991). The DMMP agencies did not set an SL for chromium in 1988 but did establish a bioaccumulation trigger (BT) of 267 mg/kg in 2003 (Hoffman, 2003). There are no projects in DAIS that exceed 260 mg/kg. Therefore, adopting the RSET SL and lowering the BT to equal the SL would have had no impact on past projects. Hexachlorobutadiene: The RSET SL is 11 ug/kg and is based on the 1988 AET for benthic community effects (Barrick et al., 1988). The same value was adopted as the SQS (Ecology, 1991). The current DMMP SL of 29 ug/kg is 10% of the highest 1986 AET (HAET) (290 ug/kg; PSDDA, 1988). Hexachlorobutadiene has been detected in five DMMP projects, two of which fell between the RSET and DMMP SLs. Only one of these projects (in the Sitcum Waterway) would have had bioassays triggered by this compound alone. Therefore, adopting the lower SL would have had a relatively small impact regarding the requirement for bioassays. However, half of the projects had reporting-limit exceedances of the RSET SL for this compound. A review of reporting limits for nondetects in DAIS revealed that, while highly variable, the average was 10.99 ug/kg. The Department of Ecology’s Sampling and Analysis Plan Appendix (SAPA; Ecology, 2008) recommends a practical quantitation limit (PQL) of 11 ug/kg. With improving analytical capabilities, the lower SL should be achievable. Aldrin: The RSET SL is 9.5 ug/kg and is based on both the amphipod and echinoderm AET values recalculated in 1994. This is compared to the DMMP SL of 10 ug/kg based on detection limits that were achievable in the late 1980s. Aldrin has been detected in multiple projects, but only three times between 9.5 and 10 ug/kg. Those cases were all accompanied by other SL exceedances, so that reducing the SL would have had no effect on the number of bioassays required. The Ecology SAPA (2008) recommended a PQL of 1.7 ug/kg, so analytical capabilities should be sufficient for the lower SL. Total chlordane: The RSET SL is 2.8 ug/kg and is set by the 1994 AET for amphipod mortality. This is compared to the DMMP SL of 10 ug/kg. The DMMP SL was set by detection limits at the time the PSDDA SLs were adopted. Chlordane is in reality a mix of chemicals, and has been reported in many ways over the years – as total chlordane, technical chlordane, alpha-chlordane, and simply as “chlordane”. In 2007, DMMP defined “total chlordane” programmatically as the sum of cis-chlordane (aka alpha-chlordane), trans-chlordane, cis-nonachlor, trans-nonachlor and oxychlordane. These compounds have been detected in numerous projects, with 19 projects having detected concentrations

6
falling between the RSET and DMMP SLs. In seven of these projects, chlordane alone would have triggered bioassays for one or more DMMUs, but all but one of these projects already had bioassays run for other DMMUs, so that bioassay testing for these projects would not have been triggered by chlordane alone. A single project, located in the Duwamish Waterway, would have had bioassays triggered solely by this class of compounds (i.e., there were no exceedances of any other SLs for any of the DMMUs). The balance of the 19 projects had DMMUs with multiple exceedances of SLs for other compounds - in addition to chlordane - that would have triggered bioassays within the DMMUs. Although there have been 51 projects - some recent - with reporting limits above the RSET SL, the Ecology SAPA (2008) recommended a PQL of 1.7 ug/kg for chlordane, so analytical capabilities should be sufficient for the lower SL. Dieldrin and heptachlor: The RSET SLs for dieldrin and heptachlor are 1.9 ug/kg and 1.5 ug/kg respectively, and both were set by 1994 AETs – the echinoderm AET for dieldrin and the amphipod AET for heptachlor. This is compared to the DMMP SL of 10 ug/kg for both compounds. The DMMP SLs were set by detection limits at the time the PSDDA SLs were adopted. Dieldrin has been detected in multiple projects, with 18 projects (64 DMMUs) having detected exceedances between the RSET and DMMP SLs. In six of these projects, dieldrin alone would have triggered bioassays for one or more DMMUs, but each of these projects already had bioassays run for other DMMUs, so that bioassay testing for these projects would not have been triggered by dieldrin alone. A single project, located in Grays Harbor, would have had bioassays triggered solely by this compound (i.e., there were no exceedances of any other SLs for any of the DMMUs). The balance of the 18 projects had DMMUs with one or more exceedance of SLs for other compounds. Heptachlor has been detected in multiple projects, with ten projects (24 DMMUs) having detected exceedances between the RSET and DMMP SLs. In two of these projects, heptachlor alone would have triggered bioassays for a single DMMU, but each of these projects already had bioassays run for other DMMUs, so that bioassay testing for these projects would not have been triggered by heptachlor alone. A single project, located in Lake Washington, would have had bioassays triggered solely by this compound (i.e., there were no exceedances of any other SLs for any of the DMMUs). The balance of the ten projects had DMMUs with one or more exceedance of SLs for other compounds. For both dieldrin and heptachlor, the Ecology SAPA- recommended PQL is higher than the RSET SL (dieldrin PQL is 2.3 ug/kg; heptachlor PQL is 1.7 ug/kg). Given PQLs that are only slightly higher than the SLs, and the fact that reporting limits may be lower than the PQLs, laboratories should be able to generate “J” flagged data at or below the SL. However, for dieldrin, there have been 118 projects with reporting limits above 1.9 ug/kg, and for heptachlor, there have been 53 projects with reporting limits above 1.5 ug/kg, many of these being recent projects. Based on this data, the RSET SLs appear to be beyond what has been historically achieved by analytical laboratories.

7
DDT, DDD, and DDE: While DMMP has an SL of 6.9 ug/kg for the summed p,p’-DDX compounds (aka “total DDT”), RSET has a separate SL for each of the p,p’-DDX constituents. RSET’s SLs are 16 ug/kg for DDD, 9 ug/kg for DDE, and 12 ug/kg for DDT. The SLs for DDD and DDE are based on the 1988 AET for benthic community effects. The RSET SL for DDT is based on the 1994 AET for echinoderm abnormality. Given that the individual RSET SLs are all greater than the DMMP SL for the summed constituents, there would be no economic or analytical project impact from the adoption of the RSET SLs. Evaluation of potential environmental impacts showed that of 196 DMMUs where the DMMP SL for total DDT was exceeded, there were only six DMMUs where a) Total DDT was the only SL exceedance; b) bioassays would not also have been triggered by exceedances of the RSET DDX SLs; and c) the bioassays failed. All of these were in high-ranked areas, and no single DMMU exceeded 4,000 cy. In three of the six cases, there were other, more plausible, explanations for the bioassay failures (e.g. high ammonia/sulfides, QA issues). In addition, further evaluation of the DAIS data provided evidence that DDT may not be toxic at levels as low as the existing DMMP SL. There were 42 DMMUs for which a) the SL for total DDT was exceeded; b) bioassays would not also have been triggered by exceedances of the RSET DDX SLs; c) there was one or more SL exceedance for other CoCs; and d) the bioassays still passed. The DAIS data, therefore, appear to corroborate the RSET re-evaluation of the AETs and provide a strong argument for eliminating the DMMP SL of 6.9 ug/kg for total DDT.
PROPOSED ACTION/MODIFICATION
The DMMP agencies propose accepting all the RSET SLs, with minor caveats. Our evaluation determined that the environmental risk and economic impact of this action is low, and the technological challenges manageable. Nickel, lindane, 1,3-dichlorobenzene, hexachloroethane, total DDT, and the volatile compounds trichloroethene, tetrachloroethene, ethylbenzene, and total xylenes, will be dropped from the standard DMMP CoC list. Dropping the volatiles (trichloroethene, tetrachloroethene, ethylbenzene and xylenes) from the standard list of chemicals of concern would eliminate an entire analytical group, thereby simplifying field sampling and reducing testing costs. Because volatiles have never been the sole trigger for bioassay testing in the 23-year history of DMMP, the risk of otherwise suitable dredged material containing unacceptable levels of volatiles appears to be small. All compounds whose SLs are being dropped will continue to be monitored at the disposal sites.
8
The RSET SLs for chromium, hexachlorobutadiene, aldrin, total chlordane, dieldrin, heptachlor, DDT, DDD, and DDE, will be adopted. Project proponents and laboratories should be aware that the Ecology-recommended PQLs will need to be met or surpassed for hexachlorobutadiene, total chlordane, dieldrin and heptachlor in order to avoid SL exceedances. It is recognized that it will take time for some laboratories to accomplish this. Therefore, best professional judgment (BPJ) will be applied by the DMMP agencies during dredging year 2012 when sample-specific reporting limits are above the SLs for any of these four chemicals. The ability of laboratories to meet the revised SLs will be reviewed prior to the 2012 SMARM. Further need for BPJ beyond the 2012 SMARM will be evaluated at that time. Bioaccumulation Triggers (BTs) will continue to exist for chromium and total DDT. The chromium BT will be changed to 260 mg/kg to match the new SL. The existing BT for total DDT (the sum of 4,4'-DDD, 4,4'-DDE and 4,4'-DDT) will remain unchanged at 50 ug/kg.
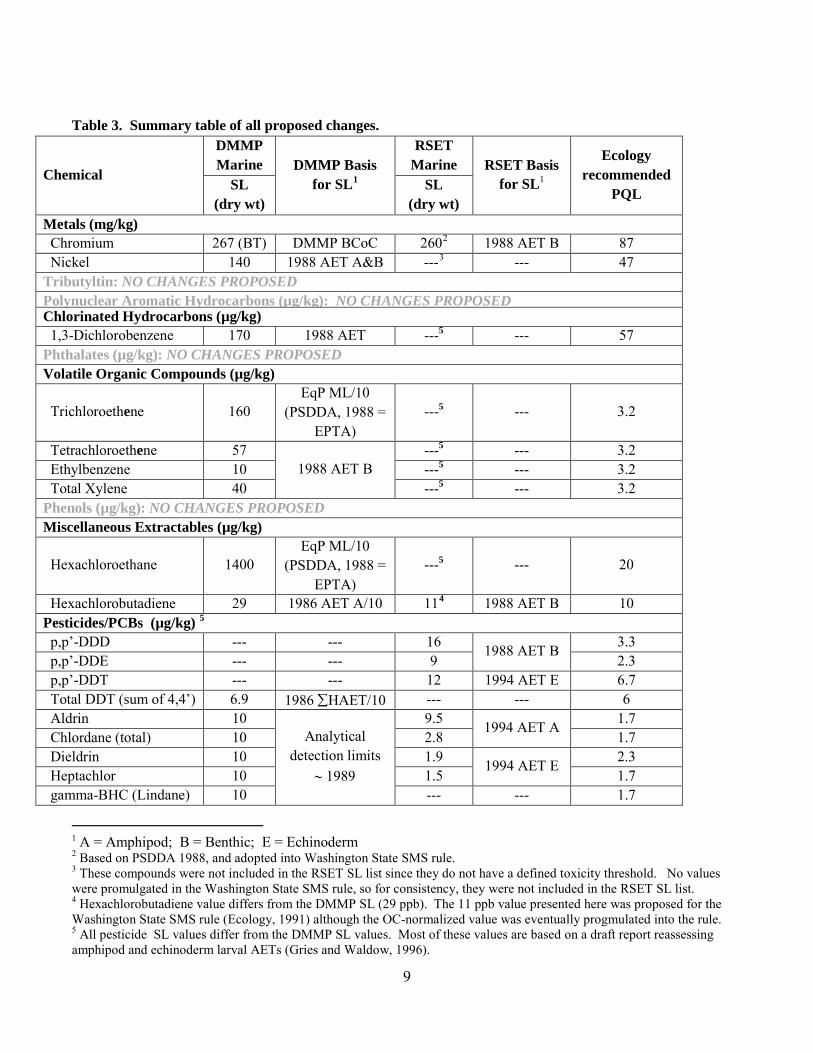
9
Table 3. Summary table of all proposed changes.
Chemical
DMMP Marine DMMP Basis
for SL1
RSET Marine
RSET Basis
for SL1
Ecology recommended
PQL SL (dry wt)
SL (dry wt)
Metals (mg/kg) Chromium 267 (BT) DMMP BCoC 2602 1988 AET B 87 Nickel 140 1988 AET A&B ---3 --- 47 Tributyltin: NO CHANGES PROPOSED Polynuclear Aromatic Hydrocarbons (µg/kg): NO CHANGES PROPOSED Chlorinated Hydrocarbons (µg/kg) 1,3-Dichlorobenzene 170 1988 AET
---5 --- 57
Phthalates (µg/kg): NO CHANGES PROPOSED Volatile Organic Compounds (µg/kg)
Trichloroethene 160 EqP ML/10
(PSDDA, 1988 = EPTA)
---5 --- 3.2
Tetrachloroethene 57 1988 AET B
---5 --- 3.2 Ethylbenzene 10 ---5 --- 3.2 Total Xylene 40 ---5 --- 3.2 Phenols (µg/kg): NO CHANGES PROPOSED Miscellaneous Extractables (µg/kg)
Hexachloroethane 1400 EqP ML/10
(PSDDA, 1988 = EPTA)
---5 --- 20
Hexachlorobutadiene 29 1986 AET A/10 114 1988 AET B 10 Pesticides/PCBs (µg/kg) 5
p,p’-DDD
--- --- 16 1988 AET B 3.3 p,p’-DDE --- --- 9 2.3 p,p’-DDT --- --- 12 1994 AET E 6.7 Total DDT (sum of 4,4’) 6.9 1986 ∑HAET/10 --- --- 6 Aldrin 10
Analytical detection limits
∼ 1989
9.5 1994 AET A 1.7 Chlordane (total) 10 2.8 1.7 Dieldrin 10 1.9 1994 AET E 2.3 Heptachlor 10 1.5 1.7 gamma-BHC (Lindane) 10 --- --- 1.7
1 A = Amphipod; B = Benthic; E = Echinoderm 2 Based on PSDDA 1988, and adopted into Washington State SMS rule. 3 These compounds were not included in the RSET SL list since they do not have a defined toxicity threshold. No values were promulgated in the Washington State SMS rule, so for consistency, they were not included in the RSET SL list. 4 Hexachlorobutadiene value differs from the DMMP SL (29 ppb). The 11 ppb value presented here was proposed for the Washington State SMS rule (Ecology, 1991) although the OC-normalized value was eventually progmulated into the rule. 5 All pesticide SL values differ from the DMMP SL values. Most of these values are based on a draft report reassessing amphipod and echinoderm larval AETs (Gries and Waldow, 1996).
10
REFERENCES Barrick, R., S. Becker, L. Brown, H. Beller, and R. Pastorok, 1988. Sediment Quality Values Refinement, Volume I. 1988 Update and Evaluation of Puget Sound AET. Prepared for the U.S. Environmental Protection Agency, Region 10, Office of Puget Sound, Seattle, Washington. 66 pages + appendices. DMMP, 1996. Minutes to the 1996 Sediment Management Annual Review Meeting (SMARM). Apparent Effects Thresholds. Presented on behalf of the DMM P agencies on May 8, 1996 by Tom Gries. DMMP, 1997. Revisions to DMMP Screening and Maximum Level Guidelines. An Issue Paper prepared for the DMMP agencies by Tom Gries, Department of Ecology. DMMP, 1998. Minutes to the 1998 Sediment Management Annual Review Meeting (SMARM). Update on Regulatory Work Group Recommendations on AETs. Presented on behalf of the DMMP agencies on May 13, 1998 by Tom Gries. Ecology. 1991, revised 1995. Sediment Management Standards http://apps.leg.wa.gov/WAC/default.aspx?cite=173-204 Ecology, 1999. Letter on decision not to proceed with Sediment Management Standards rule revisions. http://www.ecy.wa.gov/programs/tcp/smu/sed_update-sms.htm Ecology. 2008. Sediment Sampling and Analysis Plan Appendix. Ecology Publication No. 03-09-043. http://www.ecy.wa.gov/biblio/0309043.html Gries, T. and K. Waldow, 1996. Progress Re-evaluating Puget Sound Apparent Effects Thresholds, Volume I: 1994 Amphipod and Echinoderm Larval AETs . Draft report. Hoffman, E. 2003. Revisions to the Bioaccumulative Contaminants of Concern (BCOC) List. DMMP Issue paper. ttp://www.nws.usace.army.mil/PublicMenu/documents/DMMO/BCOC.pdf PSDDA. 1988. Puget Sound Dredged Disposal Analysis: Evaluation Procedures Technical Appendix, Phase I. (EPTA) U.S. Army Corps of Engineers - Seattle District, U.S. Environmental Protection Agency - Region 10, Washington State Department of Natural Resources, Washington State Department of Ecology. PSDDA. 1989. Puget Sound Dredged Disposal Analysis: Management Plan Report – Unconfined Open-Water Disposal of Dredged Material, Phase II. (MPR-II) U.S. Army Corps of Engineers - Seattle

11
District, U.S. Environmental Protection Agency - Region 10, Washington State Department of Natural Resources, Washington State Department of Ecology. RSET, 2009. Sediment Evaluation Framework (SEF) for the Pacific Northwest.http://www.nwp.usace.army.mil/docs/d_sediment/references/final_SEF_May_2009.pdf SAIC. 1993. Partial Monitoring in Bellingham Bay. Draft report. July 1993. Submitted to the Washington State Department of Natural Resources, Olympia, WA. Submitted by Science Applications International Corporation, Bothell, WA.
ACKNOWLEDGEMENTS
Special thanks to Lauran Warner (Corps) for her excellent editorial assistance, and to Tom Gries (Ecology) for providing information on the history of the AETs.

Page 1 of 5
Dredged Material Management Program New Interim Guidelines for Dioxins
December 6, 2010
OVERVIEW
The Dredged Material Management Program (DMMP) Agencies have completed a three-year process to develop guidelines for dioxin in dredged material that are consistent with Washington State’s Sediment Quality Standards. These guidelines are intended for application when evaluating dredged materials proposed for disposal in unconfined, open-water sites in Puget Sound.
After an initial series of public meetings and extensive sampling throughout the main basin of Puget Sound, the DMMP agencies proposed updated guidelines at the Sediment Management Annual Review Meeting (SMARM) in 2009. Significant public comment was received on the proposed guidelines at the 2009 SMARM. In response, open technical workshops were held in May and June 2009, and additional input was received at those meetings from a full range of stakeholder interests.
The DMMP agencies deliberated on the input received at the SMARM 2009 and subsequent workshops, and revised the proposed guidelines based on that input. The revised guidelines were released for public review prior to the 2010 SMARM. Again, significant public comment was received following the 2010 SMARM. The DMMP agencies made minor modifications to the guidelines based on the input received. The DMMP agency directors approved the new interim guidelines on September 15, 2010 and established an implementation date of December 6, 2010. The new interim guidelines represent a continuation of the DMMP’s systematic approach to periodically updating sediment evaluation guidance. The new interim guidelines are meant to accomplish the following objectives:
• to reduce bioaccumulative risk to human and ecological receptors from dioxin;
• to insure that sediment dioxin concentrations at disposal sites reflect non-urban background in order to be consistent with the narrative human health requirements in the Washington State Sediment Management Standards;
• to incorporate recently-updated information on Puget Sound sediment dioxin background
The new interim guidelines are described below. Note that these guidelines remain “interim”, as dioxin policies will continue to be refined in concert with the development of guidelines for other bioaccumulatives, especially dioxin-like PCBs.

Page 2 of 5
UPDATED DIOXIN TESTING REQUIREMENTS
Testing for dioxins will continue to be required on a case-by-case basis in areas where there is reason to suspect presence of these chemicals. Factors which can trigger a “reason-to-believe” determination include the following:
• Location within an urban bay and having no historical information showing that dioxin is below interim guidelines.
• Proximity to current or historical point sources, such as outfalls
• Proximity to chlor-oxide bleach process pulp mills, chlor-alkali or chlorinated solvent manufacturing plants, former wood treatment sites, phenoxy herbicide manufacture and/or use and handling areas
• Proximity to areas with high polychlorinated biphenyl (PCB) concentrations
• Proximity to former hog fuel burners/boilers and areas with previous fires or incineration sources
• Proximity to areas previously sampled that showed elevated levels of dioxin
Dioxin testing will be required for all projects meeting one or more of the reason-to-believe factors described above. Deeper underlying sediments, which are confirmed as “native,” may be exempt from testing. Native material within the dredge prism, and lying directly under sediment that is being tested for dioxins, should be archived for possible dioxin analysis.
These updated guidelines are consistent with the reason-to-believe requirements implemented in the last several years. Guidance for sampling density per project will remain unchanged.
In addition, in order to address uncertainties regarding the fate of sediments disposed at dispersive sites, the DMMP agencies may require dioxin testing for projects proposing disposal at dispersive sites. Specifically, for those projects for which dioxin testing would not normally be required under the reason-to-believe guidelines, the DMMP agencies may require dioxin analysis of a reduced number of sediment samples. The decision to conduct this testing will be based on the size of the project and the grain-size characteristics of the dredged material. DMMP agencies are planning to conduct a fate and transport study for disposal operations at the Port Townsend and Rosario Strait disposal sites. Depending on the outcome of this study, the expanded dioxin testing requirement may be retained or dropped.
UPDATED DIOXIN GUIDANCE FOR DISPERSIVE DISPOSAL SITES IN PUGET SOUND
For dispersive disposal sites, the revised guidelines include definitions of both a Dispersive Disposal Site Management Objective and a Dispersive Dredged Material Suitability Guideline.
Dispersive Site Management Objective: 4 pptr (parts per trillion, dry-weight) 2,3,7,8-tetrachloro-p-dibenzodioxin toxicity-equivalents (TEQ) will be defined as the Site Management Objective for all dispersive disposal sites in Puget Sound. This value is based on an upper bound estimate of the distribution of dioxin in sediments from non-urban areas of Puget Sound 1
1 Specifically, 4 pptr is the nonparametric estimation of the 90% upper confidence limit for the 90th percentile of the distribution of the background Puget Sound Main Basin data set, rounded up to the nearest whole digit.
.

Page 3 of 5
Dispersive Dredged Material Suitability Guideline: The Dredged Material Suitability Guideline is the maximum dioxin concentration allowed in any single Dredged Material Management Unit (DMMU). For dispersive sites, this guideline is set equal to the Dispersive Site Management Objective of 4 pptr TEQ. Other dioxin concentrations can be approved on a case-by-case basis, if demonstrated to be consistent with the anti-degradation provisions in the Sediment Management Standards (SMS) rule2
This Dispersive Dredged Material Suitability Guideline is consistent with previous background-based requirements for dioxin at dispersive sites, but has been updated based on recently acquired data.
.
UPDATED DIOXIN GUIDANCE FOR NON-DISPERSIVE DISPOSAL SITES IN PUGET SOUND
For non-dispersive disposal sites, the revised guidelines include definitions of both a Non-dispersive Disposal Site Management Objective and Non-dispersive Dredged Material Suitability Guidelines.
Non-dispersive Disposal Site Management Objective: Four pptr TEQ will be the objective for surface sediments within the boundary of a disposal site, to be achieved over time as the updated suitability guidelines are implemented. This objective will aid in case-by-case decision-making (see next paragraph) on the suitability of material for disposal and assure protection of human and ecological health. This objective is also based on an upper bound estimate of the distribution of dioxin in sediments from non-urban areas of Puget Sound3. Disposal site monitoring will provide the feedback necessary to determine whether the site management objective is being met.
Non-dispersive Dredged Material Suitability Guidelines:
(1) Nondispersive Screening Levels. DMMUs with dioxin concentrations below 10 pptr TEQ will be allowed for open-water disposal as long as the volume-weighted average concentration of dioxins in material from the entire dredging project does not exceed the Disposal Site Management Objective of 4 pptr TEQ.
Proposed revised suitability guidelines will be used in a case-by-case decision-making approach that is consistent with the narrative human health standard in the SMS rule. The following Non-dispersive Screening Levels represent sediment concentrations of dioxin which the agencies believe can be safely disposed at non-dispersive, open-water sites. A project-specific evaluation would be necessary to allow disposal of material with higher levels. It is anticipated that this evaluation process will produce information and experience that will support the future adoption of specific suitability criteria by rule. The suitability guidelines will have three components:
(2) Case-by-Case Determinations: As has been the case throughout the history of the DMMP program, case-by-case determinations may be made based on consideration of the individual aspects of dredging projects. Case-by-case decisions to allow disposal of material not meeting the screening levels may be made by the DMMP Agencies based on the overall goal of meeting the Non-dispersive Disposal Site Management Objective. Case-by-case considerations will include the following: (a) material placement sequencing;
2 Case-by-case determinations will require the dredging proponent to submit a high level of supporting data on a regional scale to be reviewed by DMMP Agencies.
3 Specifically, 4 pptr is the nonparametric estimation of the 90% upper confidence limit for the 90th percentile of the distribution of the background Puget Sound Main Basin data set, rounded up to the nearest whole digit.

Page 4 of 5
(b) consideration of the possible cumulative effects of other bioaccumulative compounds within the project sediments; and (c) the frequency of disposal site use.
(3) Small Business Considerations for Nondispersive Sites: Public or Private enterprises defined as “Small Businesses” by Chapter 19.85 RCW4
BIOACCUMULATION TEST OPTION
, which are permit applicants for projects with total dredged volume less than 4,000 cubic yards, will be encouraged to submit applications for case-by-case consideration as long as all DMMU concentrations are less than 10 pptr TEQ dioxin. These projects may not be required to meet the volume-weighted average guideline if DMMP review determines that the Disposal Site Management Objective of 4 pptr will likely be met on an annual average basis, based on knowledge of other anticipated use of the identified disposal site. To clearly define what constitutes a project of less than 4,000 cubic yards, there are two key qualifiers. First, intentional partitioning of a dredging project to reduce or avoid testing requirements is not acceptable. Second, recognizing that multiple small discharges can cumulatively affect the disposal site, project volumes are defined in as large a context as possible. One example of this latter qualifier is recurring maintenance dredging of a small marina where "project volume" will be the projected dredging volume over 5 years. Another example is multiple-project dredging contracts where a single dredging contractor conducts dredging for several projects under a single contract or contract effort. Again, the "project volume" will be summed across all projects (as will any sampling and compositing efforts prior to testing).
When the sediment dioxin concentration in a dredging unit exceeds the 10 pptr TEQ screening level and the dredging unit is found unacceptable for non-dispersive disposal under case-by-case decision-making, the dredging proponent will have the option of pursuing bioaccumulation testing to determine whether or not individual DMMUs could qualify for open-water disposal. This option will be based on a modified version of the Tier III testing procedures included in the existing DMMP Users Manual.
A target tissue level (TTL) to be used in the bioaccumulation evaluation has not been determined for dioxins at this time. In the absence of a TTL, the dredging proponent who selects the option of bioaccumulation testing will be required to include exposure of test organisms to a suitable reference sediment as part of the bioaccumulation test. Concentrations in the project test-sediment tissue would be compared against concentrations in the reference-sediment tissue to determine the bioavailability of sediment dioxin and, thereby, the suitability of dredged material for open water disposal. Over time, a tissue database will be developed, which may allow for the adjustment of this protocol.
INCREASED MONITORING OF DISPOSAL SITES TO TRACK IMPACT OF UPDATED GUIDELINES
The effect of the updated dioxin interim guidelines on sediment quality at the non-dispersive open water disposal sites in Puget Sound will be monitored to provide information for adaptive programmatic management of the sites to meet Site Management Objectives.
4 In Chapter 19.85 RCW "Small business" means any business entity, including a sole proprietorship, corporation, partnership, or other legal entity, that is owned and operated independently from all other businesses, and that has fifty or fewer employees.
Page 5 of 5
The agencies plan to increase the number of on-site sediment monitoring samples collected at each non-dispersive disposal site from 3 to 10 to allow statistical comparisons to be made with Main Basin/Reference Area dioxin concentrations. If the disposal site management objective for sediment of 4 pptr TEQ is not met, results of bioaccumulation testing of on-site sediments may be evaluated to determine whether overall site management objectives are being met. Otherwise, the site monitoring program will be very similar to the current program. The DMMP anticipates that monitoring frequency will be increased (if resources are available) to assist with the adaptive management of dioxins at the disposal sites.
DISCLAIMER Although the underlying regulations referenced and described in this guidance document contain legally binding requirements, this guidance document does not substitute for those provisions or regulations, nor is it a regulation itself. In the event of a conflict between the discussion in this document and any statute or regulation, this document would not be controlling. Thus, it does not impose legally binding requirements on the DMMP agencies or the regulated community, and might not apply to a particular situation based upon the circumstances. The word "should" as used in the Guidance is intended solely to recommend or suggest, in contrast to "must" or "shall" which are used when restating regulatory requirements. While the guidance document indicates the DMMP agencies’ anticipated approach to assure effective implementation of legal requirements, the preferential analytical framework is flexible, decisions made utilizing this framework are made on a project-specific basis through the application of best professional judgment, the framework encompasses alternative evaluation processes that may be applied at the election of the proponent, and DMMP agencies’ decision-makers retain the discretion to adopt approaches on a case-by-case basis that differ from the guidance where appropriate. Any decisions regarding a particular project will be made based on the statute and regulations. Interested parties are free to raise questions and objections about the analytical approach reflected in the guidance and the appropriateness of the application of the guidance to a particular situation. The guidance is a living document and may be revised periodically through the SMARM process. The document will be revised, as necessary, to reflect any relevant future regulatory amendments. The DMMP agencies welcome public comments on the document at any time and will consider those comments in any future revision of the guidance document.
REVISED SUPPLEMENTAL INFORMATION ON POLYCHLORINATED DIOXINS AND FURANS (PCDD/F) FOR USE IN PREPARING A QUALITY ASSURANCE PROJECT PLAN (QAPP)
November 8, 2010 1.0 INTRODUCTION AND BACKGROUND This document contains supplemental information to assist applicants in preparing a QAPP for projects when PCDD/F in sediment is of concern. A QAPP provides guidance and information for the laboratory that is to conduct the analysis of samples.1
The information presented in this document supplements the Dredged Material Management Program (DMMP) guidance on preparing sampling and analysis plans. Its purpose is to assure that all PCDD/F data collected are of sufficient quality and are comparable throughout the program.
Under the DMMP, dredging project proponents are required to conduct analysis of PCDD/F in sediment when there is a reason to believe that anthropogenic sources may be present. The reason to believe includes information about nearby current or historical PCDD/F sources, such as chlor-oxide bleach process pulp mills, chlor-alkali or chlorinated solvent manufacturing plants, phenoxy herbicide use and handling, former wood treatment sites, or areas with high PCB concentrations. PCDD/F comprise a family of toxic chemicals that have a similar chemical structure and a common mechanism of toxic action. PCDDs and PCDFs are not usually intended chemical products, but are trace-level byproducts of many forms of combustion and several industrial chemical processes. PCDD/F are widely distributed throughout the environment, are persistent and bioaccumulative. These chemicals have been characterized by EPA as “class B2,” or probable human carcinogens, and are thus considered to increase the risk of cancer. At body burdens ten times or less above those attributed to average background exposure, adverse non-cancer health effects have been observed in both animals and humans. In animals, these effects include changes in hormonal systems, alterations in fetal development, reduced reproductive capacity, and immunosuppression (EPA 2003). There are 75 PCDD and 135 PCDF congeners, compounds distinguished by the number and position of their chlorine atoms. These can be grouped as homologs, or congener classes, compounds which have the same number of chlorine atoms per molecule. Homologs can be abbreviated as follows, with the number of chlorines shown in parentheses. Dioxins: TCDD (4), PeCDD (5), HxCDD (6), HpCDD (7), and OCDD (8). Furans: TCDF (4), PeCDF (5), HxCDF (6), HpCDF (7), and OCDF (8). 2
1 The dredging program has retained the prior terminology of Sampling and Analysis Plan / Quality Assurance Project Plan; this is what is used here. EPA consolidated both of these plans into a document also called a QAPP (e.g., “G5 Guidance “at http://www.epa.gov/Region10/offices/oea/epaqag5.pdf). 2 Homologs are molecules with the same chemical formula but different structural configuration. These designations are mainly relevant here because labs will report sums of, for example, all HxCDD.

November 8, 2010
Page 2
PCDD/F are bioaccumulative compounds, although the toxicity of the various congeners varies considerably. The 17 congeners that have chlorine atoms located in the 2,3,7,8 positions (e.g., 2,3,7,8-TCDD or 1,2,3,7,8-PeCDF) are the dioxins of known concern for health effects in fish, wildlife, and humans. Of these, 2,3,7,8-TCDD is considered the most toxic and is used as a benchmark (Toxic Equivalency Factor (TEF) of 1.0) for estimating the toxicity of the other dioxins. WHO (2005, published 2006) updated the toxicities for the 17 PCDD/F congeners. Table 1 summarizes the latest update of TEFs. The Toxicity Equivalence (TEQ) is calculated by multiplying the TEF by the concentration of the compound, and summing the results (as shown in Table 5). The resulting TEQ may be useful for risk assessment purposes. Data are typically reported to DMMP using the mammalian TEF. Table 1. Summary of WHO 2005 Mammalian Toxicity Equivalency Factors for PCDD/F and the Van den Berg et al. 1998 - Fish and Avian Toxicity Equivalence Factors
TEF-M TEF-F TEF-W
Dioxins and Furans Mammals, Humans
Fish Birds
PCDD
2,3,7,8-TCDD 1 1 1
1,2,3,7,8-PeCDD 1 1 1
1,2,3,4,7,8-HxCDD 0.1 0.5 0.05
1,2,3,6,7,8-HxCDD 0.1 0.01 0.01
S1,2,3,7,8,9-HxCDD 0.1 0.01 0.1
1,2,3,4,6,7,8-HpCDD 0.01 0.001 <0.0001
OCDD 0.0003 <0.0001 0.0001
PCDF
2,3,7,8-TCDF 0.1 0.05 1
1,2,3,7,8-PeCDF 0.03 0.05 0.1
2,3,4,7,8-PeCDF 0.3 0.5 1
1,2,3,4,7,8-HxCDF 0.1 0.1 0.1
1,2,3,6,7,8-HxCDF 0.1 0.1 0.1
1,2,3,7,8,9-HxCDF 0.1 0.1 0.1
2,3,4,6,7,8-HxCDF 0.1 0.1 0.1
1,2,3,4,6,7,8-HpCDF 0.01 0.01 0.01
1,2,3,6,7,8,9-HpCDF 0.01 0.01 0.01
OCDF 0.0003 <0.0001 0.0001

November 8, 2010
Page 3
2.0 SEDIMENT SAMPLING AND ANALYSIS In the field, sediment samples should be placed in wide-mouth glass jars with sufficient headspace to prevent breakage during freezing of the sample, placed into coolers with ice, and maintained at 4°C + 2°C until delivery to the laboratory. Sediment samples should be maintained in the dark while in transport and once in the laboratory. At the laboratory, the samples should be frozen at -18°C until extraction. Frozen samples may be held for one year prior to extraction. After one year, results may still be reported, but they will be qualified as estimates unless the DMMP agrees that this qualifier is not necessary. Analysis of extracted sediments must be completed within 30 days of extraction (EPA 2005). However, if the sediment extracts are frozen, they must be analyzed within one year (EPA 1994). 3.0 ANALYTICAL METHODOLOGY Because of the difficulty identifying PCDD/PCDF congeners at low concentrations and the significant possibility of interfering compounds (such as diphenyl ether) causing the reporting of artificially elevated values, it is important that a highly specific and sensitive method be employed for the analysis of PCDD/PCDF congeners. EPA Method 1613B, a High-Resolution Gas Chromatographic/High Resolution Mass Spectrophotometric method, is the most commonly used method for DMMP projects. Method 1613B incorporates 13C12-labelled reference compounds for each 2,3,7,8-substituted congener, providing unique reference standards for identification and quantification. EPA Method 8290 can provide the same traceability as 1613B with the addition of labeled compounds to cover all 17 congeners of interest. In reality, the actual methodology used by many labs is a hybrid of these two methods. The analytical technology and methodology have evolved since methods 1613B and 8290 were written. Both methods, as written, have deficiencies and should not be followed verbatim. Rather, data quality objectives need to be specified for the analytical laboratory to meet. In the remainder of this paper QA guidelines for method 1613B are referenced due to its predominant use. If other methods are used, appropriate QA guidelines will need to be documented in the SAP. It is critical for reporting limits to be sufficiently low when analyzing dredged material for dioxin. Target reporting limits for DMMP projects are presented in Table 2.

November 8, 2010
Page 4
Table 2. Summary of Target Reporting Limits for PCDD/F
Dioxins and Furans Reporting Limit
(ng/kg Dry Wt)
PCDD
2,3,7,8-TCDD 1.0
1,2,3,7,8-PeCDD 1.0
1,2,3,4,7,8-HxCDD 2.5
1,2,3,6,7,8-HxCDD 2.5
1,2,3,7,8,9-HxCDD 2.5
1,2,3,4,6,7,8-HpCDD 2.5
OCDD 5.0
PCDF
2,3,7,8-TCDF 1.0
1,2,3,7,8-PeCDF 2.5
2,3,4,7,8-PeCDF 1.0
1,2,3,4,7,8-HxCDF 2.5
1,2,3,6,7,8-HxCDF 2.5
1,2,3,7,8,9-HxCDF 2.5
2,3,4,6,7,8-HxCDF 2.5
1,2,3,4,6,7,8-HpCDF 2.5
1,2,3,6,7,8,9-HpCDF 2.5
OCDF 5.0

November 8, 2010
Page 5
4.0 METHOD QUALITY CONTROL The DMMP agencies are recommending QC performance criteria rather than providing a step-by-step protocol for extraction and cleanup. Such criteria are needed to verify that extraction and cleanup are being performed correctly. The QC performance criteria must be presented in the sampling and analysis plan and approved by the DMMP agencies. Laboratories will be required to meet these performance criteria as well as take the specified corrective action if performance criteria are not met. Example criteria and corrective actions are provided in Tables 3 and 4. All projects will be required to analyze a sediment reference material such as NIST SRM#1944 with each analytical batch. Acceptance criteria for the reference material results (based on the 95% confidence interval) must be provided by the laboratory and included in the sampling and analysis plan. If results fall outside the acceptance range, the laboratory may be required to reanalyze. A laboratory duplicate must also be analyzed with each analytical batch.
In addition to the project-specific QC requirements presented in the sampling and analysis plan, the laboratory shall implement all quality control procedures discussed in Method 1613B and meet all associated performance criteria. The laboratory shall provide identification of sources and lot numbers for all reference materials and analytical standards to be used to perform analyses. Copies of certificates for certified reference materials and analytical standards shall be provided the DMMP with the laboratory results. In addition, the raw data associated with the analysis of dioxins shall be made available to the DMMP agencies upon their request. 5.0 VALIDATION OF DATA
It is strongly recommended that all TCDD/F data be subjected to Stage 4 validation (EPA, 2009). Because of the complexity of Method 1613B, the extremely low reporting limits, and the high potential for interfering compounds such as chloro diphenyl ethers, it is in the best interest of the project proponent to conduct this validation. Validation must be performed in accordance with EPA National Functional Guidelines for Chlorinated Dioxin/Furan Data Review (EPA 2005). The validator must have demonstrated experience accomplishing validation for PCDD/F. Details related to validation, including the name of the validator or validation subcontractor, must be included in the sampling and analysis plan. If the project proponent should decide not to do the validation up front, the DMMP agencies will review the primary results against the Method 1613B acceptance limits and those in the project QAPP. Based on the results of this review, the DMMP agencies may require validation. Should the DMMP require validation, the project proponent must provide it, using the validation specifications provided in the previous paragraph.

November 8, 2010
Page 6
6.0 REPORTING OF DATA
The laboratory shall report each of the 2,3,7,8-chlorine substituted PCDD/F congeners on a dry-weight basis. Method detection limits, estimated detection limits and reporting limits shall be reported for each of these congeners. The 17 congeners of interest shall be tabulated as TEQ, both with nondetected values (U) = ½ estimated detection limit and with U = 0. (The difference between these values gives data reviewers an idea of how much the estimated detection limit substitution affects the TEQ summation.) Table 5 presents the specified mammalian TEFs for each of the 17 congeners and provides an example of the calculations necessary to derive the TEQ. For the purpose of TEQ summation, estimated maximum potential concentrations (EMPCs) shall be reported as nondetects (U) at the EMPC value. Details regarding estimated detection limits are provided in Attachment 1. This summary of QC requirements is not all-inclusive of method 1613B requirements. Other method-required QC checks, criteria and corrective actions can be found in the EPA National Functional Guidelines for Chlorinated Dioxin/Furan Data review (EPA, 2005) and must be followed unless preempted by the following.
Table 3. Summary of Quality Control Procedures QC Check Minimum Frequency Acceptance Criteria Laboratory Corrective Action*
Ongoing Precision And Recovery
1 per analytical batch (< 20 samples)
Recovery within acceptance criteria in Table 4 of this QAPP guidance document
1. Check calculations 2. Reanalyze batch
Stable-isotope-labeled compounds
Spiked into each sample for every target analyte
Recovery within limits in Table 4
1. Check calculations 2. Qualify all associated results as estimated
Ion abundance ratios must be within criteria in Table 9 of method 1613B
1. Reanalyze specific samples. 2. Reject all affected results outside the criteria 3. Alternatively, use of secondary ions that meet appropriate theoretical criteria is allowed if interferences are suspect. This alternative must be approved by the DMMP agencies.
Laboratory duplicate 5% or 1 per batch (< 20 samples)
Relative percent Difference < 30%
1. Evaluation of the homogenization procedure and evaluation method 2. Reanalyze batch

November 8, 2010
Page 7
Method blank 1 per analytical batch (< 20 samples)
Detection < minimum level in Table 2 of Method 1613B
1. If the method blank results are greater than the reporting limit, halt analysis and find source of contamination; reanalyze batch. 2. Report project samples as non-detected for results < to the reported method blank values
GC/MS Tune At the beginning of each 12 hour shift. Must start and end each analytical sequence.
>10,000 resolving power @ m/z304.9825 Exact mass of 380.9760 within 5 ppm of theoretical value.
1. Re-analyze affected samples 2. Reject all data not meeting method 1613B requirements
Initial Calibration Initially and when continuing calibration fails.
Five point curve for all analytes. RSD must meet Table 4 requirements for all target compounds and labeled compounds. Signal to noise ratio (S/N) >10. Ion abundance (IA) ratios within method specified limits.
Window Defining/Column Performance Mix
Before every initial and continuing calibration.
Valley <25% for all peaks near 2378-TCDD/F peaks.
Continuing Calibration Must start and end each analytical sequence.
%D must meet Table 4 limits for target compounds & labeled compounds. S/N >10. IA ratios within method specified limits.
Confirmation of 2,3,7,8- TCDF
For all primary-column detections of 2,3,7,8-TCDF
Confirmation presence of 2,3,7,8-TCDF in accordance with method 1613B requirements
Failure to verify presence of 2,3,7,8-TCDF by second column confirmation requires qualification of associated 2,3,7,8-TCDF results as non-detected at the associated value.
Sample data not achieving target reporting limits or method performance in presence of possibly interfering compounds
Not applicable Not applicable Rather than simply dilute an extract to reduce interferences, the lab should perform additional cleanup techniques identified in the method to insure minimal matrix effects and background interference. Thereafter, dilution may occur. If re-analysis is required, the laboratory shall report both initial and re-analysis results.

November 8, 2010
Page 8
Sediment Reference Material
One per analytical batch
Result must be within 20% of the 95% confidence interval
1. Extraction and analysis should be evaluated by the lab and re-analysis performed of the entire sample batch once performance criteria can be met. 2. If analysis accompanies several batches with acceptable RM results, then the laboratory can narrate possible reason for RM outliers.
* If re-analysis is required, the laboratory shall report initial and re-analysis results

November 8, 2010
Page 9
Table 4. QC Acceptance Criteria for PCDD/F
(Table shown with permission from AXYS Analytical Services LTD (2005), Vancouver, British Columbia, Canada. Analysis of Polychlorinated Dioxins and Furans by Method 1613B -- MSU-018 Rev. 5, 07-Jun-2005)
Test Conc., ng/mL1
IPR2 OPR3 (%)
I-CAL4 %
CAL/VER5 (%)
(Coeff. of Variation)
Labeled Cmpd %Rec. in Sample
RSD (%) Recovery Warning Limit Control Limit
Native Compound 2,3,7,8-TCDD 10 28 83-129 70-130 20 78-129 - -
2,3,7,8-TCDF 10 20 87-137 75-130 20 84-120 - -
1,2,3,7,8-PeCDD 50 15 76-132 70-130 20 78-130 - -
1,2,3,7,8-PeCDF 50 15 86-124 80-130 20 82-120 - -
2,3,4,7,8-PeCDF 50 17 72-150 70-130 20 82-122 - -
1,2,3,4,7,8-HxCDD 50 19 78-152 70-130 20 78-128 - -
1,2,3,6,7,8-HxCDD 50 15 84-124 76-130 20 78-128 - -
1,2,3,7,8,9-HXCDD 50 22 74-142 70-130 35 82-122 - -
1,2,3,4,7,8-HxCDF 50 17 82-108 72-130 20 90-112 - -
1,2,3,6,7,8-HxCDF 50 13 92-120 84-130 20 88-114 - -
1,2,3,7,8,9-HxCDF 50 13 84-122 78-130 20 90-112 - -
2,3,4,6,7,8-HxCDF 50 15 74-158 70-130 20 88-114 - -
1,2,3,4,6,7,8-HpCDD 50 15 76-130 70-130 20 86-116 - -
1,2,3,4,6,7,8-HpCDF 50 13 90-112 82-122 20 90-110 - -
1,2,3,4,7,8,9-HpCDF 50 16 86-126 78-130 20 86-116 - -
OCDD 100 19 86-126 78-130 20 79-126 - -
OCDF 100 27 74-146 70-130 35 70-130 - -
Labelled Compounds 13C12-2,3,7,8-TCDD 100 37 28-134 25-130 35 82-121 40-120 25-130
13C12-2,3,7,8-TCDF 100 35 31-113 25-130 35 71-130 40-120 24-130
13C12-1,2,3,7,8-PeCDD 100 39 27-184 25-150 35 70-130 40-120 25-130
13C12-1,2,3,7,8-PeCDF 100 34 27-156 25-130 35 76-130 40-120 24-130
13C12-2,3,4,7,8-PeCDF 100 38 16-279 25-130 35 77-130 40-120 21-130
13C12-1,2,3,4,7,8-HxCDD 100 41 29-147 25-130 35 85-117 40-120 32-130
13C12-1,2,3,6,7,8-HxCDD 100 38 34-122 25-130 35 85-118 40-120 28-130
13C12-1,2,3,4,7,8-HxCDF 100 43 27-152 25-130 35 76-130 40-120 26-130
13C12-1,2,3,6,7,8-HxCDF 100 35 30-122 25-130 35 70-130 40-120 26-123
13C12-1,2,3,7,8,9-HxCDF 100 40 24-157 25-130 35 74-130 40-120 29-130
13C12-2,3,4,6,7,8-HxCDF 100 37 29-136 25-130 35 73-130 40-120 28-130
13C12-1,2,3,4,6,7,8-HpCDD 100 35 34-129 25-130 35 72-130 40-120 23-130
13C12-1,2,3,4,6,7,8-HpCDF 100 41 32-110 25-130 35 78-129 40-120 28-130
13C12-1,2,3,4,7,8,9-HpCDF 100 40 28-141 25-130 35 77-129 40-120 26-130
13C12-OCDD 200 48 20-138 25-130 35 70-130 25-120 17-130
Cleanup Standard 37Cl4-2,3,7,8-TCDD 10 36 39-154 31-130 35 79-127 40-120 35-130

November 8, 2010
Page 10
1 QC acceptance criteria for IPR, OPR, and samples based on a 20 µL extract final volume
2 IPR: Initial Precision and Recovery demonstration
3 OPR: Ongoing Precision and Recovery test run with every batch of samples.
4 Initial Calibration 5 CAL/VER: Calibration Verification test run at least every 12 hours
Table 5. Example Results of Dioxin/Furan TEQ Calculation
Analyte TEF (WHO
2005)
Sample C-1 Conc.
ng/kg-dw LQ1 TEQ
U=1/2 EDL TEQ U=0
2,3,7,8-TCDD 1 0.1 U 0.05 0 1,2,3,7,8-PeCDD 1 0.4 0.4 0.4 1,2,3,4,7,8-HxCDD 0.1 0.4 0.04 0.04 1,2,3,6,7,8-HxCDD 0.1 2.4 0.24 0.24 1,2,3,7,8,9-HxCDD 0.1 1.3 0.13 0.13 1,2,3,4,6,7,8-HpCDD 0.01 39.3 0.393 0.393 OCDD 0.0003 253 0.0759 0.0759 2,3,7,8-TCDF 0.1 0.7 0.07 0.07 1,2,3,7,8-PeCDF 0.03 0.224 0.00672 0.00672 2,3,4,7,8-PeCDF 0.3 0.305 U 0.0458 0 1,2,3,4,7,8-HxCDF 0.1 0.433 0.0433 0.0433 1,2,3,6,7,8-HxCDF 0.1 0.294 U 0.0147 0 2,3,4,6,7,8-HxCDF 0.1 0.321 0.0321 0.0321 1,2,3,7,8,9-HxCDF 0.1 0.087 U 0.00435 0 1,2,3,4,6,7,8-HpCDF 0.01 6.61 0.0661 0.0661 1,2,3,4,7,8,9-HpCDF 0.01 0.409 0.00409 0.00409 OCDF 0.0003 15.1 0.00453 0.00453
Total TEQ: 1.62 1.50
1Laboratory Qualifiers U: Analyte was not detected at or above the reported result.

November 8, 2010
Page 11
References EPA 2009. Guidance for Labeling Externally Validated Laboratory Analytical Data for Superfund use. http://www.epa.gov/superfund/policy/pdfs/EPA-540-R-08-005.pdf EPA 2005. Contract Laboratory Program National Functional Guidelines for Chlorinated Dioxin/Furan Data Review. EPA-540-R-05-001. September, 2005. http://www.epa.gov/superfund/programs/clp/download/dlm/dlm2nfg.pdf EPA 2003. National Academy of Sciences Review Draft of Exposure and Human Health Reassessment of 2,3,7,8-Tetrachlorodibenzo-p-Dioxin (TCDD) and Related Compounds. http://www.epa.gov/ncea/pdfs/dioxin/nas-review/ EPA/USACE 1998. Evaluation of Dredged Material Proposed for Discharge in Waters of the U.S. – Testing Manual (Inland testing Manual). EPA Number 823B98004. http://www.epa.gov/waterscience/itm/ITM/ EPA 1995. QA/QC Guidance for Sampling and Analysis of Sediments, Water, and Tissues for Dredged Material Evaluations - Chemical Evaluations. EPA Number 823B95001. http://yosemite.epa.gov/water/owrccatalog.nsf/e673c95b11602f2385256ae1007279fe/fa5420ee832b630485256b0600724b38!OpenDocument EPA 1994. Method 1613: Tetra- Through Octa- Chlorinated Dioxins and Furans by Isotope Dilution HRGC/HRMS. Revision B. EPA Number 823B95001. http://www.epa.gov/waterscience/methods/1613.html NIST 2010 (online). SRM 1944 – New York/New Jersey Waterway Sediment; from National Institute of Standards and Technology. https://www-s.nist.gov/srmors/view_detail.cfm?srm=1944
Van den Berg, Martin et al. 1998. Toxic Equivalency Factors (TEFs) for PCBs, PCDDs, PCDFs for Humans and Wildlife. Environmental Health Perspectives Volume 106, Number 12, December 1998. World Health Organization (WHO) 2005. Re-evaluation of Human and Mammalian Toxic Equivalency Factors for Dioxins and Dioxin-like Compounds. ToxSci Advance Access published online July 7, 2006. http://www.who.int/ipcs/assessment/tef_update/en/

November 8, 2010 Final DMMP CLARIFICATION PAPER POLYCHLORINATED DIOXINS AND FURANS (PCDD/F): REVISIONS TO THE SUPPLEMENTAL QUALITY ASSURANCE PROJECT PLAN (SQAPP) Prepared by: Erika Hoffman (U.S. Environmental Protection Agency) and David Fox (U.S. Army Corps of Engineers). INTRODUCTION AND BACKGROUND In 2007, the DMMP agencies presented a clarification paper (DMMP, 2007a) and supplemental QAPP (DMMP, 2007b) discussing procedures for collection and analysis of PCDD/F data. In the past 3 years, the program has gained significant experience reviewing PCDD/F data, both from dredging projects and from the 2008 OSV BOLD Survey of Puget Sound. In addition, a public issue paper was presented at the 2009 SMARM (EcoChem, 2009), recommending changes to the 2007 guidance. Based on DMMP experience and input received at the 2009 SMARM, the agencies are implementing minor revisions to the procedures for analyzing PCDD/F to assure that the highest quality of data are being generated for suitability determinations. CLARIFICATION The following revisions are being implemented for the PCDD/F Supplemental QAPP:
• All projects will be required to analyze a sediment reference material such as NIST SRM#1944 with each analytical batch. Acceptance criteria for the reference material results (based on the 95% confidence interval) must be included in the sampling and analysis plan. If results fall outside the acceptance range, the laboratory may be required to reanalyze.
• It is strongly recommended that dioxin raw data be subjected to Stage 4 validation (EPA, 2009). Because of the complexity of dioxin analysis, the extremely low reporting limits, and the high potential for interfering compounds such as chloro diphenyl ethers, it is in the best interest of the project proponent to conduct this validation. The Corps of Engineers Seattle District validates all of its PCDD/F testing results for federal navigation dredging at this highest level.
As with other DMMP example plans, the SQAPP will need to be made project-specific by the project proponent (or its consultant). Deviations from procedures in the SQAPP will be considered by the DMMP agencies on a project-specific basis.

References DMMP, 2007a. Polychlorinated Dioxins and Furans (PCDD/F): Clarification of Procedures for Acquiring Sediment Data. DMMP, 2007b. Supplemental Information on Polychlorinated Dioxins and Furans (PCDD/F) for use in Preparing a Quality Assurance Project Plan (QAPP). EcoChem, 2009. Dioxin Data – Clarification of SRM Analysis and Validation Requirements. Presented at the 2009 Sediment Management Annual Review Meeting. EPA, 2009. Guidance for Labeling Externally Validated Laboratory Analytical Data for Superfund Use.

6/16/08 Final
DMMP STATUS REPORT UPDATE ON PYRETHROID AND PBDE ANALYSIS Prepared by Stephanie Stirling (U. S. Army Corps of Engineers) and the RSET Chemical Analyte Subcommittee for the DMMP agencies. The Regional Sediment Evaluation Framework Chemical Analyte Subcommittee is tasked with reviewing chemicals for potential listing as chemicals of concern for the regional Sediment Evaluation Framework. As part of that effort, the Subcommittee reviewed information on both pyrethroids and PBDEs and prepared white papers that document their findings. For pyrethroids the committee concluded that:
“The USGS found no evidence of permethrin (the most common pyrethroid) in comprehensive water monitoring programs conducted in the Willamette and Yakima watersheds, nor any record of significant agricultural applications of pyrethroids. While the use of these insecticides has grown in California, and toxicity to amphipods has been observed shortly after application and very close to the site of application (i.e. in small ditches and creeks dominated by irrigation return flows), similar conditions have not been shown to be prevalent in larger water courses. We therefore recommend continued monitoring of pyrethoids in regional monitoring programs, such as the USGS NAWQA program. Monitoring of pyrethroids in bed sediments of major waterways should be included. At this time, sufficient evidence does not exist to nominate pyrethroids for inclusion in the RSET program as “chemicals of special concern”.
For PBDEs, the subcommittee concluded:
Although we are concerned about the potential effects of PBDEs on biota, we are hesitant to recommend them as contaminants of special occurrence at this time because of the lack of a standardized analytical method for sediments and uncertainties about their effects on benthic organisms. We recommend that RSET participants should agree upon a standardized method for analysis of PBDEs, and that these chemicals should be incorporated into existing regional monitoring programs as funding allows to improve our knowledge base on their distribution and concentrations in regional sediments.”
The DMMP agencies are providing this information as part of the SMARM process to make stakeholders aware of the on-going consideration of new chemicals of concern.

6/16/08 Final
RSET Chemical Analyte Subcommittee Members: Todd Thornburg, Anchor Environmental (Chair) Teresa Michelsen, Avocet Consulting Sandy Lemlich, USACE Russ Heaton, USACE Phil Fishella, USACE Lyndal Johnson, NMFS Fu-shin Lee, Ecology Jennifer Sutter, Oregon DEQ Greg Salata, Columbia Analytical Services Sue Dunnihoo, ARI Roger McGinnis, Hart Crowser Kathy Kreps, TestAmerica Taku Fuji, Kennedy/Jenks Jeremy Buck, USFWS

6/16/08 Final
RSET WHITE PAPER #33 – Evaluation of Pyrethroids in Sediments
CHEMICAL ANALYTE SUBCOMMITTEE, T. Thornburg, Chair ([email protected]) August 24, 2007 QUESTION/ISSUE: Are significant sources of pyrethroids present in the Pacific Northwest? Are pyrethroids accumulating in sediments at potentially toxic levels? Should pyrethroids be listed as “chemicals of special occurrence”? Discussion: This Issue Paper provides a review of agricultural/commercial usage, environmental occurrence, chemical properties and toxicity of pyrethroids. This analysis is used to help prioritize the need for further study of these chemicals. Because EPA recently phased out certain uses of organophosphorus pesticides due to their potential to cause toxicity in humans, especially children, some of these uses are being replaced by a class of insecticides called pyrethroids. Pyrethroids are synthetic derivatives of pyrethrins which are natural insecticides produced by certain species of chrysanthemum. Pyrethroids are neurotoxins which target insects’ central nervous system (Oros and Werner 2005). Pyrethroids are primiarly used for agricultural applications on orchards and row crops, structural pest control (to control ants and termites), and residential applications (pet products and lawn care). Much of the recent research on the environmental effects of pyrethroids has occurred in California, in particular the Central Valley which is characterized by both intensive agricultural practices (the Central Valley produces more than half of the fruits, vegetables, and nuts grown in the U.S.) and rapid urban growth, both of which have encouraged increased pyrethroid usage in the last ten to fifteen years. The differences in land uses, cropping practices, climate, and other factors must therefore be considered when evaluating the applicability of these data to the Pacific Northwest. Chemicals of Interest: According to the California Department of Pesticide Regulation, the following pyrethroids received the highest applications in California in 2002 (in total pounds applied, including all applications) in decreasing order of importance (Zalom et al. 2005):
• Permethrin (41%) • Cypermethrin (33%) • Lambda-cyhalothrin (6%) • Cyfluthrin (6%) • Bifenthrin (5%) • Fenpropathrin (4%) • Esfenvalerate (3%) • Deltamethrin (1%)
In particular, permethrin and cypermethrin accounted for about three-quarters of the total pyrethroid applications in California, at 41 percent and 33 percent of the total, respectively.

6/16/08 Final
Methods of Analysis: There are no regulatory approved methods for analysis of pyrethroids. EPA draft Method 1660 uses an HPLC method with MDLs of 1 to 2 ppb in water. It is generally recognized that these detection limits are insufficient to provide environmentally relevant data. The USGS, California Department of Food and Agriculture, and Caltest Analytical Lab in Napa generally follow a GC/MS-SIM procedure (modified EPA Method 8270) with MDLs of 1 to 5 ppt in water and 1 to 5 ppb in sediment. GC/ECD methods can provide similar levels of detection. Use of high-resolution GC/MS methods (HRGC/HRMS) can provide MDLs of 0.01 to 1 ppt in water (when coupled with high-volume sampling techniques) and 0.1 to 1 ppb in sediment (Woudneh and Oros 2006). None of the regional analytical laboratories surveyed are presently set up for pyrethroid analysis. Pyrethroid analysis would therefore require internal method development, identification of a supplier and acquisition of laboratory standards, possibly new instrumentation, etc., and surcharges would be incurred by customers to cover some of these development costs. Preliminary cost estimates for GC/MS-SIM would likely be in the $300 to $500 range, and HRGC/HRMS in the $800 to $1,300 range. Environmental Sources, Occurrence, and Fate: Contaminant Sources. USGS studies conducted under the National Water Quality Assessment Program (NAWQA) provide excellent summaries of estimated pesticide use and application data in both western and eastern climates in the Pacific Northwest. In particular, NAWQA studies of the Willamette River watershed (Anderson et al. 1997) and Yakima River watershed (Ebbert and Embrey 2002) provide pesticide monitoring data representing large agricultural valleys and urban developments on the west side and east side of the Cascades, respectively. These NAWQA studies evaluated usage rates and environmental occurrence of 86 different pesticides, including the most commonly used pyrethroid – permethrin. Pesticide application data in these watersheds was estimated on the basis of university publications (Oregon State University and Washington State University), statistics compiled by state and federal Departments of Agriculture, discussions with agricultural extension agents, and user/supplier surveys. Nonagricultural applications, such as construction, commercial, and residential uses, were not well quantified but the effects of these sources were nevertheless captured in runoff monitoring from urban areas (see below). In the late 1990s, no agricultural applications of permethrin were reported in either the Willamette Basin or the Yakima Basin. Insecticide applications continued to be dominated by organophosphorus compounds (chloropyrifos, diazinon, malathion, azinphos-methyl) and to a lesser extent other compounds (e.g. carbaryl, propargite) in the Pacific Northwest. This is in marked contrast with California practices, where pyrethroid usage peaked in the mid- to late-1990s and remains significant up to the present (Amweg 2005). Environmental Occurrence (Water). The USGS conducted a comprehensive monitoring program for permethrin, an index pyrethroid, as well as numerous other pesticides in their

6/16/08 Final
NAWQA studies of the Willamette River and Yakima River basins (Anderson et al. 1997; Ebbert and Embrey 2002). Although 36 different pesticides were detected in the Willamette basin, and 25 different pesticides were detected in the Yakima basin, permethrin was not detected in any samples from either basin at a detection limit of 0.005 µg/L. The detection frequencies were 0/94 and 0/98, respectively. The monitoring locations were targeted toward potential source areas, such as agricultural streams dominated by irrigation return flows (both basins), small urban streams (Willamette), and wastewater treatment plant discharges (Yakima). These results are consistent with the lack of reported agricultural pyrethroid applications in these basins. Environmental Occurrence (Sediment). Sediment testing for pyrethroids is not available in the Pacific Northwest. Pesticide monitoring of sediments in the Central Valley of California provides the closest analogy. The California studies indicate pyrethroids are retained very close to their agricultural or urban source areas and are generally not mobilized into larger water courses. Concentrations are highest shortly after peak application periods and dissipate seasonally. In 2002 and 2003, about 80 sediment samples were collected from small water bodies in the Central Valley comprised primarily of irrigation return flows, including tailwater ponds, irrigation canals, and small agricultural creeks. Many of the locations were specifically targeted toward areas of historically high pyrethroid use (Weston et al. 2004). In these areas, pyrethroids were detected in 75 percent of the samples. Permethrin was detected most frequently (66% of samples) with a median concentration of 2 µg/kg and maximum concentration of 130 µg/kg in an irrigation canal. Concentrations were greatest shortly after application during the peak summer months. Roughly one quarter of the samples in these agricultural source areas exhibited toxicity to the amphipod Hyalella azteca, a species particularly sensitive to pyrethroids. On the other hand, the few samples collected from major rivers showed low or undetectable pyrethroid concentrations which could not account for toxicity occasionally observed in the larger water courses. Weston et al. (2005) characterized sediments in small urban drainages in a suburb of Sacramento (Roseville) which experienced rapid population growth and expansive new construction on former open grassland. The primary source of water in these drainages was runoff from over-irrigation of landscapes and lawns. Pyrethroid concentrations as high as several hundred parts per billion were observed, affecting survival of H. azteca in localized areas near storm drain inputs. However, the main creek in the development—measuring 2 to 3 feet deep and 6 to 12 feet wide—remained largely unaffected. In the main creek, pyrethroid concentrations had decreased by one to two orders of magnitude (many below detection) and little toxicity was observed, indicating minimal transport of pyrethroids beyond the immediate influence of residential irrigation runoff. Toxicity. Aquatic and sediment toxicity data are summarized in Table 1. Solomon et al. (2001) performed a distributional analysis of aquatic toxicity data to identify the lower tenth percentile LC50 values as defined by the most sensitive laboratory test species. Aquatic invertebrates, including crustaceans (e.g. amphipods) and insects, are generally the most sensitive species; fish are not quite as sensitive (typically by one or more orders of magnitude); and molluscs are

6/16/08 Final
relatively insensitive (Oros and Werner 2005). Amweg et al. (2005) used spiked sediment bioassays to develop median lethal concentrations (LC50) and growth lowest observable effects concentrations (LOEC) for pyrethroids based on 10-day H. azteca tests (Table 1). Toxicity data from Weston et al. (2004) suggest H. azteca is more sensitive to pyrethroid toxicity than Chironomus tentans. Table 1. Chemical Properties and Toxicity Data for Pyrethroids
Relative Usage[1] Koc[2]
Soil Aerobic
Half Life[2]
Soil Anaerobic Half Life[2]
Water Aerobic
Half Life[2]
Water LC50[3]
Sediment LC50[4]
Sediment LOEC[4]
(%) (L/kg) (days) (days) (days) (ng/L) (µg/kg) (µg/kg)
Permethrin 41% 277,000 40 197 -- 76 90 59 Cypermethrin 33% 310,000 28 55 7 10 -- -- Cyfluthrin 6% 124,000 12 34 -- 12 14 7.5 Lambda-Cyhalothrin 6% 326,000 43 -- 22 10 5.6 2.2 Bifenthrin 5% 237,000 96 425 -- 15 4.5 2.9 Fenpropathrin 4% -- 22 276 -- -- -- -- Esfenvalerate 3% -- 39 90 72 37 24 9.4 Deltamethrin 1% 704,000 24 29 80 9 9.9 10.2 Notes: [1] California State-Wide Usage 2002, as reported in Zalom et al. 2005 [2] Laskowski 2002 [3] Solomon et al. 2001, 10th percentile value of species distribution [4] Amweg et al. 2005, 10-day spiked-sediment bioassay, H. azteca
Chemical Properties. Pyrethroids are hydrophobic, with organic-carbon partitioning coefficients (Koc values) ranging from 124,000 to 704,000 L/kg (see Table 1; Laskowski 2002). Thus, pyrethroids will partition strongly to sediments and will tend to be transported primarily with suspended sediments rather than in solution. Although pyrethroids are hydrophobic and thus lipophilic and fat soluble, they are easily degraded and are not known to be stored in the body nor excreted in milk. They have multiple sites in their structures that can be readily attacked in biological systems (Oregon State University 2006). Depuration is rapid and bioaccumulation through the food web is not a significant route of exposure (Oros and Werner 2005). Environmental Persistence. Degradation half lives for pyrethroids in water range from a several days to several weeks (Laskowski 2002; Table 1). Degradation half lives in aerobic sediments are typically a few weeks to a few months, and half lives in anaerobic sediments range from a few months to approximately one year. Based on these rates, significant degradation is likely to occur between one application season and the next. These rates are similar to those of other modern pesticides which also degrade relatively quickly in the environment, especially compared to legacy pesticides such as DDT and chlordane which can persist for decades.

6/16/08 Final
CONCLUSION AND RECOMMENDATION: The USGS found no evidence of permethrin (the most common pyrethroid) in comprehensive water monitoring programs conducted in the Willamette and Yakima watersheds, nor any record of significant agricultural applications of pyrethroids. While the use of these insecticides has grown in California, and toxicity to amphipods has been observed shortly after application and very close to the site of application (i.e. in small ditches and creeks dominated by irrigation return flows), similar conditions have not been shown to be prevalent in larger water courses. We therefore recommend continued monitoring of pyrethoids in regional monitoring programs, such as the USGS NAWQA program. Monitoring of pyrethroids in bed sediments of major waterways should be included. At this time, sufficient evidence does not exist to nominate pyrethroids for inclusion in the RSET program as “chemicals of special concern”. REFERENCES: Amweg, E.L., D.P. Weston, N.M. Ureda, 2005, Use and toxicity of pyrethroid pesticides in the Central Valley, California. Environ. Toxicol. Chem. v. 24, p. 966-972. Anderson, C.W., T.M. Wood, and J.L. Morace, 1997, Distribution of dissolved pesticides and other water quality constituents in small streams, and their relation to land use in the Willamette River Basin, Oregon, 1996. USGS Water-Resources Investigations Report 97-4268, Portland, OR.
Ebbert, J.C. and S.S. Embrey, 2002, Pesticides in surface water of the Yakima River Basin, Washington, 1999-2000—their occurrence and an assessment of factors affecting concentrations and loads. USGS Water-Resources Investigations Report 01-4211, Portland, OR. Laskowski, D.A., 2002. Physical and chemical properties of pyrethroids, in G.W. Ware, ed, Reviews of Environmental Contamination and Toxicology, vol. 174, Springer-Verlag, New York, p. 49-170. Oros, D.R., and I. Werner, 2005, Pyrethroid insecticides: an analysis of use patterns, distributions, potential toxicity, and fate in the Sacramento-San Joaquin Delta and Central Valley. Interagency Ecological Program, San Francisco Estuary Institute Contr. No. 415, Oakland, CA. Solomon, K.R., J.M. Giddings, S.J. Maund, 2001, Probabilistic risk assessment of cotton pyrethroids: I. Distributional analyses of laboratory aquatic toxicity data. Environ. Toxicol. Chem. v. 20, p. 652-659. Weston, D.P., J. You, M.J. Lydy, 2004, Distribution and toxicity of sediment-associated pesticides in agriculture-dominated water bodies of California’s Central Valley. Enviro. Sci. Technol. v. 38, p. 2752-2759.

6/16/08 Final
Weston, D.P., R.W. Holmes, J. You, M.J. Lydy, 2005, Aquatic toxicity due to residential use of pyrethroid insecticides. Environ. Sci. Technol. v. 39, p. 9778-9784. Woudneh, M.B. and D.R. Oros, 2006, Pyrethroids, pyrethrins, and piperonyl butoxide in sediments by high-resolution gas chromatography/high-resolution mass spectrometry. Jour. Chromatography, v. 1135, p. 71-77. Zalom, F.G., N.C. Toscano, F.J. Byrne, 2005, Managing resistance is critical to future use of pyrethroids and neonicontinoids. California Agriculture, v. 59, p. 11-15. LIST OF PREPARERS: Todd Thornburg, Ph.D., Anchor Environmental LLC

6/16/08 Final
DRAFT RSET WHITE PAPER #4 – Evaluation of PBDEs as a contaminant of
concern in Sediments and tissues
CHEMICAL ANALYTE SUBCOMMITTEE, T. Thornburg, Chair ([email protected]); August 10, 2007 QUESTION/ISSUE: Are brominated fire retardants (PBDEs) accumulating in sediments at potentially toxic levels? Should they be listed as “chemicals of special occurrence” to be considered for evaluation in urban areas where potential sources are located? Should sediment and tissues guidelines be developed for PBDEs? DISCUSSION: Polybrominated diphenyl ethers (PBDEs) are flame retardants that are added to many consumer products, including clothing, furniture, and electronic equipment for fire protection. Structurally these compounds are similar to PCBs, and are persistent in sediments with the potential for bioaccumulation and biomagnification. The toxicity of PBDEs, especially to aquatic organisms, is not fully understood, but there is evidence that they may disrupt thyroid function and cause neurodevelopmental problems (ASTDR 2004; Ecology 2006). Regional monitoring studies have documented the presence of PBDEs in aquatic environments throughout the Pacific Northwest, with elevated levels at urban and industrial sites. This White Paper provides a review of usage rates, environmental occurrence, chemical properties, and toxicity of PBDEs, which may be used to evaluate the need for their inclusion as a contaminant of concern in the Pacific Northwest. After sufficient data have been collected (including synoptic chemistry and bioassay data), these chemicals may be evaluated to determine whether they contribute to sediment toxicity, and if so, whether the observed effects are predictable enough to support the development of screening levels. Chemicals of Interest: Commercial PBDEs are manufactured by bromination of diphenyl ethers resulting in a mixture of diphenyl ethers containing tetra-, penta-, hepta-, octa-, and deca-congeners in various percentages (ATSDR 2004). There are three commercial products as Penta-, Octa- and Deca-brominated diphenyl ethers. There are 209 individual congeners that can be divided into 10 homologue groups from mono- to deca-BDE. Of these, the, tri- to hexa-BDEs are the most lipophilic. The most persistent congener is PBDE-47. The most commonly detected congeners in biological and environmental samples are PBDE-47, PBDE-99, and PBDE-153. PBDE-209 is also found at high concentrations in house dust (Ecology 2006). Higher brominated commercial mixtures (e.g., decaBDE) are concentrated in soils and sediment near industrial point sources. The second Chemical Action Plan developed under the Washington state PBT Initiative focuses on PBDEs (Ecology, 2006). The PBDE levels in Washington’s fish tissue samples and water samples are currently assessed and the results will be used to establish baseline PBDE conditions in Washington freshwater area (Johnson and Seiders, 2005). There are no regulatory criteria for PBDEs for the protection of human health and the
6/16/08 Final
environment. Diet, especially food with high fat content like fatty fish, is the main exposure pathway for the adults in the general public. Methods of Analysis: Brominated fire retardants may be analyzed by GC/MS or GC/ECD using methods similar to those used for measurement of PCBs and organochlorine pesticides. EPA has developed a draft method 1614 for analysis of PBDE congeners in water, soil, sediment, biosolids and tissue by high resolution GC/MS (HRGC/HRMS), which measures all 209 PBDE congeners. The method detection limits and practical quantitation limits (PQLs) for EPA Method 1614 are typically in the 1-10 pptr range for sediment and tissue and 20 – 100 ppq range for water. A similar method is GC/HRMS method for analysis of tissues is described Alaee et al (2001). However, this level of detail may not be necessary for initial screening analyses. Alternatively, the Washington Department of Ecology Manchester Environmental Laboratory (MEL) has the standard operating procedure (SOP) 730002 for “Analysis of Water/Soil/Sediment/Fish Tissue Samples for Organochlorine Pesticides, PBDEs and PCBs by GC/ECD. The PQLs for SOP 73002 are in the 0.0033 – 0.1 ppb range for water and 1.0 – 100 ppb range for tissue. The MEL also has the SOP based on the EPA method 8270 to identify low level PBDEs in water, soil, sediment, sludge, oil samples, and tissue by GC/MS with PQLs of 2 – 5 ppb for all congeners except congener 209, Deca-BDE (Ecology 2005). NOAA’s Northwest Fisheries Science Center uses a similar GC/MS method (not high resolution) for quantitation of a subset of the most common PBDE congeners (BDEs 28, 47, 49, 66, 85, 99, 100, 153, 154, and 183) in sediment and tissue samples (Sloan et al. 2005), in conjunction with PCBs (40 congeners) and organochlorine pesticides. Method detection limits and practical quantitation limits for the NOAA method are typically in the 1-5 ppb range, depending on sample size. Commercial laboratories are beginning to offer PBDE analyses by EPA Method 1614 and modified versions of EPA Method 8270. The approximate cost for commercial analysis of sediment by EPA Method 1614 is $1000 or more; the modified EPA Method 8270 would be less expensive. If method 8270 were used, the PBDE analyses could be potentially be incorporated into analyses for organochlorine compounds and phthalates by Method 8270 that are already routinely required under the SEF. Evaluation Criteria: Use Rates. PBDEs occur in three technical mixtures: Penta-BDE used mainly in foam for furniture and upholstery, Octa-BDE used in plastics for business machine, and Deca-BDE used in electronic closures and textiles. Of the three mixtures, Penta-BDE is the most bioaccumulative. In 2001, the total market demand for PBDEs within the Americas was 33,100 metric tons, with deca-BDE accounting for 74% of the total (ATSDR 2004). There are 141 facilities that produce or process Deca-BDE in the United States, including one facility in Washington State with between 10,000 and 100,000 lbs of the material on site (ATSDR 2004). Production of Penta and Octa-BDEs was phased out voluntarily in the USA by the end of 2004 (ATSDR 2004). Therefore Deca-BDE currently accounts for 100

6/16/08 Final
% of PBDE production. The amount of PBDEs used in consumer products usually ranges between 5 and 30% by weight (Alaee et al 2003). Detection in Water. There information on PBDE concentrations in Pacific Northwest waters is limited. In a study in San Francisco Bay, PBDE concentrations in water samples ranged from 0.3 to 513 pg/L, with highest concentrations at sites with high inputs of wastewater treatment plant effluent (Oros et al. 2005). The Washington DOE measured PBDEs in the water column in Washington State river and lakes using SPMDs (Johnson et al. 2006). Estimated water column concentrations, based on the SPMD data ranged from 1-926 pg/L in the fall and from 8-146 pg/L in the spring, with highest concentrations in the Spokane River. The highest total PBDE concentrations observed in other water bodies were 80 pg/L in Lake Washington, 50-57 pg/L in the Columbia River, and 40 pg/L in the Yakima River. The USGS also measured PBDEs in the Lower Columbia and Lower Willamette Rivers using SPMDs, and found concentrations similar to those reported in the Columbia by Washington DOE (LCREP 2007; Morace 2006). Levels were highest in the Lower Willamette, near Portland, OR. Detection in Sediment. Information on PBDE concentrations in the Pacific Northwest sediments is limited, but detections have been reported. Rayne et al. (2003) measured PBDE concentrations ranging from 2.7 to 91 ppb dry wt in 11 surficial sediments collected from several sites along the Columbia River system in Southeastern British Columbia in 2001. The concentrations of PBDEs in sediments from San Francisco Bay ranged from below detection limits to 212 ppb dry wt (Oros et al. 2005). In 2004-2005, the Washington State Department of Ecology surveyed Puget Sound sediments for a subset of common PBE congeners, and found concentrations ranging from < 1 to ~13 ppb, somewhat lower levels than in San Francisco Bay (Dutch and Assen 2007). The USGS and the Lower Columbia Estuary Partnership detected PBDEs on suspended sediments at a site near the mouth of the Lower Columbia River, at a concentration of 84 ppb (LCREP 2007; Morace 2006). Overall, concentrations of PBDEs in sediments from California and the Pacific Northwest are fairly typical of concentrations ranges for other sites in the United States, with Puget Sound in the lower end of the range (ATSDR 2004). Detection in Tissues of Aquatic Organisms. Bioaccumulation of PBDEs in the aquatic food web is inversely related to the degree of bromination (Burreau et al. 2000b; Jansson et al. 1993). Thus, higher brominated congeners are rarely detected in biota. This is a result of their low solubility and high log Kow values (Hardy 2000). In contrast, tetra- to hexaBDE homologs are most frequently detected in biota (Burreau et al. 1997), which would be expected due to their greater water solubility and relatively high Kow values. Concentrations of PBDEs in biota are related to the trophic level of the species. For example, Haglund et al. (1997) examined the concentrations of PBDEs in herring, salmon muscle, and gray and ringed seals collected along the Swedish coast of the Baltic sea between 1981–1988. PBDE concentrations were found to increase with trophic level. (ATSDR 2004) Concentrations of PBDEs have been measured in tissues of several types of organisms at

6/16/08 Final
Pacific Northwest sites, including invertebrates, fish, birds, and marine mammals. NOAA Fisheries and the Lower Columbia Estuary Partnership (LCREP) detected PBDEs at concentrations ranging from < 1 to 66 ng/g ww (wet wt) in stomach content samples of juvenile Chinook salmon from the Lower Columbia River and Estuary, which contained of chironomid larvae and other aquatic insects. Highest PBDE levels were found in salmon collected in the Portland and Vancouver area (LCREP 2007). The US Army Corps of Engineers has detected PBDEs in a similar concentration range (up to ~180 ng/g ww) in freshwater clams (Corbicula sp.) collected from Columbia River sites from Bonneville to the mouth of the estuary. These concentrations are comparable to those reported for oysters, mussels, and clams from San Francisco Bay (Oros et al. 2005). Similarly, Ikonomou et al. (2002) found PBDE concentration ranging from 0.6-52 ng/g ww in hepatopancreas of Dungeness crab (Cancer magister) from British Columbia coastal sites. The Washington State Department of Ecology analyzed freshwater fish samples from various locations in Washington State, and found PBDE concentrations ranging from 1.4 ng/g ww in rainbow trout from Douglas Creek in Eastern Washington to 1,250 ng/g ww in mountain whitefish from the Spokane River (Johnson and Olson 2001; Johnson et al. 2006). The highest PBDE concentrations were found in fish from areas draining urbanized watersheds (Spokane, Yakima and Snake Rivers); concentrations were much lower in undeveloped watersheds (Douglas Creek, Rock Island Creek, and Soleduck River). Tetra and penta isomers were the major congeners present, in ratios similar to the commercial formulation Penta-BDE. PBDEs have also been detected in adult salmon and several species of marine fish in Puget Sound (O’Neill et al. 2005), at concentrations up to about 30 ng/g ww, and in juvenile salmon from the Lower Columbia River and Puget Sound at concentrations as high as 93 ng/g ww (LCREP 2007). Rayne et al. (2003) found comparable concentrations of PBDEs in Mountain whitefish from the Columbia River, British Columbia (0.726 – 131 ng/g ww), while Ikonomou et al. (2002) found PBDE concentration ranging from 2-17 ng/g ww in liver of English sole (Pleuronectes vetulus) from coastal British Columbia sites. PBDEs also appear to be accumulating in fish-eating birds and mammals. Buck et al. (2005) measured total PBDEs in bald eagle eggs collected along the Lower Columbia River in Washington and Oregon states at 446 to 1,206 ng/g wet weight. Reported PBDE concentrations in Heron eggs from British Columbia ranged from 1-288 ng/g ww (citation?). High levels of PBDEs have been reported in sea otters from the California coast (up to 26,800 ng/g lipid in sea otter liver; Kannan et a. 2007) and orca whales from Puget Sound and Georgia Basin (Rayne et al. 2004). Ikonomou et al. (2002) found PBDE concentration ranging from 240-2200 ng/g ww in blubber of harbor porpoise (Phocoena phocoena) from coastal British Columbia sites. Hydrophobicity. The octanol-water partitioning coefficient (Kow) is a measure of the hydrophobicity. The Log Kow values for PBDEs are relatively high, typically in the 7-12 range for mixtures and different individual congeners (e.g., Log Kow = 12.1 (EPIWIN). Log Kow = 6.27 (measured) (EU Risk Assessment, 2002). LogKow = 6.77 (tetra-BDE), LogKow = 7.66 (penta-BDE), LogKow = 8.55 (hexa-BDE) (ASDTR 2004; Ecology 2006). These values are in the same range as persistent, bioaccumulative contaminants

6/16/08 Final
such as PCBs and DDTs. In general, PBDEs are hydrophobic, and will exhibit a strong tendency to adsorb to sediments Environmental Persistence. PBDEs are quite persistent in the environment. For Deca-hexa, penta, and tetra-BDE congeners, estimated half-lives are: 180 days in water: 360 days in soil; 1600 days in sediment (EPA PBT Profiler); for Deca-BDE, a half-life has also been estimated of 460 days in air (EPA PBT Profiler). Recent studies indicate that Deca-BDE can be broken down into lower brominated PBDEs through exposure to sunlight or biodegradation. The lower-brominated PBDEs have an especially high potential for bioconcentration. For Deca-BDE, the estimated bioconcentration factor (BCF) is 3.16 (EPIWIN), but the BCFs of potential breakdown products are much higher (e.g., 32,000 for tetra-BDE; 8,100 for penta-BDE; and 490 for hexa-BDE, estimated with the EPA PBT Profiler). A BCF of ~27,400 has been determined for the Penta commercial product in carp (EU Risk Assessment for Penta-BDE, 2000). Juvenile carp given Deca-BDE in feed contained no detectible amount of the parent compound, but several ethers containing five to eight bromines were found (Stapleton et al., 2004). Deca-BDE has been found in food, indoor dust, human fat, blood, and breast milk (Ecology 2006). Toxicity. Structurally, PBDEs, are very similar to PCBs, and may have some of the same toxic properties. In mammals, PBDE exposure has been linked to imbalances in thyroid hormone levels and disruption in thyroid function, and exposure to PBDEs during early development can lead to neurological abnormalities and subtle impacts on learning and behavior (Gill et al. 2004, Danerud 2003, McDonald 2002). Effects on neural development and thyroid function occur at doses as low as 0.6-2 mg/kg body weight in rats and mice (Danerud 2003). Research on the toxicity of PBDEs to aquatic organisms is more limited, although some of the effects reported in mammals have been induced in fish exposed to PBDEs in the laboratory. Depressed plasma thyroid hormone levels have been reported in juvenile lake trout (Salvelinus namaycush) exposed to dietary PBDE at concentrations ranging from 32.5 to 325 ng/g wet wt in the laboratory for 56 days (Tomy et al. 2006), concentrations that are within the range reported in invertebrate species that are representative of fish prey. There is also some evidence for neuro-developmental impacts of PBDEs in fish. Timme-Laragy et al. (2006) found changes in activity level, fright response, predation rates, and learning ability in killifish (Fundulus heteroclitus) exposed to a PBDE mixture at water concentrations from 0.001 to 100 ug/L during embryonic development (day 0-7 post fertilization). At concentrations from 0.001-0.1 ug/L, which are within the reported environmental range, fish showed reduced activity and changes in feeding behavior, while at 1 ug/L, there were effects on learning behavior. Delays in hatching time were seen at concentrations as low as 0.1 ug/L. Lema et al. (2007) observed neural defects and cardiac arrhyhmia, and reduced survival in larval zebrafish exposed to PBDE 47, but at relatively high concentrations (>100 ug/L in water and > 3400 ng/g wet wt in zebrafish tissue). Dietary exposure to PBDEs in the 1000 ug/g wet wt range disrupts metamorphosis in frogs (Carlsson et al. 2007; Balch et al. 2006).
6/16/08 Final
PBDEs may also have reproductive effects; Muirhead et al. (2006) observed disrupted egg laying, reduced condition factor, and reduced sperm production in fathead minnows exposed to dietary PBDE 47, but tissue concentrations where these effects were produced were substantially higher than levels reported in the field studies cited above; the PBDE body burden in the males was 15,000 ng/g ww, while that in the females was 60,000 ng/g ww. Exposure to PBDEs does not appear to induce CYP1A activity (Boon et al. 2002, Timme-Laragy et al. 2006); nor does it appear to have estrogenic activity, based on its ability to induce vitellogenin or zona radiata proteins in Atlantic salmon (Boon et al. 2002). Their immunotoxicity seems to be weak. Birchmeier et al. 2006 found reduced viability of immune cells of lake trout exposed to PBDE 47, but only concentrations well above those reported in the environment (100 g/L). Similarly, there are few reports of immunotoxic effects of PBDEs in mammals except at high exposure concentrations (Gill et al. 2004). Additional toxicity data are available for water and dietary exposures from several bioassays (Ecotoxicity Data excerpted from Ecology 2006 Appendix F):
• Crustaceans, based on the Daphnia assay (21 days exposure), the NOEC = 2 ug/l (solubility limit for Deca- BDE) (EU Risk Assessment, 2002).
• Fish (killifish) LC50 (48 hours) > 500 mg/l (above water solubility limit). Fish (rainbow trout; 16, 49 or 120 day exposures) LOEL = 7.5 – 10 mg/kg body weight/day (120 day exposures). (EU Risk Assessment, 2002).
• Algae EC50 (72 or 96 hours) > 1 mg/l (EU Risk Assessment, 2002). • Activated sludge microorganisms, NOEC .>= 15 mg/l (EU Risk Assessment,
2002). Human toxicity data excerpted below are from ATSDR 2004:
• An MRL of 0.006 mg/m3 has been derived for intermediate-duration inhalation exposure (15–364 days) to lower brominated BDEs.
• An MRL of 10 mg/kg/day has been derived for intermediate-duration oral exposure (15–364 days) to decabromodiphenyl ether.
• An MRL of 0.03 mg/kg/day has been derived for acute-duration oral exposure (14 days or less) to lower brominated diphenyl ethers.
• An MRL of 0.007 mg/kg/day has been derived for intermediate-duration oral exposure (15–364 days) to lower brominated BDEs.
As yet, few human health or aquatic life criteria have been developed for PBDEs. In 2005, the State of North Carolina, based on guidance from EPA, recommended a threshold concentration of 2,000 ug/Kg in fish tissue for fish consumption warnings. REFERENCES: Alaee M, Arias P, Sjodin A, Bergman A, 2003. An Overview of Commercially Used Brominated
Flame Retardants, Their Applications, Their Use Patterns in Different Countries/Regions and Possible Modes of Release. Environment International 29: 683-689.
Alaee, M., D.B. Sergeant, M.G. Ikonomou, and J.M. Luross. 2001. A gas chromatography/high-resolution mass spectrometry (GC/HRMS) method for determination of polybrominated

6/16/08 Final
diphenyl ethers in fish. Chemosphere 44(6):1489-1495. ATSDR (Agency for Toxic Substances and Disease Registry). 2004. Toxicological Profile for
Polybrominated Biphenyls and Polybrominated Diphenyl Ethers. U.S. Department of Health and Human Services. Atlanta, GA. 619 pp.
Birchmeier KL, Smith KA, Passino-Reader DR, Sweet LI, Chernyak SM, Adams JV, Omann GM. 2005. Effects of selected polybrominated diphenyl ether flame retardants on lake trout (Salvelinus namaycush). Environ Toxicol Chem. 24:1518-1522.
Boon JP, van Zanden JJ, Lewis WE, Zegers BN, Goksoyr A, Arukwe A. 2002. The expression of CYP1A, vitellogenin and zona radiata proteins in Atlantic salmon (Salmo salar) after oral dosing with two commercial PBDE flame retardant mixtures: absence of short-term responses. Mar Environ Res. 54:719-24.
Buck, J.A., R.G. Anthony, C.A. Schuler, F.B. Isaacs, and D.E. Tillitt. 2005. Changes in productivity and contaminants in bald eagles nesting along the lower Columbia River, USA. Environmental Toxicology and Chemistry 24(7):1779-1792.
Darnerud PO. 2003. Toxic effects of brominated flame retardants in man and in wildlife. Environ Int. 6:841-853.
Ecology, 2006. Washington State Polybrominated Diphenyl Ether (PBDE) Chemical Action Plan: Final. Washington State Departments of Ecology and Health, Olympia, WA. Ecology Publication No. 05-07-048.
Ecology, 2005. Manchester Lab Users Manual, eighth edition. Washington State Departments of Ecology, Olympia, WA.
EPA 2003. EPA Method 1614 - August, 2003 Draft (Brominated Diphenyl Ethers in Water, Soil, Sediment and Tissue by HRGC/HRMS) to measure specific PBDE congener concentrations.
Gill U, Chu I, Ryan JJ, Feeley M. 2004. Polybrominated diphenyl ethers: human tissue levels and toxicology. Rev Environ Contam Toxicol. 2004;183:55-97.
Ikonomou MG, Rayne S, Fischer M, Fernandez MP, and Cretney W. 2002. Occurrence and congener profiles of polybrominated diphenyl ethers (PBDEs) in environmental samples from coastal British Columbia, Canada. Chemosphere (46) 649 – 663.
Ikonomou, M.G., Fernandez MP, and Hickman ZL. 2006. Spatio-temporal and species-specific variation in PBDE levels/patterns in British Columbia's coastal waters. Environ Pollut. 140:355-363.
Johnson, A. and Olson, N., 2001. Analysis and occurrence of polybrominated diphenyl ethers in Washington State freshwater fish. Bulletin of Environmental Contamination and Toxicology, 41:339 – 344.
Johnson, A., K. Seiders, C. Deligeannis, K. Kinney, P. Sandvik, B. Era-Miller, and D. Alkire. 2006. PBDEs Flame Retardants in Washington Rivers and Lakes: Concentrations in Fish and Water, 2005-06. Washington Department of Ecology Pub. No. 06-03-027.
Johnson, A. and K. Seiders, 2005. Quality Assurance Project Plan for PBT Monitoring: Measuring PBDE Levels in Washington Rivers and Lakes. Washington State Department of Ecology, Olympia, WA. Publication No. 05-03-113.
Kannan K, Perrotta E, Thomas NJ, Aldous KM. 2007. A Comparative Analysis of Polybrominated Diphenyl Ethers and Polychlorinated Biphenyls in Southern Sea Otters that Died of Infectious Diseases and Noninfectious Causes. Arch Environ Contam Toxicol. 53(2):293-302.
Lema SC, IR Schultz, NL Scholz, JP Incardona, and P. Swanson. 2007. Neural defects and cardiac arrhythmia in fish larvae following embryonic exposure to 2,2 ,4,4 -tetrabromodiphenyl ether (PBDE 47) Aquatic Toxicology 82:296–307
Lower Columbia Estuary Partnership (LCREP). 2007. Ecosystem Monitoring Water Quality and Salmon Sampling Report. August 2007.
McDonald, T.A. 2002. A perspective on the potential health risks of PBDEs. Chemosphere 46:745-755.

6/16/08 Final
Morace, J.L. 2006. Water Quality Data, Columbia River Estuary 2004-2005. U.S. Geological Survey Data Series 213. 18 pp.
Muirhead EK, Skillman AD, Hook SE, Schultz IR. 2006. Oral exposure of PBDE-47 in fish: toxicokinetics and reproductive effects in Japanese Medaka (Oryzias latipes) and fathead minnows (Pimephales promelas). Environ Sci Technol.40:523-528.
Rayne et al., 2004. PBDEs, PBBs, and PCNs in three communities of free-ranging killer whales (Orcinus orca) from the Northeastern Pacific Ocean. Environmental Science and Technology 38:4293 - 4299.
Rayne S, Ikonomou MG, and Antcliffe B. 2003. Rapidly increasing polybrominated diphenyl ether concentrations in the Columbia River system from 1992 to 2000. Environmental Science and Technology, 37:2847 – 2854.
Timme-Laragy AR, Levin ED, Di Giulio RT. 2006. Developmental and behavioral effects of embryonic exposure to the polybrominated diphenylether mixture DE-71 in the killifish (Fundulus heteroclitus). Chemosphere 62:1097-1104.
Tomy GT, Palace VP, Halldorson T, Braekevelt E, Danell R, Wautier K, Evans B, Brinkworth L, Fisk AT. 2004. Bioaccumulation, biotransformation, and biochemical effects of brominated diphenyl ethers in juvenile lake trout (Salvelinus namaycush). Environ Sci Technol. 38:1496-504.
Wakeford et al. 2002. Analysis of polybrominated diphenyl ethers (BDEs) in wildlife tissues– Canadian Wildlife Service contributions. Abstracts of the 4th Annual Workshop on Brominated Flame Retardants in the Environment, June 17 – 18, Canada Center for Inland Waters, Burlington, Ontario.
RECOMMENDATION: PBDEs have been detected in biota and to a lesser extent in sediments from Pacific Northwest sites at concentrations comparable to those measured in other urbanized river and estuaries in the United States. These compounds may pose a risk to organisms because of their persistence in media and their bioaccumulation into fish, wildlife, and humans. In these higher order receptors, PBDEs appear to have effects on thyroid function and neurological development, based on studies conducted primarily with mammals. However, little information is available on their direct sediment toxicity to benthic organisms. Because toxicity data on the effects of PBDEs on fish and benthic organisms are limited, it is difficult to offer recommendations for screening level guidelines for either sediments or fish tissues. Also, although various methods have been used to measure PBDEs, as yet there is no standardized method for their analysis and no standard list of congeners available to recommend to commercial labs. Although we are concerned about the potential effects of PBDEs on biota, we are hesitant to recommend them as contaminants of special occurrence at this time because of the lack of a standardized analytical method for sediments and uncertainties about their effects on benthic organisms. We recommend that RSET participants should agree upon a standardized method for analysis of PBDEs, and that these chemicals should be incorporated into existing regional monitoring programs as funding allows us to improve our knowledge base on their distribution and concentrations in regional sediments. Bioassay, animal and epidemiological studies are also needed to determine NOELs, LOELs, and safe human health and ecological health risk based concentrations for PBDEs. We strongly encourage additional research to better characterize toxic responses of fish and aquatic invertebrates to PBDEs, as well as more extensive agency monitoring of PBDE concentrations in the environment. LIST OF PREPARERS: Lyndal Johnson., Northwest Fisheries Science Center;, NOAA Fisheries; Taku Fuji, Ph.D., Kennedy/Jenks Consultants; Fu Shin Lee, Washington State Department of Ecology.

6/16/08 Final

Publication Date: 6/2/07
DMMP CLARIFICATION PAPER CHLORDANE ANALYSIS AND REPORTING Prepared by David Fox (U.S. Army Corps of Engineers) and Erika Hoffman (U.S. Environmental Protection Agency) for the DMMP agencies. Introduction Chlordane, an organochlorine insecticide, was used in the United States from 1948 to 1978 on agricultural crops, lawns, and gardens and as a fumigating agent. In 1978, EPA canceled the use of chlordane on food crops and phased out other above-ground uses for the next 5 years. From 1983 to 1988, chlordane's only approved use was to control termites in homes. In 1988, all approved uses of chlordane in the United States were terminated; however, manufacture for export still continues. Chlordane is a persistent, bioaccumulative, and toxic (PBT) pollutant targeted by EPA (EPA, 2007). Chlordane was sold under numerous trade names, including Belt, Corodane, Dowchlor, Octachlor, Toxichlor and Velsicol 1068. These commercial products were actually a mixture of chemicals, the composition of which varied from product to product. Commonly referred to as “technical chlordane”, the mixtures included at least 11 major components and 30 or more minor components (EPA, 1996). Many of the components of chlordane are persistent in the environment and bioaccumulative. Additionally, metabolism of the principal components (cis-chlordane, trans-chlordane, and heptachlor) results in the formation of the stable products, oxychlordane and heptachlor epoxide. These metabolites have been detected in the tissues of humans and wildlife. Problem Identification Chlordane was included on the original list of Puget Sound Dredged Disposal Analysis (PSDDA) chemicals of concern, with both a screening level and bioaccumulation trigger established. However, PSDDA restricted the definition of chlordane to its cis- (or alpha-) isomer (PSDDA, 1988). In 2003 the DMMP agencies included chlordane on a revised list of bioaccumulative chemicals of concern (BCOC). But in this case it was defined as including cis-chlordane, trans-chlordane, cis-nonachlor, trans-nonachlor, alpha-chlordene, gamma-chlordene and heptachlor (DMMP, 2003).
1

Publication Date: 6/2/07
There are a number of problems that need to be addressed: 1. There has been some confusion as to whether the updated definition of chlordane is to be applied to sediment analysis as well as tissue analysis. 2. Heptachlor is already listed separately on the DMMP chemicals-of-concern list for sediment analysis and was placed on BCOC List 4 (not currently considered bioaccumulative contaminants) (DMMP, 2007). 3. Oxychlordane was not included on the list of chlordane components to be analyzed, even though it is a highly toxic metabolite likely to be present in tissue samples of aquatic organisms exposed to chlordane-contaminated sediment. 4. The standard material necessary to analyze for alpha-chlordene is difficult to get, expensive, and degrades quickly. Also, alpha- and gamma-chlordene are not typically found in sediment samples in Washington State (Mandjikov, 2007). 5. The Department of Ecology’s Manchester Lab reports that PCB congener 153 and cis-nonachlor are difficult to separate when doing electron-capture-detector analysis. In most cases the level of PCB 153 (a major component of Aroclor 1254) is present at much higher levels than cis-nonachlor, effectively obliterating any evidence of the latter. Therefore, cis-nonachlor is typically reported as a non-detect at a reporting limit which may be 20 times or more the level of the major chlordane peak (Mandjikov, 2007). Labs with other instrument configurations may experience PCB interference with other of the minor chlordane components. The King County Environmental Lab reports PCB interference (particularly congeners in Aroclor 1254 and 1260) with both cis- and trans-nonachlor (Walker and Elliott, 2007).
The DMMP agencies recognize the need to clarify and standardize the reporting requirement for chlordane and ensure the requirement is consistent with other DMMP guidance and current science. The reporting requirement must also be compatible with the currently used analytical method. Proposed Clarification EPA SW 8081A (gas chromatography/electron capture) is the most commonly used method for the analysis of organochlorine pesticides in both sediment and tissue. Method 8081A provides three options for reporting chlordane:
1. As “technical chlordane” (CAS 12789-03-6) if the gas chromatograph (GC) peaks match the pattern for technical chlordane. 2. As “chlordane (not otherwise specified)” (CAS 57-74-9) if the GC peaks do not match that of technical chlordane.
2

Publication Date: 6/2/07
3. As the major individual components under their respective Chemical Abstracts Service (CAS) numbers.
The DMMP agencies propose the following:
1. Replace “alpha-chlordane” with “total chlordane” on the DMMP COC list for sediments. The screening level and bioaccumulation trigger will remain at 10 and 37 ug/kg respectively. There is no maximum level for chlordane. 2. Analyze the same list of chlordane components and metabolites in both sediment and tissue. 3. Report the following components and metabolites of chlordane under their respective CAS numbers: cis-chlordane, trans-chlordane, cis-nonachlor, trans-nonachlor and oxychlordane. 4. Report “total chlordane” as the sum of the detected concentrations of these five chlordane components and metabolites. If all chemicals are undetected, report the single highest reporting limit of the individual chemicals (with the possible exception of elevated reporting limits caused by PCB interference – see #5). 5. When PCB interference causes one or more of the minor components of chlordane (cis-nonachlor, trans-nonachlor, oxychlordane) to be reported as non-detected at a reporting limit significantly higher than that of the major chlordane constituents (cis- and trans-chlordane), the DMMP agencies may exclude these components from the “total chlordane” definition in #4. 6. Continue to quantify heptachlor separately from total chlordane for comparison to sediment screening levels. While heptachlor remains on the DMMP’s COC list for sediment analysis, it was reclassified to BCOC List 4 and is not considered a contaminant of concern for bioaccumulation by the DMMP.
Note: The metabolite heptachlor epoxide is currently on List 3 of the BCOCs (potentially bioaccumulative contaminants). Analysis of List 3 chemicals is not required at this time. References DMMP, 2003. Revisions to the Bioaccumulative Chemicals of Concern (BCOC) List. DMMP issue paper. Prepared by Erika Hoffman for the DMMP agencies. DMMP, 2007. The Technical Basis for Revisions to the Dredged Material Management Program’s Bioaccumulative Chemicals of Concern List. Prepared by Erika Hoffman for the DMMP agencies.
3
Publication Date: 6/2/07
EPA, 1996. Test Methods for Evaluating Solid Waste, Physical/Chemical Methods (SW-846). Method 8081A, Organochlorine Pesticides by Gas Chromatography, Revision 1, December 1996. U.S. Environmental Protection Agency. EPA, 2007. Persistent Bioaccumulative and Toxic Chemical Program website. U.S. Environmental Protection Agency. http://www.epa.gov/pbt/pubs/chlordane.htm Mandjikov, 2007. Personal communication from Myrna Mandjikov, Manchester Environmental Lab, Washington State Department of Ecology. PSDDA, 1988. Evaluation Procedures Technical Appendix - Phase I. U.S. Army Corps of Engineers – Seattle District; U.S. Environmental Protection Agency - Region X; Washington State Department of Natural Resources; Washington State Department of Ecology. Walker and Elliott, 2007. Personal communication from Dana Walker and Colin Elliott, King County Environmental Laboratory.
4
Final: 10/05/01
DMMP/SMS CLARIFICATION PAPER CHEMICAL ANALYSIS OF ARCHIVED SEDIMENT SAMPLES Prepared by Brett Betts and Kathy Bragdon-Cook (Washington Department of Ecology) for Ecology and the DMMP agencies. INTRODUCTION An environmental laboratory in the Puget Sound region recently sought guidance from the Department of Ecology on appropriate handling of archived sediment samples. The main question involved whether or not to decant any overlying water from the sample container prior to chemical analysis. The lab claimed that this is an acceptable option under the current PSEP Protocols and Guidelines. PROBLEM IDENTIFICATION Under the most recent PSEP Protocols and Guidelines, environmental laboratories may elect to decant any overlying water that may accumulates at the top of an archived sample prior to chemical analysis. The protocols state, “It is extremely important that the sample be clearly defined prior to starting the analysis. In general, current references recommend that excess or overlaying water in a sample be decanted prior to subsampling (EPA, 1987; EPA, 1994; EPA, 1995). For some projects, the concentration of analytes in the interstitial water associated with the solid phase may be of interest (e.g., oiled sediments). Decanting, centrifugation and discarding this water may bias the results. If concentrations in the whole sample (i.e., including interstitial water are of interest, the decanted water should be extracted as a liquid sample and the resulting extract combined with the sediment extract (EPA, 1987). Alternatively, the overlaying water in the sample can be mixed into the sediment prior to subsampling. The desired procedure should be specified in the project planning document to ensure the generation of data appropriate to project goals. If samples are decanted, this should be reported with the final data and the percent solids should be determined on a decanted sample.” (Organics Chapter, 5.3.2 Sediment, 4/97) As noted in the protocols, this practice clearly leads to an unwarranted loss of contaminants from the original sample and yields inaccurate results. While it is true that most sediment contaminants tend to adsorb to particles, a significant fraction of the total sample contaminants may occur in the interstitial or porewater. PROPOSED CLARIFICATION To accurately represent the chemical concentrations originally present in the sample when collected, prior to being archived, the dissolved fraction must also be analyzed as described above. Samples archived at 4o Celsius must not be decanted prior to chemical analysis.

Final: 10/05/01
REFERENCES PSEP, 1997 Recommended Guidelines For Measuring Organic Compounds in Puget Sound Water, Sediment and Tissue Samples
Final: 10/20/99
DMMP CLARIFICATION PAPER
CLARIFICATION ON THE DMMP POLICY ON BLANK CORRECTION FORMETHOD BLANK CONTAMINATED CHEMICAL SAMPLES
Prepared by David R. Kendall (U.S. Army Corps of Engineers) for the DMMP agencies.
INTRODUCTION
The Dredged Material Management Program (DMMP) requires the analysis of onemethod blank per batch of samples undergoing chemical analyses as part of the generalquality assurance control procedures during the routine analysis of sediment samples. Asstated in the Puget Sound Estuary Program (PSEP) protocols “Method blanks areanalyzed to assess possible laboratory contamination of samples associated with all stagesof preparation and analysis of sample extracts.” When reporting results to the DMMPagencies “Laboratories should report original sample data without blank correction andshould report data for all method blanks such that the contribution to associated samplescan be determined.”
PROBLEM IDENTIFICATION
This clarification addresses how the DMMP agencies will use method blank data during aproject evaluation. It was necessitated by a blank contamination issue, that surfacedrecently during sediment characterization for a dredging project. In the recent example,the analyte TBT exhibited blank contamination within a subset of the samples. Thequestion arose as to whether or not the data should be blank corrected for regulatorydecision-making. In this example, blank corrected samples would result in severalsamples being quantitated below the screening level (SL), whereas without blankcorrection they would exceed the SL.
PROPOSED CLARIFICATION
The DMMP agencies policy is and will continue to be that blank correction of samples isnot authorized when a method blank sample within a sample batch exhibits apparentblank contamination. The purpose of the method blank as noted above is to verify thelaboratory procedures as a quality assurance/quality control measurement. If seriousblank contamination is observed, the DMMP agencies may require a retest of sampleswithin the affected batch, or they may choose to use the data for regulatory decision-making without blank correcting.

Final: 12/22/98
October 1998Page 1
DMMP CLARIFICATION PAPERSMS TECHNICAL INFORMATION MEMORANDUM
TRIBUTYLTIN ANALYSIS: CLARIFICATION OF INTERSTITIAL WATEREXTRACTION AND ANALYSIS METHODS - INTERIM
Prepared by Erika Hoffman (U.S. EPA, 206-553-0038) for the DMMP agencies.
INTRODUCTION
Tributyltin (TBT)1 is a special chemical of concern under the Dredged MaterialManagement Program (DMMP). Testing for this chemical in areas where it is likely to befound (e.g. marinas, ship repair facilities, navigation channels) may be required under thisprogram. The available literature indicates that the toxicity and bioaccumulation of TBTare affected by a variety of factors, including organic carbon in sediment and water, pH,salinity, clay fraction, and the presence of constituents such as iron oxides. In addition,TBT exists in several forms, is released into the aquatic environment in different ways,and the mode of exposure to benthic organisms varies.
In 1996 the DMMP/SMS agencies reviewed the available literature and concluded thatanalysis of bulk sediment TBT was not the most environmentally relevant way to assessthe bioavailability of TBT (EPA, 1996, Michelsen et al., 1996). Due to the way in whichTBT acts and reacts in the environment, the agencies determined that analysis ofinterstitial water for the presence of TBT was a more effective way to measure itspotential for impact in the aquatic environment. As a part of the Sediment ManagementAnnual Review process, the agencies adopted the requirement for interstitial wateranalysis in 1996.
PROBLEM IDENTIFICATION
A number of questions have been raised regarding sampling and analysis for TBT sincethe agencies initiated the requirement for interstitial water testing. Many differentapproaches are used for the extraction and preparation of interstitial water from sedimentsamples and it is generally believed that both technique and materials can cause largevariations in the measured interstitial water TBT concentration. In particular, there areconcerns that certain steps in the extraction and preparation process may contribute to theloss of TBT in the pore-water. Some of the most important unresolved issues involvingthe measurement of TBT in interstitial water include:
• The degree of TBT adsorption to various laboratory materials (such as stainless steel,and borosilicate glass) and equipment (such as centrifuge tubes, filters and filtrationapparatus).
1 Although this clarification paper focuses on tributyltin, the procedures and guidance presented hereinapply to the measurement of all organotin species (e.g., mono-, di-, tri-, and tetrabutyltin).

Final: 12/22/98
October 1998Page 2
• The effect of aerobic conditions on TBT solubility.• The effect of sediment and interstitial water extract holding time on TBT solubility.• Differing partitioning characteristics of TBT in fresh water versus marine
environments.• The relative toxicological importance if colloid-bound TBT versus soluble TBT in
porewater.
Avocet Consulting and Striplin Environmental Associates (SEA) investigating these andother unresolved issues surrounding butyl tin extraction, analysis, and data use. The studyis divided into two phases. The first phase includes distribution of a policy andcomprehensive analytical questionnaire (November, 1998), a follow-up regulatoryworkshop (January, 1999), and finalization of the analytical work plan based onquestionnaire and workshop responses. The second phase consists of analysis of actualenvironmental samples, data validation, data interpretation and write-up, and preparationof a SMARM clarification paper. The ultimate goal of the Avocet/SEA study and of thisclarification paper is to further the development of a DMMP standard protocol forextracting and measuring TBT in sediment interstitial water.
The following clarifications are provided as interim guidance to ensure that allprojects reporting TBT data utilize similar methods for interstitial water extractionand TBT analysis. The agencies recognize that project-specific constraints mayrequire deviations from the methods and performance criteria described below.Any such deviation must be justified and approved by the DMMP agencies prior totest initiation.

Final: 12/22/98
October 1998Page 3
PROPOSED CLARIFICATIONS FOR THE TBT-INTERSTITIAL WATERPROTOCOL
The following proposed interim guidance should be applied to all DMMP projects forwhich interstitial water TBT analysis is required. This guidance was developed based oninput from researchers and technical staff who regularly extract and measure interstitialwater TBT. It reflects current thought on the best methodology for limiting the loss ofTBT due to sample handling. The DMMP agencies are aware that new methodologies torefine TBT analysis may be in development and will consider updating these interimguidelines with any alternative methods that may yield equal or better results. Thisinterim guidance will be revisited at a later date by the DMMP agencies once the resultsof the Avocet/SEA study (described above) as well as results from other project-specifictesting are available.
1. Materials
Field collection and storage - Polycarbonate, borosilicate glass or stainless steelcontainers should be used for field collection, homogenization, and pre-centrifugationstorage of sediments to be tested for interstitial water TBT.
Centrifugation and interstitial water collection– Polycarbonate containers should beused for centrifugation and for supernatant collection after the first round of spinningsince use of polycarbonate minimizes loss of TBT due to sorption. Borosilicate glassstorage containers may be used to store the acidified supernatant collected after thesecond round of centrifugation.
Interstitial water analysis – Borosilicate glass or polycarbonate equipment andcontainers may be used when handling and extracting acidified interstitial watersamples.
2. Equipment Decontamination and Cleaning All laboratory equipment and glassware used for sediment collection and storage,interstitial water collection and storage, and TBT analysis should be appropriately cleanedand rinsed with residue analysis grade solvents. The effectiveness of any givendecontamination procedure will ultimately be demonstrated by meeting the appropriateQC performance criteria (see Table 1). The following are examples of acceptableprocedures for the cleaning and decontamination of polycarbonate and other material:

Final: 12/22/98
October 1998Page 4
Polycarbonate All other materials Detergent wash Detergent wash
Rinse with dilute hydrochloric acid Rinse with deionized water Rinse with deionized water Rinse with acetone Rinse with 0.1% tropolone/hexane Rinse with 0.1% tropolene/MeCl2
Rinse with hexane Rinse with methylene chloride
3. Sediment Sampling and Holding When loading sediment samples into storage containers, headspace should be minimizedand containers purged with nitrogen either in the field or upon arrival at the laboratory(before storage). Because the freezing of bulk sediment samples may result in structuralchanges in the sediment which will alter the availability of TBT, samples to be held forfuture TBT analysis should have interstitial water extracted prior to freezing. Sedimentsamples should be maintained in the dark at 4°C while in transport and once in thelaboratory. It is important to minimize sample holding time prior to centrifugation inorder to reduce the chance for adsorptive loss of TBT. No more than 7 days shouldelapse between sediment collection and centrifugation. 4. Interstitial Water Collection Method Centrifugation is preferred for collecting sediment interstitial water following theprocedure in paragraph 5 (below). Alternative interstitial water extraction methods maybe used in cases where centrifugation is not an effective technique, (e.g., for very sandysediments) and will be decided on a case-by-case basis by the DMMP agencies. 5. Centrifugation Procedure
Sample preparation - Pooled interstitial water that may collect on the surface of thesediment sample while in storage should be reintroduced into the sample prior tocentrifugation. Samples should be maintained at or below 11 °C during processing.
Anaerobic extraction - Sample loading, supernatant/interstitial water decanting,transfer, and sample acidification should occur under anaerobic conditions (i.e., undera nitrogen atmosphere).
Centrifuge settings - Samples should be double centrifuged with the first run at 3000G for 30 minutes and the second run within the range of 3000 – 9000 G for 30minutes. Samples should be maintained at a temperature at or below 11°C duringcentrifugation. Extra care should be taken to minimize carryover when transferringsupernatant after each centrifugation step. A new and potentially useful method forobtaining particle-free interstitial water using an aspiration system is described inOzretich and Schults (1998).
Final: 12/22/98
October 1998Page 5
6. Filtration Filtration should not be performed on interstitial water samples. The DMMP agencieswill reconsider the question of whether or not to filter interstitial water pending results ofthe Avocet/SEA study (described above) and any other studies addressing the influence offilters and the filtration process on TBT sorption. 7. Interstitial Water Handling Interstitial water should be acidified with hydrochloric acid immediately aftercentrifugation and stored in pre-cleaned containers (borosilicate glass or polycarbonate) at4°C. No more than 7 days should elapse between interstitial water collection and theinitiation of TBT analysis. 8. Analytical Methods Acceptable methods for measuring TBT involve tropolone/methylene chloride extraction,followed by Grignard derivitization and analysis by GC/MS (e.g., Krone et al., 1989),GC/MS SIM (e.g., PSEP, 1997), or GC/FPD (e.g., Unger et al., 1986). 9. Performance Criteria for Sample Collection and Interstitial Water TBT Analysis
The DMMP agencies have decided to recommend QC performance criteria rather thanproviding a step-by-step protocol for the extraction, derivitization, and analysis of TBT.The criteria presented in Table 1 must be met in order to verify that cleaning, extractionand derivitization methods are being performed correctly. Laboratories will be required tomeet these performance criteria as well as take the specified corrective action ifperformance criteria are not met. Deviations from the specified performance criteria willbe considered by the DMMP agencies on a project-specific basis. Justification foralternative performance criteria must be submitted in writing and receive agency approvalprior to the initiation of testing. As discussed in earlier guidance (Michelsen, et al.,1996), TBT analytical results and QC information should be reported as the TBT ion.

Final: 12/22/98
October 1998Page 6
Table 1. Summary of Quality Control Procedures for TBT in Interstitial water
QC Check MinimumFrequency
AcceptanceCriteria
Corrective Action
Laboratory ControlSample (LCS) *
1 per analytical batch(≤ 20 samples)
Recovery 50 – 150% 1. Check calculations2. Reanalyze (matrix or
injection problems?)3. If still out, re-extract
and reanalyze LCS andassoc. samples (ifavailable); If notavailable flag data.
Matrix spike (MS) andmatrix spike duplicate(MSD) *
1 MS/MSD pair peranalytical batch (≤ 20samples)
Recovery 50 – 150%and relative percentdifference (RPD) ≤=30%
4. Evaluate for supportablematrix effect.
5. If no interference, re-extract and reanalyzeMS/MSD once (ifavailable).
6. If still out, report bothsets of data.
Surrogate spike *(Tripentyltinrecommended)
1 per sample Recovery 50 – 150% 7. Check calculations.8. Evaluate for supportable
matrix effect9. If no interference is
evident, re-extract andreanalyze affectedsample(s) (if available)and flag any outliers.
Method blank** 1 per analytical batch(≤ 20 samples)
Target analyte < 3x thereporting limit (RL)
10. Flag if target > 3x RLbut less than 0.075ppb***.
11. Rerun batch and IDcontamination source iftarget >0.075 ppb.
* All QC samples should be run using the same sample handling as is used on the environmental samples.** Method blank can include centrifugation step or, alternatively a centrifugation blank can be runseparately from the analytical method blank.*** 0.075 ppb TBT is used here as a benchmark for evaluating blank performance because it represents aconcentration that is one-half the interstitial water screening level (0.15 ppb) that is being used by theDMMP agencies to determine the need for bioaccumulation testing. Note that a minimum interstitial watervolume of 200-500 ml will be needed to attain reporting limits less than 0.075 ppb TBT.
Final: 12/22/98
October 1998Page 7
REFERENCES
EPA. 1996. Recommendations for Screening Values for Tributyltin in Sediments atSuperfund Sites in Puget Sound, WA. Prepared for EPA Region 10, Superfund by Roy F.Weston, Seattle, WA.
Krone, C.A., D.W. Brown, D.G. Burrows, S.L. Chan, and U. Varanasi. 1989. A methodfor analysis of butyltin species in measurement of butyltins in sediment and English solelivers from Puget Sound. Marine Environmental Research 27:1-18.
Michelsen, T., T.C. Shaw, and S. Stirling. 1996. Testing, reporting and evaluation oftributyltin data in PSDDA and SMS programs. Final PSDDA Issue Paper/SMSTechnical Information Memorandum, October 1996.
Ozretich, R.J., and D.W. Schults. 1998. A comparison of interstitial water isolationmethods demonstrates centrifugation with aspiration yields reduced loses of organicconstituents. Chemosphere, Vol. 36, No. 3, pp. 603-615.
PSEP. 1997. Recommended guidelines for measuring organic compounds in PugetSound water, sediment and tissue samples. Appendix B, Guidance for selectedion monitoring. Puget Sound Estuary Program. Prepared for U.S. EnvironmentalProtection Agency Region 10, Seattle, WA.
Unger, M.A., W.G. McIntyre, K. Greaves, and R.J. Huggett, 1986. GC Determination ofbutyltins in natural waters by flame photometric detection of hexyl derivatives with massspectrometric confirmation. Chemosphere 15:461.

PSDDA ISSUE PAPER 10/96
SMS TECHNICAL INFORMATION MEMORANDUM
TESTING, REPORTING, AND EVALUATION OF TRIBUTYLTIN DATA IN PSDDA AND SMS PROGRAMS
Dr. Teresa Michelsen (Washington Department of Ecology), Travis C. Shaw (Corps of Engineers) and Stephanie Stirling (Corps of Engineers) for the PSDDA/SMS agencies.
INTRODUCTION
Tributyltin (TBT) is a special chemical of concern under the PSDDA program and is classified as a deleterious substance under the SMS rule. Testing for this chemical in areas where it is likely to be found (e.g., marinas, ship repair facilities, shipping lanes) may be required under both programs. In 1988, the PSDDA agencies conducted a study on the presence of TBT in marinas in Puget Sound, and funded a risk assessment of TBT (Cardwell, 1989). In 1988, the PSDDA agencies developed a screening level (SL) and bioaccumulation trigger (BT) for use in the PSDDA program, based on the best available knowledge of this chemical and its properties.
In the past year, additional information has come to fight on TBT, its distribution in Puget Sound, and its effects on the environment that support a change in the way the agencies approach evaluation of TBT in sediments. Most recently, an interagency work group was convened by EPA to develop a site-specific screening value for the Commencement Bay Nearshore/Tideflats and Harbor Island Superfund sites (see EPA, 1996). This paper discusses some of the issues raised by this new information and modifications to the PSDDA and SMS programs to address these issues.
Authority to develop testing programs, interpretation guidelines, and regulatory levels for deleterious substances (substances that currently do not have standards) under SMS is provided by WAC 173-204-110(6) and WAC 173-204-310(3). This technical memorandum was circulated for public review and comment in conjunction with the 1996 Sediment Management Annual Review Meeting. Many comments were received and a substantial number of revisions and additions to this memorandum have been made.
PROBLEM IDENTIFICATION
Worldwide information documenting TBT's adverse impact on the aquatic environment is extensive. In addition to direct mortality, adverse impacts on a wide variety of aquatic organisms include reduced larval growth, sexual abnormalities, reproductive failure, gross morphological abnormalities, immune system dysfunction, nervous system disorders, and skin and eye disorders. TBT has a strong inhibitory effect on the cytochrome P450 system, reducing the ability of the organism to metabolize and detoxify environmental pollutants, and on ATP synthesis, reducing the ability of the organism to produce energy. These effects are generalized enough to occur in many organisms

(including invertebrates, fish and mammals). Available evidence indicates that serious chronic effects resulting in population declines occur at water concentrations in the parts per trillion (ng/L) to parts per billion (ug/L) range, depending on the species (Fent, 1996; EPA, 1991).
The available literature indicates that the toxicity and bioaccumulation of TBT are affected by a variety of factors, including organic carbon in sediment and water, pH, salinity, clay fraction, and the presence of inorganic constituents such as iron oxides. TBT partitioning is further complicated by the fact that it occurs in several forms, including TBT+, TBTCl, and TBTOH and may interconvert among these forms with fluctuations in salinity and pH (Fent, 1996; EPA, 1991). Finally, TBT has been released into the environment in a variety of forms, including leaching directly from vessel hull paints (the most toxic and bioavailable form) and in the form of paint wastes from sandblasting (which may be less bioavailable but may represent a long-term source of the contaminant).
Sediment sampling in Puget Sound and elsewhere indicates that sediments in areas with vessel activity (e.g., marinas, harbors, boatyards, shipyards) are a significant reservoir of TBT (Parametrix, 1995). Worldwide, TBT-contaminated sediments adversely impact benthic organisms and contribute to water column concentrations that continue to be toxic to aquatic life (Fent, 1996). Very high, widespread TBT sediment concentrations have been found in the waterways of Commencement Bay, Elliott Bay (Harbor Island), and the Salmon Bay/Ship Canal area. Additional ongoing sources include domestic vessels that are still allowed to use TBT paints and shipping traffic from countries without TBT regulations.
Efforts to interpret environmental data in Puget Sound have been frustrated by the complexity of TBT partitioning in the environment and uncertainty over appropriate effects levels, testing strategies, and interpretive criteria. Recent data provided by NOAA suggest that the bioassay tests routinely used in the PSDDA and SMS program may not be of long enough duration to accurately reflect in situ effects due to TBT, and that other approaches may be more appropriate to the types of toxicity exhibited by this chemical (Meador et al.,1996 in press).
TECHNICAL BACKGROUND AND DISCUSSION
Analytical Methods
Analytical methods and detection limits for TBT are provided in the 1996 PSEP Organics Protocol, Appendix A (PSWQA, 1996). The recommended method involves reaction with sodium borohydride, methylene chloride extraction and analysis by GC/MS (Matthias et al., 1986). However, this method is somewhat experimental and is not available at most commercial laboratories. Alternative methods involve methylene chloride extraction, followed by Grignard derivatization and analyzed by GC/MS (Krone et al., 1989) or GC/FPD (Unger et al., 1986).

Reporting Conventions
TBT data have historically been reported in a number of different ways. For example, in the literature TBT may be reported as Sn, TBT, TBTCl, or TBTO. For the same environmental concentration, these reporting conventions result in different numerical values because each of these forms has a different molecular weight. This has resulted in some confusion interpreting the data and in setting standards.
It is important that all data be reported in comparable units, and that any standards or guidance levels also be in those same units. The PSDDA program has used Sn in the past and the existing SL and BT are based in units of Sn. However, much of the analytical and research community recommends reporting TBT as the TBT ion (TBT+).
A simple conversion based on the ratio of molecular weights can be used to convert older data into these units for comparison with newer data:
To convert TBT reported as: To: Multiply By:
mg Sn/kg mg TBT/kg 2.44 mg TBTC1/kg mg TBT/kg 0.89
mg TBTO/kg mg TBT/kg 0.95
The existing PSDDA SL for sediments (30 ug Sn/kg) corresponds to 73 ug TBT/kg.
TBT and Apparent Effects Threshold Values
The interagency work group followed the traditional approach in establishing regulatory thresholds for Puget Sound sediments by attempting to establish apparent effects threshold (AET) values for TBT. This effort was unsuccessful because of the widely varying responses in the bioassay and benthic data reviewed over a wide range of TBT concentrations (EPA, 1996). In some cases, despite extremely high TBT concentrations in sediments, no acute toxicity was exhibited by the standard suite of bioassay organisms. Current research shows that TBT partitioning is highly complex, and the relationship between concentrations and observed effects data is much stronger for interstitial water and tissue concentrations. Therefore, the work group discontinued efforts to develop AET values and instead focused its attention on using effects data associated with interstitial water and tissue concentrations as regulatory endpoints. However, Ecology will evaluate any additional synoptic data that are collected to further explore whether a reliable AET value can be calculated.
Interstitial Water Concentrations
As part of the TBT work group's efforts, an extensive literature review and compilation of effects levels in marine waters was developed for use in setting a site-specific screening value for the Commencement Bay Nearshore/Tideflats Superfund site

(EPA,1996). The reader is referred to this report, which received substantial public and technical review, for a detailed presentation of effects levels in water. TBT water concentrations that result in acute and chronic adverse effects to a wide range of marine species have been reported in the literature (Fent, 1996, EPA, 1991; EPA, 1996). Chronic effects to aquatic organisms have been reported at concentrations ranging from 0.002 - 74 ug TBT/L, with the majority of species responding below 0.5 ug TBT/L. Acute effects have been reported at concentrations ranging from 0.3 - 200 ug TBT/L.
The consensus of the TBT work group was that an interstitial water concentration of 0.05 ug TBT/L corresponds to a no adverse effects level that would protect most (approximately 95%) of the Puget Sound species that have been tested. This level is conceptually equivalent to the SQS under the Sediment Management Standards, and is consistent with the EPA approach to developing water quality and sediment criteria. For comparison, the EPA proposed draft marine chronic water quality criterion has been set at 0.01 ug TBT/L (EPA, 1991).
A higher adverse effects level was also evaluated by the TBT work group; however, less consensus was achieved on an upper or maximum allowable regulatory level. As one possibility, the work group discussed a value of 0.7 ug TBT/L. This concentration is lower than most of the acute effects levels reported in the literature. However, significant chronic effects are likely at this concentration, particularly to bivalve species present in Puget Sound. On the basis of the work group discussion and an associated report (EPA, 1996), an interstitial water concentration of 0.7 ug TBT/L was selected by EPA as the basis for a site-specific sediment trigger level for cleanup in the Hylebos Waterway (Commencement Bay Nearshore/Tideflats Superfund site). This value is not currently proposed as an upper regulatory level for either the PSDDA or SMS programs. For comparison, the EPA proposed draft marine acute water quality criterion has been set at 0.36 ug TBT/L (EPA, 1991).
Tissue Concentrations
In contrast to toxicity levels based on TBT water concentrations, which range over several orders of magnitude for various species, recent studies on tissue concentrations in Puget Sound organisms indicate that a much narrower range of tissue concentrations is associated with adverse effects to these organisms (see citations below). Different species have widely varying uptake, metabolic, and elimination rates for TBT, in part explaining the widely varying sediment and water concentrations that yield similar tissue concentrations and associated effects.
This finding provides an opportunity to develop tissue TBT concentrations that are directly correlated with observed effects in a wide range of ecologically relevant species. Meador et al. (1993; 1996 in press) have reported acute toxicity (LD50s) for Rhepoxynius abronius, Eohaustorius washingtonianus and Armandia brevis at concentrations ranging from 34 - 89 mg TBT/kg body weight (dry weight). Tissue concentrations within or above this range would represent a severe adverse effect and sediments associated with

these levels would exceed the level at which cleanup would be required, and would also be inappropriate for open-water disposal.
However, PSDDA and SMS require consideration of both acute and chronic effects. Chronic effects levels for species of concern in Puget Sound can be found in the literature (Salazar and Salazar, 1992, 1995; Moore et al, 1991; Davies et al., 1987, 1988; Page and Widdows, 1991; Widdows and Page, 1993; Thain et al., 1987; Waldock et al., 1992; Waldock and Thain, 1983; Meador et al., in press; Minchin et al., 1987; Alzieu and Heral; these values typically fall within a range of 2-12 mg TBT/kg body weight (dry weight), with a median value of about 4.
Direct measurements of TBT in tissues of biota collected from the site and in situ bioaccumulation studies are considered promising methods for assessing TBT toxicity, and may be recommended by the agencies to support sediment management decisions. The ranges discussed above provide a starting point for interpretation of bioaccumulation data from dredging projects or cleanup sites,
PSDDA Screening Level for TBT
A review of the existing SL was conducted to evaluate its relationship to known effects levels in water. Butyltins were added to the list of chemicals-of-concern for limited areas in the PSDDA Management Plan Report - Phase II (PSDDA, 1989). At the time of the listing, an interim SL for TBT was established at 30 ug/kg (as Sn). This SL was established using the available information on TBT contamination in Puget Sound and an equilibrium partitioning model that estimated interstitial water concentrations of TBT based on TBT sediment concentrations. In addition, the professional judgment of dredged material decision-makers in other regions of the country was sought in selecting the interim SL.
The interstitial water TBT concentration corresponding to the SL can be calculated using an equilibrium partitioning approach and a representative partitioning coefficient of 25,000 (sd = 5,500) derived from Meador et al. (1996 in press). Assuming a sediment organic carbon content of 2%, the SL of 30 ug/kg TBT (as Sn) corresponds to an interstitial water concentration of 0.06 ug/L TBT (as Sn) or 0.15 ug/L TBT (as TBT). Because there are many uncertainties associated with the original PSDDA SL and with the partitioning approach described above, this proposed interstitial water level was further evaluated based on a comparison to acute and chronic adverse effects levels compiled by EPA (1996).
This concentration is below approximately 2/3 of the chronic effects levels reported in the literature, and is below the entire range of acute effects levels reported in the literature. PSDDA disposal sites have been carefully sited to avoid sensitive habitat areas (such as shellfish growing areas) and most are sited in deep water. For these reasons, many of the chronic impacts to bivalves and other species that would be predicted at lower concentrations are not expected to occur at the disposal sites. This interstitial water level is therefore expected to be protective of acute and most chronic effects, without

being overconservative. Thus, an interstitial water concentration of 0.15 ug/L TBT is appropriate for use as an SL for the PSDDA open-water disposal sites.
Bioassay Testing
Exceedances of the SL for TBT currently trigger the requirement to conduct bioassay testing. The PSDDA bioassays include a 10-day amphipod mortality test, a sediment larval bioassay and the 20-day Neanthes biomass test. Bioassay testing under SMS includes these same bioassays, although Microtox or benthic analysis can be substituted for the biomass test. However, recent project data and evidence from the scientific literature indicate that most or all of the bioassay tests typically used under SMS and PSDDA may not be appropriate for evaluation of TBT toxicity, particularly with the short testing durations routinely used (Meador et al., in press; Moore et al., 1991; Langston and Burt, 1991; Fent, 1996). Most of the bioassay organisms currently used have been demonstrated to show serious acute and chronic toxicity associated with TBT in sediments, but at much longer exposure periods than employed in the standard PSEP bioassay protocols (EPA, 1996; Salazar and Salazar, 1991, 1996).
Results from recent projects (e.g., Puget Sound Naval Shipyard, Commencement Bay, Coos Bay, Harbor Island) would seem to bear out this prediction. Several sites have shown adverse benthic effects in areas with high TBT sediment concentrations, even when acute and/or chronic bioassays did not show adverse effects. In addition, bioaccumulation of TBT and associated adverse effects have been demonstrated at a number of these sites when short-term laboratory bioassays did not show a response. This may be because the longer-term bioaccumulation studies and in situ benthic assemblages better reflect the chronic endpoints with which TBT is associated and include long enough exposure durations for TBT in sediments and water to come into equilibrium with the organisms.
PSDDA Bioaccumulation Testing for TBT
The TBT bioaccumulation trigger was established at 219 ug/kg (as Sn), based on a multiple of the SL (PSDDA, 1989). Bioaccumulation testing is required when this threshold is exceeded. However, using the method described above for the SL, the existing BT corresponds to an interstitial water concentration of 1.07 ug/1 (as TBT). This concentration is well above a level considered protective by the PSDDA agencies and the EPA Superfund work group. Based on the evidence provided above, significant bioaccumulation and adverse effects may occur at much lower concentrations. The interstitial water SL (0.15 ug/L TBT) corresponds to a level above which adverse reproductive and population- level effects due to bioaccumulation of TBT have been observed, and will also be used as the BT.
PROPOSED ACTIONS/MODIFICATIONS
Testing Locations

The SMS program and PSDDA agencies have required testing for TBT in marinas, boat maintenance areas, and other locations where TBT is likely to be present. Sediment testing in Commencement Bay (Thea Foss and Hylebos Waterways), in the Duwamish River, and in Salmon Bay and Lake Union Ship Canal have shown TBT to be present throughout the waterways and at levels substantially above the existing sediment SL. These studies show that TBT is more widely distributed, and at higher levels, than previously thought. For this reason, the SMS and PSDDA agencies will require testing for TBT in areas where past data have demonstrated its presence (particularly urban bays), and at other appropriate project locations where it would be likely to be present, such as marinas shipyards, boatyards, and in the vicinity of large CSOs or treatment plant outfalls. Persons who have evidence that TBT is not present at their project location can ask to have this requirement waived.
TBT Testing Strategy for PSDDA Projects
The available evidence indicates that neither sediment chemistry screening levels nor the existing PSEP bioassay protocols may be as useful in predicting actual environmental effects as measurement of TBT concentrations in interstitial water and tissues. Therefore, the current tiered testing protocol utilizing bulk sediment chemistry and short-term bioassays is not considered appropriate for evaluating the potential adverse effects of TBT. Because of the complexity of TBT speciation in the aquatic environment (including ionic forms) and because other factors may strongly affect its bioavailability, an alternative testing strategy is proposed.
Measurement of TBT in interstitial water provides a more direct measure of potential bioavailability, and hence toxicity, than bulk sediment concentrations. This approach also avoids the difficulties inherent in extrapolating to a sediment cleanup level, particularly where paint wastes or other less bioavailable forms may be present. Therefore, the agencies propose that interstitial water analysis replace bulk sediment analysis as the initial step in a tiered assessment of TBT toxicity for PSDDA projects.
TBT should be analyzed using approved methods as described above, and reported as TBT. A standard method for collection of interstitial water has not yet been determined though several techniques are available. Recommendations for a standardized method will be developed over the next year and discussed at the 1997 SMARM.
If the TBT concentration in the interstitial water is above 0.15 ug TBT/L, bioaccumulation testing of project sediments must be conducted using the PSDDA bioaccumulation guidelines in effect at the time of testing. Acute bioassay testing will not be required (other chemicals of concern may trigger acute toxicity testing). If unacceptable tissue concentrations are measured at the end of the bioaccumulation test, the sediment will be found unsuitable for open-water disposal.
TBT Testing for SMS Cleanup Sites

Although specific regulatory levels corresponding to the SQS and CSL have not yet been promulgated, a similar conceptual approach will be used for evaluation of TBT toxicity at SMS sites. As is typical of cleanup sites, a preponderance of evidence approach may be used rather than a strict tiered testing approach. However, interstitial water data and bioaccumulation (tissue) data will be given more weight in evaluating potential ecological effects than sediment concentrations or short-term bioassay results. Either laboratory or in situ bioaccumulation tests may be employed.
At many sites, bioassay testing will be conducted to evaluate the ecological effects of other chemicals in sediments. To evaluate ecological effects of TBT at these sites, longer-term bioassay/bioaccumulation studies could be considered as alternative chronic tests to those listed in SMS. Such alternative testing approaches may be particularly appropriate when other chemicals are also present that are slow to reach equilibrium in the laboratory, such as dioxins/furans and pesticides. Biological tests that measure both bioaccumulation and associated effects endpoints are recommended to assess the significance of measured tissue concentrations.
At sites where these alternative approaches are used to assess the effects of TBT, site-specific cleanup standards will need to be set based on the interstitial water and tissue effects ranges described in this paper. Consistent with the narrative standards set forth in WAC 173-204-100(3) and (7), site-specific cleanup standards shall include consideration of acute and chronic effects to aquatic organisms and human health, and shall range between no adverse effects and minor adverse effects levels. With respect to TBT, the presence of natural or cultured bivalve growing or collection areas shall be given special consideration in setting protective cleanup standards, since very low levels of TBT in water and sediments are known to adversely affect reproduction and growth of these culturally and economically important resources.
Further Development of Bioassay/Bioaccumulation Tests
Public comments recommended a wide variety of possible bioassay and bioaccumulation test strategies. Recommendations included side-by-side testing of amphipod species to determine relative sensitivity to TBT; use of a 60-day Neanthes bioassay with growth and reproduction endpoints; use of a 20-day Macoma nasuta test with bioaccumulation, tissue growth, and shell growth as endpoints; field-validation of laboratory bioaccumulation tests; use of longer-term larval tests with sensitive organisms such as oysters, mysids, and the copepod Acartia tonsa; and interstitial water bioassays. Although it is not currently within the PSDDA budget to conduct such studies, it may be possible to conduct some studies as part of large cleanup projects or through academic or agency research projects. The PSDDA agencies welcome and will carefully consider any information that is useful in better defining appropriate chronic tests for assessment of TBT and other compounds for which existing short-term bioassays may be inadequate to predict chronic effects.
REFERENCES

Alzieu, C. and M. Heral. 1984. Ecotoxicological effects of organotin compounds on oyster culture, In: Ecotoxicological Testing for the Marine Environment, Vol. 2. G. Persoone, E. Jaspers, and C. Claus, Eds. State University of Ghent, Belgium. 588 pp.
Cardwell, R. 1989. Aquatic ecological and human health risk assessment of tributyltin in Puget Sound and Lake Washington sediments, Prepared by the National Marine Fisheries Service for the PSDDA agencies.
Davies, I.M., J. Drinkwater, and J.C. McKie. 1988. Effects of tributyltin compounds from antifoulants on Pacific oysters Crassostrea gigas in Scottish sea lochs. Aquaculture 74:319-330.
Davies, I.M., J. Drinkwater, J.C. McKie, and P. Balls. 1987. Effects of the use of tributyltin antifoulants in mariculture, In: Proceedings of Oceans '87, International Organotin Symposium 4:1477-1481.
EPA. 1991. Ambient aquatic life water quality criteria for tributyltin. Draft Report. U.S. Environmental Protection Agency, Office of Research and Development, Environmental Research Laboratories, Duluth, MN and Narragansett, RI.
EPA. 1996. Recommendations for screening values for tributyltin in sediments at Superfund sites in Puget Sound, Washington. Prepared for EPA Region 10, Superfund, by Roy F. Weston, Seattle WA.
EPA/USACE. 1994. Evaluation of dredged material proposed for discharge in waters of the U.S. - testing manual (draft). U.S. Environmental Protection Agency, U.S. Army Corps of Engineers.
Fent, K., and J.J. Stegeman. 1993. Effects of tributyltin in vivo on hepatic cytochrome P450 forms in marine fish. Aquatic Toxicology 24:219.
Fent, K. 1996. Ecotoxicology of organotin compounds. Critical Reviews in Toxicology 26: 1.
Krone, C.A., D.W. Brown, D.G. Burrows, R.G. Bogar, S.L. Chan, and U. Varanasi. 1989. A method for analysis of butyltin species in measurement of butyltins in sediment and English sole livers from Puget Sound. Marine Environmental Research 27:1-18.
Langston, W.J. and G.R. Burt. 1991. Bioavailability and effects of sediment-bound TBT in deposit-feeding clams, Scrobicularia plana. Marine Environmental Research 32:61-77.
Matthias, C.L., J.M. Bellama, and F.E. Brinckman. 1986. Comprehensive method for determination of aquatic butyltin and butylmethyltin species at ultratrace levels using simultaneous hybridization/extraction with GC/FPD detection. Environ. Sci. Tech. 20:609-615.

Meador, J.P., U. Varanasi, and C.A. Krone. 1993. Differential sensitivity of marine infaunal amphipods to tributyltin. Marine Biology 116:231-239.
Meador, J.P., C.A. Krone, D.W. Dyer, and U. Varanasi. 1996 (in press). Toxicity of sediment-associated tributyltin to infaunal invertebrates: Species comparison and the role of organic carbon. Marine Environmental Research.
Minchin, D., C.B. Duggan, and W. King. 1987. Possible effects of organotins on scallop recruitment, Marine Pollution Bulletin 18(11):604-608.
Moore, D.W., T.M. Dillon, and B.C. Suedel. 1991. Chronic toxicity of tributyltin to the marine polychaete worm, Neanthes arenaceodentata. Aquat.Toxic. 21:181-198.
Page, D. S. and J. Widdows. 1991. Temporal and spatial variations in levels of alkyltins in mussel tissues: A toxicological interpretation of field data. Marine Environmental Research 32:113-129.
Parametrix. 1995. Long-term national monitoring program for tributyltin and its primary intermediates. Annual Report: Year 3. 1994-1995, Prepared for Elf Atochem North America, Inc. and Witco Corporation by Parametrix, Seattle, WA.
PSDDA. 1988. Evaluation procedures technical appendix. Phase 1. U.S. Army Corps of Engineers, Seattle District; U.S. Environmental Protection Agency, Region X; Washington State Department of Natural Resources; Washington State Department of Ecology.
PSDDA. 1989. Management plan report, Unconfined open-water disposal of dredged material,
Phase II, U.S. Army Corps of Engineers, Seattle District; U.S. Environmental Protection Agency, Region X; Washington State Department of Natural Resources; Washington State Department of Ecology.
PSWQA. 1996. Recommended guidelines for measuring organic compounds in Puget Sound water, sediment, and tissue samples, Prepared by King County Water Pollution Control Division Environmental Laboratory for the Puget Sound Water Quality Authority, Lacey, WA.
Salazar, M.H. and S.M. Salazar. 1996 (in press). Mussels as bioindicators: Effects of TBT on survival, bioaccumulation and growth under natural conditions, In: Tributyltin: Environmental Fate and Effects. M.A. Champ and P.F. Seliman, Eds. Elsevier.
Salazar, M.H. and S.M. Salazar. 1995. In situ bioassays using transplanted mussels: I. Estimating chemical exposure and bioeffects with bioaccumulation and growth. In: Environmental Toxicology and Risk Assessment, 3rd. Vol. J.S. Hughes, G.R. Biddinger
and E. Mones (Eds.). ASTM STP 1218. American Society for Testing and Materials, Philadelphia, PA. pp. 216-241.
Salazar, M.H. and S.M. Salazar. 1992. Mussel field studies: Mortality, growth, and bioaccumulation. In: Tributyltin - Environmental Fate and Effects, Part III. M.A. Champ and P.F. Seligman, Eds. Elsevier.
Salazar, M.H. and S.M. Salazar. 1991. Assessing site-specific effects of TBT contamination with mussel growth rates. Marine Environmental Research 32:131-150.
Thain, J.E., M.J. Waldock, and M.E. Waite. 1987. Toxicity and degradation studies of tributyltin (TBT) and dibutyltin (DBT) in the aquatic environment. In: Proceedings of Oceans '87, Organotin Symposium, 4:1306-1313.
Unger, M.A., W.G. McIntyre, J. Greaves, and R.J. Huggett. 1986. GC determination of butyltins in natural waters by flame photometric detection of hexyl derivatives with mass spectrometric confirmation. Chemosphere 15:461.
Unger, M.A, W.G. McIntyre, and R.J. Huggett. 1987. Equilibrium sorption of tributyltin chloride by Chesapeake Bay sediments, Proceedings of Oceans '87, Organotin Symposium 4:1381-1385. Marine Technology Society, Washington D.C.
Waldock, M.J. and J.E. Thain. 1983. Shell thickening in Crassostrea gigas: Organotin antifouling or sediment induced? Marine Pollution Bulletin 14:411-415.
Waldock, M.J., M.E. Waite, J.E. Thain, and V. Hart. 1992. Improvements in bioindicator performance in UK estuaries following the control of the use of antifouling paints. International Council for Exploration of the Sea, CM1992/E:32.
Widdows, J. and D.S. Page. 1993. Effects of tributyltin and dibutyltin on the physiological energetics of the mussel, Mytilus edulis. Mar. Environ. Res. 35:233-249.
CLARIFICATION PAPER
USE OF ALTERNATE TECHNOLOGIES UNDER THE SEDIMENT MANAGEMENT STANDARDS, CHAPTER 173-204 WAC
Prepared by Brett Betts (Department of Ecology) for the PSDDA agencies.
INTRODUCTION
The PSDDA agencies acknowledged the sensitivity of the Rhepoxynius amphipod test to sediments with high silt content and have used an alternate bioassay, Ampelisca abdita, for dredged material evaluations in such situations. This paper clarifies procedures for approval of alternate technologies, e.g., alternate bioassay tests, under the Sediment Management Standards (SMS), Chapter 173-204 WAC.
PROBLEM IDENTIFICATION
Ecology adopted the SMS in March 1991. The SMS rule identifies narrative procedures and chemical and biological criteria for sediment compliance evaluations. In some cases, the PSDDA agencies or project proponents may seek to additionally comply with the SMS rule requirements when conducting PSDDA dredged material evaluations. Due to the extended timeframes necessary to complete rule adoption/amendment procedures consistent with the SMS triennial rule revisions, the rule may not reflect current state-of-the-art knowledge. This clarification paper documents Ecology requirements for approval and use of alternate technologies under authority of the SMS rule.
PROPOSED ACTION/MODIFICATION
To provide flexibility for use of "best available science", the SMS rule allows for the use of "alternate technologies". Ecology has determined that generic approval of any alternate technology for widespread implementation is not allowed under the requirements of the SMS. Instead the SMS rule instructs Ecology to provide advance review and approval of any alternate technical method proposed prior to its application. Ecology must also maintain files on each approved alternate technology and make them available to the public upon request. Ecology must maintain a public record of:
- Each approval for use of alternate technology;
- Follow-up data reports/results; and
- SMS designation determinations based on the use of the alternate technology.
Ecology approval of any alternate technology will routinely cite use of "best professional judgment" authority to meet the goal of the SMS, i.e., to reduce and ultimately eliminate adverse effects on biological resources and significant health threats to humans. Ecology's approval with also be conditioned on the intent to "replace or enhance the

application of a specific technical method in order to accurately reflect the latest scientific knowledge". Dependent on the specific technology approved by Ecology, specific performance conditions, e.g., bioassay protocols, and interpretation requirements for SMS designation may be required by Ecology.
On a case-by case basis, interested parties seeking approval of "alternate technologies" under the SMS must:
- Provide Ecology a written request and justification documentation for advance review and approval prior to implementation of the alternate technology and
- Provide Ecology with follow-up test results, data reports or conclusionary studies as required by Ecology to document the use and interpretation of the approved alternate technology(s).

Final June 5, 2013
1
DMMP/SMS CLARIFICATION PAPER BIOASSAY ENDPOINT REFINEMENTS: BIVALVE LARVAL AND NEANTHES GROWTH BIOASSAYS Prepared by David Kendall, (U.S. Army Corps of Engineers) and Russ McMillan, (Washington State Department of Ecology) for the DMMP agencies and SMS Program, and Bill Gardiner, Brian Hester, and Jack D Word (NewFields, LLC). INTRODUCTION/BACKGROUND Bioassays are used in the Dredged Material Management Program (DMMP) to evaluate toxicity in sediments proposed for dredging, and in the Sediment Management Standards (SMS) Program to assess toxicity at cleanup sites. Agency decisions based on bioassay results can have significant economic and environmental consequences; therefore it is critical that these tests provide meaningful results. The DMMP and SMS have both relied on an adaptive management approach to examine and adopt improvements to bioassays. Proposed changes are presented for public review as issue or clarification papers through the Sediment Management Annual Review Meeting (SMARM) process. Since PSDDA/DMMP implementation in 1988, a total of twenty-seven changes to existing bioassay protocols having been made though the SMARM process. A complete list of these changes can be found in Table 1. At the 2010 SMARM, potential method modifications to improve the performance of the juvenile Neanthes growth bioassay and the Mytilus galloprovincialis bivalve larval bioassay tests1 were presented (Gardiner, W., 2010). Additional data to further support these method modifications were presented at the 2011 SMARM (Word, J., 2011). Several federal navigation projects have since been used as test cases, as well as results from monitoring at the DMMP disposal site in Port Gardner. Case studies from cleanup areas in Port Gamble are provided to illustrate the effects of bioassay endpoint adjustments relative to reducing false positive results. This clarification paper summarizes the confounding factors associated with these two tests, the proposed methodological revisions to address these confounding factors and the results of side-by-side comparisons of the existing and modified protocols conducted by the DMMP and SMS programs. PROBLEM IDENTIFICATION The purpose of this clarification paper is to provide method modifications intended to reduce the following confounding grain-size effects in the juvenile Neanthes growth bioassay and the Mytilus galloprovincialis bivalve larval test: 1 The DMMP agencies and SMS Program have not evaluated the effects of the resuspension endpoint protocol relative to the Sediment Echinoderm Larval Test (Dendraster excenctricus), but intend to evaluate this endpoint adjustment in the future to assess potential performance improvements to the sediment echinoderm larval test.

Revised Draft: 4/1/13
2
• For the Neanthes growth test, there is considerable variation in weights of animals
at test termination due to sediments retained in the guts of test organisms being unintentionally included in the measured biomass. Organisms ingesting coarse-grained sediment have higher inorganic gut content than those grown in fine-grained sediment.
• For the bivalve larval test, the existing test-termination protocol can lead to poor recovery of normal surviving larvae, artificially elevating the toxicity ascribed to some sediment samples.
For the bivalve larval test, these confounding factors appear to be more of a problem when testing sediments from areas with particularly high contents of clay and fine grained woody material.
Neanthes Growth Test. Background: The Neanthes test provides a chronic measure of toxicity, evaluating the growth of worms over a 20-day exposure period (Peeler, M. 1992). Juvenile worms, early in development, are placed in sediment and fed every two days to promote growth. Worms at the end of the test are dried overnight at 60oC, and then weighed. The performance of reference sediments is evaluated by comparison of growth to that in the negative control sediment (MIGR/MIGC > 0.80%)2. If the performance standard is met, growth in test sediments is then compared to growth in both the reference and control sediments. If the performance standard is not met, test sediments can only be compared to the control.
The Problem: The Neanthes test has been frequently subject to reference performance failures, particularly when testing sediments with a high fines content. Coarse sand is used as the negative control substrate, and retention of coarse sediments in the gut of control worms at the end of the test artificially inflates the growth rate when compared to growth in fine-grained reference and test sediments. Proposed Solution: A simple method of eliminating the bias due to gut content is to use an ash-free dry-weight (AFDW)3 endpoint, which represents the mass of biological tissue after subtracting the weight of inorganic materials present in the gut of animals being tested. It is instructive to note that the following biomass-based tests with sediment “ingesters” already use an AFDW endpoint:
• Chironomus growth test (Sibley et al. 1997) • Neanthes growth test developed by USACE-ERDC (Bridges, T.S, J.D.
Farrar 1997) 2 MIG = mean individual growth rate (mg/individual/day) 3 After determining the dry weight, worms are placed in a muffle furnace @550oC for two hours and the weight of the ashed residue is measured. This weight is then subtracted from the dry weight to determine the ash-free dry weight. See Attachment 1 for more complete protocol description.

Revised Draft: 4/1/13
3
Dry-weight versus AFDW performance - DMMP: The DMMP agencies have conducted side-by-side testing comparing the existing Puget Sound Estuary Program protocol (based on dry weight) and the modified AFDW protocol. This testing has been performed on sediments from three federal O&M projects, including two testing rounds for the Grays Harbor Navigation Channel, and one testing round for the Duwamish Navigation Channel. It was also performed as part of DMMP monitoring at the Port Gardner disposal site in 2010. Side-by-side testing was especially pertinent for the Grays Harbor project, as reference sediment performance failures had been documented there in dredging years 2001, 2005, 2009, 2011 and 2012. Comparison of dry-weight and AFDW measurements in worms exposed to different sediments illustrates the effects of gut-related sediment on the assessment of growth in this bioassay. Figures 1a – d present MIG based on dry weight and AFDW for the four DMMP studies where side-by-side testing was performed. No differences were observed between treatments and reference sediments using either dry-weight or AFDW MIG. However, a large enough difference was observed in dry-weight MIG between control and reference sediments for the two case studies in Grays Harbor for the reference to fail the performance guidelines (Figure 1b-c). The AFDW adjustment improved the performance, but the reference sediment still failed the performance guideline for the 2011 Gray Harbor testing, whereas the AFDW adjustment enabled the reference sediment to meet the performance guideline in the 2012 Grays Harbor testing. In general, the performance of the Neanthes test improved using the AFDW values as compared with the PSEP dry-weight measurements. For these four studies, coarse-grained controls were observed to have an average of 31% of the worm weight attributable to sediments in the gut of the worms, as compared to an average of 20% in reference sediments and 18% in treatment exposures (Figures 2a-d). Dry-weight versus AFDW performance - SMS Program: Ecology evaluated the implementation of the AFDW protocol for the Neanthes growth test during the Port Gamble remedial investigation conducted during the summer of 2011. All 12 of these sediments passed the Neanthes growth test SQS and CSL biological standards for both dry-weight and AFDW measures (Figure 1e). Dry-weight MIG values were consistently higher than those based on AFDW, although the overall difference between dry weight and ash-free dry weight was slightly less than reported for the DMMP program. Coarse-grained sand in the gut contributed 21% of worm weight in the control, and an average of 21% for the three reference sediments. The mean weight contributed by gut contents for the 12 test sediments was 15% and ranged from 7% to 18%, (Figure 2e). Bivalve Larval Test. Background: The existing PSEP bivalve larval sediment bioassay provides a measurement of normal larval development in the presence of sediment. The protocol requires shaking 18 grams of sediment in 900 mL of water and allowing the suspended sediments to settle out over a four hour period. The test is initiated with non-swimming 2-hour-old embryos that develop into swimming larvae with shells. The larvae are

Revised Draft: 4/1/13
4
allowed to develop into D-shell-stage larvae. At the end of the test (~48 hours) the overlying water is gently stirred – without disturbing the sediment at the bottom of the test chamber - then decanted. Aliquots of the decanted water are collected and enumerated, with larvae scored as normal or abnormal. Developmentally-delayed larvae are counted as abnormal. Larvae that have died during testing decompose quickly and are generally not recovered. The Problem: Observations during testing have shown that initial shaking of sediment in the water and settling prior to introducing the embryos results in a stratification of the sediment by grain size. As would be expected, the coarser material settles first, followed by the finer fractions. For some sediments this can result in a substantial layer of fine-grained material that may continue to settle during the first 12-24 hours of the test. The early non-swimming larvae can become buried or entrapped in this layer, which ultimately prevents them from swimming up into the overlying water. These entrapped larvae are then missed when the overlying water is decanted off for counting upon test termination. Entrapment of larvae does not appear to be related to sediment chemistry. Examination of larvae recovered from the flocculent layer has shown them generally to be normal “D-shaped” larvae. Therefore, the loss of these larvae prior to enumeration biases the results. Entrapment of larvae was recognized as an issue early in the development of this bioassay protocol and has been discussed at several workshops held by the DMMP agencies (PSDDA 1989; PSDDA 1990, DMMP 1998). The agencies subsequently attempted to resolve some of the problems with false positives during 1993 methods refinement effort (EPA, 1993), due to presence of suspended sediment in test chambers, and sensitivity to ammonia, and grain size. The results of this effort highlighted and documented the problems, but did not resolve them. Proposed Solution: Bill Gardiner and Brian Hester at NewFields developed a laboratory protocol in 2009 with a step added to the standard PSEP protocol to address the larval entrapment issue. It involves conducting the standard PSEP larval test, but with a modified test-termination procedure. At approximately 42 hours from test initiation, the water, larvae and settled sediment are homogenized by gentle mixing using a perforated plunger. The contents are then allowed to settle until the test is terminated at the test duration indicated in the standard PSEP test method (48 to 60 hours). At test termination, the overlying water is decanted, aliquots are collected, and larvae are enumerated as in the standard protocol. This adjustment allows for the recovery of any larvae trapped in fine sediments or flocculent materials. The full protocol is described in Attachment 1. Protocol Comparison - DMMP: The DMMP agencies evaluated the resuspension protocol using the same studies cited above for the Neanthes test (Port Gardner disposal site monitoring (2010), Grays Harbor O&M testing 2011 & 2012, and Duwamish O&M testing 2011. Generally, use of the resuspension adjustment made little difference in the results of the larval testing Figures 3a-d. However, none of the sediments evaluated within the four case studies had high concentrations of wood waste or fine-grained/
Revised Draft: 4/1/13
5
flocculent material. The only 1-hit response occurred in the Duwamish Waterway O&M characterization and was confirmed by both the PSEP and resuspension protocols (Sample T15 in Figure 3d). Of the eight samples for which 2-hit responses were observed, half were confirmed by both protocols and half scored hits under one protocol but not the other. None of these 2-hit responses were corroborated by the other bioassays in the testing suite (amphipod mortality and Neanthes growth).
Protocol Comparison - SMS Program. Ecology has evaluated the development and application of the resuspension protocol in recent testing of Port Gamble sediments. Outcomes were compared for 31 test sediments ranging from very fine-grained sediments with wood waste to sands with low organics (Figure 4a-b). The greatest increase in the number of recovered normal survivors using the resuspension protocol was generally associated with those samples with higher percent fines and organic matter (Figure 5: Scatterplot of % change in normal survivors vs % fines, Table 2). Comparing the outcome of the resuspension protocol to the PSEP protocol, the following were observed:
• 15 of 31 treatments were unchanged • 8 of 16 SQS exceedances changed to passes • 5 of 6 CSL exceedances changed to passes • 1 of 6 CSL exceedances changed to an SQS exceedance • 2 passes changed to SQS exceedances as a result of improved
reference performance
The improved recovery of normal larvae was seen in 29 of 31 test sediments and in 4 of 6 reference sediments. This supports the conclusion that the resuspension protocol provides an improvement for the bivalve larval bioassay in sediments where entrapment occurs. This potential for entrapment can be partly determined by looking at the percent fines in a sediment, but other factors such as the presence and nature of wood waste should also be considered. It is interesting to note that improved recovery in fine-grained reference sediments reduces the frequency of reference failures and may result in some test sediments failing that would otherwise have passed using the standard PSEP protocol. This occurred for 2 of the 31 test sediments from the Port Gamble case study. PROPOSED CLARIFICATIONS The DMMP agencies and the Sediment Management Standards program propose the following change to the protocol for the Neanthes growth test:
1) Report results on both an ash-free dry-weight basis and on a dry-weight basis. The AFDW procedure eliminates weight from sediment in the gut, thereby providing a more accurate measurement of the change in biomass during the exposure period.
Revised Draft: 4/1/13
6
The DMMP agencies propose the following clarification regarding the sediment bivalve larval test:
2) Substitute the resuspension procedure for the standard PSEP protocol when using the bivalve larval bioassay to test sediments with high concentrations of fines, wood waste or other flocculent material. This decision should be made in coordination with the DMMP agencies. For routine testing of sediments with lower fractions of fines, wood waste or flocculent material, the standard PSEP protocol should be used. However, dredging project proponents may elect to use the resuspension protocol if they have concerns about false positives due to entrapment.
The Sediment Management Standards program proposes the following clarification to the sediment bivalve larval test:
3) Substitute the resuspension procedure for the standard PSEP protocol when using the bivalve larval test to determine compliance with the SMS for sediments with high concentrations of fines, wood waste or other flocculent material. For routine testing of sediments with lower fractions of fines, wood waste or other flocculent material, the standard PSEP protocol will be used. However, Ecology or the PLP may elect to use the resuspension protocol at their discretion if they have concerns about false positives due to larval entrapment.
_______________________________________________________________________ REFERENCES ASTM, 2000. Standard Guide for Conducting Sediment Toxicity Tests with
Polychaetous Annelids. ASTM Designation: E 1611-00, pp. 1-26, Bridges, T.S, J.D. Farrar 1997. The influence of worm age, duration of exposure and
endpoint selection on bioassay sensitivity for Neanthes arenaceodentata (Annelida: Polychaeta). Environmental Toxicology and Chemistry, Vol. 16, No. 8, pp. 1650-1658.
DMMP 1998. Workshop on Regulatory Use of Sediment Larval Toxicity Test Results.
Summary of Workshop proceedings prepared by Dr. Nancy Musgrove under contract to Ecology for the DMMP agencies, Workshop held at Federal Center South, Galaxay Conference Room, January 9, 1998, 126 pp.
EPA, 1993. Refinements of Current PSDDA Bioassays, Final Report Summary, and
Appendices A-C. EPA 910/R-9-93-014b. Prepared by Science Applications International Corporation, Bothell, WA under EPA Contract No. 68-C8-0062 (Work Assignment No. 3-57).

Revised Draft: 4/1/13
7
Gardiner, W. 2010. Bioassay Testing Issues. Public Issue Paper presented by Mr. William Gardiner (Newfields, Inc.) at 2010 Sediment Management Annual Review Meeting, Federal Center South (http://www.nws.usace.army.mil/PublicMenu/documents/DMMO/2010_SMARM_Minutes_Final.pdf).
Peeler, Maria. 1992. Implementation of the Neanthes 20-Day Sediment Bioassay. Issue
Paper, prepared for the PSDDA Agencies. 9 pp. PSEP. 1995. Recommended Guidelines for Conducting Laboratory Bioassays on Puget
Sound Sediments (July 1995 Revisons). Prepared for U.S. Environmental Protection Agency, Region 10, Office of Puget Sound, Seattle, WA. and the Puget Sound Water Quality Authority, P.O. Box 40900, Olympia, WA. 84 pp.
PSDDA. 1989. Sediment Larval Test Expert Workshop. Held at Federal Center South,
Seattle, WA on June 15, 1989, conducted by the PSDDA Agencies. PSDDA. 1990. Bioassay Workshop. Held at Federal Center South, Seattle, WA on July
10, 1990, conducted by the PSDDA Agencies. Sibley, P.K., P.D. Monson, and G.T. Ankley.1997. The effect of gut contents on dry
weight estimates of Chironomus tentans larvae: Implications for interpreting toxicity in freshwater sediment toxicity tests. Environmental Toxicology and Chemistry, Vol. 16, No. 8, pp. 1721-1726.
Word, J. 2011. Update on Larval and Neanthes Test Adjustments. Public Issue Paper
presented by Dr. Jack Word (Newfields, Inc.) at 2011 Sediment Management Annual Review Meeting, Federal Center South (http://www.nws.usace.army.mil/PublicMenu/documents/DMMO/SMARM-2011-Minutes-Final.pdf).

THIS PAGE LEFT INTENTIONALLY BLANK
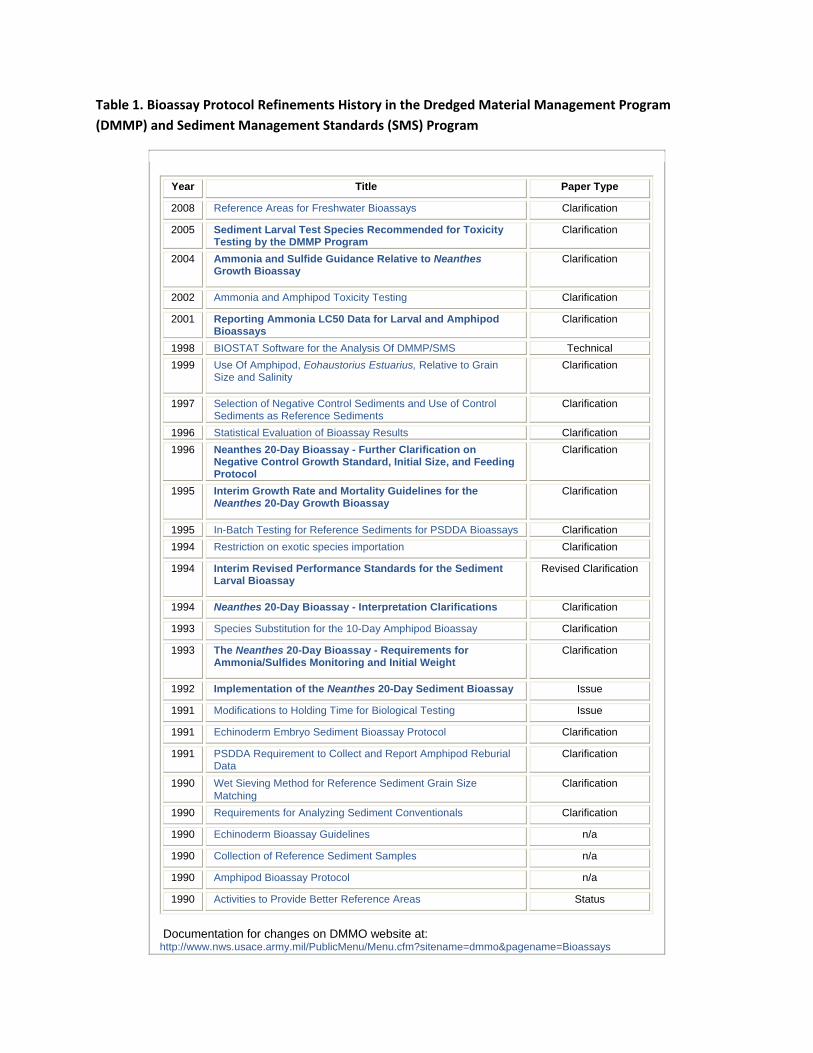
Table 1. Bioassay Protocol Refinements History in the Dredged Material Management Program
(DMMP) and Sediment Management Standards (SMS) Program
Year Title Paper Type
2008 Reference Areas for Freshwater Bioassays Clarification
2005 Sediment Larval Test Species Recommended for Toxicity Testing by the DMMP Program
Clarification
2004 Ammonia and Sulfide Guidance Relative to Neanthes Growth Bioassay
Clarification
2002 Ammonia and Amphipod Toxicity Testing Clarification
2001 Reporting Ammonia LC50 Data for Larval and Amphipod Bioassays
Clarification
1998 BIOSTAT Software for the Analysis Of DMMP/SMS Technical 1999 Use Of Amphipod, Eohaustorius Estuarius, Relative to Grain
Size and Salinity
Clarification
1997 Selection of Negative Control Sediments and Use of Control Sediments as Reference Sediments
Clarification
1996 Statistical Evaluation of Bioassay Results Clarification 1996 Neanthes 20-Day Bioassay - Further Clarification on
Negative Control Growth Standard, Initial Size, and Feeding Protocol
Clarification
1995 Interim Growth Rate and Mortality Guidelines for the Neanthes 20-Day Growth Bioassay
Clarification
1995 In-Batch Testing for Reference Sediments for PSDDA Bioassays Clarification 1994 Restriction on exotic species importation Clarification
1994 Interim Revised Performance Standards for the Sediment Larval Bioassay
Revised Clarification
1994 Neanthes 20-Day Bioassay - Interpretation Clarifications Clarification
1993 Species Substitution for the 10-Day Amphipod Bioassay Clarification
1993 The Neanthes 20-Day Bioassay - Requirements for Ammonia/Sulfides Monitoring and Initial Weight
Clarification
1992 Implementation of the Neanthes 20-Day Sediment Bioassay Issue
1991 Modifications to Holding Time for Biological Testing Issue
1991 Echinoderm Embryo Sediment Bioassay Protocol Clarification
1991 PSDDA Requirement to Collect and Report Amphipod Reburial Data
Clarification
1990 Wet Sieving Method for Reference Sediment Grain Size Matching
Clarification
1990 Requirements for Analyzing Sediment Conventionals Clarification
1990 Echinoderm Bioassay Guidelines n/a
1990 Collection of Reference Sediment Samples n/a
1990 Amphipod Bioassay Protocol n/a
1990 Activities to Provide Better Reference Areas Status
Documentation for changes on DMMO website at: http://www.nws.usace.army.mil/PublicMenu/Menu.cfm?sitename=dmmo&pagename=Bioassays

Table 2. Bivalve Larval Test, Port Gamble Remedial Investigation 2011. Case study comparing of outcomes based on PSEP and Resuspension protocols.
Treatments Percent Fines
Mean Number Normal PSEP*
Mean Number Normal
Resuspension*
Signficance Relative to Reference
Standard Resuspension
PG11‐BW‐01‐S 18.10 81.4 84.3 N** Pass Pass
PG11‐BW‐02‐S 8.80 91.3 81.5 N → S Pass Pass
PG11‐BW‐03‐S 21.10 89.4 78.3 N → S Pass Pass
PG11‐BW‐04‐S 71.00 60.7 84.5 S → N CSL Pass
PG11‐BW‐05‐S 64.30 62.6 88.7 S → N SQS Pass
PG11‐BW‐06‐S 66.20 52.8 90.4 S → N CSL Pass
PG11‐BW‐07‐S 53.80 68.0 87.3 S → N SQS Pass
PG11‐BW‐08‐S 88.20 70.4 84.8 S → N SQS Pass
PG11‐BW‐09‐S 86.40 63.5 83.1 S → N SQS Pass
PG11‐BW‐10‐S 81.20 54.8 86.8 S → N CSL Pass
PG11‐BW‐11‐S 85.70 61.6 69.0 S SQS SQS
PG11‐BW‐12‐S 48.40 64.9 65.2 S SQS SQS
PG11‐BW‐13‐S 87.20 56.1 72.3 S CSL Pass
PG11‐BW‐14‐S 90.00 70.0 79.6 S → N SQS Pass
PG11‐BW‐15‐S 90.10 63.0 69.7 S SQS SQS
PG11‐BW‐16‐S 92.90 66.5 63.2 S SQS SQS
PG11‐BW‐17‐S 30.80 70.9 73.7 S SQS Pass
PG11‐BW‐18‐S 86.40 81.4 84.3 S CSL SQS
PG11‐BW‐19‐S 95.30 91.3 81.5 S SQS SQS
PG11‐BW‐20‐S 96.50 58.7 75.3 S SQS Pass
PG11‐BW‐21‐S 95.30 51.0 72.8 S CSL Pass
PG11‐MS‐01‐S 27.40 72.9 96.6 N Pass Pass
PG11‐MS‐02‐S 18.00 73.3 97.8 N Pass Pass
PG11‐MS‐03‐S 25.50 70.9 88.9 S Pass Pass
PG11‐MS‐04‐S 55.80 66.7 92.6 S → N SQS Pass
PG11‐MS‐05‐S 17.10 75.3 84.0 S Pass Pass
PG11‐MS‐06‐S 50.80 65.1 77.4 S SQS SQS
PG11‐MS‐07‐S 32.70 62.3 75.5 S SQS SQS
PG11‐MS‐08‐S 7.10 76.3 80.2 S → N Pass SQS
PG11‐MS‐09‐S 16.30 63.9 71.6 S SQS SQS
PG11‐MS‐10‐S 38..5 67.5 80.4 S Pass SQS
* Mean Number Normal = Normal Test Sediment/Normal Reference Sediment
**N=Not Significant, S= Significant
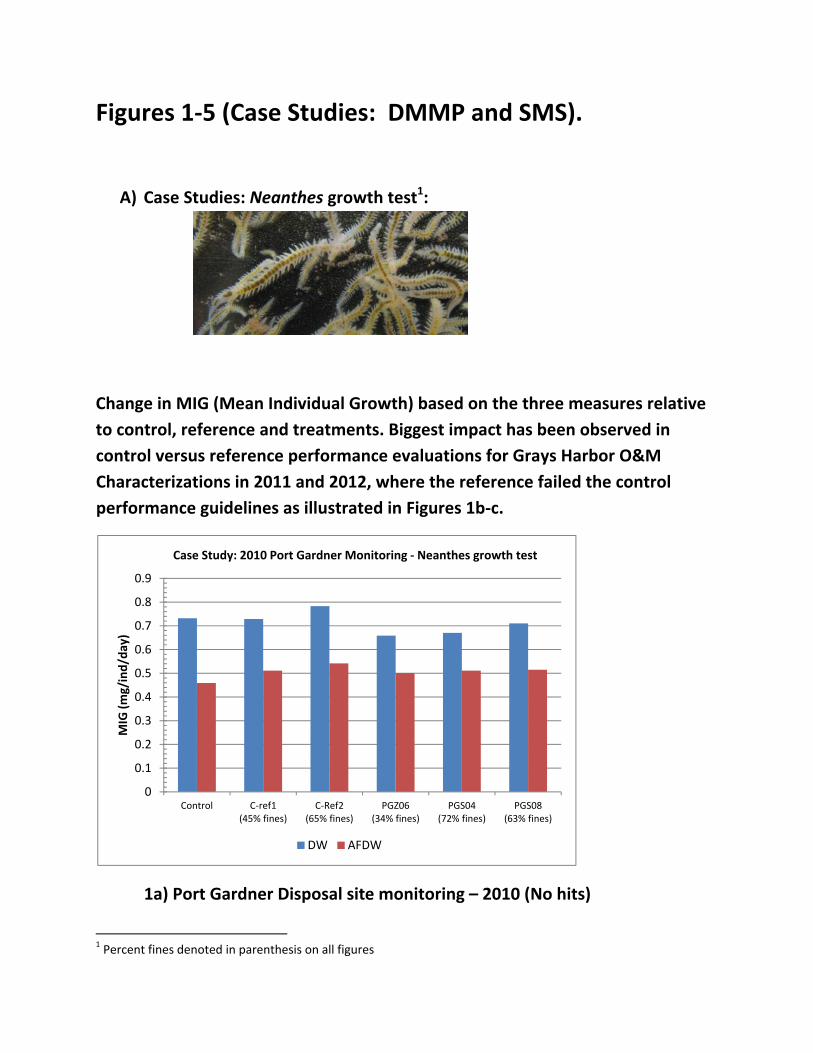
Figures 1‐5 (Case Studies: DMMP and SMS).
A) Case Studies: Neanthes growth test1:
Change in MIG (Mean Individual Growth) based on the three measures relative
to control, reference and treatments. Biggest impact has been observed in
control versus reference performance evaluations for Grays Harbor O&M
Characterizations in 2011 and 2012, where the reference failed the control
performance guidelines as illustrated in Figures 1b‐c.
1a) Port Gardner Disposal site monitoring – 2010 (No hits)
1 Percent fines denoted in parenthesis on all figures
0
0.1
0.2
0.3
0.4
0.5
0.6
0.7
0.8
0.9
Control C‐ref1 (45% fines)
C‐Ref2 (65% fines)
PGZ06 (34% fines)
PGS04 (72% fines)
PGS08 (63% fines)
MIG (mg/ind/day)
Case Study: 2010 Port Gardner Monitoring ‐ Neanthes growth test
DW AFDW

1b) Grays Harbor O&M Characterization – 2011 (No hits)
1c) Grays Harbor O&M Characterization – 2012 (No hits)
0
0.1
0.2
0.3
0.4
0.5
0.6
0.7
Control GH‐ref (78% fines)
HO‐6 (65% fines)
CP‐8 (92% fines)
MIG (mg/ind/day)
Case Study: 2011 Grays Harbor O&M ‐ Neanthes growth test
DW AFDW
0
0.1
0.2
0.3
0.4
0.5
0.6
0.7
0.8
0.9
1
1.1
Control GH‐ref (88% fines)
NC‐10 (39% fines)
AB‐21 (60% fines)
MIG (mg/ind/day)
Case Study: 2012 Grays Harbor O&M ‐ Neanthes growth test
DW AFDW

1d) Duwamish O&M Characterization – 2011 (17 DMMUs characterized)
(No hits)
00.10.20.30.40.50.60.70.80.91
1.11.2
Control CR1 (77% fines)
CR2 (14% fines)
CR3 (48% fines)
T01 (9% fines)
T02 (11% fines)
T03 (17% fines)
T04 (25% fines)
T05 (39% fines)
T06 (25% fines)
T07 (38% fines)
MIG (mg/ind/day)
Case Study: 2011 Duwamish O&M ‐ Neanthes growth test
DW AFDW
00.10.20.30.40.50.60.70.80.91
1.11.2
T08 (57% fines)
T09 (57% fines)
T10 (68% fines)
T11 (58% fines)
T12 (67% fines)
T13 (66% fines)
T14 (57% fines)
T15 (65% fines)
T16 (73% fines)
T17 (67% fines)
MIG (mg/ind/day)
Case Study: 2011 Duwamish O&M ‐ Neanthes growth test (continued)
DW AFDW

Figure 1e. SMS Case Study: Port Gamble RI, 2011 (No SQS Hits).
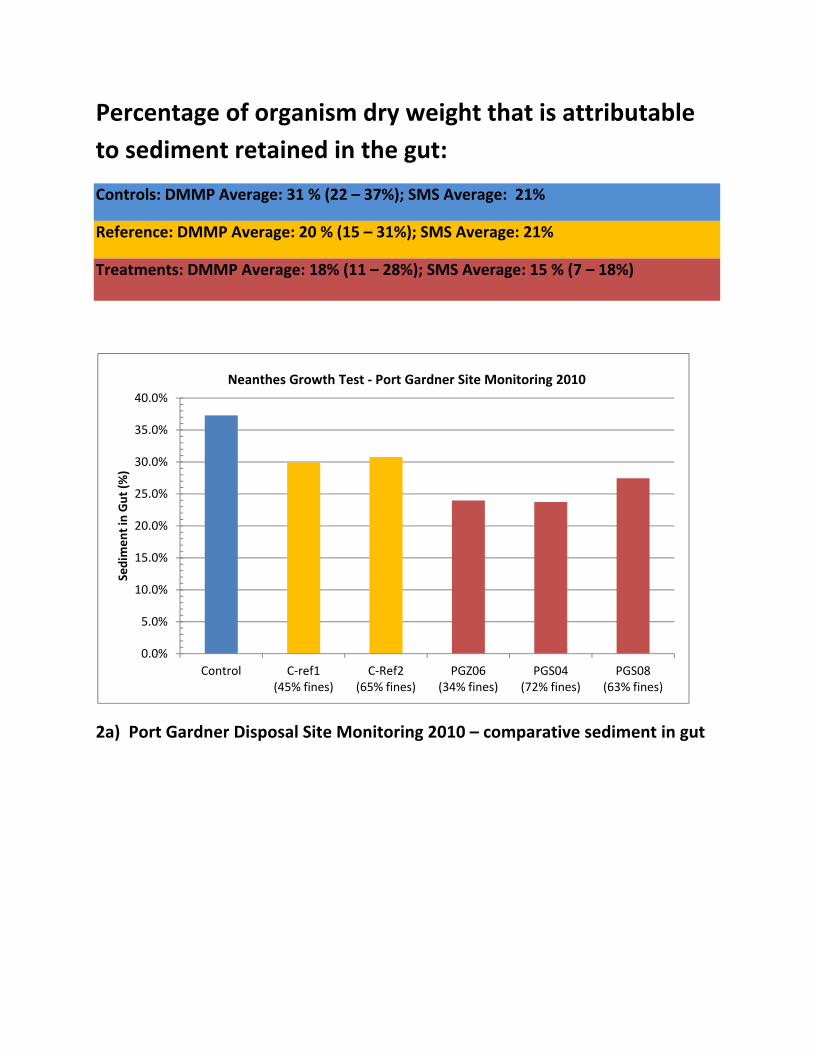
Percentage of organism dry weight that is attributable
to sediment retained in the gut:
Controls: DMMP Average: 31 % (22 – 37%); SMS Average: 21%
Reference: DMMP Average: 20 % (15 – 31%); SMS Average: 21%
Treatments: DMMP Average: 18% (11 – 28%); SMS Average: 15 % (7 – 18%)
2a) Port Gardner Disposal Site Monitoring 2010 – comparative sediment in gut
0.0%
5.0%
10.0%
15.0%
20.0%
25.0%
30.0%
35.0%
40.0%
Control C‐ref1 (45% fines)
C‐Ref2 (65% fines)
PGZ06 (34% fines)
PGS04 (72% fines)
PGS08 (63% fines)
Sedim
ent in Gut (%
)
Neanthes Growth Test ‐ Port Gardner Site Monitoring 2010
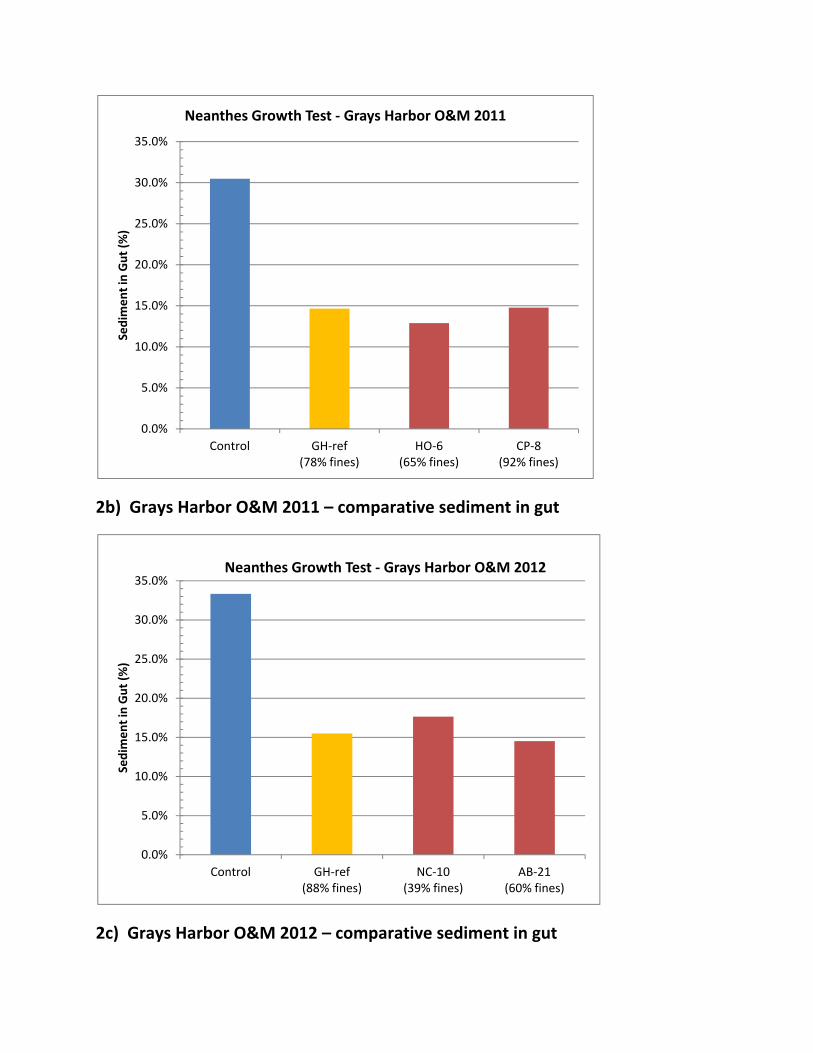
2b) Grays Harbor O&M 2011 – comparative sediment in gut
2c) Grays Harbor O&M 2012 – comparative sediment in gut
0.0%
5.0%
10.0%
15.0%
20.0%
25.0%
30.0%
35.0%
Control GH‐ref (78% fines)
HO‐6 (65% fines)
CP‐8 (92% fines)
Sedim
ent in Gut (%
)Neanthes Growth Test ‐ Grays Harbor O&M 2011
0.0%
5.0%
10.0%
15.0%
20.0%
25.0%
30.0%
35.0%
Control GH‐ref (88% fines)
NC‐10 (39% fines)
AB‐21 (60% fines)
Sedim
ent in Gut (%
)
Neanthes Growth Test ‐ Grays Harbor O&M 2012

2d) Duwamish O&M 2011 – comparative sediment in gut (17 DMMUs total)
0.0%
5.0%
10.0%
15.0%
20.0%
25.0%
Control CR1 (77% fines)
CR2 (14% fines)
CR3 (48% fines)
T01 (9% fines)
T02 (11% fines)
T03 (17% fines)
T04 (25% fines)
T05 (39% fines)
T06 (25% fines)
T07 (38% fines)
Sedim
ent in Gut (%
)Neanthes Growth Test ‐ Duwamish O&M 2011
0.0%
5.0%
10.0%
15.0%
20.0%
25.0%
T08 (57% fines)
T09 (57% fines)
T10 (68% fines)
T11 (58% fines)
T12 (67% fines)
T13 (66% fines)
T14 (57% fines)
T15 (65% fines)
T16 (73% fines)
T17 (67% fines)
Sedim
ent in Gut (%
)
Neanthes Growth Test ‐ Duwamish O&M 2011 (continued)

2e) SMS‐Port Gamble, RI – 2011 – comparative sediment in gut
0.0%
5.0%
10.0%
15.0%
20.0%
25.0%
Control CI‐01 (6.1%)
CI‐02 (42.7%)
CI‐03 (77.7%)
MS‐09 (16.3%)
MS‐05 (17.1%)
MS‐02 (18.0%)
MS‐10 (38.5%)
MS‐04 (55.8%)
BW‐09 (86.4%)
BW‐13 (87.2%)
BW‐08 (88.2%)
BW‐15 (90.1%)
BW‐19 (95.3%)
BW‐21 (95.3%)
BW‐20 (96.5%)
Sedim
ent in Gut (%
)Neanthes Growth Test ‐ Port Gamble ‐ 2011
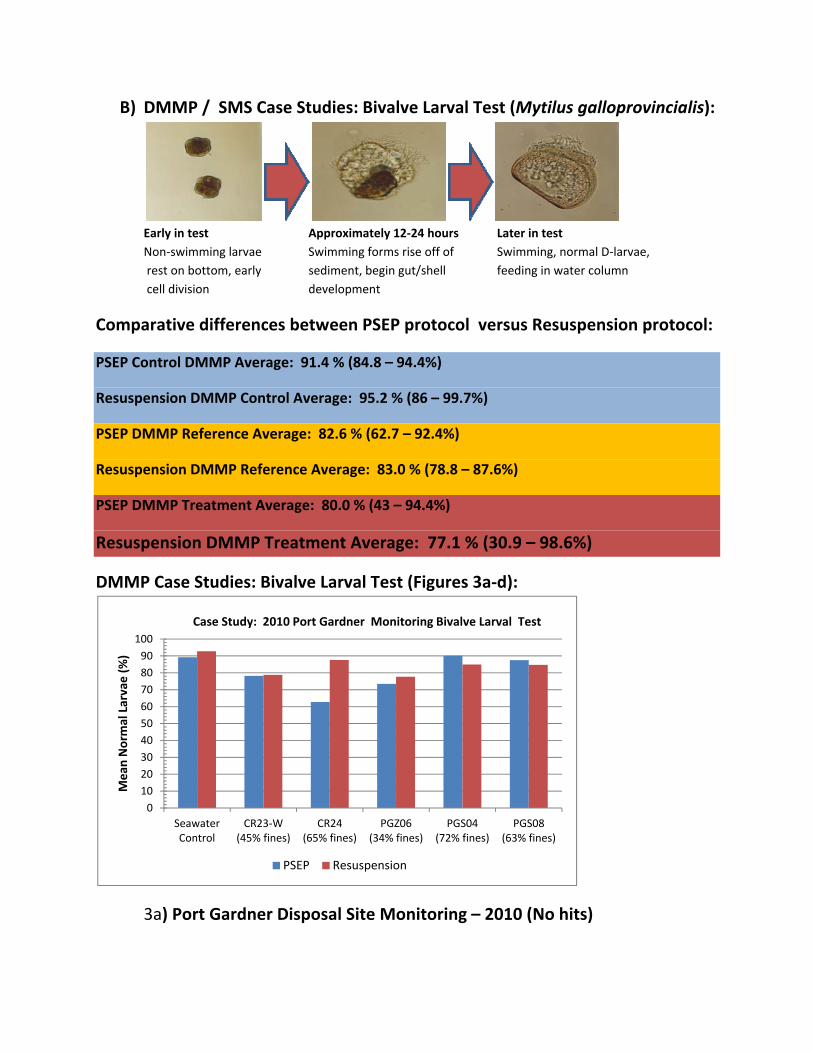
B) DMMP / SMS Case Studies: Bivalve Larval Test (Mytilus galloprovincialis):
Early in test Approximately 12‐24 hours Later in test
Non‐swimming larvae Swimming forms rise off of Swimming, normal D‐larvae,
rest on bottom, early sediment, begin gut/shell feeding in water column
cell division development
Comparative differences between PSEP protocol versus Resuspension protocol:
PSEP Control DMMP Average: 91.4 % (84.8 – 94.4%)
Resuspension DMMP Control Average: 95.2 % (86 – 99.7%)
PSEP DMMP Reference Average: 82.6 % (62.7 – 92.4%)
Resuspension DMMP Reference Average: 83.0 % (78.8 – 87.6%)
PSEP DMMP Treatment Average: 80.0 % (43 – 94.4%)
Resuspension DMMP Treatment Average: 77.1 % (30.9 – 98.6%)
DMMP Case Studies: Bivalve Larval Test (Figures 3a‐d):
3a) Port Gardner Disposal Site Monitoring – 2010 (No hits)
0
10
20
30
40
50
60
70
80
90
100
Seawater Control
CR23‐W (45% fines)
CR24 (65% fines)
PGZ06 (34% fines)
PGS04 (72% fines)
PGS08 (63% fines)
Mean
Norm
al Larvae (%)
Case Study: 2010 Port Gardner Monitoring Bivalve Larval Test
PSEP Resuspension
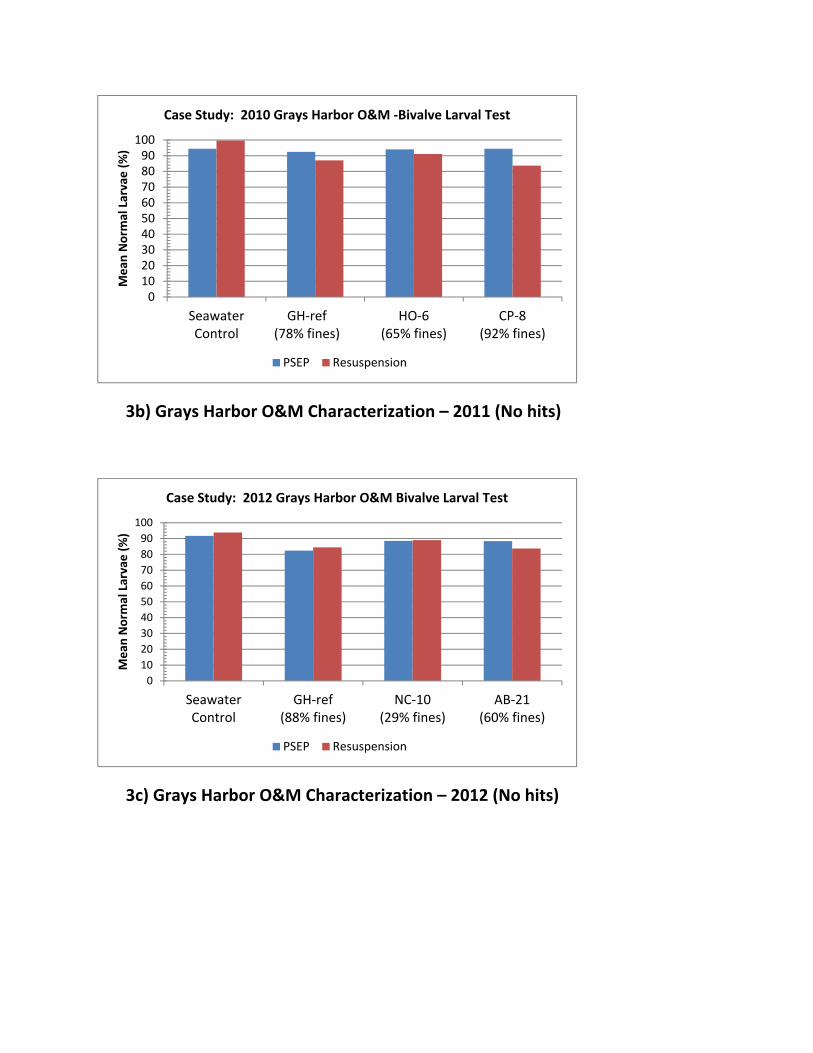
3b) Grays Harbor O&M Characterization – 2011 (No hits)
3c) Grays Harbor O&M Characterization – 2012 (No hits)
0102030405060708090
100
Seawater Control
GH‐ref (78% fines)
HO‐6 (65% fines)
CP‐8 (92% fines)
Mean
Norm
al Larvae (%)
Case Study: 2010 Grays Harbor O&M ‐Bivalve Larval Test
PSEP Resuspension
0
10
20
30
40
50
60
70
80
90
100
Seawater Control
GH‐ref (88% fines)
NC‐10 (29% fines)
AB‐21 (60% fines)
Mean
Norm
al Larvae (%)
Case Study: 2012 Grays Harbor O&M Bivalve Larval Test
PSEP Resuspension

3d) Duwamish O&M Characterization – 2011 (2‐hit responses observed for
either PSEP and resuspension protocol did not change the overall bioassay
interpretation relative to DMMP guidelines, as there were no other
corroborating hits from other two bioassays (Amphipod and Neanthes). Only
DMMU‐15 failed based on 1‐hit responses from both protocols.)

Figure 4a‐b. SMS Case Study Port Gamble Remedial Investigation Study, 2011,
comparing outcomes from PSEP and Resuspension protocols (See Table 2 for
interpretation outcomes for testing results).

40
50
60
70
80
90
100
0 10 20 30 40 50 60 70 80 90 100
% Norm
al PSEP/Resuspension
% Fines
Figure 5. Scatterplot of % Fines versus PSEP and Resuspension Protocol (Port Gamble Remedial Investigation 2011), Bivalve Larval Bioassay
PSEP Resuspension Linear (PSEP) Linear (Resuspension)

THIS PAGE LEFT INTENTIONALLY BLANK
Attachment 1 (Revised: 4/1/13).
A) Neanthes Growth Bioassay – Ash-Free Dry Weight (AFDW) Protocol
Ash-free dry weight (AFDW) represents the mass of biological tissues without the weight of inorganic materials (e.g. sediment) in the gut of worms. In order to determine the AFDW for the 20-day Neanthes growth bioassay, the following procedures should be followed:
1. Terminate each test chamber as indicated in the standard PSEP method; 2. Rinse sediment off of test organisms and place all worms from each test
chamber into a labeled, pre-ashed (5500C for 2 hours), and tared aluminum weigh boat (note that weigh boat should be labeled in a manner that will not be removed in the ashing process, e.g. etching);
3. Dry tissues for 24 hours at 600C; 4. Measure and record “dry weight”; 5. Bake tissues in Muffle Furnace at 5500C for 2 hours to remove all tissues; 6. Using forceps, transfer weigh boats to a dessicator to allow contents to cool; 7. Using a microbalance, measure and record the “Ashed Weight” (Weight of all
inorganic material); 8. Subtract the ashed weight from dry weight to determine the ash-free dry
weight; and, 9. Both dry weight and AFDW should be reported.
B) Bivalve-Larval Resuspension Termination Protocol- The purpose of the larval resuspension method is to account for any larvae that may be buried in significant layers of sediment on the bottom. In reference or test sediments, the exclusion of larvae may result in reference failure or false positives. The resuspension test is initiated and conducted in a manner similar to the standard PSEP method. As with the standard PSEP method, the test is terminated when approximately 95 percent of the embryos in the seawater control have reached the prodissoconch I stage, 48 to 60 hours after test initiation. For the resuspension termination protocol, the contents of the test chamber are gently resuspended using a perforated plunger at approximately 42 hours from test initiation. The test is then terminated in a manner consistent with the standard method, when 95% of the control larvae have achieved the prodissoconch I stage.

The bioassay is terminated in the following manner. 1. The bivalve larval resuspension test is terminated when development in
the seawater controls is approximately 95% prodissoconch I; 2. At approximately 42 hours from test initiation, gently resuspend the
contents of each test chamber using a perforated plunger. Mix for approximately 10 seconds or until the water, larvae, and settled sediment are resuspended in each container. Care should be taken to rinse the plunger between test chambers to prevent the transfer of larvae. Note the time that resuspension was initiated for the test.
3. Control and reference treatments should also be mixed at this time. 4. The test is terminated following the protocol presented in the standard
PSEP method: a. The test is terminated at 48 to 60 hours, when approximately 95%
of the surviving larvae in the controls have developed into D-shaped, prodissoconch I larvae.
b. carefully pour the water overlying the sediment into a clean 1-liter beaker;
c. mix the decanted water with a perforated plunger; d. collect 10-mL aliquots of the well-mixed sample by calibrated
pipette and place in 20-25 ml sealable shell or scintillation vials; and,
e. The contents of each vial are preserved with 0.5- 1mL of 5-percent buffered formalin or equilvalent.

9/21/2008 - Final
DMMP CLARIFICATION PAPER REFERENCE AREAS FOR FRESHWATER BIOASSAYS Prepared by Stephanie Stirling (U. S. Army Corps of Engineers) and the RSET Bioassay Subcommittee for the DMMP agencies. Introduction/Problem identification The DMMP program has identified a number of sites that are suitable for the collection of reference sediments for marine bioassays (PSEP1991). Suitable clean reference sites have not been identified for freshwater bioassays. The Regional Sediment Evaluation Team’s Bioassay subcommittee has developed an approach for identifying suitable freshwater reference sites. This approach is explained in the attached white paper “Presentation of Process for Reference Sediment Area Identification,” prepared by Dr. Taku Fuji and Tom Pinit of Kennedy/Jenks Consultants. Proposed Clarification Most of the DMMP agencies are represented on the RSET Bioassay Subcommittee. Because not all RSET stakeholders have been actively involved in Bioassay Subcommittee activities, the agencies are clarifying certain aspects of RSET that will apply to DMMP activities. The DMMP program will be recommending the approach outlined in the RSET white paper for the identification and selection of reference sites when needed for freshwater bioassays. However, the DMMP program has no plans to identify freshwater reference sites as they have for the marine waters; the different sediment requirements for individual watersheds and the relatively few freshwater projects that the DMMP reviews does not make it cost-effective to undertake this process at this time. References PSEP 1991. Reference Area Performance Standards for Puget Sound. EPA document number 910/9-91-041

9/21/2008 - Final
DRAFT RSET WHITE PAPER – Presentation of Process for Reference Sediment Area Identification
BIOLOGICAL TESTING SUBCOMMITTEE, T. Fuji, Ph.D., Chair mailto:[email protected]; February 5, 2008 QUESTION/ISSUE: Is there a recommended process to follow to identify potential sediment reference areas for use in biological testing programs? DISCUSSION: This Draft White Paper presents a methodology for identifying and selecting sediment reference areas for use in sediment bioassay and bioaccumulation testing programs. This methodology would be most useful when applied to projects in geographic areas currently lacking established, reliable reference sediment areas. However, the general concepts that are discussed in this White Paper should also be useful for assisting in the identification of reference areas for specific projects.
Reference sediment was previously defined in the Dredged Material Evaluation Framework (DMEF, 1998) as a “whole sediment used to assess sediment conditions that are similar as practicable to the grain size and total organic carbon (TOC) of the dredged material but is free from contamination”. The Puget Sound Estuary Program (PSEP) Guidance on Sediment Bioassays (PSEP, 1995) describes the following use of reference sediments within a sediment bioassay program. “Laboratory negative control sediments generally are those from which infaunal test animals (e.g., amphipods) were collected. As such, physical and chemical sediment characteristics may be very different from those of the test sediments. Reference sediments can provide data that can be used to separate toxicant effects from unrelated effects such as those of sediment grain size (PSEP, 1995)”. The reference sediment must be tested in the same batch as the test sediment and the results are used to interpret the bioassay results in accordance with established biological testing interpretive criteria (SEF, 2006).
It is important to distinguish “background sediment” from “reference sediment” for the purpose of this White Paper. While in some cases “background” areas may be the same as “reference” areas, their use within specific regulatory programs are different. Washington State has two definitions of background in their administrative code (Washington Administrative Code [WAC] 173-340-200); (1) "Area background" means the concentrations of hazardous substances that are consistently present in the environment in the vicinity of a site which are the result of human activities unrelated to releases from that site, and (2) "Natural background" means the concentration of hazardous substances consistently present in the environment that have not been influenced by localized human activities. The State of Oregon does not have rules specific to sediment background concentrations or the selection of sediment reference sites. Generally, the Department of Environmental Quality’s (DEQ) approach for determining appropriate reference sites for bioassay comparison is to focus on physical similarities between the test sediment and sediment in the reference location and make sure the reference location is not contaminated. “Reference areas” as discussed in this White Paper are consistent with the WAC definition of “natural background”.

9/21/2008 - Final
The process described herein was developed to identify three potential freshwater reference sediment areas based on grain size characteristics within the Portland Harbor on the Lower Willamette River (LWR) for the U.S. Army Corps of Engineers (Hart Crowser, 2002). The reference area selection process described in this Draft White Paper is based on procedures used to select reference area locations for the Puget Sound Dredged Disposal Analysis (PSDDA) program (PTI, 1991) and the Grays Harbor and Willapa Bay, Washington Dredged Material Evaluation Procedures and Disposal Site Management Manual (Corps, 1995). The RSET Biological Testing Subcommittee has reviewed these procedures and recommends their use in identifying sediment reference areas for biological testing as discussed in the SEF.
This reference area selection process was designed to identify locations that meet specific grain size ranges and organic carbon concentrations characteristic of the test sediments. The process was designed to be conducted in two phases; a Phase I reconnaissance survey to evaluate potential reference areas by limited chemical and conventional sediment parameter analyses, and a Phase II focused evaluation of a subset of candidate reference areas by comprehensive chemical and biological testing (i.e., full suite of SEF chemicals of concern and biological testing using the amphipod Hyalella azteca and the midge Chironomus tentans). Additionally, for Phase II, if bioaccumulation testing is expected, a 28-day bioaccumulation test using the worm Lumbriculus variegates is recommended to establish baseline data. An alternative freshwater species for bioaccumulation testing that is being considered by RSET is the clam Corbicula fluminea and the use of this species for establishing baseline data should be discussed with the appropriate regulatory agency prior to test initiation. Sampling and testing are to be performed in a manner consistent with applicable federal and regional guidance documents (Ecology, 1995, EPA/Corps, 1998, and DMEF, 1998). The Phase I and Phase II reference sediment selection process is illustrated on the following flow chart.

9/21/2008 - Final

9/21/2008 - Final
Phase I Reconnaissance
The objective of the Phase I reconnaissance survey is to screen potential locations for suitability as reference areas based on conventional sediment parameters and lack of chemical contamination. Surface (0 to 10 centimeters [cm]) sediment samples are collected that target conventional parameter ranges representative of those found in the test sediments.
Phase I involves a reconnaissance of potential reference sediment locations that are unlikely to be impacted by known contamination sources (e.g. identified clean-up sites or large municipal discharges), those believed to be hydraulically stable to permit long-term utilization (i.e., no appreciable erosion or accretion), those that exhibit preliminary grain size characteristics determined in the field by wet-sieving, those with comparable total organic carbon (TOC) content, and those with low levels of total ammonia and sulfides in sediment pore water. Ammonia and sulfides have been selected for Phase I analysis as these constituents have been identified as potentially important confounding factors for sediment bioassays. Threshold levels of concern for these constituents are available for marine/estuarine tests (Barton, 2002; Fox, 1993 and Kendall and Barton, 2004). Similar thresholds have not been established for freshwater bioassays at this time but available thresholds can be used to provide a general evaluation of pore water concentrations of these constituents.
Wet-sieving can be performed in the field using a standard No. 230 mesh, 63-um-opening sieve to obtain a rough estimate of grain size. A 50-ml aliquot of reference sediment is washed through the sieve mesh. The sediment that passes through the sieve is classified as the fine-grained (silt/clay) particle fraction, and the sediment remaining on the sieve is the coarse-grained (sand/gravel) fraction. Sediment should continue to be washed until the water passing through the sieve runs clear. The remaining coarse fraction is then emptied into a 100-ml graduated cylinder for measurement. Subtracting the remaining coarse fraction volume from the initial 50-ml volume yields the fine-grained fraction volume. Dividing the fine-grained volume by the initial 50-ml volume yields the “percent fines”. Percent fines ranges can then be compared between reference and test sediments to determine similar grain sizes. Detailed information on wet-sieving protocols can be found in EPA (2000) guidance.
To assist in the identification of potential in-water areas away from known sources of contamination, there are databases available that provide a listing of identified sites in both Oregon and Washington. In Oregon, these include: Oregon Department of Environmental Quality (DEQ) Facility Profiler, the Environmental Cleanup Site Information Database (ECSI), as well as Underground Storage Tank (UST) and Leaking Underground Storage Tank (LUST) databases. In Washington, an Environmental Information Management System (EIMS) is being developed that will provide similar information in a single database. In addition, local city or county offices should be contacted to identify locations of major outfalls in the region. Based on the initial reconnaissance, a number of potential reference sediment areas are identified.
Each of the potential reference sediment areas are then subject to a limited suite of conventional parameter and chemical analyses, including laboratory grain size analysis, TOC,

9/21/2008 - Final
total ammonia and sulfides (in pore water), total petroleum hydrocarbons (NW-TPH), pesticides, and total polychlorinated biphenyls (PCBs).
Phase II Testing
The results of the Phase I sediment sampling are used to recommend a subset of reference areas for follow-up comprehensive chemical and biological testing (Phase II). To select candidate Phase II sampling locations, a decision matrix based on the four characteristics identified to prioritize Phase II sample locations is used. Ideally, candidate reference areas selected for further analysis in Phase II should be those shown to be substantially free of anthropogenic contaminants, those believed to be stable to permit long-term utilization (i.e., no appreciable erosion or accretion), those that matched the target grain size and organic carbon characteristics identified in the test sediments, and acceptable concentrations of ammonia and sulfide in pore water.
For the decision matrix presented below as an example, the sediment samples from each of the three target grain size ranges were evaluated with regard to each of the four characteristics and given a subjective score (based on a scale of 1 through 5, with 5 indicating the highest match with program objectives). For instance, under the analytical chemistry characteristic, all sediment samples received the highest score of 5 because none exhibited any anthropogenic contamination. For the stability characteristic, the samples collected from coves or other quiescent areas received a higher score than samples collected within or adjacent to the main channel of the river. For both the grain size and TOC characteristics, the scores were based on how closely the Phase I sediment samples matched the target grain size/TOC range.
Phase II testing further focused the process by selecting specific candidate areas from the potential reference area locations sampled in Phase I. For the Lower Willamette project, each of the candidate areas represented one grain size class, i.e. coarse, medium, fine (these grain size targets will vary with specific project objectives). Within each of the grain size classes, the candidate sediment area selected was based on limited Phase I analytical chemistry results (TPH, pesticides, PCBs) with non-detects or lowest detected concentrations. Given the limited chemical analyte list, the subjective scoring (1 to 5) for this criterion would be based on number of detected chemicals in reference sediments and the relative concentrations between potential reference sediments. Finally, each candidate area within a grain size class was preferentially selected based on more stable hydrologic conditions, such as back eddies, coves, or other quiescent areas off the main LWR channel.
The example decision matrix below illustrates how selection of one candidate area within each specified grain size class can be facilitated. Phase I potential reference locations are listed across the top of the matrix, with 4 decision criteria listed along the left-hand side of the matrix. Each of the samples is subjectively ranked on a scale of 1 to 5 per decision criterion, with 5 indicating the highest match with program objectives.

9/21/2008 - Final
Example Decision Matrix for Fine-grained Phase I Samples
Sample IDs
REF-A REF-B REF-C
Analytical Chemistry
5 5 5
Stability of Location 3 4 5
Grain Size Match 4 5 3
TOC Match 5 4 3
Total Score 17 18 16
In this example, REF-B would be the selected reference candidate area for the fine-grained size class, based on the summed rankings indicating: non-detect or lowest chemical concentrations (5); second-best sediment stability (4); best grain size match to targeted class (5); and second-best TOC concentration match to test sediments (4). This decision matrix process would be repeated for the medium-grained and coarse-grained size class samples.
Once the candidate reference areas are identified through the decision matrix process, one surface sediment sample is collected from each area. These Phase II sediment samples are analyzed for the full SEF Chemicals of Concern (COC) list, including:
• Metals (Sb, As, Cd, Cu, Hg, Ni, Ag, Zn) • Polycyclic aromatic hydrocarbons (PAHs) • Semivolatile organic compounds (SVOCs) • Some chlorinated hydrocarbons • Pesticides • PCBs • Porewater tributyltin (TBT) • Total sulfides • TOC • Grain size
Sediment chemistry results are screened against appropriate screening guidelines depending on whether the reference sediments represent freshwater or estuarine/marine conditions. SEF (2006) screening levels (SLs) can be used to determine whether chemical concentrations exceed conservative levels of concern in marine/estuarine sediments. For freshwater sediments, it is envisioned that the upcoming Freshwater Sediment Quality Guidelines would
9/21/2008 - Final
be used for the purpose of a chemistry screen. The Phase II candidate reference area samples are subjected to bioassay testing evaluating lethal and sublethal endpoints. Again, depending on whether this project is being conducted on freshwater or marine/estuarine sediments will determine the appropriate sets of sediment bioassays to select. For the specific example being discussed in this Draft White Paper, the following freshwater bioassays were selected; 10-day Hyalella azteca amphipod survival and 10-day Chironomus tentans midge survival and growth tests. Bioassay sediment toxicity was determined based on specified freshwater interpretive criteria in the SEF. It should be noted that specific regulatory programs may require the use of longer term freshwater bioassays (i.e., 28-day Hyalella azteca amphipod survival and growth test and the 20-day Chironomus tentans midge survival and growth test). If bioaccumulation testing is expected, preliminary bioaccumulation testing should be conducted on the proposed reference sediments to establish baseline conditions and determine whether the reference sediments are resulting in statistically significant accumulation in test organisms. Again, as this example Lower Willamette River project was for freshwater sediments, the bioaccumulation testing program used freshwater protocols (28-day Lumbriculus variegatus and Corbicula fluminea bioaccumulation tests). As stated previously, Lumbriculus variegates is the standard freshwater bioaccumulation test species and the use of the bivalve, Corbicula fluminea, would need to be approved by the appropriate regulatory agency prior to test initiation. A paired one-tailed Student’s-t test (p < 0.05) was conducted on Day 0 and Day 28 tissue concentrations to evaluate the statistical difference between the two concentrations, i.e. whether significant bioaccumulation had occurred over the 28-day test period. For marine/estuarine sediments, the standard marine/estuarine bioaccumulation testing protocols should be used. The Bioaccumulative Chemicals of Concern List (BCOC) list presented in the SEF should be used as the analytical program for the bioaccumulation testing. Summary
The selection process described above allows for the systematic identification of candidate reference sediment areas for a given water body or watershed. The process is particularly useful for those projects in geographic areas currently lacking established, reliable reference areas. Final selection should target locations that match grain size and organic carbon characteristics of the test sediments, those shown to be substantially free of anthropogenic contaminants and that are as stable as possible to permit long-term utilization (i.e., no appreciable erosion or accretion). REFERENCES: Barton, J., 2002. Ammonia and Amphipod Toxicity Testing. DMMP Clarification Paper. June 15, 2002. http://www.nws.usace.army.mil/publicmenu/DOCUMENTS/dmmo/AmphAmmoniaClar20021.pdf Corps, 1995. Dredged Material Evaluation Procedures and Disposal Site Management

9/21/2008 - Final
Manual; Grays Harbor and Willapa Bay, Washington. June 1995. DMEF. 1998. Dredged Material Evaluation Framework-Lower Columbia River Management Area. U.S. Environmental Protection Agency Region 10, U.S. Army Corps of Engineers Northwestern Division (Portland and Seattle District), Washington State Department of Ecology, Oregon Department of Environmental Quality, and Washington State Department of Natural Resources. Ecology, 1995. Guidance on the Development of Sediment Sampling and Analysis Plans Meeting the Requirements of the Sediment Management Standards (Chapter 173-204 WAC). Washington Department of Ecology. December 1995. EPA, 2000. Estuarine & Coastal Marine Waters: Bioassessment & Biocriteria Guidance. EPA-822-B-00-024. December 2000.
EPA/Corps, 1998. Evaluation of Dredged Material Proposed for Discharge in Waters of the U.S – Inland Testing Manual. March 1998.
Fox, D. 1993. The Neanthes 20-Day Bioassay – Requirements for Ammonia/Sulfides Monitoring and Initial Weight. DMMP Clarification Paper. March, 28, 2002. http://www.nws.usace.army.mil/publicmenu/DOCUMENTS/dmmo/ACF559.pdf
Hart Crowser, 2002. Lower Willamette River Reference Area Study, U.S. Army Corps of Engineers, Portland, Oregon. April 9, 2002.
Kendall,D. and J. Barton, 2004. Ammonia and Sulfides Guidance Relative to Neanthes Growth Bioassay. DMMP Clarification Paper. June 14, 2004. http://www.nws.usace.army.mil/publicmenu/DOCUMENTS/dmmo/Ammonia-Neanthes-04-final1.pdf
PSEP, 1995. Recommended Guidelines for Conducting Bioassays on Puget Sound Sediments. U.S. EPA Region 10 and Puget Sound Water Quality Authority. Revised July 1995.
PTI, 1991. Reference Area Performance Standards for Puget Sound. Prepared for EPA Region 10 and Washington Department of Ecology. September 1991. SEF, 2006. Sediment Evaluation Framework for the Pacific Northwest – interim Final. September 2006. RECOMMENDATION: The BTS proposes including the reference sediment area selection process described in this Draft White Paper in the Revised Interim Final SEF. LIST OF PREPARERS: Taku Fuji, Ph.D., Tom Pinit, Kennedy/Jenks Consultants

Final: 10/17//05
DMMP CLARIFICATION PAPER SEDIMENT LARVAL TEST SPECIES RECOMMENDED FOR TOXICITY TESTING BY THE DMMP PROGRAM Prepared by David Kendall, (U.S. Army Corps of Engineers) for the DMMP agencies. INTRODUCTION Bioassays are used in the Dredged Material Management Program (DMMP) to evaluate toxicity in sediments proposed for dredging. The Sediment Larval bioassay has been an important part of the biological test suite of the DMMP over the past 16 years. Test species initially recommended for potential selection include three echinoderm species (Dendraster excentricus, Stongylocentrotus purpuratus, Strongylocentrotus droebachienis) and two bivalve species (Mytilus galloprovincialis and Crassostrea gigas). The DMMP has always provided for use of practical experience and adaptive management to revise existing technical and policy guidance. PROBLEM IDENTIFICATION Practical experience with the performance of the sediment larval bioassay over the sixteen years of DMMP implementation have resulted in some necessary adaptive management recommendations regarding species selection recommendations. During PSDDA/DMMP implementation, three of the five recommended larval species have consistently shown limited use for making DMMP open-water disposal decisions. Data from tests using the bivalve, Crassostrea gigas, or the sea urchins, Strongylocentrotus purpuratus, and Strongylocentrotus droebrachiensis has been limited because the negative seawater control and reference sediment(s) frequently failed to meet programmatic performance guidelines for data acceptability. This has consistently limited the usability of toxicity data involving these species to make DMMP open-water disposal decisions. These performance problems have frequently resulted in a requirement to retest with largely unsuccessful results. Because of frequent performance problems with these species, the DMMP have informally stopped recommending their use for the sediment larval bioassay test. In practice, the DMMP are now relying on either the bivalve, Mytilus galloprovincialis, or the sand dollar, Dendraster excentricus for test species recommendations. PROPOSED CLARIFICATION
1. The DMMP propose to clarify the species recommended for routine use for the Sediment Larval Bioassay. The two recommended species are either the bivalve: Mytilus galloprovinialis, or the echinoderm (sand dollar): Dendraster excentricus.
1

Final: 10/17//05
2. The DMMP also recognize that in rare cases, seasonality may play a role in
limiting potential species actually available for testing. Therefore, if the spawning condition is poor due to seasonality for both Mytilus galloprovincialis and Dendraster excentricus , the laboratory/applicant may propose alternative species for DMMP consideration on a case-by-case basis. Any potential substitution of species other than the two recommended species must be pre-approved by the DMMP prior to initiating testing.
REFERENCES PSDDA Users Manual1
Grays Harbor/Willapa Bay Dredged Material Testing Manual1
1 February 2000 PSDDA Users Manual is currently being updated and combined with the 1995 Grays Harbor/Willapa Bay Manual as a regional manual for DMMP, and is expected to be completed by the end of 2005.
2

Final: 6/15/04
DMMP CLARIFICATION PAPER AMMONIA AND SULFIDE GUIDANCE RELATIVE TO NEANTHES GROWTH BIOASSAY Prepared by David Kendall, (U.S. Army Corps of Engineers) and Justine Barton, (U.S. EPA Region 10) for the DMMP agencies INTRODUCTION Bioassays are used in the Dredged Material Management Program (DMMP) to evaluate toxicity in sediments proposed for dredging. The DMMP has long recognized the potential effects of non-treatment variables such as ammonia and hydrogen sulfides on the bioassays used to assess the toxicity of dredged material, and implemented the requirement to monitor those parameters in dredged material as potential interfering non-treatment factors (http://www.nws.usace.army.mil/publicmenu/DOCUMENTS/bio_qa90.pdf). Aerating the beakers for the amphipod and sediment larval bioassay appears to have largely ameliorated the effects of hydrogen sulfide, but it is clear that ammonia continues to remain a potential non-treatment factor, which can potentially interfere with the test results particularly in deeply buried subsurface and/or fine grained sediments with high organic contents. In 2001 the DMMP agencies clarified that a water-only ammonia reference toxicant (LC50) is strongly recommended and should be run concurrently with standard amphipod and sediment larval bioassays, when ammonia interference is expected (http://www.nws.usace.army.mil/publicmenu/DOCUMENTS/Ammonia.pdf). In 2002, the DMMP agencies further clarified ammonia issues relative to toxicity testing and potential ammonia purging for the amphipod bioassay (http://www.nws.usace.army.mil/publicmenu/DOCUMENTS/AmphAmmoniaClar20021.pdf). The purpose of this clarification paper is to further update the DMMP guidance relative to ammonia and sulfide for the 20-day Neanthes growth bioassay. PROBLEM IDENTIFICATION In 1992, the DMMP implemented the Neanthes 20-day bioassay following the Annual Review Meeting. In 1993 the DMMP established standard ammonia and sulfide monitoring requirements (http://www.nws.usace.army.mil/publicmenu/DOCUMENTS/ACF559.pdf) for conducting the bioassay based on studies by Dillon et. al. (1993), that showed a sharp threshold response by Neanthes to ammonia and hydrogen sulfide. Regulatory Guidance History. The initial 1993 DMMP guidance (http://www.nws.usace.army.mil/publicmenu/DOCUMENTS/ACF559.pdf) for Neanthes stipulated that total ammonia should be <10 mg/Liter (overlying water) and measured total sulfides concentrations should be <3.0 mg/Liter (overlying water), and should be measured at the beginning and end of the 20 day test. It also strongly recommends that ammonia monitoring be conducted prior to the first and second water renewals, because the
1

Final: 6/15/04
aqueous ammonia concentrations may reach maximum values nearer the beginning of the test. This guidance was further updated in the 1995 PSEP protocol document (http://www.psat.wa.gov/Publications/protocols/protocol_pdfs/bioassay.pdf, pages 68-69), where it recommended performing additional water quality ammonia and sulfide monitoring prior to the first and second water exchange/renewals when the unionized ammonia concentration exceeds 0.7 mg/Liter or total sulfides exceeds 5 mg/Liter. Ammonia Effects. An evaluation of DMMP dredged material testing data show a clear bulk ammonia and total ammonia (overlying water) correlation with Neanthes growth (Figures 1 and 2). Dillon et. al. (1993) found no apparent effects on juvenile worm survival and dry weight when exposed for three weeks to 10 mg/Liter nominal total ammonia (overlying water) and 0.46 mg/Liter unionized ammonia, respectively. However, when the concentrations were increased to >20 mg/Liter total ammonia (overlying water) or >0.68 mg/Liter unionized ammonia, they observed slightly, but not significantly diminished survival (80%) and dry weight reductions (65% - 69% of control) in juvenile worms. When the nominal total ammonia (overlying water) concentrations were further increased to 40 and 60 mg/Liter, corresponding to 1.25 and 2.02 unionized ammonia, respectively, there were no surviving worms. Literature values for fish and aquatic invertebrates, in general, highlight that acute lethality attributable to unionized ammonia range from about 0.5 to 2.0 mg/Liter, and acute:chronic ratios range from 5 to 20 (Dillon et. al. 1993). The DMMP data were examined to evaluate the frequency of exceedances of the no effects, minor effects, and major effects threshold concentrations. The evaluation showed there were 24 out of 382 observations where overlying water total ammonia exceeded the 10 mg/liter no effects threshold of concern concentration, and 11 out of 382 observations where ammonia was equal to or exceeded the minor effects concentration of 20 mg/liter. There were only 2 out of 382 observations, where the major effects concentration of 40 mg/liter were exceeded. When bulk ammonia concentrations are plotted against total ammonia (day 0 observations) the corresponding graphic shows that bulk ammonia can also be used as an indicator of potential exceedances of the no effect, minor effect, and major effect ammonia thresholds (Figure 3, Table 1). Total Sulfides Effects. In experiments by Dillon et al. (1993) all worms survived total hydrogen sulfide concentrationsin overlying water <3.4 mg/Liter. However, at slightly higher concentrations (5.5 mg/Liter) survival was reduced to 44%, and at higher concentrations of 15 mg/Liter, survival was 0%. DMMP program data collected from Neanthes testing conducted over the past 12 years indicate that hydrogen sulfide measurements were generally less than the 3.4 mg/Liter threshold, and do not appear to have been a significant test interference problem. Reference Toxicant (LC 50) tests. Currently for the amphipod and larval bioassays, when threshold no-effects concentrations are exceeded for ammonia, the DMMP agencies recommend conducting a water only reference toxicant LC50 test. Currently, it is not required for the Neanthes test.
2

Final: 6/15/04
Table 1. Thresholds of Concern for Neanthes 20-day Chronic Test1.
Parameter No effects (0% mortality; no effect
on growth)
Minor effects (~20% mortality; growth reduced 31-35% relative
to control)
Major effects (~100% mortality,
no growth)
Bulk Sediment
Ammonia
< 115 mg/Kg
> 230 mg/Kg
> 400 mg/Kg
Total Ammonia
(overlying water)
< 10 mg/L
> 20 mg/L
> 40 mg/L
Unionized Ammonia
(overlying water)
< 0.46 mg/L
> 0.68 mg/L
> 1.25 mg/L
Total Sulfide
(overlying water)
< 3.4 mg/L
> 5.5 mg/L
>15 mg/L
Ammonia Purging. The DMMP agencies discourage ammonia purging of toxicity test samples on a programmatic basis. The DMMP agencies continue to be concerned that purging for ammonia may also result in a concomitant loss of sediment contaminants being evaluated in the bioassay. The DMMP agencies are unaware of studies that have definitively quantified the potential contaminant losses resulting from ammonia purging. Nevertheless, it is likely that there will be occasional sediment samples from DMMP projects where initial bulk ammonia (> 230 mg/Kilograms2) and/or total ammonia (overlying water) concentrations (> 20 mg/Liter) indicate that purging may be required in order to conduct a reliable toxicity test. This paper is part of a general effort to clarify and update ammonia and sulfides guidance, and provide recommended approaches to reduce potential interference problems from these variables when conducting the Neanthes 20-day growth bioassay. The remainder of this clarification paper provides updated guidance relative to ammonia, when the documented ammonia concentration thresholds of concern (Table 1) are exceeded. The clarifications include:
1. Guidelines for standard reporting of ammonia data
1 Total ammonia, unionized ammonia, and total sulfide concentrations from Dillon et.al. (1993). 2 See Figure 1. Bulk Ammonia concentration calculated from regression equation: x = (y – 0.1007)/0.0864, where x = mg/kg bulk ammonia, and y = mg/liter total ammonia.
3

Final: 6/15/04
2. Threshold ammonia concentrations and guidelines for conducting ammonia reference toxicant (LC50) tests
3. Threshold ammonia concentrations above which DMMP agencies will consider
allowing purging of samples. 4. Methods for purging ammonia from overlying sample water and guidelines for test
initiation after purging (batching). PROPOSED CLARIFICATION 1. Standard reporting of ammonia data The DMMP agencies require that the following information be collected and reported for all test sediment where there is concern that ammonia toxicity may interfere with interpretation of test results, as well as appropriate control and reference samples, whether or not sample purging is allowed and then ultimately occurs. • Total ammonia (interstitial water) from the original bulk sediment sample • Total and unionized ammonia (overlying water) at the start of each toxicity test, e.g.,
at day 0, and again on day 3 (prior to the first seawater replacement) • All water-only ammonia reference toxicant test data (LC50, total and unionized) 2. Threshold ammonia concentrations and guidelines for conducting ammonia reference toxicant (LC50) tests The DMMP agencies implement the following guidance that the total ammonia no effects concentrations presented in Table 1 above be used as thresholds above which project proponents should conduct water-only ammonia reference toxicant (LC50) tests (http://www.nws.usace.army.mil/publicmenu/DOCUMENTS/Ammonia.pdf). With the standard ammonia data (proposed above), synoptic ammonia LC50 data help the DMMP agencies and project proponents determine the potential extent of ammonia-related toxicity and reduce the need to purge sediment samples. Labs should already be experienced in running reference toxicant tests, however, project sampling and analysis plans (SAPs) should include a specific discussion including the lab’s protocol for ammonia testing and calculating a LC50, should the ammonia reference toxicant test be required. 3. Threshold ammonia concentrations for consideration of sample purging The minor effects concentrations depicted in Table 1 are implemented as interim thresholds for consideration of test sediment purging.
4

Final: 6/15/04
Project proponents concerned that ammonia toxicity may interfere with interpretation of sediment bioassays must measure ammonia concentrations in bulk sediment samples prior to test set up and initiation. If the bulk ammonia, total ammonia (overlying water), or unionized ammonia concentrations approach or exceed the minor effects levels depicted in Table 1, then the proponent must immediately coordinate with the Dredged Material Management Office (DMMO), Seattle District U.S. Army Corps of Engineers and develop an acceptable plan for monitoring ammonia. The final decision whether or not to allow toxicity test sample purging prior to test initiation will be made by the DMMP agencies using best professional judgment, and in collaboration with the applicant. If purging is allowed and occurs, the project proponent would be required to collect and report the following additional information for each test sample and the associated control and reference samples. • Total and unionized ammonia (mg/L) on each day interstitial ammonia is measured
during purging • Total and unionized ammonia (mg/L) on any additional days during the test, if
proposed or required in the ammonia monitoring plan 4. Purging methods and test initiation The DMMP agencies will use best professional judgment for those projects where purging may be indicated. Currently there are a variety of approaches used by regulatory agencies, project proponents and laboratories to purge samples, measure interstitial ammonia and initiate toxicity tests. In general, if purging is performed, overlying water is replaced 2x per day. Frequency of testing of the water in sacrificial containers may vary but generally occurs every 1-3 days, depending on the length of time purging is likely to occur. Once test sediment has reached the desired interstitial ammonia level, the test may be initiated, and each test sediment must have associated and similarly purged control and reference sediments. The above describes the general approach. However, should purging be pursued for a project, there are many ways to vary the purging of samples and test initiation for individual samples or batches of samples. The DMMP strategy for any particular project will be to minimize purging to the extent practical and will be based on the bulk ammonia values that are provided up front. Below are some potential options for tailoring a project-specific purging regime. • Set a number of days purging may occur overall • Set a maximum number of days any sample may receive purging that is not required
due to ammonia levels • Batch groups of samples for test initiation -- this may be based on initial ammonia
levels or on actual time taken to reach the desired ammonia level for testing (e.g. for a
5

Final: 6/15/04
group of 10 samples, batch and initiate the first 5 samples that reach the desired ammonia level, then wait and initiate the final 5 samples together – each group having associated purged control and reference sediments)
Laboratories with purging experience can generally estimate, based on initial bulk and total ammonia values, the purging time required to reduce interstitial ammonia levels to no-effects threshold concentrations. Once coordination with the DMMP has occurred and a test strategy has been developed, the labs can a) plan for procurement and acclimation of test organisms, b) sequence various batches for purging, and c) attempt to start toxicity tests, including those for samples that are not purged, at approximately the same time. No deviations from the current standard method of purging specified above are allowed at this time. 5. The DMMP agencies reaffirm the total sulfides no effects threshold of 3.4 mg/L for Neanthes testing Concentrations above 5.5 mg/L are not expected, but should be reported to the DMMO immediately for consultation with the DMMP if encountered, to discuss possible remedies to ameliorate or reduce the potential effects. _______________________________________________________________________ REFERENCES Barton, Justine. 2002. Ammonia and Amphipod Toxicity Testing. 2002 DMMP Clarification Paper. Dillon, T.M., D. W. Moore, and A. B. Gibson. 1993. Development of a chronic sublethal bioassay for evaluating contaminated sediment with the marine polychaete worm Nereis (Neanthes) arenaceodentata. Environmental Toxicology and Chemistry. Vol. 12: 589-605. Fox, David. 1993. The Neanthes 20-day Bioassay – Requirements for Ammonia/Sulfides Monitoring and Initial Weight. 1993 PSDDA Clarification Paper Kendall, David. 1990. Requirements for analyzing Sediment Conventionals in Reference Areas and for Water Quality in Bioassays. 1990 PSDDA Clarification Paper PSEP, 1995. Recommended Guidelines for conducting laboratory bioassays on Puget Sound Sediments. Puget Sound Estuary Program July 1995 Revisions. Warner, Lauran-Cole. 2001. Reporting Ammonia LC50 data for Larval and Amphipod Bioassays. 2001 DMMP Clarification Paper
6
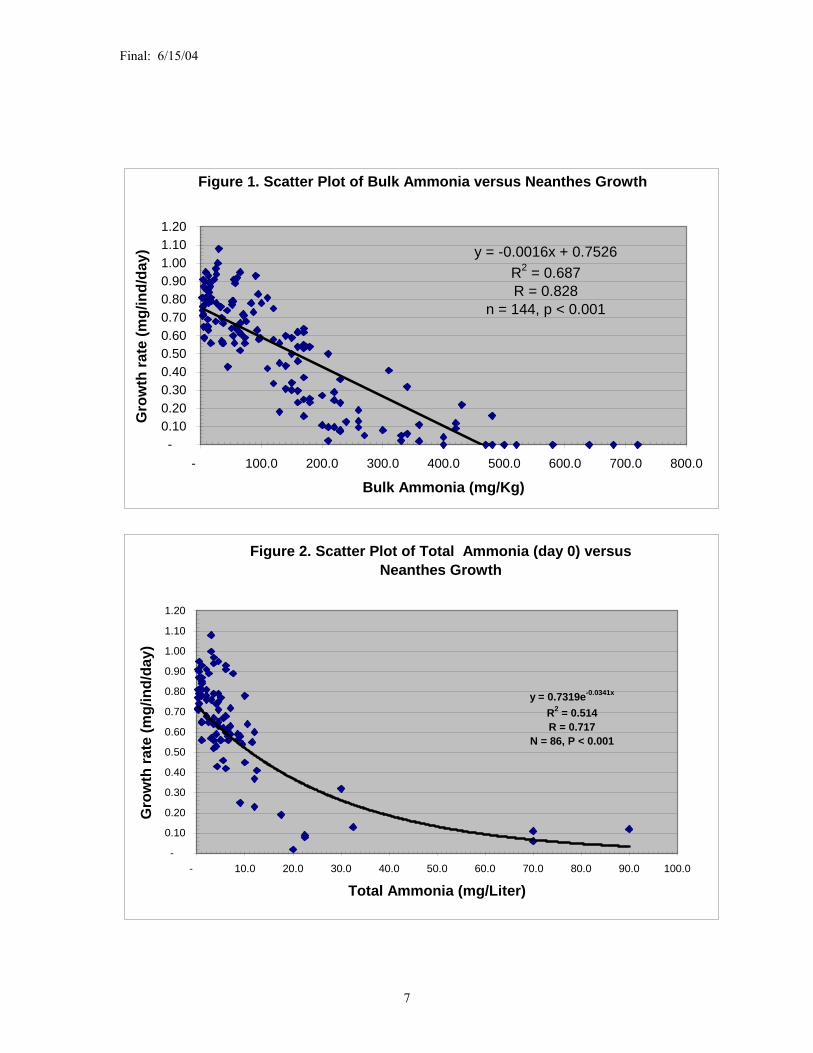
Final: 6/15/04
Figure 1. Scatter Plot of Bulk Ammonia versus Neanthes Growth
y = -0.0016x + 0.7526R2 = 0.687R = 0.828
n = 144, p < 0.001
-0.100.200.300.400.500.600.700.800.901.001.101.20
- 100.0 200.0 300.0 400.0 500.0 600.0 700.0 800.0
Bulk Ammonia (mg/Kg)
Gro
wth
rate
(mg/
ind/
day)
Figure 2. Scatter Plot of Total Ammonia (day 0) versus Neanthes Growth
y = 0.7319e-0.0341x
R2 = 0.514R = 0.717
N = 86, P < 0.001
-
0.10
0.20
0.30
0.40
0.50
0.60
0.70
0.80
0.90
1.00
1.10
1.20
- 10.0 20.0 30.0 40.0 50.0 60.0 70.0 80.0 90.0 100.0
Total Ammonia (mg/Liter)
Gro
wth
rate
(mg/
ind/
day)
7

Final: 6/15/04
Figure 3. Scatter Plot of Bulk Ammonia versus Total Ammonia
y = 0.0864x + 0.1007R2 = 0.603R = 0.777
n = 97, P < 0.001
-
10.0
20.0
30.0
40.0
50.0
60.0
70.0
80.0
90.0
100.0
- 100.0 200.0 300.0 400.0 500.0 600.0 700.0
Bulk Ammonia (mg/kg)
Tota
l Am
mon
ia (m
g/lit
er)
8

Final Paper 6/15/02
DMMP Clarification Paper AMMONIA AND AMPHIPOD TOXICITY TESTING Prepared by Justine Barton, US EPA Region 10 for the DMMP agencies. INTRODUCTION Over the history of the DMMP, agency staff has not often found evidence of substantial ammonia toxicity interfering with interpretation of sediment toxicity tests. However, it is clear that ammonia remains a potential interference, or non-treatment factor, especially for toxicity tests conducted on deep sediment samples. To address this issue, the agencies recently adopted a recommendation to conduct water-only ammonia reference toxicant (LC50 ) tests in parallel with standard amphipod and sediment larval bioassays (DMMP, 2001) in some instances. The ammonia dose-response data that result can then be used to determine whether or not ammonia may have contributed to any observed toxicity. PROBLEM IDENTIFICATION Since the 2001 clarification, two local project proponents expressed concerns about interstitial ammonia potentially interfering with planned amphipod bioassays and proposed to purge samples prior to the initiation of testing, in addition to conducting the water-only LC50 test. The DMMP has little direct experience with ammonia purging procedures, having allowed sample purging for one previous project. The agencies decided to allow limited purging for the two recent projects, should ammonia measured in bulk interstitial water exceed the thresholds established by EPA (1993, 1994). However, the DMMP agencies continue to be reluctant to allow purging of toxicity test samples on a programmatic basis. This is because staff is not aware of careful studies showing that purging reduces only ammonia and does not also reduce the intended exposure to sediment contaminants. Nevertheless, it is likely that there will be occasional sediment samples from DMMP projects where initial bulk interstitial ammonia values indicate the need to purge in order to conduct a reliable toxicity test. As part of a general effort to document ammonia concentrations and minimize potential toxicity test interference due to high ammonia, the DMMP staff and project proponents have discussed several possible program clarifications. These include establishing:
1. Guidelines for standard reporting of ammonia data

Final Paper 6/15/02
2. Threshold ammonia concentrations and guidelines for conducting ammonia reference toxicant (LC50) tests
3. Threshold ammonia concentrations above which DMMP agencies will consider allowing purging of samples
4. Methods for purging ammonia from the overlying sample water and guidelines for test initiation after purging (batching)
PROPOSED CLARIFICATIONS/ACTIONS 1. Standard reporting of ammonia data The DMMP agencies propose that the following information be collected and reported for all test sediment where there is concern that ammonia toxicity may interfere with interpretation of test results, as well as appropriate control and reference samples, whether or not sample purging is allowed and then ultimately occurs. · Total interstitial ammonia from the original bulk sediment sample · Total and unionized interstitial ammonia at the start and end of each toxicity test,
e.g., at day 0 and day 10 · All water-only ammonia reference toxicant test data (LC50, total and unionized) 2. Threshold ammonia concentrations and guidelines for conducting ammonia reference toxicant (LC50) tests The DMMP agencies recommend the total interstitial ammonia concentrations presented in Table 1 below be used as thresholds above which project proponents should conduct water-only ammonia reference toxicant (LC50) tests (see 2001 clarification). These ammonia concentrations are equal to one-half the value provided in Table 2. With the standard ammonia data (proposed above), synoptic ammonia LC50 data help the DMMP agencies and project proponents determine the potential extent of ammonia-related toxicity and reduce the need to purge sediment samples. Labs should already be experienced in running reference toxicant tests, however, project sampling and analysis plans (SAPs) should include a specific discussion including the lab’s protocol for ammonia testing and calculating a LC50, should the ammonia reference toxicant test be required.

Final Paper 6/15/02
Table 1. Thresholds for conducting ammonia reference toxicant (LC50) tests.
Interstitial Ammonia
(mg/L @ pH 7.7)
Ampelisca abdita
Eohaustorius estuarius
Rhepoxinius
abronius
Total
>15
>30
>15
Unionized
>0.2
>0.4
>0.2
3. Threshold ammonia concentrations for consideration of sample purging The US EPA (1994) presents species-specific no-effect concentrations for interstitial ammonia (Table 2). The DMMP proposes using the total interstitial ammonia values listed in Table 2 as thresholds for consideration of test sediment purging. a Project proponents concerned that ammonia toxicity may interfere with interpretation of sediment bioassays must measure total interstitial ammonia concentrations in bulk sediment samples prior to test set up and initiation. If the bulk sediment interstitial ammonia concentrations approach or exceed those listed in Table 2, then the proponent must immediately coordinate with the Dredged Material Management Office (DMMO), Seattle District U.S. Army Corps of Engineers and develop an acceptable plan for monitoring interstitial ammonia. The final decision whether or not to allow toxicity test sample purging prior to test initiation will be made by the DMMP agencies using best professional judgment, and in collaboration with the applicant. If purging is allowed and occurs, the project proponent would be required to collect and report the following additional information for each test sample and the associated control and reference samples. · Total and unionized interstitial ammonia (mg/L) on each day interstitial ammonia
is measured during purging · Total and unionized interstitial ammonia (mg/L) on any additional test days, if
proposed or required in the ammonia monitoring plan

Final Paper 6/15/02
Table 2. Thresholds for considering sample purging.
Interstitial Ammonia
(mg/L @ pH 7.7)
Ampelisca
abdita
Eohaustorius
estuarius
Rhepoxinius
abronius
Total
>30
>60
>30
Unionized
>0.4
>0.8
>0.4
From US EPA (1994) It should be noted that some guidance suggests the same total ammonia interstitial threshold concentration is appropriate for all three of these amphipod species (US EPA/US ACOE, 1993). However, the DMMP agencies believe that a higher total interstitial ammonia threshold concentration for Eohaustorius estuarius is appropriate and consistent with higher LC50 values published in the scientific literature compared to Ampelisca abdita and Rhepoxinius abronius, i.e., E. estuarius is less sensitive to ammonia (Kohn et al., 1994). 4. Purging methods and test initiation The DMMP agencies propose to use best professional judgment for those projects where purging may be indicated. Currently there are a variety of approaches used by regulatory agencies, project proponents and laboratories to purge samples, measure interstitial ammonia and initiate toxicity tests. In general, if purging is performed, overlying water is replaced 2x per day. Frequency of testing of the interstitial water in sacrificial containers may vary but generally occurs every 1-3 days, depending on the length of time purging is likely to occur. Once test sediment has reached the desired interstitial ammonia level, the test may be initiated, and each test sediment must have associated and similarly purged control and reference sediments. The above describes the general approach. However, should purging be pursued for a project, there are many ways to vary the purging of samples and test initiation for individual samples or batches of samples. The DMMP strategy for any particular project will be to minimize purging to the extent practical and will be based on the bulk interstitial ammonia values that are provided up front. Below are some potential options for tailoring a project-specific purging regime. · Set a number of days purging may occur overall · Set a number of days any sample may receive purging that is not required due to
ammonia levels

Final Paper 6/15/02
· Batch groups of samples for test initiation -- this may be based on initial ammonia levels or on actual time taken to reach the desired ammonia level for testing (e.g. for a group of 10 samples, batch and initiate the first 5 samples that reach the desired ammonia level, then wait and initiate the final 5 samples together – each group having associated purged control and reference sediments)
Laboratories with purging experience can generally estimate, based on initial bulk interstitial total ammonia values, the purging time required to reduce interstitial ammonia levels to threshold concentrations. Once coordination with the DMMP has occurred and a test strategy has been developed, the labs can a) plan for procurement and acclimation of test organisms, b) sequence various batches for purging, and c) attempt to start toxicity tests, including those for samples that are not purged, at approximately the same time. Finally, other experimental techniques for reducing interstitial ammonia levels have been explored nationally to attempt to provide methods that reduce ammonia levels in shorter amounts of time and better maintain the character of the original samples (Ferretti et al., 2000). Deviations from the current standard method of purging are not being proposed at this time. REFERENCES DMMP. 2001. Reporting Ammonia LC50 Data for Larval and Amphipod Bioassays. DMMP clarification paper. Prepared by Lauran Cole Warner (US Army Corps of Engineers) for the DMMP agencies, Seattle, WA. Ferretti J, Calesso D, Hermon T. 2000. Evaluation of methods to remove ammonia interference in marine sediment toxicity tests. Environ Toxicol Chem 19:1935-1941. Kohn NP, Word JQ, Niyoge DK, Ross LT, Dillon T, Moore DW. 1994. Acute toxicity of ammonia to four species of marine amphipod. Mar Environ Res 38:1-15. PSEP. 1995. Recommended Guidelines for Conducting Laboratory Bioassays on Puget Sound Sediment. In: Puget Sound Protocols and Guidelines, Puget Sound Estuary Program. Final Report by PTI Environmental Services for US Environmental Protection Agency, Region 10, Seattle, WA. US EPA and US Army Corps of Engineers. 1993. Guidance Memorandum: Technical Panel Recommendations Concerning Use of Acute Amphipod Tests in Evaluation of Dredged Material. Environmental Protection Agency Office of Oceans, Wetlands, and Watersheds, Environmental Protection Agency Office of Science and Technology, and

Final Paper 6/15/02
Army Corps of Engineers Operations, Construction, and Readiness Division. Dated December 13, 1993. US EPA. 1994. Methods for Assessing the Toxicity of Sediment-associated Contaminants with Estuarine and Marine Amphipods. EPA/600/R-94/025. Environmental Protection Agency Office of Research and Development, June 1994. Pp. 80-82 and errat

Final: 10/3/01
1
DMMP CLARIFICATION PAPER REPORTING AMMONIA LC50 DATA FOR LARVAL AND AMPHIPOD BIOASSAYS Prepared by Lauran Cole Warner (U.S. Army Corps of Engineers) for the DMMP agencies INTRODUCTION Bioassays are used by the DMMP program to assess toxic and chronic sublethal effects of sediments proposed for dredging and open-water disposal. A suite of three bioassays is presently used: the 20-day juvenile infaunal growth test (with Neanthes arenaceodentata), the 10-day amphipod acute mortality test (with Rhepoxynius abronius, Ampelisca abdita, or Eohaustorius estuarius), and the sediment echinoderm or bivalve1 larval test. Ammonia toxicity is a potential non-treatment factor that may affect the results of the larval and amphipod bioassays (Fox 1993). A clarification for ammonia monitoring for the Neanthes biomass test was instituted in 1993 (Fox 1993), but there has been no guidance for the larval and amphipod bioassays beyond that found in published protocols (PSEP 1995; USEPA 1994). Bioassays from some recent projects--particularly those from sediments with high organic fractions (such as wood waste) have shown somewhat elevated ammonia levels. Though reported ammonia levels have never reached published LC50 values, there is always a possibility that relative sensitivity of the animals can vary with season, population, or other factors (PSEP 1995). This clarification is intended to provide the needed information for the DMMP agencies to assess the role of ammonia on any expressed toxicity in the larval and amphipod bioassays. PROBLEM IDENTIFICATION Presently, laboratories are required to report ammonia levels at test initiation and completion. Both overlying and porewater levels are measured for the amphipod bioassay, and overlying water ammonia levels for the larval bioassay. If ammonia is not a potential contaminant of concern,2 aeration and/or purging are used to reduce ammonia levels when it is initially present at toxicologically important levels (EPA 1994). Despite following appropriate protocols, there have been cases where bioassay results have still shown evidence of ammonia toxicity. Sensitivity to ammonia may also covary with toxicity of other compounds, and thus increased mortality can be an accurate measure of the toxicity of test sediments. Without direct evidence to the contrary, the agencies cannot assume that ammonia
1 Typically, Dendraster excentricus is the recommended echinoderm species and Mytilus galloprovincialis is the recommended bivalve species for the sediment larval test. However, echinoderms Stronglyocentrotus droebachiensis and S. purpuratus or bivalve Crassostrea gigas may be substituted with DMMP coordination. 2 In some cases, ammonia can interfere with bioassay results, providing stress to the test animals that is not related to stress caused by the chemicals of concern, (e.g. anoxic sediments with elevated TOC). In other cases, the effects of ammonia are considered important to the toxicity of the sediment, and are a contaminant of concern (e.g., wood waste).

Final: 10/3/01
2
toxicity is a primary component of any observed toxic responses if reported levels are below published levels of concern. PROPOSED CLARIFICATION The DMMP agencies are instituting the following clarification to guidance on larval and amphipod bioassays: Project proponents may elect to run a water-only ammonia LC50 experiment to quantify the sensitivity of the amphipod or larval population being used to ammonia levels occurring in the test sediment. Tests must be run on animals collected and delivered at the same time and place as the test animals, and be run concurrently with the bioassays. The agencies will use information from the water-only tests to consider whether ammonia is contributing to or largely responsible for the observed toxicity in a given test. Test methods and guidelines for interpreting LC50 data should be arranged in consultation with the DMMP agencies prior to the initiation of any testing. Appropriate steps to reduce ammonia levels in the test sediments would still be required (see URL: http://www.epa.gov/ostwater/library/sediment/dredgepanel.pdf and/or http://www.wa.gov/puget_sound/Publications/protocols/protocol.html). Ammonia LC50 tests will not be appropriate for many bioassays. Elevated ammonia levels can be expected primarily from very deep sediments or those with substantial amounts of organics such as wood waste. However, ammonia LC50 data will be required to support any contentions that ammonia, and not other chemicals of concern, was the primary cause of any expressed toxicity in the larval or amphipod bioassays. REFERENCES Fox, David. 1993. Clarification on the Neanthes 20-day bioassay - requirements for
ammonia/sulfides monitoring and initial weight. Presented at the 5th PSDDA Annual Review Meeting, June 1993.
PSEP. 1995. Recommended guidelines for conducting laboratory bioassays on Puget Sound
sediments. In: Puget Sound Protocols and Guidelines, Puget Sound Estuary Program. Final report by PTI Environmental Services for US Environmental Protection Agency, Region 10, Seattle, WA.
SAIC. 1992. Role of ammonia in toxicity tests used in evaluation of dredged material. Prepared
for EPA, Naragansett, Rhode Island under EPA contract No. 68-C1-005, Work Assignment 13, Task 3 (SAIC Project No. 2263).
USEPA. 1994. Methods for assessing the toxicity of sediment-associated contaminants with
estuarine and marine amphipods. Environmental Protection Agency Office of Research and Development, June 1994.

Final: 10/20/99
DMMP CLARIFICATION PAPERSMS DRAFT TECHNICAL INFORMATION MEMORANDUM
CLARIFICATION ON THE USE OF THE AMPHIPOD, EOHAUSTORIUSESTUARIUS, RELATIVE TO GRAIN SIZE AND SALINITY
Prepared by David R. Kendall (U.S. Army Corps of Engineers)and Russ McMillan (Department of Ecology) for the DMMP/SMS agencies.
INTRODUCTION
In 1993 the Dredged Material Management Program (DMMP) agencies clarified whichspecies were suitable for conducting the 10-day amphipod test, to address the apparentgrain size sensitivity of Rhepoxynius abronius to fine grained (>60% fines) sediments(DeWitt, et. al., 1988; 1993 Annual Review Meeting: Species substitution for the 10-dayamphipod bioassay). The initial guidance implemented at that time, clarified the use ofEohaustorius estuarius in DMMP bioassays as a substitute species when interstitialsalinities are lower than 25 ppt and percent fines are greater than 60 percent (clay + silt).In the past two to three years, E. estuarius has been used routinely and successfully to testdredged material.
PROBLEM IDENTIFICATION
Eohaustorius estuarius is a common amphipod species in Pacific Coast estuaries, and isdistributed along the North American Pacific coast from Central California to BritishColumbia, Canada. It is an infaunal burrower, which brings it into almost constant contactwith sediment particulates and interstitial water. Eohaustorius estuarius is commonlyfound in salinities ranging from 0 to >30 parts per thousand (ppt) and is typically collectedfrom sandy sediments, but exhibits a wide tolerance to sediments ranging from 0.6% to100% sand (EPA 600/R-94/025). E. estuarius was found by DeWitt, et. al., (1989) toexhibit a mean survival of 92.4% in sediments with > 90% silt-clay content and 96.7%survival in coarser sediments. This study also found > 95% survival of E. estuarius intested salinities ranging from 2 to 28 ppt. Recent (August 1999) DMMP experienceindicates that this species may be sensitive to relatively high clay contents (e.g., > 20%),and increased mortalities have been observed in non-chemically contaminated sedimentswith clay contents between 20 - 45 percent.
Based on the DeWitt, et. al. (1989) and EPA results, the restriction in use of E. estuariusto fine grained sediments (>60% fines) when salinities are less than 25 ppt as stipulated inthe 1993 clarification paper is not warranted. The purpose of this clarification paper is toprovide updated guidance on the use of E. estuarius relative to grain size and salinity.
Final: 10/20/99
PROPOSED CLARIFICATION
The DMMP and SMS propose to allow the use of Eohaustorius estuarius for sedimenttoxicity testing over grain size distributions ranging from 100 % sand to 0.6% sand (i.e.,0% to 99.4 % silt-clay, provided clay fraction < 20 %) and interstitial salinities rangingfrom 2 ppt to 28 ppt. In the event sediment clay contents exceed 20 %, testing withAmpelisca abdita is recommended.
REFERENCES
DeWitt,T.H., G.R. Ditsworth, and R.C.Swartz, 1988. "Effects of natural sedimentfeatures on survival of the phoxocephalid amphipod Rhepoxynius abronius," Mar.Environ. Res. 25:99-124.
Dewitt, T.H., R.C. Swartz, and J.O. Lamberson. 1989. Measuring the acute toxicity ofestuarine sediments. Environmental Toxicology and Chemsistry. Vol.__: 1035-1045.
Kendall, D. R. 1993. Species Substitution for the 10-day Amphipod Bioassay.Clarification Paper, prepared for the DMMP agencies.
EPA 1994. Methods for Assessing the Toxicity of Sediment-associated contaminants withEstuarine and Marine Amphipods. EPA 600/R-94/025. Prepared for the Office ofResearch and Development: U.S. Environmental Protection Agency, Narragansett, RhodeIsland.
SELECTION OF NEGATIVE CONTROL SEDIMENTS AND
USE OF CONTROL SEDIMENTS AS REFERENCE SEDIMENTS
DMMP CLARIFICATION PAPER
SMS DRAFT TECHNICAL INFORMATION MEMORANDUM
Prepared by David F. Fox (U.S. Army Corps of Engineers)
and Teresa Michelsen (Department of Ecology) for the DMMP/SMS agencies.
INTRODUCTION
Bioassays performed for dredged material management programs in the State of Washington or for comparison to the state's Sediment Management Standards (SMS) utilize negative controls to provide an estimate of test organism general health during the test exposure period (PSDDA, 1989). A negative control sediment is utilized in the amphipod mortality and Neanthes growth bioassays, while a clean seawater control is used in the larval test. Negative control performance standards must be met for the test results to be considered valid.
Reference sediments are included in bioassays to address nontreatment effects from physical factors such as grainsize. Performance standards also exist for reference sediments and may be based on a comparison to the negative control (all bioassays except the SMS amphipod and Microtox tests). Only reference sediments that meet the performance standard can be used for statistical comparison to test sediments.
PROBLEM IDENTIFICATION
Negative controls for the amphipod and Neanthes bioassays must be a sediment type in which the test organism is found and thrives in the environment. However, in some cases laboratories have used a single type of control sediment for all bioassays, even though that type of sediment may not have been appropriate as a control for one or more of the test organisms. For example, West Beach sand has been used for both the Neanthes growth test and for the amphipod mortality test using Ampelisca abdita. While Neanthes arenaceodentata thrives in West Beach sand, Ampelisca abdita favors finer-grained sediment. The result of using an inappropriate sediment is generally an elevated response in the negative control. This creates problems both for determining the general health of the test organisms and judging the performance of reference sediments.
In addition, at times reference sediments fail to meet performance standards. Under SMS, guidance is not currently provided on whether, or how, statistical comparisons can be made when a reference sediment fails to perform adequately. If a reference sediment fails to meet its performance standard there may be no way to interpret test results.

CLARIFICATION
SELECTION OF NEGATIVE CONTROL SEDIMENTS. An appropriate negative control sediment must be used for the amphipod mortality and Neanthes growth tests. PSEP (1995) provides the following description of native habitat for various amphipods: "Rhepoxynius abronius and Eohaustorius estuarius typically inhabit well-sorted, fine sand while Ampelisca abdita is a tube-dwelling amphipod found mainly in protected areas and is often abundant in sediments with a high organic content. It generally inhabits sediments from fine sand to mud and silt without shell, although it can also be found in relatively coarser sediments with a sizable fine component." The best way to ensure a good negative control is to collect the control sediment from the same location at which the test organisms are collected.
Neanthes arenaceodentata is cultured in the lab rather than field-collected. However, PSEP (1995) states that, "For the Neanthes bioassay, sand should be used as the control sediment". West Beach of Whidbey Island is most often used as a collection site for clean control sediment. From PSEP (1995), "Neanthes maintained in West Beach sand exhibited low mortality and high percentage increases in biomass during the exposure period, indicating that West Beach sand is a suitable material for a control sediment".
PSEP (1995) also states that, "All bioassays must be conducted using well-established negative (clean) controls. Such controls are clean, nontoxic seawater and/or sediment samples taken from outside each study area". For dredged material management programs in the State of Washington or for comparison to SMS, sediments proposed for use as negative controls must be approved before bioassays commence. If an area without a proven track record is proposed for collection of negative control sediment, sufficient data (such as grainsize, organic carbon content, chemical data, bioassay results) must be submitted before its use can be approved by the regulatory agencies.
USE OF CONTROL SEDIMENTS AS REFERENCE SEDIMENTS. When a reference sediment fails to meet its performance standard, and more than one reference has been collected, Michelsen and Shaw (1996) provide procedures for statistical comparisons. If no reference sediments meet performance standards, or if the control sediment is closer in grain size and TOC to one or more stations being evaluated than any of the remaining reference sediments, the control sediment should be evaluated for use as a reference sediment. If the control sediment is similar in grain size and TOC to the site sediments and/or a reference sediment that failed to meet performance standards, it will be considered an acceptable substitute for the reference sediment and the data will be interpreted accordingly.
If a control sediment is substantially dissimilar to the site stations and a failed reference sediment in its physical characteristics (e.g., >25% difference in fines and a difference of 1% TOC), it may still be used as a substitute for the reference station if both the agencies/site manager and the project proponent agree that this is appropriate. Otherwise, the data will be considered uninterpretable and the bioassay(s) in question will need to be rerun.

REFERENCES
Michelsen, T. and T. C. Shaw, 1996, Statistical Evaluation of Bioassay Results, In:
Sediment Management Annual Review Meeting Minutes, PSDDA/SMS agencies.
PSDDA, 1989, Management Plan Report; Unconfined Open-water Disposal of Dredged Material, Phase II, PSDDA agencies.
PSEP, 1995, Recommended Guidelines for Conducting Laboratory Bioassays on Puget Sound Sediments, Puget Sound Estuary Program.
SMS, 1995, Sediment Management Standards, WAC 173-204, Washington State Department of Ecology.
PSDDA CLARIFICATION PAPER 7/25/96
SMS TECHNICAL INFORMATION MEMORANDUM
STATISTICAL EVALUATION OF BIOASSAY RESULTS
Prepared by Dr. Teresa Michelsen (Washington Department of Ecology) and Travis C. Shaw (U.S. Army Corps of Engineers) for the PSDDA/SMS agencies.
INTRODUCTION
Sediment bioassays are an integral part of sediment management programs in Washington State. Under the Puget Sound Dredged Disposal Analysis (PSDDA) program and the Washington Sediment Management Standards (SMS), sediment bioassays may be used to determine whether sediments are suitable for open-water disposal, whether sediments require cleanup, and in determining the need for source control to protect sediment quality near a discharge. The interpretation of bioassay results under these programs requires two evaluations:
· A comparison of the response (e.g., mortality) observed in a sample to a threshold value (absolute or relative to a reference response) established by the agencies, and
· An evaluation of whether the adverse effect observed in the sample is statistically significant and greater than the effect observed at a reference station.
The discussion below provides guidance on the determination of statistical significance under these two regulatory programs.
PROBLEM IDENTIFICATION
Regarding the determination of significance, the SMS rule provides that a t-test, p<0.05, be used to determine whether the mean of the site station is statistically different from the mean of the reference station. This statement alone does not provide enough detail to ensure that the regulated community and agency staff consistently produce the same results when analyzing data sets. However, WAC 173-204-130(4) provides authority for Ecology to propose technical methods that replace and/or enhance methods provided for in the rule, providing public review is conducted and the decision to use an alternate technical method is documented in the public record.
The PSDDA Phase II Management Plan Report does provide additional guidance on data transformations and statistical tests to be used, discussed in the sections below. The PSDDA guidance further provides a null hypothesis (similar to text in the SMS rule) that the mean of the site and reference stations are not statistically different; however, this null hypothesis is not appropriate for the one-tailed t-tests recommended for use in SMS and PSDDA regulatory programs.

Agency staff and the regulated community have requested further clarification under SMS and PSDDA on the specific form of the t-test to be used, appropriate hypothesis testing, recommended data transformations, and recommended tests for normality and homogeneity of variances. In addition, the agencies have been asked whether Dunnett's test or other alternative tests could be used in place of the t-test. Finally, questions have arisen over the use of multiple reference stations for comparisons under these programs. The discussion below provides guidance on each of these topics.
DISCUSSION AND TECHNICAL BACKGROUND
Hypothesis Testing
In conducting statistical comparisons for sediment management programs, the only concern is whether adverse effects in the sample being tested are greater than adverse effects in a reference sediment (one-tailed hypothesis). The correct null (Ho) and alternate (Hi) hypotheses for comparing the mean response of the test sediment with the reference sediment are:
Ho: Mean test response (e.g., mortality) is less than or equal to the mean reference response at alpha = 0.05
or, Ho: (sample) < (reference)
Hi: Mean test response is greater than the mean reference response at alpha = 0.05
or, Hi: (sample) > (reference)
Note that, for the larval bioassays, the alpha level should be increased to 0.10 to account for historically high variances in these tests (see PSDDA clarification paper Interim Revised Performance Standards for the Sediment Larval Bioassay, finalized November 10, 1994 and the Draft SMS Technical Information Memorandum Quality Assurance Guidelines for the Sediment Larval Bioassay presented with this paper at the 1996 SMARM).
The statement of hypothesis should be revised for effects endpoints where the adverse effect being measured results in a test response lower than the reference (e.g., growth endpoint for Neanthes). The correct hypotheses in these cases are:
Ho: Mean test response (e.g., growth rate) is greater than or equal to the reference response at alpha = 0.05.
or, Ho: (sample) > (reference)
Hi: Mean test response is less than the reference response at alpha = 0.05.
or, Hi: (sample) < (reference)

In either case, if the null hypothesis is rejected, then we accept the alternate hypothesis that a statistically significant adverse effect is indicated, with a 5% probability of a Type I error (misidentification of an unimpacted station as impacted). If we fail to reject the null hypothesis, we determine that no significant adverse effect has been identified. The direction of the inequality in the statement of hypothesis affects the comparison of the calculated t statistic with the t table value for a given significance level. The proper relationship between the hypothesis and critical region used in decisions about the hypothesis is presented below:
Type of Test Null Hypothesis Alt. Hypothesis Critical Region 1-tailed u(test) < u(ref) u(test) > u(ref) t(calc) > t(table)
1-tailed u(test) > u(ref) u(test) < u(ref) t(calc) < -t(table)
Data Transformations
As noted above, use of the t-test requires that the data are normal and variances are homogeneous. Data derived from bioassay tests are often expressed in terms of percent (mortality or other endpoint). An arcsine-square root transformation may be performed if needed to stabilize the variances and improve the normality of data sets expressed in percent. The arcsine-square root transform is provided below:
y = arcsine (square root of x)
where x is the percentage expressed as a decimal (e.g., 0.80 instead of 80%). This transformation should not be used with bioassay data that are not expressed in percentages, such as growth rate or biomass.
If heterogeneous variances are encountered with biomass data, a log10 transformation may be applied to stabilize the variances. This transformation is typically used for environmental data for which the variance increases as the mean increases (as may be the case for data related to the growth of organisms), and is often successful in making the variance independent of the mean (Sokal and Rohlf, 1969).
Tests for Normality and Homogeneity of Variances
The theoretical basis for the t-test assumes that both samples being tested come from a normal population with equal variances. Violation of these assumptions reduces confidence in the Type I error rate. As a result, tests for homogeneity of variances and normality should be conducted after applying appropriate data transformations and before conducting the t-test.
To test the null hypothesis "the data have been drawn from a normally distributed population", the Wilk-Shapiro statistic (or W test) should be used. A Cochran's test (or F test of variances) should be used to determine whether the variances are homogeneous or heterogeneous.

Form of t-Test
This section affirms that the one-tailed Student's t-test referred to in PSDDA guidance should normally be used in evaluating sediment bioassay data under SMS cleanup and source control programs. This consistency between programs will support cross-comparisons between data sets and reduce the potential for confusion among parties regulated by both programs. Use of the Student's t-test is contingent upon an assumption that the data set is normal and variances are homogeneous. If these conditions are not met following appropriate transformations, the Mann-Whitney test for statistical significance should be used in place of a t-test or approximate t-test.
Use of Multiple Comparison Tests
Several consultants and regulated parties have suggested that the agencies address whether multiple comparison tests (such as ANOVA and Dunnett's) could be used in place of the t-test. Concerns have been raised that the use of multiple pair-wise tests in a single project could increase the Type I error rate for that project. Acceptable Type I error rates have typically been set by the agencies at 5%. However, if a multisample test design is used with a t-test, the Type I error rate increases with each additional station added to the comparison. For example, the null hypothesis tested in a multisample test might be "the mean of sample 1 is the same as the mean of sample 2, which are both the same as the mean of the reference station", or in mathematical terms:
Ho: u(1) = u(2) = u(reference)
While a true multisample comparison approach would control Type I error for the above hypothesis at 5%, multiple t-tests used for the same number of comparisons would have a higher Type I error rate (Zar, 1984).
However, this null hypothesis addresses the relationship of each station not only to the reference station, but to other test stations being evaluated. Under PSDDA and SMS bioassay evaluation procedures, this type of evaluation is not conducted. Under PSDDA, dredged material management units (DMMUs) are being evaluated individually for disposal; each may be dredged and disposed of independently of the others. This relationship can be expressed mathematically as:
Ho: u(1) < u(reference)
and
Ho: u(2) < u(reference)
For each comparison, the Type I error rate remains at 5%. Likewise, under SMS, each station is considered individually, and may or may not be compared to the same reference station as another. A hit/no-hit designation is made for each separate site station, and the Type I error for each individual station remains at 5%. Stations are not compared to each

other to determine if they are the same or different. Once all stations have been independently tested against an appropriate reference station, the agencies evaluate the number of stations with exceedances and the magnitude of these exceedances to determine the need for cleanup or source control.
An argument was made that the "overall" Type I error rate increases with each additional comparison. However, the agencies are not concerned with this overall error rate, since it is not likely to affect the final regulatory decision. When there is a 5% chance of error at each station, it is clear that as you make hit/no-hit decisions for a number of stations the overall chance of making one incorrect decision somewhere within that area increases. However, one incorrect assignment, or even several, are not likely to make a significant regulatory difference at cleanup sites where 30 or more stations may have been sampled. It is the overall number, pattern, and magnitude of hits that drive cleanup decisions, along with a wide variety of additional types of evidence.
In addition, the agencies are less concerned with a type I error (the chance that a clean station would be designated as dirty) than the type II error (the chance that a dirty station would be designated clean), since it is the latter that determines the power or ability of an agency to detect a contaminated site. At the alpha level set by the SMS, use of the ANOVA/Dunnett's procedure decreases the power, resulting in fewer detection's of contaminated sites. In order to get the same power as the t-test, the alpha level or type I error rate would also have to be increased. Thus it is not obvious that the ANOVA/ Dunnett's procedure offers better performance than the existing method. Therefore, under both programs, the pairwise comparison of the t-test is appropriate to the evaluation procedures that have been adopted.
Use of Multiple Reference Stations
For some projects, samples from multiple reference stations are being collected. This is often done to increase the chances that at least one reference station will meet performance standards, or to collect reference samples representative of different grain size regimes present at the site. In addition, field replicates are sometimes collected to assess sediment heterogeneity or variation due to sampling procedures. Because the SMS rule and PSDDA evaluation procedures were written assuming a single reference station, there has been some uncertainty in how to perform comparisons to reference when there are data for more than one acceptable reference station. The following guidance is provided on assessing bioassay results with multiple reference stations:
· As discussed above, pair-wise comparisons are currently being used in both the PSDDA and SMS programs. Multiple comparison tests that compare the distribution of data at the project location to the distribution of data at a reference area are not appropriate for PSDDA because of the need to treat each individual DMMU separately. The SMS decision process is not structured to allow this type of comparison, and additional development work would need to be done on evaluation procedures if this were contemplated. Therefore, for each site station, a single reference station must be selected for the regulatory comparison.

· If field replicates have been collected at any of the reference stations, the following procedure should be used for statistical tests. Determine the mean response of the lab replicates for each field replicate. Then find the average of the means of all the field replicates and compare this average to the performance standards. This determines whether the station as a whole passes performance standards. An individual field replicate may be excluded or rejected if, in the agency's discretion, it was adversely affected by a sampling, handling, or laboratory problem not representative of environmental conditions at the station.
· For subsequent statistical testing, all field replicate data at a reference station may be pooled, or a representative field replicate may be selected for each station. Pooled data should be analyzed using the nonparametric Mann-Whitney test, since the number of replicate data at the site station will be different from the reference station. In selecting a representative replicate, consideration should be given to the degree of variability as well as absolute response. Treatment of field replicate data for statistical analysis should be discussed in the SAP and approved in advance by the lead agency.
· In cases where grain size varies widely at the site, multiple reference stations may be collected to allow comparison of site stations to the acceptable reference station that most closely matches it in grain size. This is particularly appropriate when the bioassay organism used is known to be affected by grain size (e.g., Rhepoxynius or Ampelisca). Reference stations that do not meet performance standards should be eliminated from the evaluation and each site station compared to the remaining reference station with the closest percent fines.
· If grain size is not an issue, the performance of multiple reference stations should be evaluated with respect to all bioassays being conducted, and any reference stations eliminated that do not meet performance standards for all bioassays. If more than one reference station remains that meets all performance standards, a station should be recommended by the project proponent and approved by the lead regulatory agency prior to conducting the statistical analysis. Criteria for selecting an appropriate station could include selection of a station that best represents the overall habitat at the site (e.g., water depth, grain size, TOC), or a station could be selected that is representative of the range of responses (considering both magnitude and variability of the response) seen at the reference area.
· Tables reporting bioassay results should clearly identify which reference station was used for each comparison.
PROPOSED CLARIFICATIONS AND MODIFICATIONS
In summary, the following guidance is provided for the PSDDA and SMS programs:
· A null hypothesis shall be selected that reflects the one-tailed t-test approach and the type of endpoint being evaluated. Appropriate null hypotheses are provided above.
· Bioassay data expressed in percent should be transformed prior to statistical testing using the arcsine-square root transform. This data transformation should not be used for endpoints not expressed in percent (e.g., growth, biomass). A log10 transformation may be used with growth or biomass data.
· Bioassay data should then be tested for normality and homogeneity of variances, using the Wilks-Shapiro test (W test) and Cochran's test (F test for variances), respectively.
· Bioassay data passing both tests should be tested for statistical difference using a one-tailed Student's t-test. Bioassay data failing one or both of these tests should be tested for statistical difference using the nonparametric Mann-Whitney test.
· Multiple comparison tests (e.g., ANOVA, Dunnett's) are not to be used under either SMS or PSDDA.
· If field replicates are collected at reference stations, and/or multiple reference stations are available that pass performance standards, guidance provided above should be followed in using these data for statistical tests.
REFERENCES
Sokal, R.R. and F.J. Rohlf 1969. Biometry: The principles and practice of statistics in biological research. W.H. Freeman and Co, San Francisco, CA.
Zar, J.H. 1984. Biostatistical Analysis, 2nd Ed. Simon & Schuster Co., Englewood Cliffs, NJ.

PSDDA/SMS CLARIFICATION PAPER
NEANTHES 20-DAY GROWTH BIOASSAY - FURTHER CLARIFICATION ON NEGATIVE CONTROL GROWTH STANDARD, INITIAL SIZE, AND FEEDING PROTOCOL
Prepared by David Kendall (Corps of Engineers) for the PSDDA/SMS agencies.
INTRODUCTION
The PSDDA agencies implemented the 20-day biomass (growth) test at the beginning of Dredging Year 1993 (June 16, 1992). The latest bioassay protocol updates (PSEP 1995) reflect the PSDDA/SMS program bioassay protocol modifications through July 1995. Since that time a number of additional protocol issues have surfaced. This clarification summarizes those updates enacted by the PSDDA program on an interim basis in a letter sent to bioassay laboratory practitioners in November 1995.
The Neanthes test is also one of the chronic bioassays used in the SMS cleanup and source control programs. These programs also rely on the PSEP protocols and modifications made to these protocols at annual review meetings. Consistency in bioassay protocols between the SMS and PSDDA programs is highly desirable and will reduce confusion among laboratories and regulated parties. The following proposed modifications to the PSEP protocols are therefore also applicable to sediment bioassays conducted under SMS.
PROBLEM IDENTIFICATION
Interim Control Performance Standard. A 1995 PSDDA clarification paper established an interim minimum control performance guideline for mean individual growth rate at > 0.72 mg/individual/day, which was the mean growth rate for control sediments up to the time (1995 SMARM minutes). The PSDDA program data on which this guideline was established exhibited one standard deviation around the mean equal to + 0.34 mg/individual/day. The performance guideline did not reflect the observed variability in laboratory performance noted around the mean performance.
Initial Worm Size . In 1993, the PSDDA agencies clarified the initial starting size requirements for the Neanthes test. The protocol clarification established a minimum worm size of 0.5 mg (dry weight). Since implementing this as a PSDDA and SMS program requirement it has come to light that many labs are having difficulty meeting the 0.5 mg initial weight size, although the PSDDA agencies have generally applied the initial starting worm size as a guideline rather than as an absolute standard.
Feeding Protocol. An additional Neanthes growth test issue concerns the feeding protocol. The July 1995 PSEP protocol revision (page 68, fourth paragraph, last sentence) states "During the holding period, ... If the entire amount of food provided is being eaten, then an increase in the food ration might be appropriate." The feeding protocol stipulates
a feeding ration of Tetra Marin of 8 mg/individual every two days. However, deviations from a strict feeding protocol may introduce variability in the test results, given the documented effect of feeding on growth (Johns and Ginn, 1990; Moore and Dillon, 1993).
PROPOSED ACTION/MODIFICATION
Control Performance Standard. Recent data submitted to the PSDDA program after the control growth performance guideline was implemented (August 1995) suggest that bioassay laboratories can routinely achieve control growth rates > 0.72 mg/ind/day. Therefore, the PSDDA and SMS programs reaffirm the interim control performance guideline of > 0.72 mg/ind/day as a target. However, control growth rates below 0.38 mg/ind/day will be considered a QA/QC failure. Laboratories failing to achieve a control growth rate > 0.38 mg/ind/day may be required to retest.
The PSDDA agencies will continue to closely monitor the performance of this test and may adjust the control performance guideline in the future. This performance standard was adopted in the December 1995 SMS update.
Initial Worm Size . An evaluation of three years of PSDDA/SMS program data regarding initial starting size suggests that there is much more variability in the control and reference growth exhibited over the 20-day exposure period when average initial worm sizes are less than 0.25 mg (dry weight). The results suggest that worms larger than 0.25 mg (dry weight) exhibit similar growth rates to worms larger than 0.5 mg (dry weight). The PSDDA and SMS programs reaffirm the 0.5 mg (dry weight) initial growth weight as a guideline target and may consider tests initiated with worms smaller than 0.25 mg (dry weight) as a QA/QC failure.
Feeding Protocol. Under no circumstances should the feeding rate be increased over the 8 mg/individual ration (Tetra Marin) every two days. Deviations from strict protocol feeding requirements will make the test results invalid for PSDDA/SMS regulatory decision making.
REFERENCES
PSEP. 1995. Recommended guidelines for conducting laboratory bioassays on Puget Sound Sediments (July 1995 Revisions). Prepared for U.S. Environmental Protection Agency, Region 10, Office of Puget Sound, Seattle, WA, and the Puget Sound Water Quality Authority, Olympia, WA.
Johns, D.M. and T.C. Ginn, 1990. Development of a Neanthes sediment bioassay for use in Puget Sound. Prepared by PTI Environmental Services for U.S. Environmental Protection Agency, Region 10, Seattle, WA.

Moore, D.W. and T.M. Dillon, 1993. The relationship between growth and reproduction in the marine polychaete Nereis (Neanthes) arenaceodentata (Moore): implications for chronic sublethal sediment bioassays. J. Exp. Mar. Bio. Ecol., 173: 231-246.
CLARIFICATION PAPER (FINAL - 20 JULY 1995)
IN-BATCH TESTING FOR REFERENCE SEDIMENTS FOR PSDDA BIOASSAYS
Prepared by David Kendall (Corps of Engineers) for the PSDDA agencies.
INTRODUCTION
Reference sediments are collected from appropriate reference collection areas (i.e., removed from sources of contamination) and are similar in grain size characteristics to the material tested from the dredging area. The primary purpose of the reference is to determine the response of the bioassay organisms to sediments with physical characteristics similar to the proposed dredged material as a point of comparison for test responses. The reference sediment is compared directly with the test sediment response using a student t-test to evaluate whether there is a statistically significant difference in response. Any subtle difference in test conditions (e.g., temperature, dissolved oxygen, salinity, etc.) can influence the test outcome. For this reason, control and reference sediments should all be run within the same batch as the sediment being evaluated from any given dredging area. This will ensure that environmental conditions during the exposure period are similar for all exposures within any given batch. The PSDDA program clarified in-batch testing as a requirement for the saline Microtox bioassay at the second annual review meeting held in April 1990.
PROBLEM IDENTIFICATION
It has recently come to light that laboratories conducting PSDDA bioassays were unsure whether or not in-batch testing of reference sediment and test sediment is necessary to meet PSDDA program QA/QC requirements for the amphipod bioassay, sediment larval bioassay, and the 20-day Neanthes growth bioassay. The current PSEP (Puget Sound Estuary Program) bioassay protocols under revision do not explicitly state that in-batch testing of the above mentioned bioassays is required. The PSDDA program has consistently required in-batch analysis of test and appropriate reference sediments for all bioassays. This is necessary to ensure that reference sediment s and test sediments are exposed to the same test conditions through the exposure period.
PROPOSED ACTION/MODIFICATION
This clarification is provided to specifically confirm that in-batch testing of test sediments and an appropriate reference sediment is required for all PSDDA bioassays. Statistical comparisons of reference and test sediment must be within batch. Failure to conduct in-batch testing of reference and test sediments may result in a requirement to retest as a quality control failure.
REFERENCES

PSDDA ARM. 1990. Second Annual Review Meeting Minutes. Prepared by the PSDDA agencies.

CLARIFICATION PAPER
RESTRICTION ON EXOTIC SPECIES IMPORTATION
Prepared by Maria V. Peeler (Department of Ecology) for the PSDDA agencies.
INTRODUCTION
The Washington State Departments of Fisheries and Wildlife (DFW) have promulgated regulations restric ting the importation of exotic species into Washington State [1]. Department of Fisheries regulations concern the possibility of release of fish or shellfish diseases from laboratories [2], while Department of Wildlife regulations concern the possibility of release of deleterious exotic organisms from laboratories [3].
PROBLEM IDENTIFICATION
Because PSDDA regulatory decisions depend on several bioassay tests which import species not native to Washington (primarily Neanthes arenaceodentata and Ampelisca abdita), clarification of exotic species importation under the PSDDA program is appropriate. The PSDDA agencies believe laboratories are currently conscientious in their management and disposal of exotic species and exposed sediments. However, additional education/clarification to practitioners will decrease the potential for violations. Any laboratory bioassay or bioaccumulation practice which could potentially endanger Washington State's natural resources, including fish and shellfish, should be discontinued.
PROPOSED ACTION/MODIFICATION
Laboratories conducting bioassay or bioaccumulation tests under PSDDA are expected to meet the disposal requirements identified by Ecology's toxicity test protocols, PSEP protocols, and other regulatory requirements, as well as best management practices (BMPs) developed by DFW. Laboratories must also have documentation on the source of test organisms, the disposal practices for test organisms, and the discharge practices for test solutions, sediments and culture water, including disinfection of discharged water. This documentation must be included in the laboratory's Quality Assurance/Quality Control report, with the test results (QAl information). A list of approved sources for shellfish, as well as copies of the regulations, BMPs and protocols are available from the Department of Ecology.
REFERENCES
1. Chapter 220-77 WAC. Aquaculture Disease Control, Washington State Department of Fisheries.
2. Department of Fisheries. 1993. Draft Procedures for the Containment of Fish and Fish Pathogens in Research Facilities Operated in the State of Washington.

3. Chapter 232-12-017 WAC. Deleterious Exotic Wildlife, Washington State Department of Wildlife.

REVISED CLARIFICATION PAPER
INTERIM REVISED PERFORMANCE STANDARDS FOR THE SEDIMENT LARVAL BIOASSAY
Prepared by David Fox and Therese Littleton (Corps of Engineers) for the PSDDA agencies.
INTRODUCTION
Bioassays are used in the PSDDA program to assess toxic and chronic sublethal effects of sediments proposed for dredging with open-water disposal. Performance standards for both negative controls and reference sediments are used to ensure the validity of test results. At the time the sediment larval bioassay was instituted for use in the PSDDA program, high mortalities were being experienced in the bivalve test and the performance standard for the negative seawater control combined mortality and abnormality (effective mortality) was set at fifty percent [1]. The reference sediment seawater-normalized effective mortality was set at twenty percent, which matched the reference sediment performance standard in the amphipod test. Five years have elapsed since the implementation of the PSDDA sediment larval test and a review of the compiled data has provided the PSDDA agencies the opportunity to re-examine the performance standards for this bioassay.
PROBLEM IDENTIFICATION
The current PSDDA guideline for reference sediment seawater-normalized effective mortality is twenty percent. Under this guideline, a large percentage of reference data has been rejected from use in decision-making under the PSDDA program. When this occurs, the PSDDA agencies must require a retest, set aside the test results and make a decision based on the results from the other bioassays, or rely on best professional judgment in interpreting the data.
Using the PSDDA bioassay data residing in the Dredged Analysis Information System (DAIS), frequency distributions for effective mortality and abnormality in the seawater controls (Figure 1), and effective mortality in test sediments and reference sediments (Figure 2), were derived. The distributions of effective mortality for the test and reference sediments are similar and overlap to a great degree. This result was not unexpected, since a relatively small fraction of the sediments tested under PSDDA have exhibited significant toxicity. However, the mortality distribution of larvae in both reference sediments and test sediments exhibits a degree of variability not anticipated when the sediment larval test was first implemented. The performance standards for this test do not adequately reflect this variability.
The seawater control performance standard, on the other hand, has been unnecessarily flexible. Very few projects have exhibited mortality in the seawater control greater than the PSEP standard of thirty percent [2].

Previous work has suggested guideline modifications to the sediment larval bioassay. The Sediment Management Unit of the Washington Department of Ecology proposed standard deviation guidelines of 22% for reference samples and 15% for test samples, reflecting the 95th and 80th percentiles, respectively, of the standard deviation distributions [3]. Review of the DAIS data resulted in similar distributions, with the majority of sediments exhibiting standard deviations of 20% or less (Figure 3). Other studies have suggested stronger consideration of non-treatment factor effects on sediment larval mortality. An EPA-contracted report emphasized un- ionized ammonia and sulfide-related mortality; however, no samples in the PSDDA database exceeded the threshold level for un- ionized ammonia, and the institution of aeration in the sediment larval test has effectively addressed the sulfide concerns [4]. Additional work has shown that no non-treatment factors are significantly correlated with reference sediment larval mortality [5].
PROPOSED ACTION/MODIFICATION
The seawater control performance standard for effective mortality should be adjusted to thirty percent (from fifty percent). Past control data show that this adjustment would have resulted in only a small number of tests exceeding the revised seawater control performance standard. In conjunction with this reduction in allowable effective mortality in the seawater control, use of the seawater control abnormality standard should be discontinued. Although Figure 1 does not show a problem with labs meeting this performance standard, feedback received prior to [6], and at, the PSDDA annual review meeting, revealed that labs often repeat the larval test due to marginal exceedances of the abnormality standard, even though the effective mortality may be quite acceptable. Bioassay practitioners have provided similar comments to the Puget Sound Water Quality Authority and will likely result in the elimination of the abnormality performance standard in PSEP as well.
The reference performance standard needs to more accurately reflect the variability exhibited historically in this test. Adjusting the seawater-normalized effective mortality performance standard to thirty-five percent will result in fewer reference sediments being rejected. However, in light of the demonstrated variability, additional adjustments must be made to ensure that the test possesses adequate power to minimize Type II errors (accepting the null hypothesis of no difference between test and reference responses when, in fact, they are different) [7]. Establishing a performance standard for both reference and test standard deviations of 20% and adjusting the alpha level (the probability of making a Type I error, rejecting the null hypothesis of no difference between test and reference responses when, in fact, they are not different) from 0.05 to 0.1, will assure a power greater than 0.60 with a minimum detectable difference of twenty percent [8].
These adjustments provide a win-win situation. Environmental protectiveness is increased by the adjustment to alpha and the fact that the maximum possible uncorrected effective mortality for refe rence sediments is actually reduced (from 60% to 54.5%). Test viability is increased (and the number of retests decreased) by providing greater latitude

for the reference sediment performance. A summary of the current and proposed guidelines, and the number of sediments in DAIS which would fail to meet these performance standards, is shown in Table 1.
Table 1. Current and Proposed Larval Guidelines
CURRENT GUIDELINE
REJECTED SEDIMENTS
PROPOSED GUIDELINE
REJECTED SEDIMENTS
Alpha level: 0.05 N/A 0.10 N/A Seawater Control: 50% EM 0 (n=41) 30% EM 4 (n=41)
Seawater Control: 10% A 1 (n=41) eliminate 0
Reference Sediment: 20% NEM 24 (n=61) 35% NEM 7 (n=61)
N = Normalized (to seawater control), E = Effective, M = Mortality, A = Abnormality, N/A = not applicable
With the proposed guideline changes, reference test performance failures would be reduced significantly (from 39% to 11%) and the guideline would more accurately reflect the historical data distribution. To preserve the environmental protectiveness of the test in a statistically valid way, the standard deviation guideline will be implemented, resulting in some test rejections due to exceedances of this guideline. Overall, these changes translate into greater environmental protectiveness and a more reliable sediment larval bioassay, with fewer retests required.
The pressing need to increase the utility of this test resulted in the promulgation of these interim guidelines. Before more permanent guidelines are established, it is proposed that the sediment larval data used to establish these interim guidelines be considered, along with other pertinent data, by the technical work group which will be reviewing this test. It is further proposed that a statistician participate as a member of the work group to review the historical data set and make recommendations concerning performance standards and power analysis.
To summarize, the interim method for evaluating sediment larval bioassay data is as follows:
1) Examine seawater control and reference sediment performance:
- If the seawater control effective mortality exceeds 30%, reject the test.
- If the reference sediment (seawater-normalized) effective mortality exceeds 35%, reject the reference sediment.

2) Examine the test sediment data for toxicity using an unpaired one-tailed t-test:
- If the test sediment effective mortality (seawater-normalized) is less than or equal to 20%, no statistical analysis of the data is needed; the test sediment is considered non-toxic.
- If the test sediment effective mortality (seawater-normalized) is greater than 20% and is statistically different from reference (alpha = 0.1) but less than or equal to 30% over reference (15% for dispersive sites), the test sediment scores a hit under the two-hit rule.
- If the test sediment effective mortality (seawater-normalized) is greater than 20% and is statistically different from reference (alpha = 0.1) and greater than 30% over reference (15% for dispersive sites), the test sediment scores a hit under the one-hit rule.
3) For non-hits, examine the standard deviations:
- If the standard deviations for both the test and reference sediments are less than or equal to 20%, accept the test results.
- If the standard deviation for either test or reference exceeds 20%, perform a power analysis.
4) For non-hits, with reference and/or test sediment standard deviation greater than 20%, evaluate the power using the Borenstein and Cohen power analysis software. The power of the t-test to detect a 20% difference between test and reference sediment means will be evaluated using the actual test and reference standard deviations:
- If the power is less than 0.6, reject the test results.
- If the power is greater than or equa l to 0.6, accept the test results.
REFERENCES
1. Puget Sound Dredged Disposal Analysis. 1989. Phase II Management Plan Report.
2. Puget Sound Estuary Program. 1991. Recommended Guidelines for Conducting Laboratory Bioassays on Puget Sound Sediments, Interim Final. U.S. Environmental Protection Agency, Region 10, Seattle, WA.
3. Gries, T. and K. Waldow 1994. Re-evaluation of Some Puget Sound Apparent Effects Thresholds. Washington Department of Ecology.
4. USEPA. 1993. Refinements of Current PSDDA Bioassays-Final Report. Submitted by: Thompson, T., Science Applications International Corporation, Environmental Sciences Division, Bothell, WA.

5. Fox, D.F. 1993. The Effects of Nontreatment Factors in the PSDDA Sediment Larval Test (unpublished).
6. Cappellino, S. (Parametrix, Inc). 1994. Letter to the Dredged Material Management Office (see minutes of the 1994 annual review meeting).
7. Sokal, R.R. and F.J. Rohlf. 1969. Biometry. W.H. Freeman and Company, San Francisco.
8. Borenstein, M. and J. Cohen. 1988. Statistical Power Analysis: A Computer Program. Lawrence Erlbaum Associates, Inc., 365 Broadway, Hillsdale, NJ 07642.

CLARIFICATION
SPECIES SUBSTITUTION FOR THE 10-DAY AMPHIPOD BIOASSAY
Prepared by David Kendall (Corps of Engineers) for the PSDDA agencies.
INTRODUCTION
The PSDDA program currently specifies the use of Rhepoxynius abronius as the test species for the 10-day amphipod bioassay. Over four years of PSDDA program experience have shown this organism to be a reliable bioassay species for assessing biological effects of dredged material. However, this experience has also shown this organism to be sensitive to dredged material exhibiting high percentages of fine-grained sediment. Additionally, the PSEP amphipod bioassay protocol states "Rhepoxynius abronius is appropriate for sediments with interstitial water salinity of > 25 parts per thousand (ppt)". It recommends the use of Eohaustorius estuarius to assess sediments when interstitial water salinities are below 25 ppt.
PROBLEM IDENTIFICATION
The quantitative relationship of Rhepoxynius abronius survival in reference sediments of varying grain sizes has been described by DeWitt et al (1988). For example, a regression equation (upper 95 percent confidence limit) describing this relationship predicts a mortality of 23.7 percent with 70 percent fines (DeWitt et al, 1988).
Regulatory experience with Rhepoxynius exposed to sediments of varying grain size distributions has confirmed its sensitivity to sediments exhibiting high percentages of fine-grained sediments (i.e. greater than about 60 percent clay/silt). This sensitivity to fine-grained sediments can lead to false positive results in dredged material quality assessments. False positive results confound regulatory interpretations, especially when reference sediment performance guidelines are exceeded, and ultimately lead to a PSDDA agency decision to either retest or apply best professional judgment to the interpretation of dredged material suitability for unconfined open-water disposal.
Assessing dredged material in tidally-influenced rivers, where interstitial salinities fall below 25 ppt may lead to test performance problems with Rhepoxynius, unless interstitial salinities are adjusted as recommended by PSEP (higher than 25 ppt) prior to initiating the test.
A number of amphipod species in addition to Rhepoxynius are approved in national guidance for dredged material testing under the Ocean Dumping testing manual ("Greenbook") and the draft "Inland (404) Testing Manual". Two of these species have been used in Puget Sound previously, have ASTM protocols (ASTM 1991), and appear to be less sensitive to fine-grained sediment than Rhepoxynius. These are Ampelisca abdita and Eohaustorius estuarius . Ampelisca has been utilized over the past year in non-PSDDA areas such as Grays Harbor to assess dredged material with high percent fines (approaching 95 percent) in lieu of Rhepoxynius. The results of these tests were satisfactory in assessing the suitability of dredged material for unconfined open-water disposal. Eohaustorius is common in Pacific Coast estuaries, and would be a suitable species to test fine-grained dredged material when interstitial salinities are lower than 25 ppt.
PROPOSED ACTION/MODIFICATION
The PSDDA program will allow the flexibility to substitute Ampelisca abdita for Rhepoxynius when
Page 1 of 2CLARIFICATION
03/28/2002file://Y:\OD_DMMO\5th_arm\amph_93.htm

testing dredged material exhibiting high percentages of fines (i.e. greater than 60 percent). In estuaries, where interstitial salinities range from 2 to 25 ppt, the estuarine amphipod Eohaustorius estuarius may be substituted for Rhepoxynius when testing fine-grained dredged material. However, Rhepoxynius will remain the preferred amphipod species for coarser-grained sediments. Any proposed species substitutions for the amphipod bioassay must be coordinated with the Dredged Material Management Office, and approved by the PSDDA agencies, prior to testing.
REFERENCES
ASTM, 1991, E1367-90. Standard guide for conducting 10-day static sediment toxicity tests with marine and estuarine amphipods. Annual Book of ASTM Standards, Vol. 11.04. American Society for Testing and Materials, Philadelphia,
PA.DeWitt,T.H., G.R. Ditsworth, and R.C.Swartz, 1988. "Effects of natural sediment features on survival of the phoxocephalid amphipod Rhepoxynius abronius," Mar. Environ. Res. 25:99-124.
EPA/COE, 1991. Evaluation of Dredged Material Proposed for Ocean Disposal - Testing Manual. Prepared by the Environmental Protection Agency, Office of Marine and Estuarine Protection, Washington, D.C., and Department of the Army, U.S. Army Corps of Engineers, Washington, D.C.
EPA/COE, 1993. Draft Inland Testing Manual. Prepared by the Environmental Protection Agency, Office of Water, Washington, D.C., and Department of the Army, U.S. Army Corps of Engineers, Washington, D.C.
PSEP, 1991. Recommended Guidelines for Conducting Laboratory Bioassays on Puget Sound Sediments (Interim Final). Prepared for U.S. Environmental Protection Agency, Region 10, Seattle, Washington.
Page 2 of 2CLARIFICATION
03/28/2002file://Y:\OD_DMMO\5th_arm\amph_93.htm

CLARIFICATION
THE NEANTHES 20-DAY BIOASSAY - REQUIREMENTS FOR AMMONIA/SULFIDES MONITORING AND INITIAL WEIGHT
Prepared by David Fox (Corps of Engineers) for the PSDDA agencies.
INTRODUCTION
The PSDDA agencies implemented the Neanthes 20-day biomass test at the beginning of Dredging Year 1993. At that time no formal requirements were established for ammonia/sulfides monitoring or initial worm weight. The Recommended Protocols for Measuring Selected Environmental Variables in Puget Sound (PSEP, 1991) include ammonia and sulfides as optional measurements. The PSEP-recommended starting weight for individual worms is 0.5-1.0 mg (dry weight), which corresponds to an age of 2-3 weeks post-emergence.
PROBLEM IDENTIFICATION
Nontreatment factors such as ammonia and sulfides can affect the results of sublethal bioassays such as the Neanthes biomass test. When such nontreatment effects occur, water quality monitoring measurements are essential in determining the factors contributing to the expressed effect. The Waterways Experiment Station has made the following recommendations regarding the Neanthes biomass test (Moore et al., 1992): 1) measured total ammonia levels in tests with N. arenaceodentata should be < 10 mg/L (overlying water) and 2) measured total sulfides concentrations should be < 3.0 mg/l (overlying water).
Worm size is also a critical factor and can affect handling errors and growth rate at the beginning of the test.
PROPOSED ACTION/MODIFICATION
The PSDDA agencies are instituting the requirement to conduct ammonia and sulfides monitoring at the beginning and end of the Neanthes 20-day biomass test. In addition, there is evidence that aqueous ammonia may reach its maximum value nearer the beginning of the test (Cappellino, 1993). Therefore, it is highly recommended that ammonia and sulfides monitoring also be conducted prior to the first and second water renewals. The minimum worm size that may be used is 0.5 mg (dry weight). While it is recommended that the starting weight be less than 1.0 mg, the PSDDA agencies are not establishing this as a requirement at this time due to the logistics involved in obtaining worms from the supplier.
REFERENCES
Cappellino, S. 1993. Letter to the Dredged Material Management Office dated 9 June 1993. Parametrix, Seattle.
Moore, David W., and Dillon, Thomas M. 1992. Chronic sublethal effects of San Francisco Bay sediments on Nereis (Neanthes) arenaceodentata; Nontreatment factors, Miscellaneous Paper D-92-4. U.S. Army Corps of Engineers Waterways Experiment Station, Vicksburg.
PSEP, 1991. Recommended Protocols for Measuring Selected Environmental Variables in Puget Sound, Puget Sound Water Quality Authority, Olympia.
Page 1 of 1CLARIFICATION
03/28/2002file://Y:\OD_DMMO\5th_arm\neant_93.htm

ISSUE PAPER
MODIFICATIONS TO HOLDING TIME FOR BIOLOGICAL TESTING
Prepared by David Kendall and David Fox (Corps of Engineers) for the PSDDA agencies.
INTRODUCTION
PSDDA bioassays must be performed within an established time limit. This time limit, or "holding time", has been established to ensure that biological testing results reflect the in-situ conditions at the proposed dredging site. Natural processes, such as chemical and biological degradation, speciation and volatilization, can alter the chemical composition of a sediment if proper storage conditions and holding times are not met. PSDDA currently requires that biological testing be initiated within six weeks of sediment collection. Sediments must be stored at 4 degrees C and, if biological testing does not commence within two weeks of sampling, sediments must be stored under a nitrogen atmosphere.
A recommended two-week holding time for bioassay sediment is indicated in the Puget Sound Protocols and Guidelines. However, the Protocols and Guidelines are currently under revision to recognize that regulatory and management programs using a tiered testing strategy will not be able to meet that guideline.
PROBLEM IDENTIFICATION
Under PSDDA guidelines, biological testing may be performed concurrently with chemical testing, or tiered testing may be chosen. Tiered testing generally allows greater economy, as only those sediment samples which exceed chemical screening levels must undergo biological testing. The problem is that chemical testing takes time. Laboratories many times face backlogs of samples to be tested (PSDDA samples comprise only a small fraction of the typical lab's business). Often chemical testing results are not available for 4-6 weeks after sampling has been completed.
To provide smooth biological testing, a minimum of two weeks in good weather and three weeks in bad, should be allowed for startup. Organisms must be obtained (and cultured if necessary), conditioned and equilibrated prior to testing. The experimental apparatus must be set up. Reference and control sediments must be obtained.
Both chemical and biological testing practitioners feel harried to get their tests completed or started, respectively. In several cases in the past year, dredging consultants were pressed right against the 42 day holding time, trying to get last minute data from chemical labs, while trying to get biological testing geared up. This situation not only produces stress for all involved but drives up costs because dredging applicants are forced to pay premium prices for chemical testing to get a faster turnaround, and biological testing labs charge higher prices due to the uncertainty with the number of samples to be run and the short lead times provided by dredging applicants. These factors reduce the cost effectiveness of tiered testing.
Tiered testing must remain a viable option to keep PSDDA testing costs down. This problem will continue as long as a six week holding time remains in effect. Results from recent studies have provided evidence needed in extending holding times for biological testing.
PROPOSED MODIFICATION
Page 1 of 2ISSUE PAPER
03/28/2002file://Y:\OD_DMMO\3rd_arm\biotim91.htm

It is proposed that the holding time for sediments undergoing biological testing be extended to eight weeks. Data supporting this change are provided in the following documents. A study prepared for EPA on the effect of holding times on response in the amphipod test, Neanthes biomass test, and the microtox test (B1). The study showed for all three bioassays, there was no observed decrease in toxicity even beyond 8 weeks, and changes when noted were associated with increased toxicity with increasing holding time. These results are further corroborated by a recent study by the Corps' Waterways Experiment Station conducted for the New York District Corps of Engineer (B2). Holding times extending beyond 4 to 8 weeks showed no decrease in toxicity, but did show some evidence of increased toxicity. From a regulatory perspective, an increase in toxicity would be more environmentally conservative, with the increased risk of a sediment sample (i.e., a dredged material management unit) exceeding disposal guidelines for unconfined, open-water disposal being carried by the applicant. In conclusion, these two studies indicate that an increase in holding time for biological analyses to eight weeks is justified.
REFERENCES
B1. Becker, D. S. and T. Ginn. 1990 (Draft). Effects of Sediment Holding Time on Sediment Toxicity. Prepared for U.S. EPA, Region 10, Office of Puget Sound. By PTI Environmental Services, Bellevue, WA.
B2. Tatum, Henry E., D. L. Brandon, C. L. Lee, A. S. Jarvis, R. G. Rhett. 1991. Effects on Sediment Toxicity, Bioaccumulation Potential, and Chemistry. Miscellaneous Paper EL-91-2, US Army Engineers Waterways Experiment Station, Vicksburg, MS.
Page 2 of 2ISSUE PAPER
03/28/2002file://Y:\OD_DMMO\3rd_arm\biotim91.htm

CLARIFICATION
ECHINODERM EMBRYO SEDIMENT BIOASSAY PROTOCOL
Prepared by David Kendall (Corps of Engineers) for the PSDDA agencies.
INTRODUCTION
At a PSDDA sponsored bioassay workshop conducted on July 10, 1990 it was apparent that for the echinoderm embryo sediment bioassay a number of protocol issues needed clarification. The proposed clarifications ensuing from this workshop will be adopted and implemented by the PSDDA program to insure consistency in the running of this bioassay and the quality of the data for regulatory decision making. The bioassay workshop recommendations on bioassay protocol clarifications were also sent to EPA's Office of Coastal Waters for future PSEP bioassay protocol revisions.
PROBLEM IDENTIFICATION
The following protocol issues requiring better specifications are discussed as follows:
(1) Temperature. Due to longer development times required for the echinoderm embryo bioassay at 12 degrees Centigrade, the bioassay temperature specification should be changed to 15 degrees Centigrade. This recommendation was endorsed by the July 10, 1990 bioassay workshop participants. At 15 degrees Centigrade, most labs report that they get pluteus larval development within 48-96 hours.
(2) Test Duration. The workshop endorsed adopting a minimum test duration of 48 hours, with no maximum test duration specified. Experience in the PSDDA program to date has shown that some echinoderm embryo sediment bioassays may have been terminated prior to full pluteus larval development in the seawater control. To insure that the tests are not terminated prematurely, a minimum test duration specification of 48 hours is proposed for implementation.
(3) Test Endpoint. The workshop recommendation for test endpoint was as follows: monitor seawater control until at least 90 percent (preferably more) of the pluteus larvae are well developed with deeply invaginated preoral arms. Abnormality in the seawater control should not exceed 10 percent. No test should be terminated before 48 hours have elapsed as noted above.
(4) Test Termination. Carefully (gently) stir up the water in each test beaker to insure larvae are suspended in the water without disturbing the sediment; then carefully decant up to 95 percent of the water (80-95%) leaving the sediment remaining in the test beaker. The decanted water should be thoroughly mixed to insure uniform distribution of larvae prior to removing up to three 10 ml aliquots, each of which is fixed with buffered formalin. One l0 ml aliquot is then counted, while the other two are archived until counts are assured to be adequate for characterizing test replicates.
PROPOSED CLARIFICATION
The following protocol clarifications will be implemented to insure high quality data for PSDDA program regulatory decision-making.
(1) Temperature. The temperature specifications for the echinoderm embryo sediment bioassay should be changed to 15 +/- 1 degree, Centigrade.
Page 1 of 2CLARIFICATION
03/28/2002file://Y:\OD_DMMO\3rd_arm\larv_91.htm

(2) Test Duration. Tests should not be terminated prior to 48 hours, and before the pluteus larval development endpoint. Test duration normally should be 48-96 hours at 15 degrees Centigrade, but no upper limit for test duration is specified. Test duration depends on larval development.
(3) Test Endpoint. The test endpoint is reached when 90 percent or more of the developing larvae have reached the pluteus larval stage, where the larvae are well developed with deeply invaginated preoral arms in the seawater control. Abnormal pluteus larvae in the seawater control should not exceed 10 percent as a general rule.
(4) Test Termination. To terminate the test, the water in test beakers should be carefully (gently) stirred to insure that larvae are in suspension without disturbing the sediment. The water is then carefully decanted so that a maximum of 20 percent of the water remains in the beaker. The decanted water containing generally between 80 to 95 percent of the tested volume is then thoroughly mixed to insure uniform larvae distribution, and three 10 ml aliquots are removed and each fixed with buffered formalin. One 10 ml aliquot is then counted, while the other two remain archived until the counts rendered for the other replicate is assured to be adequate.
Page 2 of 2CLARIFICATION
03/28/2002file://Y:\OD_DMMO\3rd_arm\larv_91.htm

CLARIFICATION
PSDDA REQUIREMENT TO COLLECT AND REPORT AMPHIPOD REBURIAL DATA
Prepared by David Fox (Corps of Engineers) for the PSDDA agencies.
PROBLEM IDENTIFICATION
The PSDDA program interprets the amphipod bioassay based on the mortality observed after 10 days exposure to the test sediment, and does not utilize the reburial data.
INTRODUCTION
The revised PSEP amphipod bioassay protocol which is soon to be released specifies a dual endpoint of mortality and the number of amphipods failing to rebury after 1 hour. The current PSDDA interpretation of the amphipod test does not utilize the amphipod reburial data, nor does it require collection and reporting.
PROPOSED CLARIFICATION
The PSDDA agencies will require the collection and reporting of amphipod reburial data. This requirement will be revisited during the ongoing technical review of the PSDDA biological testing requirements. In the meantime, PSDDA will require the collection and reporting of amphipod reburial data in order to be consistent with the 1991 revision of the PSEP protocols for bioassays.
Page 1 of 1CLARIFICATION
03/28/2002file://Y:\OD_DMMO\3rd_arm\amph_91.htm

CENPS-EN-PL-ER (400A) May 29, 1990
Memorandum for: RECORD
Subject: Wet Sieving Method for Percent Fines to Match Test Sediments and Reference Sediments
1. PSDDA requires running reference sediments which are matched against dredged material by percent fines (that is, the dry weight of sediment passing a standard 63 um sieve divided by the total dry weight of the sediment). This is difficult to do because the easily-obtained field measurements (wet weight, volume) are only surrogates for the dry-weight basis used in the laboratory. This memorandum describes an interim protocol for collecting field information that will allow a grain-size approximation.
2. The wet sieve method was developed by Dr. Tom Ginn, Dr. Scott Becker and Mr. John Green of PTI during studies conducted for EPA's PSEP. The technique (but not the figures used here) is described in a technical memorandum from PTI to EPA's Office of Puget Sound, titled "Reconnaissance Survey of Reference Area Sediments in Shallow Waters of Carr Inlet," dated February 1990. The following data and methods were verbally transmitted to John Wakeman of Seattle District by Scott Becker on May 29, 1990.
a. The method for the Carr Inlet cruise used a starting volume of 65 ml of sediment collected in a marked beaker. The sediment was gently washed on a 63 um sieve until the water passing the sieve was clear. The retained material was then carefully rinsed into a 100 ml graduated cylinder and allowed to settle until the supernatant water was also clear. For a sandy sediment this will occur quickly, within one minute; for a silty sediment, it may take up to 15 minutes. (Should colloidal materials remain in suspension after 15 minutes, then the sediment was not washed sufficiently on the sieve.) However, the endpoint is usually not determined by clarity, but instead the degree of compacted flocculated sediment. One should see at least a clear delineation between floc and supernatant water at endpoint.
b. Interpretation. Figure 1 shows the relationship that was developed by comparing field values with lab values. This relationship probably only holds for the Raft Island area. In general, the values appear to agree with the assumption that the wet density is equal to the dry weight: one would predict that 10% fines (=90% sands) would be 0.9*65mL (grams), or 58.5; the realized value is 56. For 89% fines (11% sands retained) 0.11*65 = 7.2 predicted, and 9 were recovered.
3. EPA commissioned PTI to do further studies on reference areas, and they will be developing this technique further during the studies; they are now using a standard of 50 ml of material.
JOHN WAKEMAN
Biologist
Page 1 of 1
03/28/2002file://Y:\OD_DMMO\2nd_arm\wetsiv90.htm

REQUIREMENT FOR ANALYZING FOR SEDIMENT CONVENTIONALS IN REFERENCE AREAS AND WATER QUALITY IN BIOASSAYS
CLARIFICATION PAPER
Prepared by David R. Kendall (Corps of Engineers) for the PSDDA agencies.
PROBLEM IDENTIFICATION
PSDDA agency review of recent bioassay test data has noted some apparent toxicity occurring in Puget Sound reference area sediments and test sediments, which appears to be related to the sediment "conventional" parameters of ammonia and sulfides, and grain size. In future, measurement of sediment conventional parameters (grain size, TOC, Total Volatile Solids, Total Solids, Ammonia, Total Sulfides) will be required of all reference area sediments during biological testing. Additionally, water quality monitoring of reference and test sediments will be required at the beginning and end of the amphipod bioassay, Neanthes 10-day acute bioassay, and sediment larvae (i.e., bivalve or echinoderm) bioassays unless specifically waived by the PSDDA regulatory agencies prior to testing. These data are deemed necessary to aid in the interpretation of the bioassay test results as noted in the Phase II MPR (page 5-27 and 5-32 to 5-33).
PROPOSED MODIFICATION
1. Sediment conventional parameters will be run on all reference sediments.
2. Ammonium/ammonia and total sulfides will be measured as water quality parameters in the amphipod bioassay, Neanthes 10-day acute bioassay, and the sediment larvae (bivalve or echinoderm) bioassay, unless waived by the PSDDA regulatory agencies.
REFERENCES
Phase II MPR (pages 5-27 and 5-32 to 5-33; page A-18)
Page 1 of 1REQUIREMENT FOR ANALYZING FOR SEDIMENT CONVENTIONALS IN REFERENCE AREAS AND WATER QUALITY IN BIOASSAYS...
03/28/2002file://Y:\OD_DMMO\2nd_arm\bio_qa90.htm

ACTIVITIES TO PROVIDE BETTER REFERENCE AREAS
STATUS REPORT
Prepared by Justine Barton (Corps of Engineers) and Brett Betts (Ecology) for the PSDDA agencies.
PROBLEM IDENTIFICATION
1. Reference sediments are used to account for physical effects of sediments (as opposed to chemical) and are required to perform sediment bioassays in the PSDDA program. In particular, the interpretation of the amphipod test is thought to be affected by grain size. Sediments are a complex mixture and many factors may affect toxicity responses of bioassay organisms to reference and project sediments. PSDDA specifies that reference sediment grain size match test sediment grain size, and also specifies performance standards (maximum allowable moralities) in reference sediments. The Department of Ecology is devising criteria for the selection of reference areas.
The following topics still require effort by the PSDDA agencies:
- improve reference area performance in tests, both by eliminating unexpected failures in reference, and by making it easier/less expensive for applicants to find areas with a suitable grain size distribution (within 5-10% of test sediment)
- study reference areas to improve knowledge of physical, biological and chemical characteristics.
Ideally, at some point in the future, the expected response for each PSDDA-required bioassay organism will be known for various grain sizes. At that time reference sediments may no longer be required.
2. During the past year, PSDDA agencies have attempted to improve reference area performance by gathering/providing better, more complete information on reference areas and by compiling information when reference area testing is performed. Department of Ecology funded a report entitled, "Interim Performance Standards for Puget Sound Reference Areas," June 1989. Interim performance standards for chemical variables were generally defined as the 90th percentile values for frequency distributions of chemical concentrations in potential reference areas (upper limits for the concentrations of chemicals in acceptable reference samples). The amphipod bioassay was quantitatively used, while other available information was qualitatively used to identify interim reference areas. Interim reference areas identified in the report were Carr Inlet, Dabob Bay, Samish Bay, and Sequim Bay. These are the same reference areas specified in the Phase I Evaluation Procedures Technical Appendix (EPTA).
The Department of Ecology's Puget Sound Ambient Monitoring Program (PSAMP) produced a report entitled, "Marine Sediment Monitoring," January 1990. This program is performing Sound-wide background analyses of areas away from contaminant sources (status and trends work). A number of samples were taken in areas under consideration for reference areas. This information is included in their report, and has also been transferred to the Puget Sound Water Quality Authority's Geographic Information System (GIS).
PROPOSED RESOLUTION
1. New Reference Areas. Project proponents have suggested a number of other potential reference sediment collection sites. These sites may be utilized if:
Page 1 of 2ACTIVITIES TO PROVIDE BETTER REFERENCE AREAS
03/28/2002file://Y:\OD_DMMO\2nd_arm\refsed90.htm

- biological tests are initially run using the proposed reference area along with an already recognized reference area
- and/or chemistry (PSDDA contaminants of concern) analysis is performed for the proposed area.
The PSDDA agencies are discussing needed information for new reference sites. Once a project proponent has gathered this initial information, or PSDDA agencies are satisfied that enough confirmatory information exists for a new reference area, the project proponent may reuse the area without additional testing. PSDDA agencies will consider information developed through PSAMP and other programs as well. A tool such as the PSWQA GIS maps or the PSDDA database can be used to convey the information to applicants.
2. Mixing Sediments. In order to obtain a reference sediment grain size match within 5-10% of the test sediment fine-grained fraction, mixing sediments from known reference areas has been suggested. Over the next year, the PSDDA agencies will continue to look into this issue. Current literature seems to indicate that increased handling (mixing or remixing) of material results in increased toxicity. In conduction with upcoming Federal projects, some studies will compare artificially blended (mixed) sediments with natural sediments.
3. Additional Work by Ecology. Additional work on reference areas funded by Ecology and EPA (PSEP). This study will look at Carr Inlet, Samish Bay, and Useless Bay. The study will cover 7 grain sizes and 1 water depth. No organics or benthic sampling/analyses will be performed. Tests run will include amphipod, oyster larvae/echinoderm, Neanthes, saline microtox, grain size, and TOC.
REFERENCES
PSDDA Management Plan Report, September 1989, section 5.6, pp. 5-32 to 5-34.
PSDDA Evaluation Procedures Technical Appendix Phase 1, June 1988, pp.II-68.
DeWitt, T.H.. G.R. Ditsworth, and R.C Swartz. 1988. Effects of Natural Sediment Features on Survival of the Phoxocephalid Amphipod, Rhepoxynius abronius. Mar. Environ. Res. 25:99-124.
Pastorok, RA, R. Sonnerup, JJ. Greene, M.A. Jacobson, L B. Read, and R.C Barrick. 1989 (June). Interim Performance Standards for Puget Sound Reference Areas. Report submitted by PTI Environmental Services Inc. to Ecology.
Page 2 of 2ACTIVITIES TO PROVIDE BETTER REFERENCE AREAS
03/28/2002file://Y:\OD_DMMO\2nd_arm\refsed90.htm

6/1/09 Final DMMP CLARIFICATION PAPER METALS BCOC LIST Prepared by Laura Inouye (Ecology) for the DMMP agencies. INTRODUCTION Currently eleven of the twelve metals and organometallic compounds on the DMMP’s Chemicals of Concern (COC) list have associated bioaccumulation triggers and are on the List 1 of bioaccumulative contaminants of concern (BCOCs). The original bioaccumulation triggers were developed over 20 years ago based on the best available sediment monitoring and risk assessment information (PSDDA, 1988). In 1998, the DMMP presented the rationale and general approach for re-evaluating bioaccumulation testing and interpretation which included revising the list of bioaccumulative contaminants required for analysis (Malek and Gries, 1998; Hoffman, 1998). In 2003 the BCOCs were organized into lists as follows:
• List 1 - is the primary list of bioaccumulative contaminants of concern. Analysis for
these 20 chemicals in sediments (and potentially tissues) is required to determine dredged material suitability. List 1 replaced the list of bioaccumulative compounds that were in effect at the time.
• List 2 - is the candidate list of bioaccumulative contaminants. Analysis of List 2 chemicals will be decided on an as-needed basis depending on the specifics of the project. List 2 chemicals will also be evaluated by the DMMP as part of disposal site monitoring and other special projects.
• List 3 – are chemicals that are potentially bioaccumulative but do not meet the criteria to be placed on any of the other lists. Many of the List 3 chemicals have been highlighted in the scientific literature as potentially bioaccumulative, but of unknown human/ecological toxicity. The List 3 chemicals will only be considered for analysis if there is a project-specific reason to believe that they may be present. It is expected that updates to the BCOC database will have the greatest implications for List 3 chemicals.
• List 4 – are chemicals that are not currently considered by the DMMP to be bioaccumulative based on the criteria used to develop these lists. A majority of the chemicals that were placed on List 4 have low octanol-water partitioning coefficients (Log Kow < 3.5). The remaining chemicals were placed on this list because of a preponderance of regional information showing that they rarely (if ever) occur in sediments and tissues at levels of toxicological relevance.
The criteria that were used to develop these lists included metrics of bioaccumulative potential (Log Kow), regional occurrence in sediments and tissues, and ecological and human toxicity.

This approach proved effective for prioritizing organic compounds, but resulted in the placing all but one of the metals (antimony) on List 1. The agencies agreed that alternative criteria should be developed for metals that explicitly consider their bioavailability and propensity to biomagnify up the food chain. However, the status of metals has not changed since their original listing, and all have remained on List 1 since 2003. List 1 Bioaccumulative Chemicals of Concern (metals only)
CHEMICAL METHOD INFORMATION LOG Kow BT (dry wt basis2)
METALS Arsenic SW846 M.6020 N/A 507.1 mg/kg Cadmium SW846 M.7131 N/A 11.3 mg/kg Chromium SW846 M.6020 N/A 267 mg/kg Copper SW846 M.6020 N/A 1027 mg/kg Lead SW846 M.7421 N/A 975 mg/kg Mercury SW846 M.7421 N/A 1.5 mg/kg Nickel SW846 M.6020 N/A 370 mg/kg Selenium SW846 M.7740 N/A 3 mg/kg
Silver SW846 M.7761 N/A 6.1 ug/kg Zinc SW846 M.6010 N/A 2783 ug/kg ORGANOMETALLIC COMPOUNDS Tributyltin (interstitial water) Krone/Unger 3.7-4.4 0.15 ug/L
PROBLEM IDENTIFICATION Existing monitoring data from Puget Sound as well as the scientific literature no longer support the listing of most divalent metals as List 1 bioaccumulative chemicals of concern in the Puget Sound region. EPA evaluated bioaccumulative metals in 2000, and determined that only mercury and arsenic were likely to biomagnify based on both laboratory and field studies (EPA, 2000). The following information was considered in the re-evaluation of these metals’ BCOC listing: 1. Cadmium, chromium, copper, nickel, silver, and zinc: These metals do not have
methylated or organic forms, making them unlikely to biomagnify, a conclusion which is supported by the EPA 2000 study. Additionally the new Sediment Evaluation Framework was unable to develop target tissue levels for these compounds for the protection of either wildlife or human health (SEF, 2009), and therefore would have no target tissue levels against which to evaluate the bioaccumulation testing results.
2. Lead: The Sediment Evaluation Framework lists this metal as having wildlife target tissue
levels but no human target tissue levels. Wildlife TTLs for deep water sites are 7.8 ppm wet weight for protection of individuals (ESA protective level) and 40 ppm wet weight for

protection of populations. Target tissue levels for protection of aquatic life are 0.4 ppm wet weight for marine systems. Examination of 943 marine tissue data in the EIM database indicated approximately 28% of the data exceeded the 0.4 ppm wet weight level protective of marine aquatic life, but there is only one exceedance of the ESA protective levels (a mussel sample in Sinclair Inlet, at 12 ppm wet weight).
3. Arsenic: Arsenic has established human target tissue levels, and 96% of all tissue data in
EIM exceed this value. Exceedances are based on detected concentrations of arsenic. Currently available scientific literature indicates that while arsenic does biomagnify, the source of the arsenic (water vs sediment) varies from region to region and between species (Meador et al., 2004; Waring and Maher, 2005).
4. TBT: TBT’s ability to bioaccumulate was addressed in previous issue papers (Michelson
1996), where data was presented indicating that TBT is a bioaccumulative compound of concern.
PROPOSED ACTION/MODIFICATION Based on the data presented above, the DMMP agencies propose to modify the current listing of the metals as follows: Cadmium, chromium, copper, nickel, silver and zinc will be removed from the BCOC List 1 and moved to List 4. These compounds will no longer have bioaccumulation triggers associated with them, but will continue to be analyzed in project and disposal site monitoring sediments as part of the standard COC evaluations. These compounds would no longer be evaluated for bioaccumulation by the DMMP as part of disposal site monitoring. Lead will remain on List 1 due to the lack of paired sediment and tissue data to either support or not support the re-listing of lead, and in consideration of the high tissue concentrations found in Puget Sound. The bioaccumulation trigger (BT) for lead will be re-assessed at a later date. Arsenic will remain on List 1 due to the high tissue concentrations found in Puget Sound and the scientific uncertainty of whether bioaccumulation is driven primarily by water or sediment. The BT for arsenic will be re-assessed at a later date. Selenium, mercury and TBT will remain on the metals BCOC list 1, without modification. Their bioaccumulation triggers will be re-assessed at a later date.
REFERENCES EPA (2000) Bioaccumulation Testing and Interpretation for the Purpose of Sediment Quality Assessment. EPA-823-R-00-001. Feb 2000. http://www.epa.gov/waterscience/cs/biotesting/bioaccum.pdf Hoffman E. 1998. Technical Support Document for Revision of the Dredged Material Management Program Bioaccumulative Chemicals of Concern List. http://www.nws.usace.army.mil/PublicMenu/documents/DMMO/BCOC_TS.98.pdf Malek J; Gries T. 1998. Revision of Guidelines for Bioaccumulative Chemicals of Concern. DMMP Issue Paper, 1998. http://www.nws.usace.army.mil/PublicMenu/documents/DMMO/accum_98.pdf Meador JP; Ernest DW; Kagley A. 2004 . Bioaccumulation of Arsenic in Marine Fish and Invertebrates from Alaska and California. Archives of Environmental Contamination and Toxicology. 47(2):223-33. Michelson M; Shaw TC; Stirling S. 1996. Testing, Reporting, and Evaluation of Tributyltin data in PSDDA and SMS Programs. PSSDA issue paper and SMS Technical Information Memorandum(10/1996). http://www.nws.usace.army.mil/publicmenu/DOCUMENTS/dmmo/tbt_96.pdf USACE, EPA, Ecology, WDNR, ODEQ, IDEQ, NMFS, USFWS. 2009. Draft Sediment Evaluation Framework. https://www.nwp.usace.army.mil/pm/e/rset/sef/2009_SEF-DraftFinal.pdf Waring J; Maher W. 2005. Arsenic bioaccumulation and Species in Marine Polychaeta. Applied Organometallic Chemistry. 19:917-929.

Erratum Final: 09/10/2009
1
DMMP CLARIFICATION PAPER SMS TECHNICAL INFORMATION MEMORANDUM CLARIFICATIONS TO THE DMMP BIOACCUMULATION PROTOCOL Note: This erratum adds additional discussion on Statistics and alpha level, corrects alpha level for test tissue concentration comparison with reference sediment, and extends 45-day exposures to Mercury and Fluoranthene Prepared by David R. Kendall (U.S. Army Corps of Engineers) and Russ McMillan (Department of Ecology) for the DMMP/SMS agencies. INTRODUCTION The Dredged Material Management Program (DMMP) requires bioaccumulation testing when a bioaccumulation chemical trigger level has been exceeded in a project test sediment. Similarly, the Sediment Management Standards (SMS) program may require bioaccumulation testing on a site-specific, “as needed” basis. The current EPA protocol guidance (Lee et.al., 1993; ASTM, 1995) stipulates a test exposure of 28 days, followed by tissue analysis for chemicals of human health and ecological effects concern. The DMMP protocol guidance was previously modified in 1994 (http://www.nws.usace.army.mil/publicmenu/DOCUMENTS/dmmo/acum_94.pdf) and in 1996 (http://www.nws.usace.army.mil/publicmenu/DOCUMENTS/dmmo/acum_96.pdf) to ensure compliance with the National EPA/Corps guidance (EPA/COE, 1991; EPA/Corps, 1994) and to further refine the DMMP bioaccumulation guidance on species selection, sediment volume collection and testing requirements (Battelle, 1992). The DMMP program is now working on revising the guidelines for bioaccumulative-chemicals-of-concern (BCOC) and the framework for accomplishing this work was presented at the 1998 SMARM (http://www.nws.usace.army.mil/publicmenu/DOCUMENTS/dmmo/BCOC_IP.98.htm; http://www.nws.usace.army.mil/publicmenu/DOCUMENTS/dmmo/BCOC_TS.981.pdf). In September 1999, the DMMP convened a bioaccumulation workgroup to begin the process of addressing bioaccumation guideline revision issues (e.g., revising BCOC list, PCB congener and TBT analysis, target tissue level (TTL)/bioaccumulation trigger (BT) development). PROBLEM IDENTIFICATION The purpose of this clarification paper is to document interim changes made by the DMMP to the bioaccumulation protocol. These changes are recommended for interim implementation in the DMMP and SMS programs pending review and final recommendations to be made by the bioaccumulation workgroup. Exposure duration. The DMMP and SMS are concerned that the 28 day bioaccumulation test exposures may not be sufficient to achieve a tissue concentration at or near equilibrium (steady-state) with the water/sediment exposure environment for some important bioaccumulative chemicals of concern (e.g., mercury, fluoranthene, PCBs, tributyltin, DDT, etc.). Over the past three years, the DMMP have extended the

Erratum Final: 09/10/2009
2
exposure period from 28 to 45 days to provide a better approximation of steady-state tissue concentrations for dredging projects conducting bioaccumulation testing. Due to the increased exposure time, it is necessary to supplement the nutritional needs of the test organisms as well as maintain exposure concentrations in the test chambers. This is accomplished by once weekly additions of 175-mL of test sediment to each of the 10- gallon aquaria test chambers. Assessing health of test animals. In order to assess the general health and well being of the test organisms during the exposure period, the current protocol requires monitoring survival, moisture, and lipid content in the test organisms. In a recent dredging project, an additional metric, net change in body weight (growth) during the exposure period (e.g., wet-weight biomass), was assessed. The rationale for measuring tissue weight changes in test animals during a bioaccumulation test was: 1) to confirm that the test animals are in good health and capable of accumulating biologically available chemicals; 2) to develop an effects endpoint to pair with the tissue chemistry for use in risk-assessment (consistent with U.S. EPA’s emphasis on tissue-residue effects); and 3) to establish a more sensitive effects endpoint (relative to survival) to determine the acceptability of test results. Wet-weight biomass data were used along with percent moisture and percent lipids in a preponderance-of-evidence approach to evaluate animal health at the end of the test in conjunction with the observed tissue accumulations of chemicals-of-concern. Statistics and alpha level. The DMMP agencies compare the tissue chemistry data from each dredged material management unit (DMMU) to both tissue data from reference- sediment exposure and chemical-specific interpretation guidelines (i.e. Target Tissue Levels - TTLs). A one-tailed t-test is used for comparison to reference, while a one-tailed one-sample t-test is used for comparison to TTLs. In the past, the DMMP has used an alpha level of 0.05 for all statistical comparisons.
1. For comparisons to reference data, the null hypothesis (Ho) is defined as the test tissue concentration being less than or equal to the reference tissue concentration. The alpha level (the probability of making a Type I error) is defined as the probability of rejecting the null hypothesis when, in fact, the test tissue concentration really is less than or equal to the reference tissue concentration. However, results of recent DMMP bioaccumulation testing have shown relatively high within-sample replicate variability for some contaminants (e.g., PCB, TBT). Use of a 0.05 alpha level with these samples resulted in a marked reduction in the power to discriminate between contaminant tissue concentrations in reference and test sediment exposures. When a 0.1 alpha level was used (allowing for a higher probability of making a Type 1 error) the power of the test to discriminate between reference and test tissue concentrations was increased. Given the definition of Ho used for comparison to reference data, increasing the allowable alpha level to 0.1 results in an increase in the environmental protectiveness of the comparison between test tissues and reference tissues. In other words, improving the power to discriminate between test and reference results in a higher likelihood

Erratum Final: 09/10/2009
3
of making a Type I error (concluding that contaminant concentrations in test tissue are higher than reference when they really aren’t).
2. For comparisons to interpretation guidelines (e.g. TTLs), Ho is defined as the test
tissue concentration being greater than or equal to the TTL. Thus, the Type I error is the probability of rejecting Ho (i.e. concluding that the test tissue concentration is statistically below the TTL), when in fact it really is greater than or equal to the reference concentration. For this type of comparison, the DMMP agencies are maintaining use of the lower 0.05 alpha level as appropriately conservative to minimize the likelihood that dredged material disposed at the sites could result in bioaccumulation exceeding TTLs.
3. Use an alpha level of 0.1 when making statistical comparisons between chemical
concentrations in test and reference tissue to reflect higher within sample variability, and to increase the power of the test to discriminate between reference and test tissue concentrations. Comparisons between test tissue and interpretive guidelines should continue to use an alpha level of 0.05.
PROPOSED CLARIFICATION The DMMP and SMS programs propose to make the following changes to the existing bioaccumulation protocol on an interim basis. These changes will remain in effect until the bioaccumulation workgroup formally reviews the technical/regulatory protocol guidance and makes recommendations to the DMMP and SMS for potential future protocol/regulatory changes.
1. Use a 45-day exposure time when conducting bioaccumulation testing for specific chemicals of concern for bioaccumulation (PCBs, TBT, DDT, Hg, Fluoranthene) to ensure steady-state chemical concentrations in the tissues of the test species (Macoma nasuta and Nephtys caecoides). Increasing the exposure to 45 days will require once weekly supplemental additions of 175-mL of test or control/reference sediment to each replicate10-gallon aquaria/test chamber.
2. Wet-weight biomass (of a subset of 10 individual organisms/replicate) should be
measured at the beginning and end of the bioaccumulation exposure period for test, control and reference samples. This estimate of net individual growth during the exposure period, will be used as an additional metric to evaluate the health of the test animals, and to build a database that supports establishing an effects-based target-tissue level (TTL).
3. Use an alpha level of 0.1 when making statistical comparisons between chemical
concentrations in test and reference tissue to reflect higher within sample variability, and to increase the power of the test to discriminate between
reference and test tissue concentrations. Comparisons between test tissue and interpretive guidelines should continue to use an alpha level of 0.05.

Erratum Final: 09/10/2009
5
REFERENCES ASTM 1995. Designation: E-1688-95. Standard guide for determination of bioaccumulation of sediment associated contaminants by benthic invertebrates. 1995 Annual Book of ASTM Standards. Vol 11.05. Biological Effects and Environmental Fate: Biotechnology; Pesticides. Battelle, 1992. Ecological evaluation of proposed discharge of dredged material from Oakland Harbor into ocean waters (Phase III A of -42 foot Project). Volume 1: Analyses and Discussion. Prepared by J.A. Ward; J.Q. Word; M.R. Pinza; H.L. Mayhew; E.S. Barrows; and L.F. Lefkovitz, Pacific Northwest Laboratory for U.S. Army Corps of Engineers under Contract DE-AC06-76RL) 1830. EPA/COE. 1991. Evaluation of dredged material proposed for ocean disposal - Testing Manual ("Green Book"). Prepared by the United States Environmental Protection Agency, and the Department of the Army, U.S. Army Corps of Engineers. EPA/COE. 1994. Evaluation of dredged material proposed for discharge in Inland and Near Coastal Waters - Inland Testing Manual (Draft). Prepared by the United States Environmental Protection Agency, and the Department of the Army, U.S. Army Corps of Engineers. Lee, R, B.L. Boese, J. Pelletier, M Winsor, D.T. Specht, and R.C. Randall. 1993. Guidance Manual: Bedded Sediment Bioaccumulation Tests. U.S. Environmental Protection Agency, Pacific Ecosystems Branch, Bioaccumulation Team, Newport, OR. EPA-600/R-93-193.

The Technical Basis for Revisions to the Dredged Material Management Program’s Bioaccumulative
Contaminants of Concern List
Final January 5, 2007
Prepared for the Agencies of the Dredged Material Management Program By: Erika Hoffman US EPA Region 10

2
LIST OF ACRONYMS BAF – Bioaccumulation Factor BCOC - bioaccumulative contaminant of concern BT - bioaccumulation trigger levels BCF - bioconcentration factor BWG – Bioaccumulation Work Group CSF – Cancer Slope Factor DMMP - Dredged Material Management Program EC-50 – Effective concentration (50% effect) EPA - Environmental Protection Agency ERED – Environmental Residue Effects Database FCV – Final Chronic Value HSDB – Hazardous Substances Data Bank IRIS – Integrated Risk Information System LC-50 – Lethal Concentration (50% mortality) LOEC - Lowest observed effects concentration LOED – Lowest observed effects dose Log Kow – log of the octanol/water partitioning coefficient MDL – Method detection limit ML – Maximum level MRL – Minimum Risk Levels PAH - polycyclic aromatic hydrocarbon PCB - polychlorinated biphenyl PRTV- EPA Provisional Peer Reviewed Toxicity Values PSDDA - Puget Sound Dredged Disposal Analysis PSAMP- Puget Sound Ambient Monitoring Program PSEP – Puget Sound Estuary Program RCRA – Resource Conservation Recovery Act RfD – Reference dose RSET – Regional Sediment Evaluation Team SMARM – Sediment Management Annual Review Meeting SEF – Sediment Evaluation Framework SL – screening level TEQ – Toxic Equivalency Quotient TSD – Technical Support Document TTL – Target Tissue Level WDOE - Washington State Department of Ecology WMPT – Waste Management Prioritization Tool WOE – Weight of Evidence

3
1. PURPOSE The purpose of this technical appendix is to provide a detailed explanation of how the Dredged Material Management Program (DMMP) revised its Bioaccumulative Contaminants of Concern (BCOC) list. Specifically, this document describes, in detail, the information and approach used to revise the lists. The following key components of this process are presented: • Developing a list of potential chemicals of concern for bioaccumulation • Identification of regional monitoring data to characterize the occurrence of potential
BCOCs • Identification of data from the literature to characterize the bioaccumulative potential
and toxicity of each potential BCOC • Developing conceptual criteria defining four different BCOC lists • Developing a process for placing chemicals on any particular list Information on the rationale for revising the lists and the programmatic changes in dredged material testing that will occur as a result of the implementation of these lists has already been presented (DMMP 1998 and DMMP, 2003) and is not discussed here.
2. BACKGROUND In 1988, the Puget Sound Dredged Disposal Analysis (PSDDA) program’s Evaluation Technical Procedures Appendix established a list of bioaccumulative contaminants of concern (BCOCs) that was a subset of chemicals from the DMMP’s contaminant of concern (COC) list. If the sediment concentration of any BCOC exceeded a predetermined bioaccumulation trigger (BT) level established by PSDDA, then there was a "reason to believe" that there could be risk to human and/or ecosystem health due to the accumulation of contaminants in aquatic organisms. When one or more sediment contaminants exceeded BTs, the DMMP agencies required bioaccumulation testing (in addition to toxicity tests) to determine suitability of that sediment for unconfined, open-water disposal. Up until 2003, the PSDDA (now the DMMP) had a single list of 29 BCOCs (Table 1). The original list of 28 chemicals was developed eighteen years ago based on the best available sediment monitoring and risk assessment information (PSDDA, 1988) and tributyl tin was added to the list in 1989 (PSDDA, 1989). At the 1998 Sediment Management Annual Review Meeting (SMARM), the DMMP presented the rationale and general approach for re-evaluating bioaccumulation testing and interpretation which included revising the list of bioaccumulative contaminants required for analysis (DMMP, 1998 and Hoffman, 1998). The DMMP also convened the Bioaccumulation Work Group (BWG) to participate in the list revision. The BWG was a technical advisory group made up of representatives from regulatory agencies, tribes, research organizations, regulated entities, and environmental consulting firms.
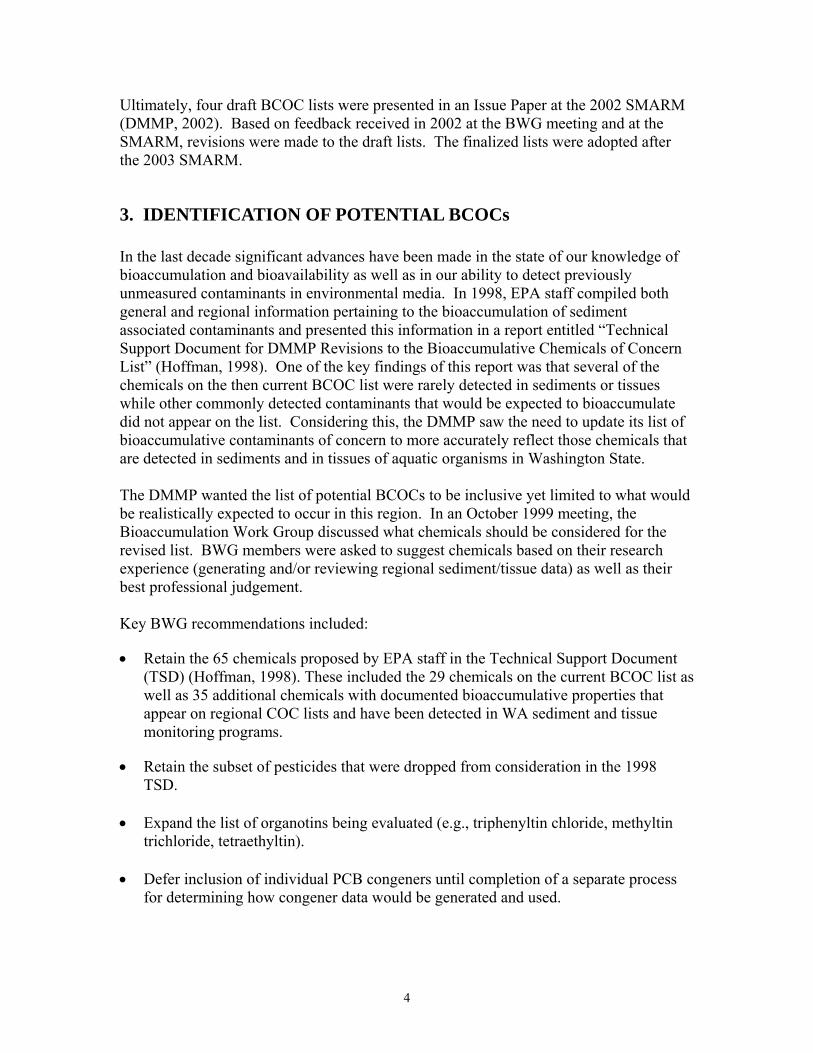
4
Ultimately, four draft BCOC lists were presented in an Issue Paper at the 2002 SMARM (DMMP, 2002). Based on feedback received in 2002 at the BWG meeting and at the SMARM, revisions were made to the draft lists. The finalized lists were adopted after the 2003 SMARM.
3. IDENTIFICATION OF POTENTIAL BCOCs In the last decade significant advances have been made in the state of our knowledge of bioaccumulation and bioavailability as well as in our ability to detect previously unmeasured contaminants in environmental media. In 1998, EPA staff compiled both general and regional information pertaining to the bioaccumulation of sediment associated contaminants and presented this information in a report entitled “Technical Support Document for DMMP Revisions to the Bioaccumulative Chemicals of Concern List” (Hoffman, 1998). One of the key findings of this report was that several of the chemicals on the then current BCOC list were rarely detected in sediments or tissues while other commonly detected contaminants that would be expected to bioaccumulate did not appear on the list. Considering this, the DMMP saw the need to update its list of bioaccumulative contaminants of concern to more accurately reflect those chemicals that are detected in sediments and in tissues of aquatic organisms in Washington State. The DMMP wanted the list of potential BCOCs to be inclusive yet limited to what would be realistically expected to occur in this region. In an October 1999 meeting, the Bioaccumulation Work Group discussed what chemicals should be considered for the revised list. BWG members were asked to suggest chemicals based on their research experience (generating and/or reviewing regional sediment/tissue data) as well as their best professional judgement. Key BWG recommendations included: • Retain the 65 chemicals proposed by EPA staff in the Technical Support Document
(TSD) (Hoffman, 1998). These included the 29 chemicals on the current BCOC list as well as 35 additional chemicals with documented bioaccumulative properties that appear on regional COC lists and have been detected in WA sediment and tissue monitoring programs.
• Retain the subset of pesticides that were dropped from consideration in the 1998
TSD. • Expand the list of organotins being evaluated (e.g., triphenyltin chloride, methyltin
trichloride, tetraethyltin). • Defer inclusion of individual PCB congeners until completion of a separate process
for determining how congener data would be generated and used.

5
• Include the following compounds that were not discussed in the 1998 TSD: Alkylated homologues of PAHs Polychlorinated naphthalenes Polybrominated terphenyls Polybrominated diphenyl ethers (PBDEs)
The final list included the 65 chemicals in the 1998 TSD as well as 75 additional chemicals recommended by the BWG members for a total of 142 chemicals (Table 2). Note that with a few exceptions1 all of the chemicals identified as “Important Bioaccumulative Compounds” in EPA’s Status and Needs report for Bioaccumulation (EPA, 2000a) are found in the DMMP’s list of prospective BCOCs.
4. APPROACH FOR RANKING BCOCs 4.1 Approaches Evaluated In 1998, the DMMP had already determined that the process for revising the BCOC list would have to consider regional data as well as a chemical’s inherent potential to persist and/or biomagnify in aquatic ecosystems. It was expected that there would be a preponderance of evidence to justify both the removal of several volatile contaminants that were on the current BCOC list as well as the addition of other contaminants (e.g., PAHs and divalent metals) that were commonly considered to be bioaccumulative. It was not clear, however, how to address the numerous chemicals about which concern is high but for which regional monitoring data is sparse to nonexistent. The DMMP recognized that it would have to develop a systematic approach to ranking the prospective BCOCs that would consider multiple lines of evidence for determining the bioaccumulative risk posed by a particular contaminant. Two general approaches that have been used by others to prioritize chemicals relative to bioaccumulation were considered by the DMMP. The first approach, “Scoring”, has been used by the EPA’s RCRA program in their Waste Management Prioritization Tool (WMPT) (USEPA, 1998). Scoring involves assigning numeric values to criteria associated with various categories of data characterizing bioaccumulative compounds. An example of a category would be “propensity to bioaccumulate”, and three associated criteria might be having a bioaccumulation factor (BAF) less than 250, 250 – 1000, and greater than 1000. A chemical with a BAF = 1200 would be considered highly bioaccumulative and would be assigned a value of 3 (on a scale of 1 to 3). In order to derive a ranking for a particular chemical, all the numerical values for different criteria are summed across different categories. The second approach, known as “Weight of Evidence” (WOE) is similar to Scoring in that it involves grouping information into different categories (e.g., persistence,
1 Several pesticides included in the EPA (2000) list were not considered because of a lack of documented use in WA State (e.g., dicofol and disulfoton, Beta-BHC, Delta-BHC, nitrofen, oxyfluorfen, and terbufos). Additionally, PCB congeners and carcinogenic PAHs (as a class of compounds) were not considered.

6
bioaccumulation potential, frequency of detection) each with its own criteria that are indicative of a chemical being of concern for bioaccumulation (e.g., log Kow > 3.5; BAF > 500; detection frequency >50%). The WOE approach differs from Scoring in that no numerical value is assigned to chemicals that meet or don’t meet a given criterion. Instead, a chemical is evaluated qualitatively by looking at the number and type of criteria that are met in the different categories. Use of the term “Weight of Evidence” to describe this process is simply meant to convey the fact that multiple lines of evidence are used to determine a chemical’s assignment to a list. Various types of information relevant to prioritizing/ranking a chemical as to the risk posed by its bioaccumulation were considered for use in generating the revised BCOC list. For example, the 1998 TSD summarized the following information (where available) for each of the 65 chemicals examined as prospective BCOCs:
• Actual or potential source loading (from state inventories) • Appearance on BCOC lists from other programs/regions • Data from WA State tissue monitoring programs • Data from WA State sediment monitoring programs • Information from the scientific literature on the partitioning (log Kow),
persistence (sediment half-life) and bioaccumulation potential (BCF and BAF) of chemicals and their degradation products
• Ecological effects associated with bioaccumulated chemicals (residue-effects concentrations from the ERED database)
EPA’s WMPT (1998) includes a comprehensive compilation of background information on bioaccumulative chemicals, including data on persistence, bioaccumulative potential, and toxicity. The WMPT database proved an invaluable source of information for the BCOC revision effort. 4.2 BWG Recommendations • A majority of the group recommended using the WOE approach for revising the
BCOC list, citing its transparency, simplicity, and similarity of the category/criteria development to the Scoring approach.
• Recommended categories of information to be used in the WOE approach were:
1. Bioaccumulation potential and persistence (e.g., log Kow) 2. Occurrence in sediments (e.g., detection frequency) 3. Occurrence in tissues (e.g., detection frequency) 4. Toxicity to humans (e.g., cancer slope factor and reference dose) 5. Ecological toxicity (e.g., residue-effect concentrations and chronic toxicity)
• The BWG acknowledged that quantification of PCBs based on congener analysis was the likely direction that the DMMP program would be taking. However, given the numerous issues that need resolution prior to transitioning from an Aroclor- to a congener-based approach (e.g., tiered analysis, methods, standards, interpretation), the group decided to defer decisions regarding PCB congeners to a separate process.

7
For the purposes of list revision, PCBs are retained as a priority BCOC analyzed and quantified as total Aroclors. 2
• The WOE approach should explicitly recognize the difference between having
negative information about the bioaccumulative nature of a chemical and the absence of information.
• Source and loading information was considered but not included in the BWG’s
recommended categories. For the 1998 TSD, EPA staff investigated a few regional data bases (EPA’s Toxic Release Inventory and Washington’s Agricultural Use Reporting) but found that the data were limited to specific regulated-use categories and not reflective of quantities that were actually used in this region. Subsequent investigation in 2000-2003 did not reveal any additional queriable data base. The BWG recommended that future efforts to update the BCOC lists include (when possible) a parameter that quantifies a chemical’s documented use and/or loading in the region.
• The BWG recommended that a separate investigation be conducted to ensure that
standard methods are available and in use by regional labs for all chemicals identified on List 1 (particularly those new to the DMMP program). Methods information and laboratory survey results were collected by D.M.D. Inc in 2001 and are presented in Table 3.
The following sections describe the sources and process by which data were collected for each category.
5. BIOACCUMULATION POTENTIAL AND PERSISTENCE 5.1 Overview of Available Information There are many characteristics of nonionic organic chemicals that have been cited as determinants of their potential to persist and bioaccumulate. Among the most commonly cited are susceptibility to degradation or transformation (sediment half-life), octanol-water partitioning coefficient (Kow), bioaccumulation factors (BAFs), and bioconcentration factors (BCFs). Characterization of the potential for a chemical to degrade or transform is highly dependant on the environment in which it is found. It depends not only on the intrinsic properties of a chemical but also on the nature of the surrounding environment (e.g.,
2 There are major drawbacks to the quantification of PCBs using an Aroclor approach. For one, EPA PCB Aroclor Methods 8081/8082 may underestimate the total concentration of PCBs. When a non-Aroclor manufacturing process (such as the chlor-alkali process) is used; the biphenyl mixtures that result do not conform well to industrial Aroclor patterns. Furthermore, characterization of regional background is compromised since Aroclor detection limits in sediment are often greater than background PCB concentrations. More sensitive congener-based analysis would allow accurate characterization of total PCBs in background sediment samples as well as facilitating more accurate estimates of the risk associated with exposure to low-level PCBs in sediments.
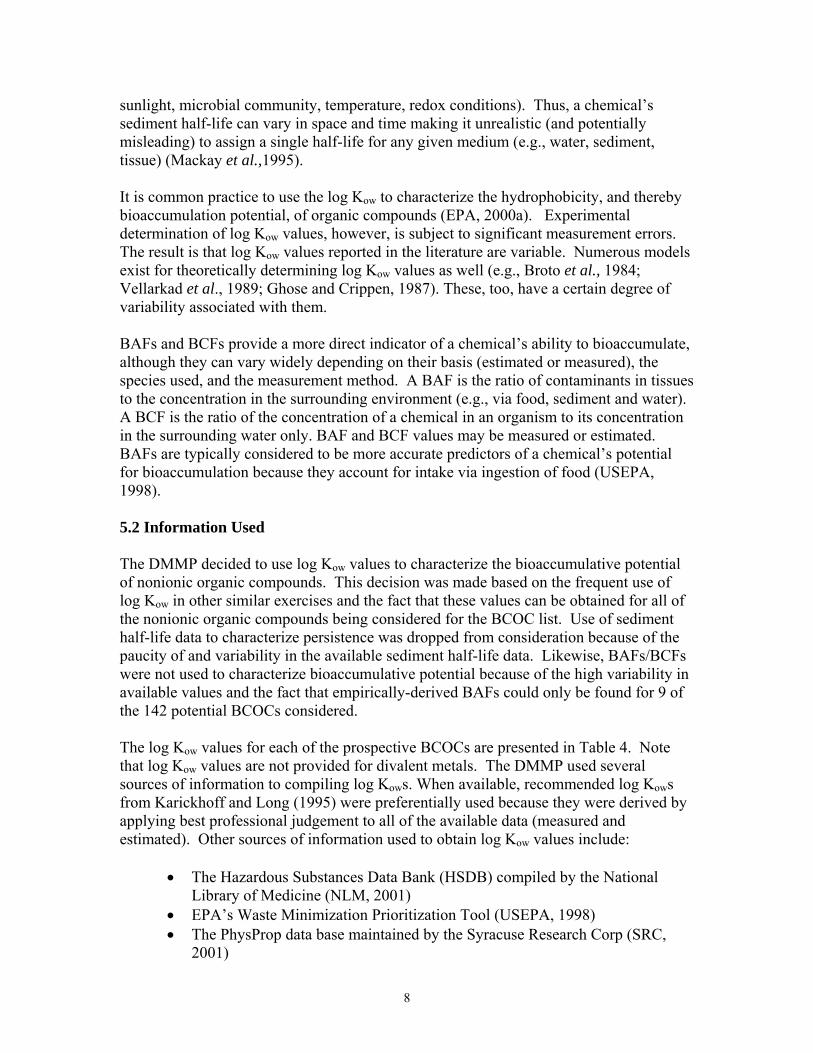
8
sunlight, microbial community, temperature, redox conditions). Thus, a chemical’s sediment half-life can vary in space and time making it unrealistic (and potentially misleading) to assign a single half-life for any given medium (e.g., water, sediment, tissue) (Mackay et al.,1995). It is common practice to use the log Kow to characterize the hydrophobicity, and thereby bioaccumulation potential, of organic compounds (EPA, 2000a). Experimental determination of log Kow values, however, is subject to significant measurement errors. The result is that log Kow values reported in the literature are variable. Numerous models exist for theoretically determining log Kow values as well (e.g., Broto et al., 1984; Vellarkad et al., 1989; Ghose and Crippen, 1987). These, too, have a certain degree of variability associated with them. BAFs and BCFs provide a more direct indicator of a chemical’s ability to bioaccumulate, although they can vary widely depending on their basis (estimated or measured), the species used, and the measurement method. A BAF is the ratio of contaminants in tissues to the concentration in the surrounding environment (e.g., via food, sediment and water). A BCF is the ratio of the concentration of a chemical in an organism to its concentration in the surrounding water only. BAF and BCF values may be measured or estimated. BAFs are typically considered to be more accurate predictors of a chemical’s potential for bioaccumulation because they account for intake via ingestion of food (USEPA, 1998). 5.2 Information Used The DMMP decided to use log Kow values to characterize the bioaccumulative potential of nonionic organic compounds. This decision was made based on the frequent use of log Kow in other similar exercises and the fact that these values can be obtained for all of the nonionic organic compounds being considered for the BCOC list. Use of sediment half-life data to characterize persistence was dropped from consideration because of the paucity of and variability in the available sediment half-life data. Likewise, BAFs/BCFs were not used to characterize bioaccumulative potential because of the high variability in available values and the fact that empirically-derived BAFs could only be found for 9 of the 142 potential BCOCs considered. The log Kow values for each of the prospective BCOCs are presented in Table 4. Note that log Kow values are not provided for divalent metals. The DMMP used several sources of information to compiling log Kows. When available, recommended log Kows from Karickhoff and Long (1995) were preferentially used because they were derived by applying best professional judgement to all of the available data (measured and estimated). Other sources of information used to obtain log Kow values include:
• The Hazardous Substances Data Bank (HSDB) compiled by the National Library of Medicine (NLM, 2001)
• EPA’s Waste Minimization Prioritization Tool (USEPA, 1998) • The PhysProp data base maintained by the Syracuse Research Corp (SRC,
2001)
9
• Canadian Environmental Quality Guidelines for Nonylphenol and its Ethoxylates (Environment Canada, 2000).
• A summary of experimentally derived log Kows for tributyltin in seawater from Meador (2000)
• Handbook of Physical-Chemical Properties and Environmental Fate for Organic Chemicals (Mackay et al., 1993)
• Broto’s fragmentation method (Broto et al., 1984) • Viswanadhan's fragmentation method (Vellarkad et al., 1989) • Crippen's fragmentation method (Ghose and Crippen, 1987).
Where a range of values is presented, this represents variability in measurements by a variety of methods and/or the fact that some BCOCs represent a mixture of chemicals and not pure materials.
6. OCCURRENCE IN SEDIMENTS 6.1 Overview of Available Information An important indication of the potential bioavailability of a contaminant in the aquatic environment is its presence in sediments. Indeed, one motivation behind revising the BCOC list was the desire to include data on the occurrence of prospective BCOCs from SEDQUAL, an extensive regional sediment database maintained by Washington’s Department of Ecology (WDOE). Data contained in SEDQUAL represent marine, estuarine, and freshwater environments and locations ranging from small streams/sloughs to harbors, marinas and navigational channels (WDOE, 2002). A large fraction of the sediment data within SEDQUAL is derived from remediation and navigation dredging programs and therefore provides good representation of the more urbanized areas within Puget Sound. Another advantage to working with a database like SEDQUAL was having the ability to perform customized queries on subsets of data. 6.2 Information Used SEDQUAL was queried in February/March 2002 to extract all freshwater and estuarine/marine sediment chemistry data from Washington State and the Columbia River. These data sets were imported into a MS Access file where they were filtered for the prospective BCOCs, converted to the same units (ppb), and filtered for a consistent measurement basis (dry weight). The detection frequency for each chemical in each data set was determined by dividing the number of samples with detections by the total number of samples that were analyzed for a particular chemical. Additionally, the median sediment concentration was calculated from all samples with detected values for a particular analyte. This sediment occurrence information is presented in Table 5. The results of the query of freshwater data are based on data from a total of 1,355 samples, while the results of the marine/estuarine query are based on data from 25,544 sediment samples.
10
6.3 Additional Issues While the frequency of detection analysis using data from SEDQUAL is based on a relatively large number of samples, no evaluation was made of how well these samples represent the range of environments found in Puget Sound. Rather than looking only at detection frequency, there should be some consideration of the spatial coverage represented by the database. One way to approach this would be to grid off WA State sediment areas and look at how frequently grid cells were sampled for particular contaminants. This would identify any “critical” geographic areas where certain data were lacking. Likely critical areas might include major urban areas along Puget Sound (e.g. Everett, Seattle, Tacoma) and some of the freshwater sediments in the vicinity of urban areas (e.g. Spokane, Portland/Vancouver).
7. OCCURRENCE IN TISSUES 7.1 Overview of Available Information A crucial component in characterizing the bioaccumulative risk posed by a BCOC is the frequency and magnitude of its detection in biota, as this provides a direct indication of a chemical’s bioavailability. While the tissue data within SEDQUAL is constrained to marine and estuarine species and are not as extensive as those for sediment, SEDQUAL is nevertheless a significant source of queriable tissue information from this region. The combination of this information with fish tissue data from regional monitoring programs provides enough regional information on occurrence in tissues to aid in prioritizing prospective BCOCs. 7.2 Information Used The SEDQUAL database was queried for all available fish and aquatic invertebrate tissue data in March 2002. All the tissue data in SEDQUAL was from either estuarine or marine environments. In SEDQUAL, a chemical’s detection frequency was determined by dividing the number of samples with detections by the total number of samples that were analyzed for that particular chemical. Additionally, when sufficient data were available, the 95th percentile of the distribution of detected concentrations was calculated for each data set. If sufficient detected data were not available to calculate a 95th percentile concentration, the highest measured tissue concentration was recorded instead. If there were no detected concentrations in the data set for a particular chemical, the 95th percentile of the distribution of non-detected concentrations was calculated. Data from the SEDQUAL queries are presented in Table 6. The only other significant source of regional tissue data (in a queriable format) that was identified was from the Puget Sound Ambient Monitoring Program (PSAMP). The PSAMP database also contains fish tissue data from estuarine and marine environments. The query of PSAMP data was limited to a subset of adult, non-salmonid fish (e.g., bottom fish, rock fish and herring – liver, whole body and/or muscle tissue) caught in
11
locations that have been designated by PSAMP as urban or near-urban. By limiting the PSAMP query to resident adult fish from contaminated areas, the focus was on the “worst case” tissue data in which there is a greater likelihood of observing elevated tissue concentrations of BCOCs. As was done with the SEDQUAL database, a chemical’s detection frequency was determined by dividing the total number of samples with detections by the total number of samples (of all tissue types) that were analyzed for that particular chemical3. Summary statistics (e.g., 90th and 95th percentile concentrations) are reported for the tissue type with the highest concentrations and using detected samples only. These queries were run in October 2001. Data from the PSAMP database queries is also presented in Table 6. 7.3 Additional Issues At the time this information was being collected, there were no large and readily/easily queriable sources of freshwater tissue data. This represents a significant data gap and raises the question as to how applicable these lists are to freshwater environments (see Section 12 - Conclusions and Next Steps - for further discussion of this issue). The marine/estuarine tissue data available for the prospective BCOCs were often limited in terms of its species and spatial coverage. For the purposes of these list revisions, the DMMP developed minimum requirements for determining that sufficient tissue data was available (see Section 10.4). It would, however, be prudent to revisit these requirements to determine whether the existing data provides an adequate basis for including/excluding BCOCs from a given list. The detection frequencies and 95th percentile concentrations presented in Table 6 were calculated by combining all the tissue data available without making distinctions between different species of aquatic organisms. However, certain classes of compounds (such as carcinogenic PAHs) are metabolized by some receptors (e.g., fish and most crustaceans) but not by others (invertebrates lacking a mixed function oxidase system). Lumping tissue data from both types of receptors together is likely to depress both detection frequencies and percentile concentrations (particularly in a database dominated by fish tissue) resulting in the deprioritization of such compounds. Future updates of these lists should explore the possibility of calculating separate detection frequencies and 95th percentile concentrations for organisms lacking the ability to biotransform prospective BCOCs. Such calculations would be greatly facilitated by increasing the amount of invertebrate tissue data contained within SEDQUAL.
8. HUMAN TOXICITY 8.1 Overview of Available Information Sixteen years ago, the DMMP agencies developed a conceptual framework for evaluating bioaccumulation that relied heavily on consideration of potential risks to human health.
3 All non-detect samples with an MDL greater than 50 ppb were excluded from these summaries. Hence, the total number analyzed was computed as if the samples with MDLs greater than 50 ppb did not exist.

12
Likewise, in the context of revising the BCOC list, a contaminant’s propensity to cause adverse effects to human health following chronic exposure is an important consideration in ranking chemicals. Several lines of information are available with which to evaluate a chemical’s potential to cause cancer and non-cancer (e.g., developmental, reproductive) effects to humans. A common measure of a chemical’s carcinogenic risk to humans is the cancer potency value (otherwise known as a cancer slope factor or CSF). The CSFs reported in EPA’s Integrated Risk Information System (IRIS) are the ninety-fifth percentile upper confidence limit of the slope of the dose-response curve extrapolated (typically) from high experimental animal doses to low doses typically experienced by people. CSFs are expressed in units of risk per mg/kg-day exposure. Thus, the higher the CSF, the higher the carcinogenic risk associated with a particular chemical. EPA’s approach to deriving CSFs produces risk estimates that are protective, but not necessarily predictive of cancer incidence associated with a particular chemical (USEPA, 1994). In addition, EPA has assigned weight of evidence cancer classification (WOE) values to many chemicals. This WOE classification provides information on the quality of the data used to determine the carcinogenic risk of a chemical. Generally, most chemicals with CSFs also have a WOE classification, whereas there are chemicals without sufficient information to derive CSFs but for which a WOE classification exists. There are five WOE classifications within IRIS including: Group A (known human carcinogen); Group B (includes subclassifications B1 and B2, probable human carcinogen and probable human carcinogen - evidence in humans is limited or inadequate but animal evidence is sufficient); Group C (possible human carcinogen – inadequate or no evidence in humans and animal evidence is limited); Group D (unclassifiable due to no human data and ambiguous dose-response trends in animal testing); Group E (evidence of non-carcinogenicity for humans). Non-cancer effects on humans are typically estimated using a Reference Dose (RfD). The RfD is defined by EPA as “an estimate (with uncertainty perhaps spanning an order of magnitude) of a daily exposure to the human population (including sensitive subgroups) that is likely to be without an appreciable risk of deleterious effects during a lifetime” (USEPA, 1994). RfDs are expressed as milligrams of contaminant per kg consumer body weight per day (mg/kg/day). Thus, the lower a chemical’s RfD, the higher its expected non-cancer toxicity. Reference doses are calculated by dividing the dose concentration associated with some toxic effect by an uncertainty factor(s). The more uncertain one is of how well the toxicity data apply to humans, the greater the value of the uncertainty factor(s) used and consequently the lower the reference dose. 8.2 Information Used The DMMP decided to use CSF and WOE classification values to characterize the cancer risk to humans. RfDs were used as a measure of non-cancer risk. The values compiled for the prospective BCOCs are presented in Table 7. Of the potential BCOCs, 28 had CSFs and 54 had RfDs available. Fifty-three chemicals had WOE classifications, of which 24 were classified as A or B.

13
IRIS is the EPA’s official repository of consensus information on chronic human health risk and is a widely-accepted data source due to the extensive review conducted on the risk values contained in the data base (USEPA, 2001a). IRIS was the primary source for most of the CSF, WOE classification and RfD information presented in Table 7. A secondary source of information used was information presented in the WMPT (USEPA, 1998) which includes RfDs and CSFs from the Health Effects Assessment Summary Tables (HEAST) (USEPA, 2004), and various EPA cancer data documents. 4
9. ECOLOGICAL TOXICITY 9.1 Overview of Available Information Because relatively little was known about tissue residues and associated ecological effects associated with sediment contaminants in 1988, the guidelines the agencies developed for triggering and interpreting bioaccumulation tests relied heavily on human health considerations. To ensure ecological health was addressed, the agencies established safety factors in the form of other guidelines for management of open-water disposal sites. The agencies recognized that the bioaccumulation guidance would need to be revisited as more residue-effects data and other indices of ecological risk became available. The availability of residue-effects databases has grown substantially since the implementation of PSDDA, allowing the ecological effects of bioaccumulation to be considered in revisions to the BCOC list. Several comprehensive databases exist that summarize the results of laboratory studies of the tissue residues associated with adverse effects in aquatic organisms. One such database that is publicly available is the Environmental Residue-Effects Database (ERED) developed by the Army Corps of Engineers and US EPA (USACE, 2001). Another indicator of the aquatic toxicity associated with chronic exposures to a chemical is EPA’s Final Chronic Value (FCV). A FCV is generally intended to represent the highest concentration of a chemical in water that should not cause unacceptable toxicity to aquatic organisms during a long-term exposure. FCVs have been developed by EPA to derive chronic ambient water quality criteria and, more recently, sediment quality criteria. EPA’s methodology for developing FCVs specifies minimum data requirements for measured toxicity data and acute-chronic ratios. A FCV is generally the 5th percentile LC- or EC-50 value from a data set involving water-only, long-term exposure to three or more taxa. Alternatively, if these data are not available, a FCV can be estimated by applying an acute-chronic ratio (based on data from at least three different families of fish and invertebrates) to the 5th percentile LC/EC50 from the acute exposure data set for a particular chemical. FCV data are the highest preference values according to the prioritization process outlined in the WMPT (USEPA, 1998).
4 Note: There has been a change in the toxicity value hierarchy from EPA. The new order is: Tier 1 (IRIS), Tier 2 (PRTV), and Tier 3 (HEAST, draft IRIS assessments, ATSDR’s MRLs, and Cal EPA values.

14
9.2 Information Used Residue-effects data for the prospective BCOCs were compiled from ERED as well as from a URS-Greiner internal database (Shephard, pers. comm.) in February/March 2001. Information compiled from both data bases was limited to data generated for freshwater and marine fish and aquatic invertebrates and published prior to 1997 for the ERED data base and 2001 for the URS data base. The types of adverse effects used in this compilation included effects that are likely have ramifications for a population, including mortality, reduced growth, reproductive effects, abnormal development, and narcosis. Effects classified as biochemical or cellular were excluded from the compilation. For example, biomarkers such as enzymatic effects or markers of exposure such as biliary FACs for which the ecological significance is unknown were not included. The measurement endpoints that were included in the compilation included all those that represent a lowest observed effect concentration or dose (LOEC or LOED). Certain LC- or EC- values were retained as LOED equivalents if they were the lowest of a reported series of LC/EC values and were below 40% effects. This compilation process resulted in approximately 1140 usable data points for 64 of the prospective BCOCs. These data were sorted by chemical and in order of increasing residue concentration. For each chemical, an actual value from the data set was selected as the LOED screening value. For chemicals with 20 or more data points, the LOED screening value was chosen to be the measured data point that was closest to the 5th percentile of the distribution of LOED data for that chemical. The approximate 5th percentile value was used so that low concentration outliers would not unduly influence the derivation of the screening value. For chemicals with fewer than 20 data points, the lowest LOED value was used as the screening value. The LOED screening values (in wet weight units), range of data values, and the number of data points for each chemical are shown in Table 8. Supporting documentation with references and data used for the derivation of each LOED screening value can be provided upon request. FCVs were available for 94 of the 140 potential BCOC chemicals evaluated. Of the 46 remaining chemicals for which no FCVs were available, eight chemicals did have a lowest measured acute toxicity endpoint (LC50 or EC50) available from EPA’s AQUIRE database (USEPA, 2001b). These acute toxicity data are presented in Table 8 along with the FCVs. 9.3 Additional Issues It should be noted that a lack of toxicity and/or residue-effects data for a given contaminant is not necessarily an indication that there is no or low bioaccumulative risk associated with it. There are bioaccumulative contaminants of emerging concern for which the toxicity literature is incomplete. Furthermore, parent compounds that are themselves non-toxic can be transformed (biotically and abiotically) into more toxic breakdown products (e.g., debromination of deca-BDE to the more toxic octa- and penta-BDE). Nevertheless, the DMMP decided to use toxicity as a screening component in the list definition process because this information (particularly residue-effects data) is critical for the development and revision of numeric guidelines (e.g., target tissue levels for interpreting bioaccumulation test data) for the List 1 and List 2 BCOCs. In future

15
updates to these lists, the DMMP and BWG should consider revising the definitions for List 1 and List 2 chemicals such that chemicals lacking human -or eco-toxicity data are not automatically screened out.
10. CRITERIA FOR IDENTIFYING BCOCS 10.1 Overview of BCOC Criteria Once information on each chemical had been gathered, the next step was to develop numeric criteria for the potential to bioaccumulate using the five categories of data recommended by the BWG. The following eleven criteria were decided upon using best professional judgement and are conservative thresholds that, taken together, describe a chemical’s propensity to bioaccumulate and the potential risks associated with its presence in biological tissues:
• Bioaccumulation Potential 1. Log Kow equal to or greater than 3.5 (for nonionic organic compounds
only)
• Regional Occurrence in Sediments 2. Marine/freshwater sediment detection frequency exceeds 10% 3. Marine/freshwater sediment detection frequency exceeds 50% 4. Median marine/freshwater concentration exceeds 10x MDL 5. Median marine/freshwater concentration exceeds 50x MDL
• Regional Occurrence in Tissues 6. Tissue detection frequency exceeds 10%
• Toxicity to Humans 7. Has a cancer slope factor, or IRIS WOE score A or B 8. Reference dose less than 0.06 mg/kg/day
• Ecological Toxicity 9. Has residue-effect data available in ERED/URS database 10. 95th percentile detected concentration in tissues exceeds the LOED
screening value (or 95th percentile non-detect concentration exceeds screening value)
11. Has EPA Final Chronic Value less than 100 ug/L In the following sections, each of the eleven BCOC criteria and the rationale for their numerical thresholds are described in greater detail.
16
10.2 Bioaccumulation Potential
• Log Kow equal to or greater than 3.5 (for nonionic organic compounds only)
The minimum criteria defining bioaccumulation potential for nonionic organic compounds is a log Kow greater than 3.5. The value of 3.5 was used as a minimum threshold based on observed relationships between the Kow of an unmetabolized chemical and its potential for biomagnification. Specifically, uptake efficiency tends to increase with increasing log Kow for values between 3 and 6 (Thomann, 1989). While there are chemicals with log Kow values less than 3.5 that are known to bioaccumulate, these are typically compounds that do not partition according to equilibrium assumptions (such as organo-metals). As such, organo-metals were not screened using log Kow bioaccumulation criteria. Several BWG members suggested that an additional criterion should be added to screen out chemicals with log Kow > 6.5. Such chemicals are highly hydrophobic and are unlikely to be accumulated in significant quantities by aquatic organisms (EPA, 2000a). The DMMP decided, however, not to apply this additional criterion since log Kow of 6.5 as a lower bound is debatable (for example, the log Kow of several isomers of DDT exceed this value) and its application would only affect approximately ten of the prospective BCOC chemicals. In addition, if a chemical is not found in tissues it will be screened out by the criteria for regional occurrence in tissues. 10.3 Regional Occurrence in Sediments The DMMP developed the following criteria to characterize the magnitude and frequency with which prospective BCOCs occur in sediments:
• Marine/freshwater sediment detection frequency exceeds 10% • Marine/freshwater sediment detection frequency exceeds 50% • Median marine/freshwater concentration exceeds 10x MDL (or regional
background for trace metals) • Median marine/freshwater concentration exceeds 50x MDL (or regional
background for trace metals)
Evaluation of detection frequencies relative to 10% and 50% are based on a review of the distribution of detection frequencies from the SEDQUAL queries as well as the best professional judgement of the DMMP agency representatives. These values are intended to bound the following conditions: infrequent detection (e.g., detected in less than 10% of the samples for which it is analyzed), occasional detection (e.g., detected in more than 10% but less than 50% of samples for which it is analyzed), and frequent detection (e.g., detected in greater than 50% of the samples for which it is analyzed). Comparison of median detected sediment concentrations to multipliers of method detection limits (MDL) is intended to characterize the magnitude of occurrence without implying any particular ecological or human health risk associated with a particular concentration. The 10-times and 50-times MDL values were chosen based on best professional judgement of the DMMP agency representatives to aid in prioritization for

17
the purposes of BCOC list revision. Because concentrations of divalent metals can be naturally elevated in this region, it was decided that comparison to regional background concentrations (rather than MDLs) would be more meaningful for trace metals. Reference concentrations for nearly all trace metals reported in Table 5 are based on the upper bound of the concentration range given in PSEP’s Reference Area Performance Standards for Puget Sound (1991). However, reference area data was not available for selenium and antimony whose comparison values are based on MDLs (as indicated in Table 5). A key recommendation by the BWG was that characterization of the magnitude of detected sediment concentrations should not involve comparisons to effects-based sediment guidelines (such as DMMP’s SLs and MLs). Regional sediment guidelines are primarily based on acute bioassay responses and not necessarily associated with bioaccumulation in tissues. In the absence of sediment criteria based on risks associated with bioaccumulation5, comparison of detected concentrations to a multiplier of the MDL values was viewed as a more objective measure for classifying chemicals based on the magnitude of their occurrence. 10.4 Regional Occurrence in Tissues
• Tissue detection frequency exceeds 10% Overall tissue detection frequency was determined by summing the number of detections in both SEQUAL and PSAMP data sets and dividing that sum by the total number of samples analyzed in both data sets. However, for several of the prospective BCOCs, tissue data was available from only the SEDQUAL data set. Unlike the PSAMP testing program which involves fish tissue samples collected over many years, from several species and from many Puget Sound locations, the data in SEDQUAL is from various unconnected studies which may be very localized in scope and limited in sample size. Out of concern that a relatively small data set could have a disproportionate effect on a chemical’s prioritization, the DMMP set a minimum amount of tissue data from SEDQUAL which could be used to evaluate tissue detection frequency. Thus, when the only data available with which to evaluate detection frequency was from SEDQUAL, it would need to be from a minimum of two surveys with data from at least two different taxa and a total number of samples in excess of 30. Prospective BCOC chemicals that did not meet this minimum data requirement would be classified as having “no data available”. 10.5 Toxicity to Humans The DMMP used the following criteria describing cancer and non-cancer effects of BCOCs on humans:
• Cancer slope factor, or IRIS WOE score of A or B
5 A BWG participant has suggested that BSAF-derived risk-based tissue levels such as those proposed in EPA (1997) could be compared to the 10X and 50X MDLs. 10X/50X MDLs that are much greater than the risk based concentrations derived using BSAF approaches might be modified downward.

18
• Reference dose < 0.06 mg/kg/day Instead of setting a minimum value for the CSF, the DMMP decided that simply having a slope factor or IRIS score of A or B (known or probably human carcinogen) was sufficient evidence of carcinogenic potential for the purposes of ranking chemicals for a revised BCOC list. For non-cancer effects, the DMMP decided to use the RfD “medium toxicity” threshold value developed by the WMPT (USEPA, 1998). A reference dose of 0.06 mg/kg/day is the 75th percentile value of the distribution of lowest oral and converted inhalation RfDs for all the chemicals evaluated in the WMPT database. 10.6 Ecological Toxicity The DMMP developed the following criteria describing the potential toxicity of BCOCs to aquatic organisms:
• Residue-effect data available in ERED/URS database • 95th percentile (or maximum) detected concentration in tissues exceeds LOED
screening value OR 95th percentile non-detected concentration in tissues is greater than LOED screening value (for chemicals for which there is only non-detect data)
• FCV < 100 ug/L Only half of the 142 prospective BCOCs have residue-effects data in the most comprehensive national databases (ERED) of this type of information. While important bioaccumulative compounds may be missed by screening based on availability of toxicity information (see issues discussion in Section 9.3), such data are critical for developing interpretive criteria for bioaccumulation tests and therefore form the basis of the first criterion to prioritize chemicals relative to ecological toxicity. The second criterion compares regional tissue data to a residue-effects screening value. Specifically, the 95th percentile tissue concentration (or the highest detected concentration if insufficient data to calculate a 95th percentile concentration) for a particular chemical as listed in Table 6 is compared to its LOED screening value (if available – see Table 8). The LOED screening value was developed using the data compiled from the ERED and URS databases, and represents a conservative estimate of the lowest dose associated with adverse effects in aquatic species. The DMMP developed these screening values solely for BCOCs list revision and not for use as regulatory criteria. These screening values are intended to serve as a measuring stick against which the regional tissue data can be compared. The DMMP determined that this conservative criterion – comparing a high percentile tissue value to a low percentile residue-effects value – is appropriate for the purposes of prioritizing chemicals relative to bioaccumulation testing requirements. That a chemical’s 95th percentile detected tissue concentration exceeds the screening LOED should not be interpreted as a quantification of the ecological risk posed by that chemical. The alternative to this criterion applies only to the subset of chemicals that have never been detected in monitoring. A 95th percentile non-detected concentration that is greater than the screening LOED would at least imply that more work is needed to determine

19
whether method detection limits for a particular chemical are sufficiently low for the purposes of ecological risk assessment. The BWG recommended use of only detected values to derive 90 and 95th percentile tissue values. Including all of the data (detect and non-detect) resulted in a misleading tissue concentrations particularly due to the high frequency of non-detects in the SEDQUAL database. When non-detected data were included, 95th percentiles were often set by samples with elevated MDLs. The basis of the FCV criterion is the “high chronic toxicity” threshold used by EPA RCRA’s WMPT (USEPA, 1998). The maximum value of 100 ug/L (0.1 mg/L) is based on the chronic aquatic toxicity classification criteria developed by EPA Office of Pollution Prevention and Toxics to evaluate industrial chemicals under the Toxic Substances Control Act.
11. BCOC LIST DEFINITIONS 11.1 Overview of BCOC Lists The list of bioaccumulative contaminants of concern as originally conceived in PSDDA (1988) was a single list of contaminants with associated bioaccumulation triggers (BTs) and Target Tissue Levels (TTLs) (See Table 1). Yet in the process of gathering data for the list revision, it became clear that it would be difficult (if not impossible) to establish a single set of pass/fail criteria for determining which chemicals should be on the BCOC list. The DMMP agencies determined that the program would be better served by creation of multiple BCOC lists of differing priority. The agencies proposed the following four conceptual lists which were subsequently approved by the BWG:
List 1 Primary BCOCs – Chemicals on this list meet the DMMP’s weight of evidence criteria for defining a bioaccumulative contaminant to be “of concern”. Analysis in sediments (and potentially tissues) would be required for all chemicals6 on this list to determine dredged material suitability.
List 2 Candidate List of Bioaccumulative Contaminants - Analysis of these chemicals in sediments and tissues would be decided on an as-needed basis depending on the specifics of the project. List 2 chemicals would also be evaluated by the DMMP as part of disposal site monitoring and other special projects. These chemicals are considered likely to be of concern by the agencies but there is not yet enough information about them to fully meet the List 1 criteria.
List 3 Potentially Bioaccumulative Contaminants - Chemicals on this list are potentially bioaccumulative but would not meet the criteria of the other three lists. Typically, List 3 chemicals have been identified in the scientific literature as potentially bioaccumulative but their toxicity to humans and/or ecological
6 Analysis of Dioxins/Furans is determined on a project-by-project basis.
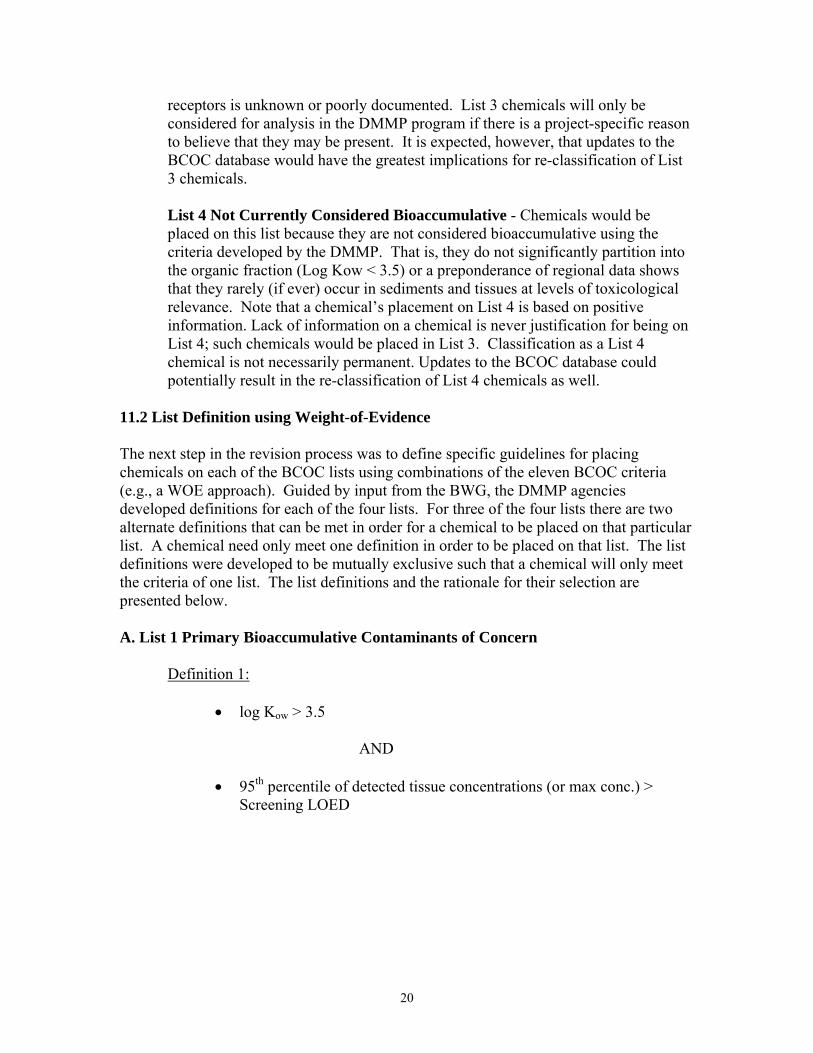
20
receptors is unknown or poorly documented. List 3 chemicals will only be considered for analysis in the DMMP program if there is a project-specific reason to believe that they may be present. It is expected, however, that updates to the BCOC database would have the greatest implications for re-classification of List 3 chemicals.
List 4 Not Currently Considered Bioaccumulative - Chemicals would be placed on this list because they are not considered bioaccumulative using the criteria developed by the DMMP. That is, they do not significantly partition into the organic fraction (Log Kow < 3.5) or a preponderance of regional data shows that they rarely (if ever) occur in sediments and tissues at levels of toxicological relevance. Note that a chemical’s placement on List 4 is based on positive information. Lack of information on a chemical is never justification for being on List 4; such chemicals would be placed in List 3. Classification as a List 4 chemical is not necessarily permanent. Updates to the BCOC database could potentially result in the re-classification of List 4 chemicals as well.
11.2 List Definition using Weight-of-Evidence The next step in the revision process was to define specific guidelines for placing chemicals on each of the BCOC lists using combinations of the eleven BCOC criteria (e.g., a WOE approach). Guided by input from the BWG, the DMMP agencies developed definitions for each of the four lists. For three of the four lists there are two alternate definitions that can be met in order for a chemical to be placed on that particular list. A chemical need only meet one definition in order to be placed on that list. The list definitions were developed to be mutually exclusive such that a chemical will only meet the criteria of one list. The list definitions and the rationale for their selection are presented below. A. List 1 Primary Bioaccumulative Contaminants of Concern
Definition 1:
• log Kow > 3.5 AND
• 95th percentile of detected tissue concentrations (or max conc.) > Screening LOED

21
Definition 2:
• log Kow > 3.5 AND
• tissue detection frequency > 10%
AND
• residue-effects LOED available AND
• known human- and/or ecotoxicity
Chemicals are placed on List 1 because they are hydrophobic and tend to partition into the organic fraction (Log Kow >3.5) and because the higher concentrations that have been detected in regional tissue monitoring exceed values associated with adverse effects in aquatic organisms (95th %ile tissue conc. > 5th %ile LOED). Alternatively, List 1 chemicals are hydrophobic, detected in regional tissue monitoring in at least 10 percent of the samples tested, and have residue-effects data available in the scientific literature. Furthermore, they are known to be toxic to human and/or aquatic receptors in that they meet one or more of the following three criteria for human and ecological toxicity:
• Have a Final Chronic Value less than 0.1 mg/L • Have a cancer slope factor or IRIS WOE score of A or B • Have a reference dose value less than 0.06 mg/kg/day
Chemicals meeting either the first or second definitions discussed above have a weight-of-evidence indicating that they are of concern for bioaccumulation. Note that both List 1 definitions prioritize tissue data over sediment data. Theoretically, a chemical does not need to be detected in sediments in order to be placed on List 1, although this is rarely the case. Typically, most chemicals detected in tissues are also detected in sediments while the reverse is not always true. It is for this reason that sediment detection is not a component of either List 1 definition. List 1 chemicals are presented in Table 9. The WOE evaluation placed polychlorodibenzodioxins (PCDD) and polychlorodibenzofurans (PCDF) on Lists 2 and 3, respectively, while 2,3,7,8-TCDD was placed on List 1 based on definition 2. One explanation for this discrepancy is that most of the tissue data queried in this effort did not include analysis for PCDD/PCDF. Furthermore, we did not develop a screening LOED for PCDD and PCDF. Those studies which included analysis for dioxins and furans did so because of site-specific need and typically reported results as toxic equivalents (TEQ) of 2,3,7,8-TCDD. Thus, the DMMP made the decision to put PCDD/F on List 1 based on the screening results for 2,3,7,8-TCDD as well as best professional judgement. Dioxins and furans have a special status

22
on List 1 in that they are only required for evaluation on an as-needed basis depending on site-specific conditions. While the lists and the WOE analysis addressed the isomers of DDT (e.g., 2,4’ and 4,4’ DDD, DDE, and DDT) separately from total DDT, they were lumped together for purposes of list placement. Both 4,4’-DDE and 4,4’-DDT meet List 1 definition 2 and thus total DDT was placed on List 1. Nearly all divalent trace metals evaluated were placed on List 1 because the 95th percentile tissue concentration exceeded a residue-effects threshold. Since Log Kow values are not available to trace metals, the Log Kow > 3.5 criteria was not applied to them. There has been extensive monitoring of these compounds throughout the Puget Sound region making it likely that some tissues measured would exhibit elevated concentrations. Interpretation of trace metal bioaccumulation data, however is difficult because aquatic species bioaccumulate trace metals to vary degrees and with varying toxicological consequences depending on their mechanisms for uptake, sequestration and metabolism. The DMMP recognizes that a different WOE process will need to be developed in the future for application to trace metals in order to reprioritize them for bioaccumulation assessments. Based on the summary and survey performed by D.M.D. Inc., standard methods for all List 1 chemicals are available and currently performed by regional laboratories (see Table 3). B. List 2 Candidate Bioaccumulative Contaminants
Definition 1:
• log Kow > 3.5
AND
• no tissue data available7
AND
• sediment detection frequency > 50% AND median of detected sediment samples exceeds 10x MDL (10x reference area concentrations for trace metals)
OR sediment detection frequency > 10% AND median of detected samples exceed 50x MDL (50x reference area concentrations for trace metals)
AND
7 Chemicals for which only SEDQUAL tissue data is available must meet the DMMP’s minimum criteria for data sufficiency (e.g., data must be from a minimum of two surveys, representing at least two taxa and the total number of samples must be greater than 30).

23
• known human- and/or ecotoxicity
Definition 2:
• log Kow > 3.5 AND
• no sediment or tissue data available AND
• known human- and/or ecotoxicity Chemicals are placed on List 2 because available information indicates that they may be of concern but additional information (primarily from regional tissue and sediment monitoring) is needed in order to make a definitive placement on Lists 1 or 4. According to definition 1, List 2 chemicals are hydrophobic and either frequently detected in sediments at concentrations that are somewhat in excess of detection limits (or reference values or metals) or infrequently detected at concentrations that are well above detection limits/reference values. Furthermore, List 2 chemicals are known to be toxic to human and/or aquatic receptors in that they meet one or more of the following three criteria for human and ecological toxicity:
• Have a Final Chronic Value less than 0.1 mg/L • Have a cancer slope factor or IRIS WOE score of A or B • Have a reference dose value less than 0.06 mg/kg/day
Definition 2 addresses the BWG’s concern that bioaccumulative chemicals that are not yet including in regional monitoring programs would fall through the cracks in this list definition process. Chemicals that meet definition 2 have not been regionally monitored in tissues or sediments but are hydrophobic and documented to be toxic to human and/or aquatic receptors in the scientific literature. List 2 chemicals are presented in Table 10. C. List 3 Potentially Bioaccumulative Contaminants
Chemicals are placed on List 3 when they do not meet any of the definitions of the other three lists. Typically List 3 chemicals are just beginning to receive national attention due to their potential for persistence and/or being detected in monitoring programs. The critical distinction between List 2 (definition 2) chemicals and those on List 3 is that the former are known to be toxic to human or aquatic receptors while the latter are not. List 3 chemicals will be re-evaluated for list placement when/if additional toxicity and regional occurrence data become available. List 3 chemicals are presented in Table 11.

24
D. List 4 Not Currently Considered Bioaccumulative
Definition 1:
• Log Kow < 3.5
Definition 2:
• Log Kow > 3.5
AND
• tissue detection frequency < 10% AND
• 95th percentile of detected tissue concentrations (or max conc.) < Screening LOED OR No Screening LOED available OR 95th percentile of non-detected concentrations (when all are NDs) < Screening LOED
AND
• marine sediment detection frequency < 10%8 AND
• freshwater sediment detection frequency < 10%5
Chemicals are placed on List 4 definition 1 because they are not sufficiently hydrophobic (Log Kow < 3.5) to warrant prioritization under this approach. Alternatively, definition 2 chemicals are sufficiently hydrophobic but regional tissue and sediment data indicate that they are rarely (if ever) detected and when detected are at concentrations that are less then tissue-residue effects levels (when available). Chemicals are always placed on List 4 based on positive information; the lack of information on a chemical is never justification for being on List 4. Thus, chemicals that otherwise satisfy the List 4 definitions but have no regional tissue data, would appear on either List 2 or 3 depending on what is known about their human/ecological toxicity. List 4 is presented in Table 12.
8 for trace metals which are expected to be detected in nearly all cases, the criterion is “< 10% elevated over reference area concentrations.” Reference area concentrations from PSEP (1991)

25
12. CONCLUSIONS AND NEXT STEPS The BCOC list is a “living” document. The lists will evolve as new information on BCOC chemicals is made available from regional monitoring programs and in the scientific literature. Furthermore, there are many emerging bioaccumulative chemicals of interest about which more information will become available with time. Such chemicals will be periodically added to one of the four lists. The process by which the list database will be maintained and the lists updated is currently being developed. The DMMP recognizes that the sediment and tissue data used to develop these lists primarily represent marine and estuarine environments of Puget Sound. One would expect a different mixture of contaminants in freshwater environments of this region reflecting, in particular, the greater influence of agricultural activities. For this reason, it is critical to supplement the regional data base used to generate these lists with sediment and (particularly) tissue data from regional monitoring of freshwater environments (e.g., Columbia River and Williamette River). Once this has been accomplished, the Agencies will consider the possibility of creating a separate set of BCOC lists for application to freshwater systems, recognizing that the contaminants of bioaccumulative concern may be very dissimilar between marine/estuarine and freshwater ecosystems. Some additional issues that should be addressed during future updates of these lists include:
• Incorporating congener-based PCB analysis. • Re-evaluation of the WOE criteria as applied to divalent metals. • Updating the prospective BCOC list based on a thorough literature review of
emerging bioaccumulative chemicals (e.g., octa- and deca-PBDE). • Developing (if possible) quantitative criteria reflecting a chemical’s documented
use and/or loading in the region. • Evaluating the degree of spatial coverage of freshwater and marine sediment data
from SEDQUAL (particularly for critical areas where higher contamination is likely to be observed).
• Re-evaluating the 10X/50X MDL approach to ranking the magnitude of contaminant concentrations in sediment by comparing to BSAF-derived risk-based sediment concentrations.
• Re-evaluating the minimum requirements (spatial and species coverage) for determining tissue data sufficiency for use in placing a chemical on a particular list.
• Developing alternative criteria for placing divalent metals on the lists. • Calculating taxa-specific detection frequencies and 95th percentile concentrations
instead of lumping all tissue data together. • Evaluating the detection limits of the methods used to measure BCOCs in
sediments/tissue database relative to risk-based concentrations (where available). • Revising the definitions for Lists 1 and 2 so that chemicals lacking human- or
eco-toxicity data (e.g., CSFs, RfDs and FCVs) are not automatically screened out. Development of a BCOC list is only the first step toward having scientifically defensible tissue and sediment bioaccumulation triggers (BTs) for use in regional dredging

26
programs. Recently, an inter-agency Region-wide initiative, encompassing Washington, Oregon, and Idaho, has formed to combine the various regional dredging manuals into a single Sediment Evaluation Framework (SEF) for the Corps Pacific Northwest Region/EPA Region 10. This initiative, known as the Regional Sediment Evaluation Team (RSET), includes a number of subcommittees that are updating portions of the SEF and addressing key issues that arise. One such subcommittee is the Bioaccumulation Subcommittee, which intends to carry forward the work on BCOCs initiated by the DMMP and BWG, described in this report. The RSET Bioaccumulation Subcommittee has recently completed its draft framework for addressing bioaccumulation in the SEF, and has recommended the following steps be carried out:
• Adoption of this framework for identifying BCOCs • Potential adoption of these BCOC lists for marine areas • Collection of additional sediment and tissue data for freshwater areas and
development of separate BCOC lists for freshwater areas • Calculation of tissue BTs for protection of human health, wildlife, and fish/ESA
species on a programmatic basis • Identification of BSAFs for back-calculation of sediment BTs for disposal sites or
cleanup sites on a regional or site-specific basis Methods for carrying out each of these steps are currently being developed and will be presented at an upcoming RSET meeting in 2005.

27
13. REFERENCES Broto, P., Moreau, G., and Vandycke, C. 1984. Molecular structures – Perception, auto-correlation descriptor and SAR studies – system of atomic contributions for the calculation of the normal-octanol water partition coefficients. Eur. J. Med. Chem. Volume 19, page 71. DMMP. 2003. Revision to the Bioaccumulative Contaminants of Concern (BCOC) List. DMMP issue paper. Prepared by Erika Hoffman for the DMMP agencies. DMMP. 2002. Proposed Revisions to the Bioaccumulative Contaminants of Concern (BCOC) List. DMMP issue paper. Prepared by Erika Hoffman for the DMMP agencies. DMMP. 1998. Revision of Guidelines for Bioaccumulative Chemicals of Concern. DMMP issue paper. Prepared by John Malek (EPA) and Tom Gries (Ecology) for the DMMP agencies. Environment Canada. 2000. Draft Canadian Environmental Quality Guidelines for Nonylphenol and its Etholxylates. October 2000. Ghose, A.K., and Crippen, G.M. 1987. Atomic physicochemical parameters for three-dimensional structure-directed quantitative structure-activitiy relationships 2. Modeling dispersive and hydrophobic interactions. J. Comput. Chem., 27:21-35. Hoffman, E. 1998. Technical Support Document: Revision of the Dredged Material Management Program Bioaccumulative Chemicals of Concern List. Prepared for the Dredged Material Management Program, September, 1998. 43 pages. Karickhoff, S.W., and J.M. Long, 1995. EPA Internal Report on Summary of Measured, Calculated, and Recommended Log Kow values, Prepared for Elizabeth Southerland. April 10, 1995. Mackay, D., Shiu, W.Y., and K.C. Ma, 1995. Illustrated Handbook of Physical - Chemical Properties and Environmental Fate for Organic Chemicals (Vol. 1), CRC Press. Mackay, D. Shiu, W.Y., and K.D. Ma. 1993. Illustrated Handbook of Physical-Chemical Properties and Environmental Fate for Organic Chemicals, Volume III, CRC Press. Meador, 2000. Predicting the fate and effects of tributyltin in marine systems, Rev. Environ. Contam. Toxicol. 166:1-48. NLM. 2001. Hazardous Substances Data Bank (HSDB) Home Page. <http:// www.nlm.nih.gov/pubs/factsheets/hsdbfs.html>. National Library of Medicine. PSDDA. 1996. Testing, Reporting, and Evaluation of Tributyltin data in PSDDA and SMS Programs. Issue paper. Prepared by Teresa Michelsen, Travis Shaw, and Stephanie Stirling for the PSDDA/SMS Agencies

28
PSDDA. 1989. Management Plan Report -Unconfined open-water disposal of dredged material, Phase II. US Army Corps of Engineers, Seattle District; USEPA, Region X; WA Department of Natural Resources; WA Department of Ecology. PSDDA. 1988. Evaluation Procedures Technical Appendix (EPTA) - Phase I. U.S. Army Corps of Engineers – Seattle District; U.S. Environmental Protection Agency - Region X; Washington State Department of Natural Resources; Washington State Department of Ecology. PSEP. 1991. Reference Area Performance Standards for Puget Sound. Puget Sound Estuary Program: Prepared for the US Environmental Protection Agency Region 10 and Washington State Department of Ecology by PTI, EPA 910/9-91-041. Shephard, B. Personal Communication. March 2001. SRC. 2001. PhysProp data base Home Page. http://www.syrres.com/esc/physdemo.htm. Syracuse Research Corp. Thomann, R.V. 1989. Bioaccumulation model of organic distribution in aquatic food chains. Environ. Sci. Technol. 23:699-707. USACE. 2001. The Environmental Residue-Effects Database (ERED) Home Page. http://www.wes.army.mil/el/ered/. U.S. Army Corps of Engineers. U.S. EPA. 2004. The Health Effects Assessment Summary Tables Home Page (HEAST). http://epa-heast.ornl.gov/heast/index.html . Office of Research and Development, Office of Emergency and Remedial Response, Washington, DC. USEPA. 2001a. The IRIS Home Page. http://www.epa.gov/iris/toxreviews. U.S. Environmental Protection Agency. USEPA. 2001b. The AQUIRE Home Page. http://www.epa.gov/ecotox. U.S. Environmental Protection Agency. USEPA. 2000a. Bioaccumulation testing and interpretation for the purpose of sediment quality assessment: Status and needs. Bioaccumulation Analysis Workgroup. Washington, D.C., EPA-823-R-00-001, February 2000, 113 pages. USEPA. 2000b. Exposure and Human Health Reassessment of 2,3,7,8-Tetrachlorodibenzo-p-Dioxin (TCDD) and Related Compounds Part III: Integrated Summary and Risk Characterization for 2,3,7,8-Tetrachlorodibenzo-p-Dioxin (TCDD) and Related Compounds. EPA/600/P-00/001Bg, SAB Review Draft September 2000. USEPA. 1998. Revised Waste Minimization Prioritization Tool Data File. Office of Solid Waste, Washington, D.C. September.

29
USEPA. 1997, The Incidence and Severity of Sediment Contamination in Surface Waters of the United States, Volume 1: National Sediment Quality Survey, Science and Technology, EPA 823-R-97-006, September. USEPA, 1994. Guidance for Assessing Chemical Contaminant Data for Use in Fish Advisories: Vol. 2 Risk Assessment and Fish Consumption Limits. EPA 823-B-94-004, June 1994. Viswanadhan, V.N., Ghose, A.K., Ganapathi, R.R., and Robins, R.K. 1989. Atomic physicochemical parameters for three-dimensional structure-directed quantitative structure-activitiy relationships. 4. Additional parameters for hydrophobic and dispersive interactions and their application for an automated superposition of certain naturally occurring nucleoside antibiotics. J. Chem. Inf. Comput. Sci., 29(3): 163-172. WDOE. 2002. SEDQUAL Data base Home Page < http://www.ecy.wa.gov/programs/tcp/smu/sedqualfirst.htm>. Washington State Department of Ecology. 14. ACKNOWLEDGMENTS BWG Participants Aason, Sandra Barton, Justine Bergmann, Karen Bourcier, Denis Buchman, Mike Chartrand, Allan Davis, Jay Davoli, Dana Day, Betsy Delinger, Dan Dutch, Maggie Gardener, Bill Gries, Tom Hicks, John Hillman, Helen Hoffman, Erika Hope, Bruce Hotchkiss, Doug Keeley, Karen Kissinger, Lon Lee, Fu-Shin Johns, Mike Kendall, David
Leibl, Matthew McGroddy, Susan Malek, John McCrone, Lawrence McGinnis, Roger Meador, Jim Michelsen, Teresa Musgrove, Nancy O’Neill, Sandra Powell, David Pinza, Meg Salazar, Mike Shephard, Burt St. Amant, Glen Stirling, Stephanie Stoltz, Pete Wakeman, John Ward, Jeff Warner, Lauran Wharton, Steve Wiegel, Joe Word, Jack Ytitalo, Gina
BWG Contractors Striplin Environmental Associates

2
Avocet Consulting D.M.D. Inc. In addition, URS-Greiner provided a substantial amount of tissue-residue effects data from URS’s internal database.
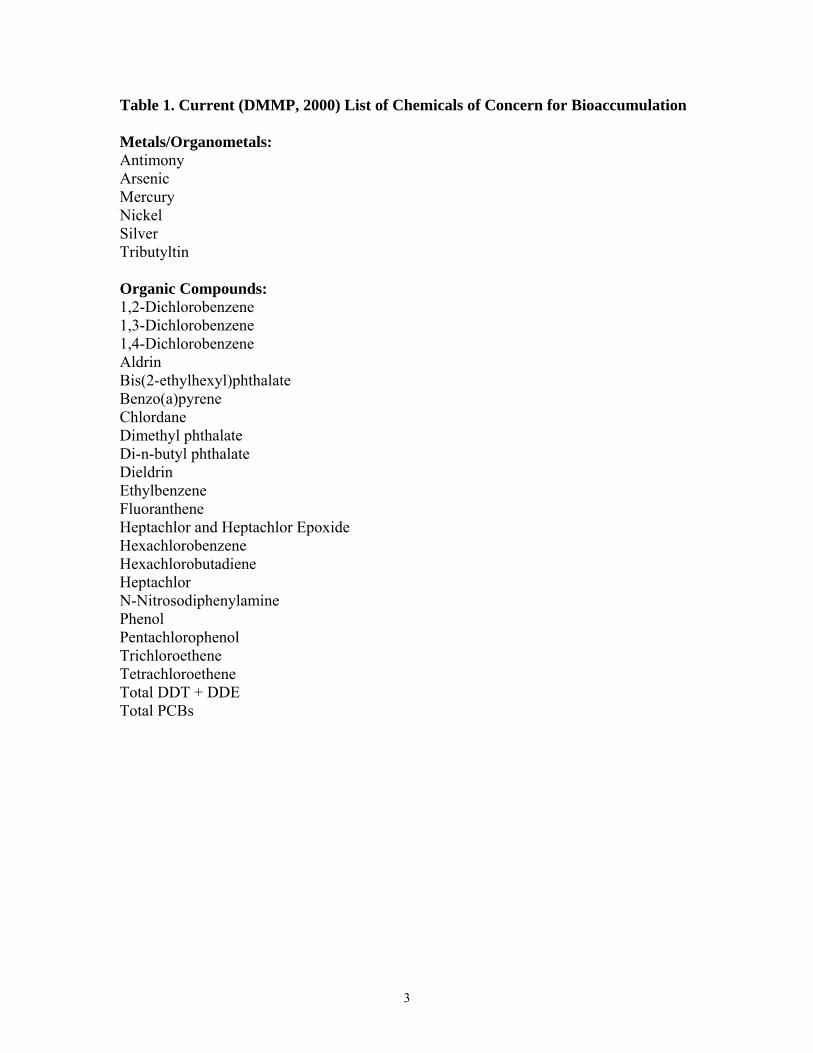
Table 1. Current (DMMP, 2000) List of Chemicals of Concern for Bioaccumulation
Metals/Organometals: Antimony Arsenic Mercury Nickel Silver Tributyltin Organic Compounds: 1,2-Dichlorobenzene 1,3-Dichlorobenzene 1,4-Dichlorobenzene Aldrin Bis(2-ethylhexyl)phthalate Benzo(a)pyrene Chlordane Dimethyl phthalate Di-n-butyl phthalate Dieldrin Ethylbenzene Fluoranthene Heptachlor and Heptachlor Epoxide Hexachlorobenzene Hexachlorobutadiene Heptachlor N-Nitrosodiphenylamine Phenol Pentachlorophenol Trichloroethene Tetrachloroethene Total DDT + DDE Total PCBs
3
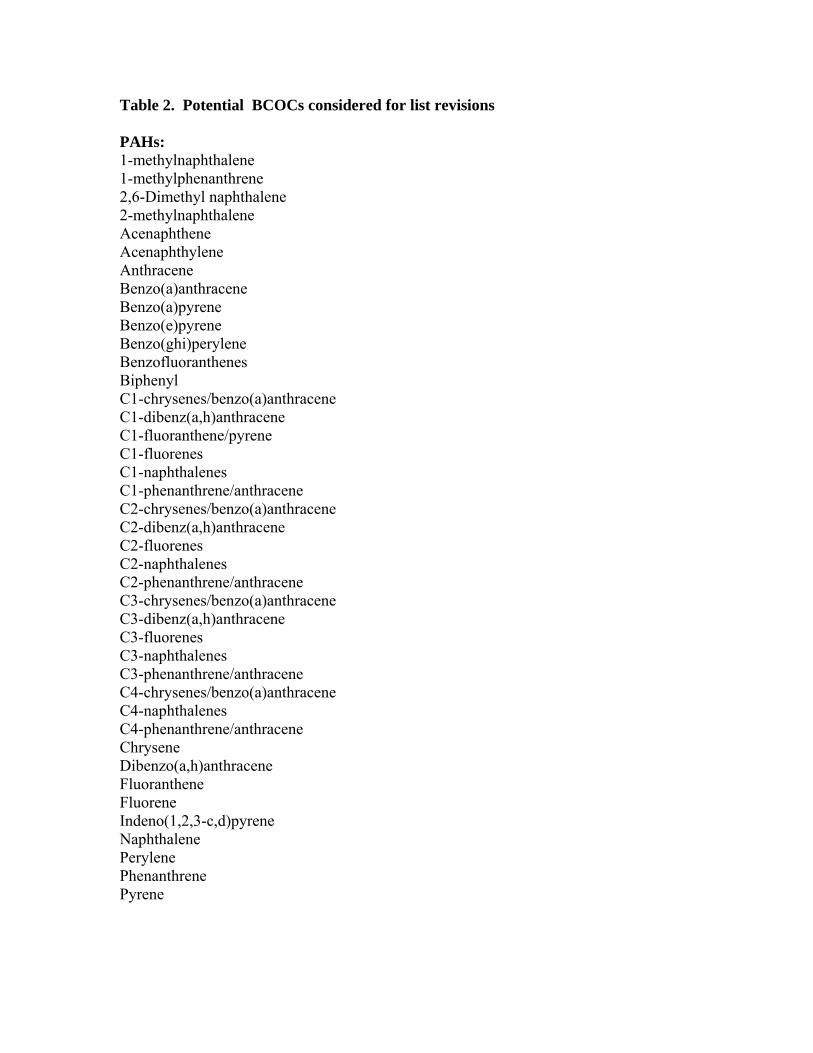
Table 2. Potential BCOCs considered for list revisions PAHs: 1-methylnaphthalene 1-methylphenanthrene 2,6-Dimethyl naphthalene 2-methylnaphthalene Acenaphthene Acenaphthylene Anthracene Benzo(a)anthracene Benzo(a)pyrene Benzo(e)pyrene Benzo(ghi)perylene Benzofluoranthenes Biphenyl C1-chrysenes/benzo(a)anthracene C1-dibenz(a,h)anthracene C1-fluoranthene/pyrene C1-fluorenes C1-naphthalenes C1-phenanthrene/anthracene C2-chrysenes/benzo(a)anthracene C2-dibenz(a,h)anthracene C2-fluorenes C2-naphthalenes C2-phenanthrene/anthracene C3-chrysenes/benzo(a)anthracene C3-dibenz(a,h)anthracene C3-fluorenes C3-naphthalenes C3-phenanthrene/anthracene C4-chrysenes/benzo(a)anthracene C4-naphthalenes C4-phenanthrene/anthracene Chrysene Dibenzo(a,h)anthracene Fluoranthene Fluorene Indeno(1,2,3-c,d)pyrene Naphthalene Perylene Phenanthrene Pyrene

Table 2. Potential BCOCs (cont.) Phthalates: Bis(2-ethylhexyl) phthalate Butyl benzyl phthalate Dimethyl phthalate Di-n-butyl phthalate Di-n-octyl phthalate Metals: Antimony Arsenic Cadmium Chromium Chromium VI Copper Lead Mercury Nickel Selenium Silver Zinc Organometallics: Tributyltin Tetraethyltin Triphenyltin chloride Methyltin trichloride Pesticides, Herbicides and PCBs: 2,6-dichlorobenzonitrile Alpha-Benzene Hexachloride Aldrin Bromoxynil Chlordane Chlorpyrifos Dacthal DCPA (dacthal) Diazinon Dicamba Dichlobenil Dicofol (kelthane) Dieldrin Diuron Endosulfan I/II Endosulfan sulfate
5

Table 2. Potential BCOCs (cont.) Pesticides (cont.) Endrin Ethion Fenitrothion G-BHC (Lindane) Guthion Heptachlor Heptachlor epoxide Kelthane Methoxychlor Methyl parathion Mirex Oxadiazon Parathion Pentachloroanisol Pronamide Tetradifon Total DDT (and individual isomers) Toxaphene Trifluralin Halogenated Organics: 1,2,3,4-Tetrachlorobenzene 1,2,3,5-Tetrachlorobenzene 1,2,3-Trichlorobenzene 1,3,5-Trichlorobenzene 1,2,4,5-Tetrachlorobenzene 1,2,4-Trichlorobenzene 1,2-Dichlorobenzene 1,3-Dichlorobenzene 1,4-Dichlorobenzene 2,3,7,8-TCDD 4-bromophenylphenylether 4,4'-Dichlorobenzophenone Heptachloronaphthalene Hexachlorobenzene Hexachloronaphthalene Octachloronaphthalene Pentabromodiphenyl ether Pentachloroanisole Pentachloronaphthalene
6

Halogenated Organics (cont.): Polybrominated terphenyls Polychlorinated alkenes Polychlorinated biphenyls/Arochlor PCBs Polychlorinated terphenyls Polychlorodibenzodioxins (PCDD) Polychlorodibenzofurans (PCDF) Tetrachloronaphthalene Trichloronaphthalene Phenols and misc. extractables: 4-Nonylphenol, branched Nonylphenol Dibenzothiophene Ethoxylated nonylphenol phosphate N-nitrosodiphenylamine Pentachlorophenol Phenol
7

Table 3. see attached Excel spreadsheet
8

Table 4. see attached Excel spreadsheet
9

Table 5. see attached Excel spreadsheet
10

Table 6. see attached Excel spreadsheet
11

Table 7. see attached Excel spreadsheet
12

Table 8. see attached Excel spreadsheet
13

Table 9. List 1 Primary Bioaccumulative Contaminants of Concern Definition 1 Arsenic Cadmium Chlordane Chromium Copper Lead Nickel Pentachlorophenol Total Aroclor PCB Pyrene Selenium Silver Tributyltin9
Zinc Definition 2 Dioxins/Furans10
Fluoranthene Hexachlorobenzene Mercury Total DDT
9 TBT analysis is only required on an as-needed basis (see 10 Dioxins and Furans are only required for analysis on an as-needed basis depending on site-specific conditions.
14

Table 10. List 2 Candidate Bioaccumulative Contaminants
Definition 1 Benzo(e)pyrene Biphenyl Chlorpyrifos Diazinon Endosulfan Mirex Perylene
Definition 2 1,2,4,5-Tetrachlorobenzene 4-Nonylphenol, branched Chromium VI Dacthal Ethion Heptachloronaphthalene Hexachloronaphthalene Kelthane Octachloronaphthalene Oxadiazon Parathion pentabromodiphenyl ether Pentachloronaphthalene Tetrachloronaphthalene Tetraethyltin Trichloronaphthalene Trifluralin
15
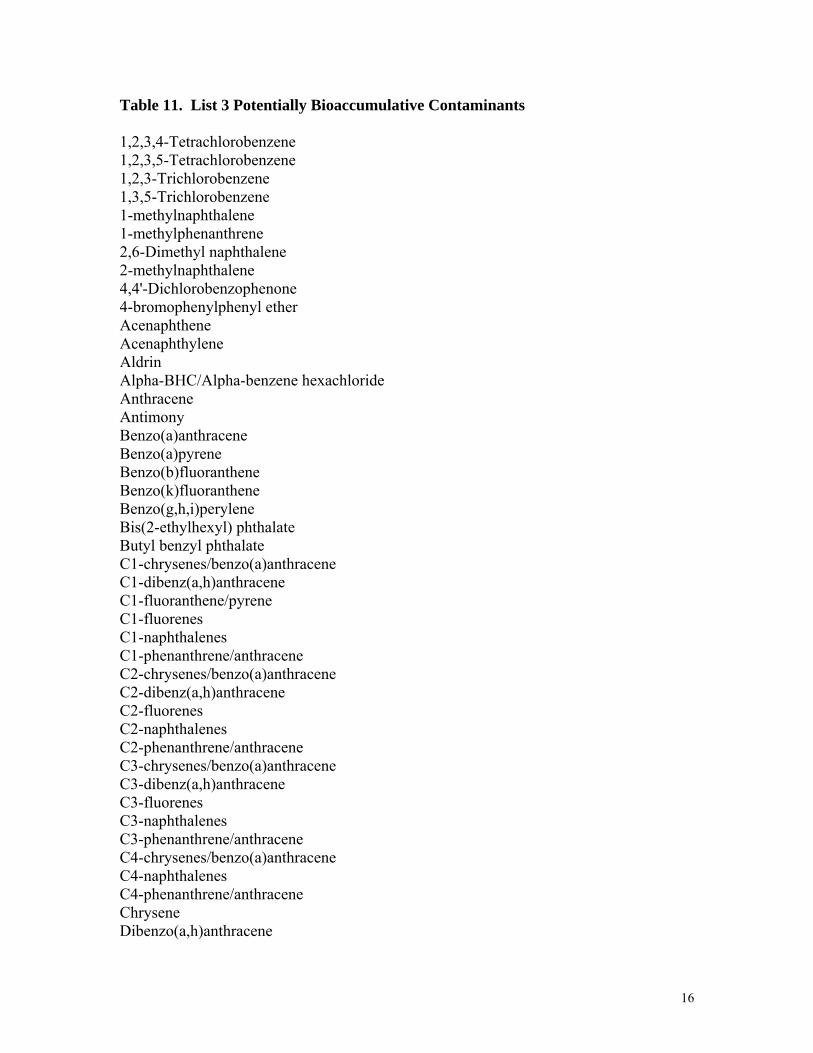
Table 11. List 3 Potentially Bioaccumulative Contaminants 1,2,3,4-Tetrachlorobenzene 1,2,3,5-Tetrachlorobenzene 1,2,3-Trichlorobenzene 1,3,5-Trichlorobenzene 1-methylnaphthalene 1-methylphenanthrene 2,6-Dimethyl naphthalene 2-methylnaphthalene 4,4'-Dichlorobenzophenone 4-bromophenylphenyl ether Acenaphthene Acenaphthylene Aldrin Alpha-BHC/Alpha-benzene hexachloride Anthracene Antimony
Benzo(a)anthracene Benzo(a)pyrene Benzo(b)fluoranthene Benzo(k)fluoranthene Benzo(g,h,i)perylene Bis(2-ethylhexyl) phthalate Butyl benzyl phthalate C1-chrysenes/benzo(a)anthracene C1-dibenz(a,h)anthracene C1-fluoranthene/pyrene C1-fluorenes C1-naphthalenes C1-phenanthrene/anthracene C2-chrysenes/benzo(a)anthracene C2-dibenz(a,h)anthracene C2-fluorenes C2-naphthalenes C2-phenanthrene/anthracene C3-chrysenes/benzo(a)anthracene C3-dibenz(a,h)anthracene C3-fluorenes C3-naphthalenes C3-phenanthrene/anthracene C4-chrysenes/benzo(a)anthracene C4-naphthalenes C4-phenanthrene/anthracene Chrysene Dibenzo(a,h)anthracene
16
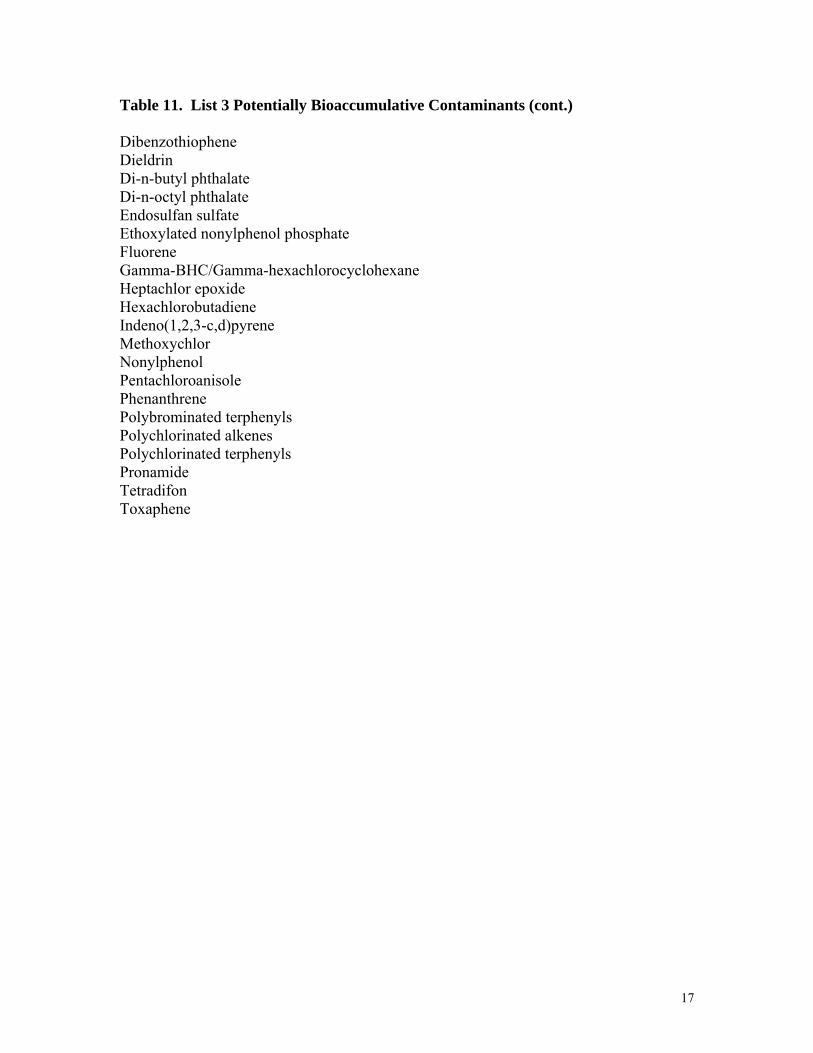
Table 11. List 3 Potentially Bioaccumulative Contaminants (cont.) Dibenzothiophene Dieldrin Di-n-butyl phthalate Di-n-octyl phthalate Endosulfan sulfate Ethoxylated nonylphenol phosphate Fluorene Gamma-BHC/Gamma-hexachlorocyclohexane Heptachlor epoxide Hexachlorobutadiene Indeno(1,2,3-c,d)pyrene Methoxychlor Nonylphenol Pentachloroanisole Phenanthrene Polybrominated terphenyls Polychlorinated alkenes Polychlorinated terphenyls Pronamide Tetradifon Toxaphene
17

Table 12. List 4 Not Currently Considered Bioaccumulative Contaminants Definition 1 1,4-Dichlorobenzene Bromoxynil Dicamba Dichlobenil Dimethyl phthalate Diuron Ethylbenzene Fenitrothion Guthion Methyl parathion Methyltin trichloride Naphthalene N-nitroso diphenylamine Phenol Tetrachloroethene Trichloroethene Triphenyltin chloride Definition 2 1,2,4-Trichlorobenzene 1,2-Dichlorobenzene 1,3-Dichlorobenzene Endrin Heptachlor Hexachloroethane
18
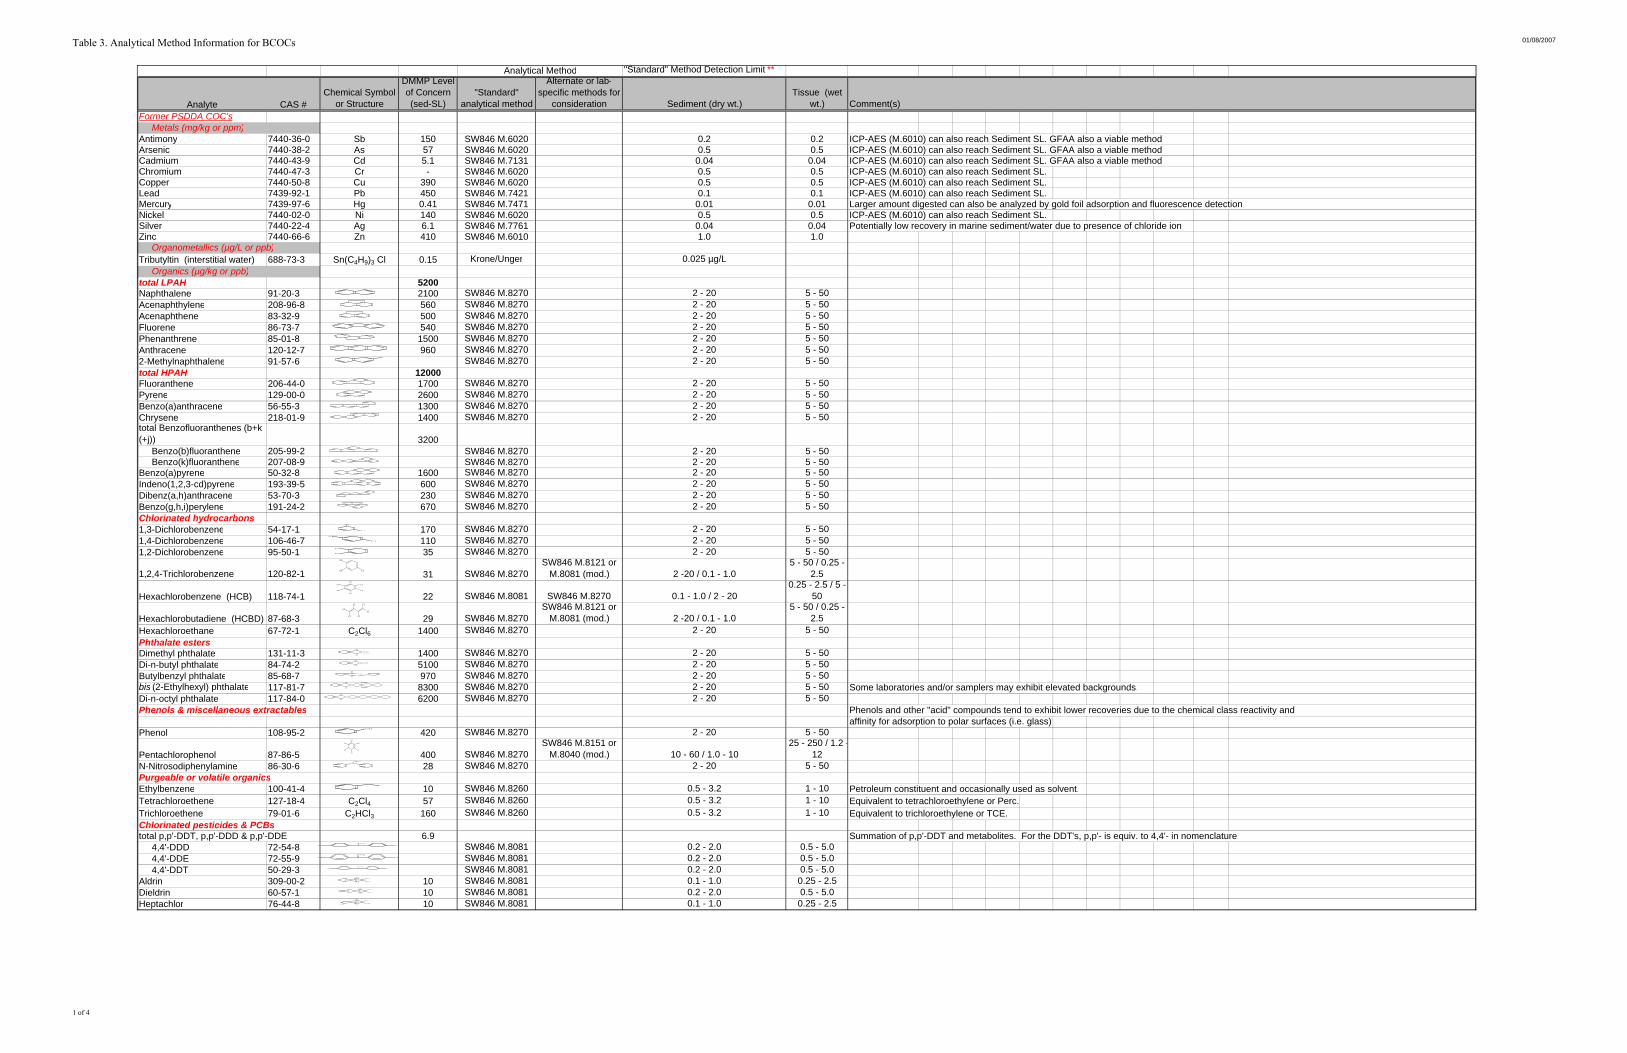
Table 3. Analytical Method Information for BCOCs 01/08/2007
"Standard" Method Detection Limit **
Analyte CAS #Chemical Symbol
or Structure
DMMP Level of Concern (sed-SL)
"Standard" analytical method
Alternate or lab-specific methods for
consideration Sediment (dry wt.)Tissue (wet
wt.) Comment(s)Former PSDDA COC's Metals (mg/kg or ppm)Antimony 7440-36-0 Sb 150 SW846 M.6020 0.2 0.2 ICP-AES (M.6010) can also reach Sediment SL. GFAA also a viable method.Arsenic 7440-38-2 As 57 SW846 M.6020 0.5 0.5 ICP-AES (M.6010) can also reach Sediment SL. GFAA also a viable method.Cadmium 7440-43-9 Cd 5.1 SW846 M.7131 0.04 0.04 ICP-AES (M.6010) can also reach Sediment SL. GFAA also a viable method.Chromium 7440-47-3 Cr - SW846 M.6020 0.5 0.5 ICP-AES (M.6010) can also reach Sediment SL.Copper 7440-50-8 Cu 390 SW846 M.6020 0.5 0.5 ICP-AES (M.6010) can also reach Sediment SL.Lead 7439-92-1 Pb 450 SW846 M.7421 0.1 0.1 ICP-AES (M.6010) can also reach Sediment SL.Mercury 7439-97-6 Hg 0.41 SW846 M.7471 0.01 0.01 Larger amount digested can also be analyzed by gold foil adsorption and fluorescence detectionNickel 7440-02-0 Ni 140 SW846 M.6020 0.5 0.5 ICP-AES (M.6010) can also reach Sediment SL.Silver 7440-22-4 Ag 6.1 SW846 M.7761 0.04 0.04 Potentially low recovery in marine sediment/water due to presence of chloride ionZinc 7440-66-6 Zn 410 SW846 M.6010 1.0 1.0 Organometallics (µg/L or ppb)Tributyltin (interstitial water) 688-73-3 Sn(C4H9)3 Cl 0.15 Krone/Unger 0.025 µg/L Organics (µg/kg or ppb)total LPAH 5200Naphthalene 91-20-3 2100 SW846 M.8270 2 - 20 5 - 50Acenaphthylene 208-96-8 560 SW846 M.8270 2 - 20 5 - 50Acenaphthene 83-32-9 500 SW846 M.8270 2 - 20 5 - 50Fluorene 86-73-7 540 SW846 M.8270 2 - 20 5 - 50Phenanthrene 85-01-8 1500 SW846 M.8270 2 - 20 5 - 50Anthracene 120-12-7 960 SW846 M.8270 2 - 20 5 - 502-Methylnaphthalene 91-57-6 SW846 M.8270 2 - 20 5 - 50total HPAH 12000Fluoranthene 206-44-0 1700 SW846 M.8270 2 - 20 5 - 50Pyrene 129-00-0 2600 SW846 M.8270 2 - 20 5 - 50Benzo(a)anthracene 56-55-3 1300 SW846 M.8270 2 - 20 5 - 50Chrysene 218-01-9 1400 SW846 M.8270 2 - 20 5 - 50total Benzofluoranthenes (b+k (+j)) 3200 Benzo(b)fluoranthene 205-99-2 SW846 M.8270 2 - 20 5 - 50 Benzo(k)fluoranthene 207-08-9 SW846 M.8270 2 - 20 5 - 50Benzo(a)pyrene 50-32-8 1600 SW846 M.8270 2 - 20 5 - 50Indeno(1,2,3-cd)pyrene 193-39-5 600 SW846 M.8270 2 - 20 5 - 50Dibenz(a,h)anthracene 53-70-3 230 SW846 M.8270 2 - 20 5 - 50Benzo(g,h,i)perylene 191-24-2 670 SW846 M.8270 2 - 20 5 - 50Chlorinated hydrocarbons1,3-Dichlorobenzene 54-17-1 170 SW846 M.8270 2 - 20 5 - 501,4-Dichlorobenzene 106-46-7 110 SW846 M.8270 2 - 20 5 - 501,2-Dichlorobenzene 95-50-1 35 SW846 M.8270 2 - 20 5 - 50
1,2,4-Trichlorobenzene 120-82-1 31 SW846 M.8270SW846 M.8121 or
M.8081 (mod.) 2 -20 / 0.1 - 1.05 - 50 / 0.25 -
2.5
Hexachlorobenzene (HCB) 118-74-1 22 SW846 M.8081 SW846 M.8270 0.1 - 1.0 / 2 - 200.25 - 2.5 / 5 -
50
Hexachlorobutadiene (HCBD) 87-68-3 29 SW846 M.8270SW846 M.8121 or
M.8081 (mod.) 2 -20 / 0.1 - 1.05 - 50 / 0.25 -
2.5Hexachloroethane 67-72-1 C2Cl6 1400 SW846 M.8270 2 - 20 5 - 50Phthalate estersDimethyl phthalate 131-11-3 1400 SW846 M.8270 2 - 20 5 - 50Di-n-butyl phthalate 84-74-2 5100 SW846 M.8270 2 - 20 5 - 50Butylbenzyl phthalate 85-68-7 970 SW846 M.8270 2 - 20 5 - 50bis (2-Ethylhexyl) phthalate 117-81-7 8300 SW846 M.8270 2 - 20 5 - 50 Some laboratories and/or samplers may exhibit elevated backgrounds.Di-n-octyl phthalate 117-84-0 6200 SW846 M.8270 2 - 20 5 - 50Phenols & miscellaneous extractables Phenols and other "acid" compounds tend to exhibit lower recoveries due to the chemical class reactivity and
affinity for adsorption to polar surfaces (i.e. glass).Phenol 108-95-2 420 SW846 M.8270 2 - 20 5 - 50
Pentachlorophenol 87-86-5 400 SW846 M.8270SW846 M.8151 or
M.8040 (mod.) 10 - 60 / 1.0 - 1025 - 250 / 1.2 -
12N-Nitrosodiphenylamine 86-30-6 28 SW846 M.8270 2 - 20 5 - 50Purgeable or volatile organicsEthylbenzene 100-41-4 10 SW846 M.8260 0.5 - 3.2 1 - 10 Petroleum constituent and occasionally used as solvent.Tetrachloroethene 127-18-4 C2Cl4 57 SW846 M.8260 0.5 - 3.2 1 - 10 Equivalent to tetrachloroethylene or Perc.Trichloroethene 79-01-6 C2HCl3 160 SW846 M.8260 0.5 - 3.2 1 - 10 Equivalent to trichloroethylene or TCE.Chlorinated pesticides & PCBstotal p,p'-DDT, p,p'-DDD & p,p'-DDE 6.9 Summation of p,p'-DDT and metabolites. For the DDT's, p,p'- is equiv. to 4,4'- in nomenclature. 4,4'-DDD 72-54-8 SW846 M.8081 0.2 - 2.0 0.5 - 5.0 4,4'-DDE 72-55-9 SW846 M.8081 0.2 - 2.0 0.5 - 5.0 4,4'-DDT 50-29-3 SW846 M.8081 0.2 - 2.0 0.5 - 5.0Aldrin 309-00-2 10 SW846 M.8081 0.1 - 1.0 0.25 - 2.5Dieldrin 60-57-1 10 SW846 M.8081 0.2 - 2.0 0.5 - 5.0Heptachlor 76-44-8 10 SW846 M.8081 0.1 - 1.0 0.25 - 2.5
Analytical Method
Cl
Cl
Cl
Cl
Cl
Cl
Cl
Cl Cl
Cl
Cl Cl
Cl
Cl
Cl
ClCl
Cl Cl
Cl Cl
O
O
OCH3
OCH3
O
O
OC4H9
OC4H9
O
O
OC4H9
O
O
O
O
O
O
O
O
O
OH
OH
Cl
Cl
Cl
Cl
Cl
N
NO
CCl3
ClCl
ClCl
CCl2
ClCl
CCl2
Cl
Cl
Cl
Cl
ClCl
Cl
Cl
Cl
Cl
ClClO
Cl
Cl
Cl
Cl
ClCl
Cl
1 of 4

Table 3. Analytical Method Information for BCOCs 01/08/2007
"Standard" Method Detection Limit **
Analyte CAS #Chemical Symbol
or Structure
DMMP Level of Concern (sed-SL)
"Standard" analytical method
Alternate or lab-specific methods for
consideration Sediment (dry wt.)Tissue (wet
wt.) Comment(s)
Analytical Method
gamma-BHC / gamma-HCH / Lindane 58-89-9 10 SW846 M.8081 0.1 - 1.0 0.25 - 2.5Polychlorinated Biphenyls (total PCBs, Aroclors or PCB congeners) 1336-36-3 130 SW846 M.8082
EPA Office of Water M.1668 2.0 - 20 5.0 - 50 Formerly by M. 8081, but now recommended by M. 8082. Can be run as Aroclors or congeners by this
method. Also analyzed by EPA M.1668 ( PCB Congeners by High Resolution Mass Spectrometry),non-PSDDA COC's which is an adaptation of M.1613 (for analysis of polychlorinated dioxins/furans). Inherent sensitivities are Metals (mg/kg or ppm) actually greater by GC/ECD, however M.1668 is more selective and minimizes false positive assignmentsSelenium 7782-49-2 Se SW846 M.7740 SW846 M.6020 0.2 0.2 Best analyzed by GFAA to reduce ICP/MS interferences and provide lower RL
Chromium VI
hexavalent ion of 7440-
47-3 Cr (+6)SW846 M.7196A
or M.7199 0.01 - 0.1 0.05 - 0.2 Requires SW846 M.3060 for sample preparation and extraction. Organometallics (µg/kg or ppb)Tributyltin chloride 688-73-3 (C4H9)3SnCl Krone/Unger 6.0 50 Either GC/MS or GC/FPD for determinative step; sensitivity slightly greater by GC/FPD, and selectivity greater by GC/MS.Methyltin trichloride 993-16-8 CH3SnCl3 Krone/Unger 6.0 50 Indirect analysis by Krone and calculation.Tetraethyltin 597-64-8 (C2H5)4Sn Krone/Unger 6.0 50 Modified Krone, not routinely performed.Triphenyltin chloride 639-58-7 (C6H5)3SnCl Krone/Unger 12 50 Modified Krone, not routinely performed. Organics (µg/kg or ppb)Polycyclic aromatic hydrocarbonsBenzo(e)pyrene 192-97-2 SW846 M.8270 2 - 20 5 - 50 Not routinely analyzed by most analytical contract labs, but can be on requestBiphenyl 92-52-4 SW846 M.8270 2 - 20 5 - 50 Not routinely analyzed by most analytical contract labs, but can be on requestPerylene 198-55-0 SW846 M.8270 2 - 20 5 - 50 Not routinely analyzed by most analytical contract labs, but can be on requestAlkyl polycyclic aromatic hydrocarbonsC1-Naphthalenes SW846 M.8270 2 - 20 5 - 50 Not routinely analyzed by most analytical contract labs, but can be on request.
Two isomers possible: 1-methylnaphthalene & 2-methylnaphthalene 1-Methylnaphthalene 90-12-0 SW846 M.8270 2 - 20 5 - 50 Not routinely analyzed by most analytical contract labs, but can be on requestC2-Naphthalenes SW846 M.8270 2 - 20 5 - 50 Not routinely analyzed by most analytical contract labs, but can be on request. Twelve isomers possible 2,6-Dimethylnaphthalene 581-42-0 SW846 M.8270 2 - 20 5 - 50 Not routinely analyzed by most analytical contract labs, but can be on requestC3-Naphthalenes SW846 M.8270 2 - 20 5 - 50 Not routinely analyzed by most analytical contract labs, but can be on request. Many isomers possible 1,6,7-Trimethylnaphthalene 2245-38-7 SW846 M.8270 2 - 20 5 - 50 Not routinely analyzed by most analytical contract labs, but can be on request 2,3,5-Trimethylnaphthalene 2245-38-7 SW846 M.8270 2 - 20 5 - 50 Not routinely analyzed by most analytical contract labs, but can be on request. Same as 1,6,7-trimethylnaphthaleneC4-Naphthalenes SW846 M.8270 2 - 20 5 - 50 Not routinely analyzed by most analytical contract labs, but can be on request. Many isomers possibleC1-Phenanthrenes / Anthracenes SW846 M.8270 2 - 20 5 - 50 Not routinely analyzed by most analytical contract labs, but can be on request. Many isomers possible. 1-Methylphenanthrene 832-69-9 SW846 M.8270 2 - 20 5 - 50 Not routinely analyzed by most analytical contract labs, but can be on requestC2-Phenanthrenes / Anthracenes SW846 M.8270 2 - 20 5 - 50 Not routinely analyzed by most analytical contract labs, but can be on request. Many isomers possible.C3-Phenanthrenes / Anthracenes SW846 M.8270 2 - 20 5 - 50 Not routinely analyzed by most analytical contract labs, but can be on request. Many isomers possible.C4-Phenanthrenes / Anthracenes SW846 M.8270 2 - 20 5 - 50 Not routinely analyzed by most analytical contract labs, but can be on request. Many isomers possible.C1-Fluorenes SW846 M.8270 2 - 20 5 - 50 Not routinely analyzed by most analytical contract labs, but can be on request. Five isomers possibleC2-Fluorenes SW846 M.8270 2 - 20 5 - 50 Not routinely analyzed by most analytical contract labs, but can be on request. Many isomers possibleC3-Fluorenes SW846 M.8270 2 - 20 5 - 50 Not routinely analyzed by most analytical contract labs, but can be on request. Many isomers possibleC1-Fluoranthenes / Pyrenes SW846 M.8270 2 - 20 5 - 50 Not routinely analyzed by most analytical contract labs, but can be on request. Many isomers possibleC1-Chrysenes / Benzo(a)anthracenes SW846 M.8270 2 - 20 5 - 50 Not routinely analyzed by most analytical contract labs, but can be on request. Many isomers possible.C2-Chrysenes / Benzo(a)anthracenes SW846 M.8270 2 - 20 5 - 50 Not routinely analyzed by most analytical contract labs, but can be on request. Many isomers possible.C3-Chrysenes / Benzo(a)anthracenes SW846 M.8270 2 - 20 5 - 50 Not routinely analyzed by most analytical contract labs, but can be on request. Many isomers possible.C4-Chrysenes / Benzo(a)anthracenes SW846 M.8270 2 - 20 5 - 50 Not routinely analyzed by most analytical contract labs, but can be on request. Many isomers possible.C1-Dibenz(--)anthracenes SW846 M.8270 2 - 20 5 - 50 Not routinely analyzed by most analytical contract labs, but can be on request. Many isomers possibleC2-Dibenz(--)anthracenes SW846 M.8270 2 - 20 5 - 50 Not routinely analyzed by most analytical contract labs, but can be on request. Many isomers possibleC3-Dibenz(--)anthracenes SW846 M.8270 2 - 20 5 - 50 Not routinely analyzed by most analytical contract labs, but can be on request. Many isomers possibleMiscellaneous extractablesNonylphenol 25154-52-3 SW846 M.8270 2 - 20 5 - 50 Not routinely analyzed by most analytical contract labs, but can be on request4-Nonylphenol, branched 84852-15-3 SW846 M.8270 2 - 20 5 - 50 Not routinely analyzed by most analytical contract labs, but can be on requestEthoxylated nonylphenol phosphate 51811-79-1 SW846 M.8270 SW846 M.8141(mod.) 3 - 30 10 - 100 Not routinely analyzed by most analytical contract labs, but can be on request.Dibenzothiophene 132-65-0 SW846 M.8270 2 - 20 5 - 50 Not routinely analyzed by most analytical contract labs, but can be on requestHalogenated extractable organics
1,2,3-Trichlorobenzene 87-61-6 SW846 M.8270SW846 M.8121 or
M.8081(mod.) 2 - 20 / 0.1 - 1.05 - 50 / 0.25 -
2.5 Not routinely analyzed by most analytical contract labs, but can be on request.
1,3,5-Trichlorobenzene 108-70-3 SW846 M.8270SW846 M.8121 or
M.8081(mod.) 2 - 20 / 0.1 - 1.05 - 50 / 0.25 -
2.5 Not routinely analyzed by most analytical contract labs, but can be on request.
1,2,3,4-Tetrachlorobenzene 634-66-2 SW846 M.8270SW846 M.8121 or
M.8081(mod.) 2 - 20 / 0.1 - 1.05 - 50 / 0.25 -
2.5 Not routinely analyzed by most analytical contract labs, but can be on request.
1,2,3,5-Tetrachlorobenzene 634-90-2 SW846 M.8270SW846 M.8121 or
M.8081(mod.) 2 - 20 / 0.1 - 1.05 - 50 / 0.25 -
2.5 Not routinely analyzed by most analytical contract labs, but can be on request.
Cl
Cl
Cl
Cl
Cl
Cl
Cl(n=2-10)
-CH3
-CH3
-CH3
-CH3
-CH3
H3C-
-CH3
-CH3
H3C-
H3C-
-CH3H3C-
(-CH3)2(-CH3)2
(-CH3)3(-CH3)3
(-CH3)4(-CH3)4
-CH3
(-CH3)2
(-CH3)3
-CH3
-CH3
-CH3
-CH3
(-CH3)2
(-CH3)2
(-CH3)3
(-CH3)3
(-CH3)4
(-CH3)4
-CH3
-CH3-CH3
(-CH3)2
(-CH3)2(-CH3)2
(-CH3)3
(-CH3)3(-CH3)3
S
-C9H19
OH
OH
H19C9
H19C9-
OP
OEt
OEt
O
Cl
Cl
Cl
Cl
ClCl
Cl
Cl Cl
Cl
Cl
Cl
ClCl
2 of 4

Table 3. Analytical Method Information for BCOCs 01/08/2007
"Standard" Method Detection Limit **
Analyte CAS #Chemical Symbol
or Structure
DMMP Level of Concern (sed-SL)
"Standard" analytical method
Alternate or lab-specific methods for
consideration Sediment (dry wt.)Tissue (wet
wt.) Comment(s)
Analytical Method
1,2,4,5-Tetrachlorobenzene 95-94-3 SW846 M.8270SW846 M.8121 or
M.8081(mod.) 2 - 20 / 0.1 - 1.05 - 50 / 0.25 -
2.5 Not routinely analyzed by most analytical contract labs, but can be on request.
Trichloronaphthalenes 1321-65-9 SW846 M.8270SW846 M.8121 or
M.8081(mod.) 3 - 30 / 0.5 - 5.05 - 50 / 1.2 -
12 Halowaxes. Not routinely analyzed by most analytical contract labs, but can be on request.
Tetrachloronaphthalenes 1335-88-2 SW846 M.8270SW846 M.8121 or
M.8081(mod.) 3 - 30 / 0.5 - 5.05 - 50 / 1.2 -
12 Halowaxes. Not routinely analyzed by most analytical contract labs, but can be on request.
Pentachloronaphthalenes 1321-64-8 SW846 M.8270SW846 M.8121 or
M.8081(mod.) 3 - 30 / 0.5 - 5.05 - 50 / 1.2 -
12 Halowaxes. Not routinely analyzed by most analytical contract labs, but can be on request.
Hexachloronaphthalenes 1335-87-1 SW846 M.8270SW846 M.8121 or
M.8081(mod.) 3 - 30 / 0.5 - 5.05 - 50 / 1.2 -
12 Halowaxes. Not routinely analyzed by most analytical contract labs, but can be on request.
Heptachloronaphthalenes 32241-08-0 SW846 M.8270SW846 M.8121 or
M.8081(mod.) 3 - 30 / 0.5 - 5.05 - 50 / 1.2 -
12 Halowaxes. Not routinely analyzed by most analytical contract labs, but can be on request.
Octachloronaphthalenes 2234-13-1 SW846 M.8270SW846 M.8121 or
M.8081(mod.) 3 - 30 / 0.5 - 5.05 - 50 / 1.2 -
12 Halowaxes. Not routinely analyzed by most analytical contract labs, but can be on request.
Polychlorinated alkenes SW846 M.8270SW846 M.8121 or
M.8081(mod.) 5 - 50 / 1.0 - 1010 - 100 / 2.5 -
25 Not routinely analyzed by most analytical contract labs, but can be on request.
Polychlorinated terphenyls 61788-33-8 SW846 M.8082SW846 M.8270 for
confirmation 4 10 Considered by NOAA to be a "fingerprint" for certain industrial processes like mold release agent for die casting. Also known as Santowaxes or Aroclor 54(00) series.
Pentachloroanisole 1825-21-4 SW846 M.8270SW846 M.8121 or
M.8081(mod.) 2 - 20 / 0.1 - 1.05 - 50 / 0.25 -
2.5 Not routinely analyzed by most regional labs. Can also be analyzed by M.8270, if additional calibration standards added.
4,4'-Dichlorobenzophenone 90-98-2 SW846 M.8270SW846 M.8121 or
M.8081(mod.) 2 - 20 / 0.3 - 3.05 - 50 / 0.5 -
5.0 Not routinely analyzed by most analytical contract labs, but can be on request.2,3,7,8-Tetrachlorodibenzo-p -dioxin 1746-01-6 EPA Method 1613 SW846 M.8290 0.0001 0.0001 SW846 M.8290 as alternate method; M.1613 has slightly more rigorous QA and reporting requirements.
Polychlorodibenzodioxins EPA Method 1613 SW846 M.8290 0.0001 - 0.001 0.0001 - 0.001 SW846 M.8290 as alternate method; M.1613 slightly more rigorous QA. 2,3,7,8- isomers show toxicity of concern for estimation of TEQ. Some labs show history of elevated backgrounds for some analytes, especially OCDD
Polychlorodibenzofurans EPA Method 1613 SW846 M.8290 0.0001 - 0.001 0.0001 - 0.001 SW846 M.8290 as alternate method; M.1613 slightly more rigorous QA. 2,3,7,8- isomers show toxicity of concern for estimation of TEQ.
Brominated diphenylethers SW846 M.8270SW846 M.8121 or
M.8081(mod.) 2 - 20 / 0.3 - 3.05 - 50 / 0.5 -
5.0 Not routinely analyzed by most analytical contract labs, but can be on request.
Pentabromodiphenyl ether 32534-81-9 SW846 M.8270SW846 M.8121 or
M.8081(mod.) 2 - 20 / 0.3 - 3.05 - 50 / 0.5 -
5.0 Not routinely analyzed by most analytical contract labs, but can be on request.
Polybrominated terphenyls SW846 M.8082SW846 M.8270 for
confirmation 4 10 Not routinely analyzed by most analytical contract labs, but can be on request.Chlorinated pesticidesalpha-Benzene hexachloride 319-84-6 SW846 M.8081 0.1 - 1.0 0.25 - 2.5 Synonym: alpha-BHCChlordane 57-74-9 SW846 M.8081 0.1 - 1.0 0.25 - 2.5 Technical Chlordane composed of ~70% alpha- & gamma-Chlordanes with the remainder as related chemicals.
Dacthal 1861-32-1 SW846 M.8081SW846 M.8270 for
confirmation 0.1 - 1.0 0.25 - 2.5 Not normally included in M.8081, but can be added on request.Endosulfan 115-29-7 SW846 M.8081 0.1 - 1.0 0.25 - 2.5Endosulfan sulfate 1031-07-8 SW846 M.8081 0.2 - 2.0 0.5 - 5.0Endrin 72-20-8 SW846 M.8081 0.2 - 2.0 0.5 - 5.0Heptachlor epoxide 1024-57-3 SW846 M.8081 0.2 - 2.0 0.5 - 5.0Kelthane 115-32-2 SW846 M.8081 1.0 - 10 2.5 - 25 Not routinely analyzed by most analytical contract labs, but can be on request by modified M.8081. Hydroxylated DDTMethoxychlor 72-43-5 SW846 M.8081 1.0 - 10 2.5 - 25Mirex 2385-85-5 SW846 M.8081 0.1 - 1.0 0.25 - 2.5Toxaphene 8001-35-2 C10H16-xClx SW846 M.8081 5.0 - 50 12 - 125 Chlorinated camphene.
Pronamide 23950-58-5SW846 M.8121 or
M.8081(mod.) SW846 M.8270 1.0 - 10 2.5 - 25 Not routinely analyzed by most analytical contract labs, but can be on request. M.8270 exhibits higher RL. Synonym: propyzamide.2,4'-DDD 53-19-0 SW846 M.8081 0.2 - 2.0 0.5 - 5.0 Not normally included in M.8081, but can be added on request2,4'-DDE 3424-82-6 SW846 M.8081 0.2 - 2.0 0.5 - 5.0 Not normally included in M.8081, but can be added on request2,4'-DDT 789-02-6 SW846 M.8081 0.2 - 2.0 0.5 - 5.0 Not normally included in M.8081, but can be added on requestDicamba 1918-00-9 SW846 M.8151 3.5 5.0 Can also be detected by M.8270 but generally poor response if not derivatized
Dichlobenil 1194-65-6 SW846 M.8081SW846 M.8121 or
M.8270 1.0 2.5 Not normally included in M.8081, but can be added on request.Diuron 330-54-1 SW846 M.8151 3.0 5.0
Oxadiazon 19666-30-9 SW846 M.8141SW846 M.8121 or
M.8081(mod.) 2.0 - 10 5.0 - 20 Special request analysis, GC/NP analysis - N-mode; or GC/ECD. Can be analyzed by M.8270 with elevated RL.
Tetradifon 116-29-0 SW846 M.8081SW846 M.8121 or
M.8270 1.0 2.5 Not normally included in M.8081, but can be added on request.Other pesticides
Trifluralin 1582-09-8 SW846 M.8081
SW846 M.8141 (N-mode due to
presence of N) 1.0 - 5.0 2.0 - 20 Not routinely analyzed by most analytical contract labs, but can be on request.
Bromoxynil 1689-84-5SW846 M.8121 or
M.8081(mod.) SW846 M.8270 1.0 / 3.0 - 30 2.5 / 5.0 - 50 Not routinely analyzed by most analytical contract labs, but can be on request. Employment of M.8270 yields higher RL.
Ethion 563-12-2 SW846 M.8141SW846 M.8121 or
M.8081(mod.) 2.5 5.0 Organo-P pesticide. Not routinely analyzed by most regional analytical contract labs. Higher RL by M.8270.
Guthion 86-50-0 SW846 M.8141SW846 M.8121 or
M.8081(mod.) 2.5 5.0 Organo-P pesticide. Not routinely analyzed by most regional analytical contract labs. Higher RL by M.8270.
Cl
Cl
Cl
Cl
ClCl
Cl
Cl
Cl
ClCl
Cl
-Cl3
-Cl4
-Cl5
-Cl6
-Cl7
-Cl8
C18H14-nCln n=1-14
O
ClCl
Cl
Cl Cl
O
Cl Cl
O
Cl Cl
Cl Cl
O
C12O2H4-nCl4+n n=0-4
O
Cl Cl
Cl Cl
O
C12OH4-nCl4+n n=0-4Cl Cl
Cl Cl
O
C12OH8-nBr2+n n=0-8
O
-Br5
C12OH5Br5
O
C18H14-nBrn n=1-14
OO
OO
Cl
Cl
Cl
Cl
Cl
Cl
Cl
Cl
Cl
Cl
O
S
O
Cl
Cl
Cl
Cl
ClClO
O
S
O
Cl
Cl
Cl
Cl
ClCl
O
O
Cl
Cl
Cl
Cl
ClClO
Cl
Cl
Cl
Cl
ClCl
Cl
O
CCl3
OH
ClCl
CCl3
OCH3CH3O
ClCl
ClCl Cl Cl
Cl
Cl Cl
Cl
ClCl
CF3
O2N NO2
N
CN
Br Br
OH
OP
S SP
O
O
S S
O
N
NN
SP
O
OS
O
Cl
Cl
N
O
CCl2
Cl
Cl
CCl2
Cl
Cl
CCl3
Cl
Cl
OH
OCl
OCl
CN
Cl
Cl
NH NCl
Cl
O
N
N
O
O
Cl
Cl
O
S ClCl
Cl
Cl
O
O
3 of 4

Table 3. Analytical Method Information for BCOCs 01/08/2007
"Standard" Method Detection Limit **
Analyte CAS #Chemical Symbol
or Structure
DMMP Level of Concern (sed-SL)
"Standard" analytical method
Alternate or lab-specific methods for
consideration Sediment (dry wt.)Tissue (wet
wt.) Comment(s)
Analytical Method
Methyl parathion 298-00-0 SW846 M.8141SW846 M.8121 or
M.8081(mod.) 2.5 5.0 Organo-P pesticide. Best analyzed by GC/FPD or NP for low levels. Can be determined by M.8270, but with higher RL.
Parathion 56-38-2 SW846 M.8141SW846 M.8121 or
M.8081(mod.) 2.5 5.0 Organo-P pesticide. Best analyzed by GC/FPD or NP for low levels. Can be determined by M.8270, but with higher RL.
Chlorpyrifos 2921-88-2 SW846 M.8141SW846 M.8121 or
M.8081(mod.) 2.5 5.0 Not routinely analyzed by most analytical contract labs, but can be on request.Diazinon 333-41-5 SW846 M.8141 2.5 5.0 Organo-P pesticide. Best analyzed by GC/FPD or NP for low levels. Can be determined by M.8270, but with higher RLFenitrothion 122-14-5 SW846 M.8141 2.5 5.0 Organo-P pesticide. Best analyzed by GC/FPD or NP for low levels. Can be determined by M.8270, but with higher RL
Compiled by D.M.D., Inc. in association with Striplin Environmental Associates
Note 1: SW846 M.XXXX is interpreted as U.S. EPA (Office of Solid Waste) SW846 Method XXXXNote 2: EPA SW846 Method 6020 is ICP/MS, available at most laboratories or through subcontracting. Advantages over M.6010 (ICP-AES) are generally greater sensitivity and multielement analysisNote 3: Method 8121 is used to determine chlorinated and other halogenated compounds by GC/ECD. Not commonly run by many regional analytical contract labs In general, the screening-type organics analyses methods, such as M.8081, 8121, 8141 and 8151, offer enhanced sensitivities; however, disadvantages include reduced selectivities and greater chances of false positive identifications M.8270, while exhibiting generally reduced sensitivity or elevated RL compared to the "screening" methods, offers extremely high selectivity which reduces chances of false positive assignments M.8270, as the EPA method is written, is a full-scan method, which yields the greatest selectivity. Improvements in sensitivity (generally by a factor of 10) can be attained if run in an SIM mode, which yields less selectivity M.8270 should be run, whenever possible, in a full-scan mode to yield the greatest amount of information regarding potential interferences, the presence of TICs, and to achieve greatest selectivity M.8270 run in a full scan mode may not always be possible if sensitivity issues are paramount and reduced RLs are requiredNote 4: In general, all analytical results should be reported with % moisture, TOC and % lipid contents, as appropriate to the sample matrix
Big Note: While recommended or alternate methods are identified above for the analysis of the chemicals of concern, it is strongly suggested that a "performance-based" approach be employed by analytical contract labs in order to encourage innovation and for achievement of pre-established DQO Careful identification of DQOs for the chemicals of concern by technical program managers and providing the DQOs to the project laboratory is critical to achieve project/program goals. Failure to do so can be expected to result in failure of the monitoring effor It is strongly encouraged that DQOs be identified that can also be indicators of analytical performance for the analyses of difficult chemicals in problem matrices. Remember - not all samples behave the same; all environmental samples should be considered different and atypica Technical project managers and data users are strongly encouaged to work with their project labs during the planning and monitoring phases in order to ensure success in achievement of monitoring goals
** Principal or initial reported "method detection limit" is a verifiable quantitation level or range attained within a linear calibration with authentic chemical standards. This level/value should have associated QC with A10 representing an estimated or extrapolated "limit". A second listed limit or range is associated with the alternate method (if identified). The reported limits and ranges should be considered approximate and are generally attained by reputable and competent analytical contract laboratories Lower limits than those presented here can be attained, however, extra effort and special techniques will be necessary. Improvements in sensitivities by factors of 10x or more are also achievable and have been demonstrated, however special sampling and handling may also be required to lim interference from inadvertent or background artifactual contamination.
SAPA = Sampling Analysis Plan Appendix - maximum RLs set at 1/3 the SL to esure that exceedences are real
OP OCH3
CH3O SNO2
OP OC2H5
C2H5O SNO2
NO
PO
Cl
Cl
Cl
S
O
N
NO
PO
S
O
NO2O
PO
S
O
4 of 4

Table 4: Log Kow Values 01/08/2007
Log kowChemical CAS (1) Reference
1,2,3,4-Tetrachlorobenzene 634-66-2 4.611,2,3,5-Tetrachlorobenzene 634-90-2 4.671,2,3-Trichlorobenzene 87-61-6 4.101,2,4,5-Tetrachlorobenzene 95-94-3 4.641,2,4-Trichlorobenzene 120-82-1 4.011,2-Dichlorobenzene 95-50-1 3.431,3,5-Trichlorobenzene 108-70-3 4.171,3-Dichlorobenzene 54-17-1 3.531,4-Dichlorobenzene 106-46-7 3.421-methylnaphthalene 90-12-0 3.9 - 4.0 DMD1-methylphenanthrene 832-69-9 5.10 DMD2,3,7,8-Tetrachlorodibenzo-p-dioxin 1746-01-6 6.532,4'-DDD 53-19-0 5.87 SRC2,4'-DDE 3424-82-6 6.00 SRC2,4'-DDT 789-02-6 6.79 SRC2,6-Dimethyl naphthalene 581-42-0 4.3 - 4.4 DMD2-methylnaphthalene 91-57-6 3.864,4'-DDD 72-54-8 6.104,4'-DDE 72-55-9 6.764,4'-DDT 50-29-3 6.534,4'-Dichlorobenzophenone 90-98-2 4.44 SRC4-bromophenylphenylether 101-55-3 4.94 WMPT4-Nonylphenol, branched 84852-15-3 5.92 WMPTAcenaphthene 83-32-9 3.92Acenaphthylene 208-96-8 3.94 WMPTAldrin 309-00-2 6.50Alpha-Benzene Hexachloride 319-84-6 3.80Anthracene 120-12-7 4.55Antimony 7440-36-0 N/AArsenic 7440-38-2 N/ABenzo(a)anthracene 56-55-3 5.70Benzo(a)pyrene 50-32-8 6.11Benzo(b)fluoranthene 205-99-2 6.20Benzo(e)pyrene 192-97-2 6.44 WMPTBenzo(g,h,i)perylene 191-24-2 6.70Benzo(k)fluoranthene 207-08-9 6.20Biphenyl 92-52-4 4.01Bis(2-ethylhexyl) phthalate 117-81-7 7.30Bromoxynil 1689-84-5 3.39 WMPTButyl benzyl phthalate 85-68-7 4.84C1-Chrysenes/Benzo(a)anthracene # 5.5 - 5.6 DMDC1-dibenz(a,h)anthracene # 6.5 - 6.8 DMDC1-fluoranthene/pyrene # 4.8 - 5.0 DMDC1-fluorenes # 4.6 - 5.0 DMDC1-Naphthalenes # 3.7 - 4.1 DMDC1-phenanthrene/anthracene # 5.1 - 5.7 DMDC2-Chrysenes/Benzo(a)anthracene # 5.8 - 7.0 DMDC2-dibenz(a,h)anthracene # 7.0 - 7.2 DMDC2-fluorenes # 4.2 - 4.7 DMDC2-Naphthalenes # 4.2 - 4.6 DMDC2-phenanthrene/anthracene # 5.3 - 5.7 DMDC3-Chrysenes/Benzo(a)anthracene # 6.2 - 6.6 DMDC3-dibenz(a,h)anthracene # 7.2 - 7.6 DMD
1 of 3

Table 4: Log Kow Values 01/08/2007
Log kowChemical CAS (1) Reference
C3-fluorenes # 4.6 - 5.2 DMDC3-Naphthalenes # 4.8 - 4.9 DMDC3-phenanthrene/anthracene # 5.3 - 5.5 DMDC4-Chrysenes/Benzo(a)anthracene # 6.6 - 7.0 DMDC4-Naphthalenes # 4.7 - 4.9 DMDC4-phenanthrene/anthracene # 5.7 - 5.9 DMDCadmium 7440-43-9 N/AChlordane 57-74-9 6.32Chlorpyrifos 2921-88-2 5.26Chromium 7440-47-3 N/AChromium IV # N/AChrysene 218-01-9 5.70Copper 7440-50-8 N/ADacthal 1861-32-1 4.40Diazinon 333-41-5 3.81Dibenz(a,h)anthracene 53-70-3 6.69Dibenzothiophene 132-65-0 4.38 SRCDicamba 1918-00-9 2.21Dichlobanil 1194-65-6 2.74 HSDBDieldrin 60-57-1 5.37Dimethyl phthalate 131-11-3 1.57Di-n-butyl phthalate 84-74-2 4.61Di-n-octyl phthalate 117-84-0 8.06Diuron 330-54-1 2.80Endosulfan 115-29-7 4.10Endosulfan sulfate 1031-07-8 3.66Endrin 72-20-8 5.06Ethion 563-12-2 5.07Ethoxylated nonylphenol phosphate 51811-79-1 4.1 - 4.4 CANEthylbenzene 100-41-4 3.14Fenitrothion 122-14-5 3.30 WMPTFluoranthene 206-44-0 5.12Fluorene 86-73-7 4.21gamma-BHC /gamma-Hexachlorocyclohexane 58-89-9 3.73Guthion 86-50-0 2.75Heptachlor 76-44-8 6.26Heptachlor epoxide 1024-57-3 5.00Heptachloronaphthalene 32241-08-0 7.68 WMPTHexachlorobenzene 118-74-1 5.89Hexachlorobutadiene 87-68-3 4.81Hexachloroethane 67-72-1 4.00Hexachloronaphthalene 1335-87-1 7.04 WMPTIndeno(1,2,3-c,d)pyrene 193-39-5 6.65Kelthane 115-32-2 6.06Lead 7439-92-1 N/AMercury 7439-97-6 N/AMethoxychlor 72-43-5 5.08Methyl parathion 298-00-0 2.90Methyltin trichloride 993-16-8 -1.29 WMPTMirex 2385-85-5 6.89Naphthalene 91-20-3 3.36Nickel 7440-02-0 N/AN-nitroso diphenylamine 86-30-6 3.16
2 of 3

Table 4: Log Kow Values 01/08/2007
Log kowChemical CAS (1) Reference
Nonylphenol 25154-52-3 6.00 WMPTOctachloronaphthalene 2234-13-1 8.24 WMPTOxadiazon 19666-30-9 4.80 SRCParathion 56-38-2 3.83pentabromodiphenyl ether 32534-81-9 7.4 - 12.8 DMDPentachloroanisole 1825-21-4 5.45 HSDBPentachloronaphthalene 1321-64-8 6.88 WMPTPentachlorophenol 87-86-5 5.09Perylene 198-55-0 6.25 WMPTPhenanthrene 85-01-8 4.55Phenol 108-95-2 1.48Polybrominated terphenyls # 6.5 - 17.2 DMDPolychlorinated alkenes # 4.5 - 15 DMDPolychlorinated Biphenyls 1336-36-3 3.6 - 11 DMDPolychlorinated Terphenyls 61788-33-8 6.0 - 13.4 DMDPolychlorodibenzodioxins # 5.5 - 13.1 DMDPolychlorodibenzofurans # 5.8 - 13.9 DMDPronamide 23950-58-5 3.51Pyrene 129-00-0 5.11Selenium 7782-49-2 N/ASilver 7440-22-4 N/ATetrachloroethene 127-18-4 2.67Tetrachloronaphthalene 1335-88-2 5.86 WMPTTetradifon 116-29-0 4.72 HSDBTetraethyltin 597-64-8 5.44 WMPTTotal benzofluoranthenes (b+k (+j)) # N/ATotal pp,-DDT,-DDD,-DDE # N/AToxaphene 8001-35-2 5.50Tributyltin 688-73-3 3.7 - 4.4 Meador Trichloroethene 79-01-6 2.71Trichloronaphthalene 1321-65-9 5.10 WMPTTrifluralin 1582-09-8 5.34Triphenyltin chloride 639-58-7 2.83Zinc 7440-66-6 N/A
N/A = not applicable; # = no CAS number available(1) Log Kow values from Karickhoff and Long (1995) except as noted.HSDB = from the Hazardous Substances Data Bank compiled by the National Library of Medicine (NLM, 2001)WMPT = from EPA’s Waste Minimization Prioritization Tool (USEPA,1998) SRC = from PhysProp data base maintained by the Syracuse Research Corp (SRC,2001) CAN = from Canadian Environmental Quality Guidelines for Nonylphenol and its Ethoxylates (Environment Canada, 2000).Meador = from Meador (2000)DMD = as compiled by D.M.D. Inc. from the following sources: Mackay et al., 1993; Broto et al., 1984; Vellarkad et al., 1989; Ghose and Crippen, 1987.A range of values represents the ranges associated with experimental measurement by a variety of methods and/or the fact that some entries represent a mixture of chemicals and not pure materials.
3 of 3

Table 5. Occurance in Sediments 01/08/2007
SEDQUAL Freshwater (1) SEDQUAL Marine (2) Comparison values (3)
Chemical CASNumber of Samples % Detected
Median of detected
values ppbdw
Number of Samples
% Detected
Median of detected values
ppb dwMDL or
Reference Value 10X 50X1,2,3,4-Tetrachlorobenzene 634-66-2 2 - 20 / 0.1 - 1.0 20 - 200 / 1.0 - 10 100 - 1000 / 5 - 501,2,3,5-Tetrachlorobenzene 634-90-2 2 - 20 / 0.1 - 1.0 20 - 200 / 1.0 - 10 100 - 1000 / 5.0 - 501,2,3-Trichlorobenzene 87-61-6 24 0.0 ND 85 0.0 ND 2 - 20 / 0.1 - 1.0 20 - 200 / 1.0 - 10 100 - 1000 / 5.0 - 501,2,4,5-Tetrachlorobenzene 95-94-3 2 - 20 / 0.1 - 1.0 20 - 200 / 1.0 - 10 100 - 1000 / 5.0 - 501,2,4-Trichlorobenzene 120-82-1 188 0.5 150 4782 3.9 14 2 -20 / 0.1 - 1.0 20 - 200 / 1.0 - 10 100 - 1000 / 5.0 - 501,2-Dichlorobenzene 95-50-1 173 1.7 3 4923 5.7 5 2 - 20 20 - 200 100 - 10001,3,5-Trichlorobenzene 108-70-3 2 - 20 / 0.1 - 1.0 20 - 200 / 1.0 - 10 100 - 1000 / 5.0 - 501,3-Dichlorobenzene 541-73-1 200 0.5 601 4926 4.8 5 2 - 20 20 - 200 100 - 10001,4-Dichlorobenzene 106-46-7 196 7.1 16 5076 11.5 17 2 - 20 20 - 200 100 - 10001-methylnaphthalene 90-12-0 28 67.9 300 3572 11.4 21 2 - 20 20 - 200 100 - 10001-methylphenanthrene 832-69-9 3126 16.0 38 2 - 20 20 - 200 100 - 10002,3,7,8-Tetrachlorodibenzo-p-dioxin 1746-01-6 29 37.9 0.0012 2653 9.2 32 0.0001 0.001 0.0052,4'-DDD 53-19-0 15 0.0 ND 2723 8.9 24 0.2 - 2.0 2 - 20 10 - 1002,4'-DDE 3424-82-6 15 0.0 ND 2658 8.5 26 0.2 - 2.0 2 - 20 10 - 1002,4'-DDT 789-02-6 15 0.0 ND 2571 7.4 71 0.2 - 2.0 2 - 20 10 - 1002,6-Dimethyl naphthalene 581-42-0 2345 10.7 60 2 - 20 20 - 200 100 - 10002-methylnaphthalene 91-57-6 266 51.9 173 5414 40.0 46 2 - 20 20 - 200 100 - 10004,4'-DDD 72-54-8 151 7.3 1 4090 18.0 9 0.2 - 2.0 2 - 20 10 - 1004,4'-DDE 72-55-9 151 13.9 9 4107 15.2 9 0.2 - 2.0 2 - 20 10 - 1004,4'-DDT 50-29-3 151 2.0 12 4300 12.9 26 0.2 - 2.0 2 - 20 10 - 1004,4'-Dichlorobenzophenone 90-98-2 2 - 20 / 0.3 - 3.0 20 - 200 / 3.0 - 30 100 - 1000 / 15 - 1504-bromophenylphenylether 101-55-3 2 - 20 / 0.3 - 3.0 20 - 200 / 3.0 - 30 100 - 1000 / 15 - 1504-Nonylphenol, branched 84852-15-3 2 - 20 20 - 200 100 - 1000Acenaphthene 83-32-9 270 55.2 283 6147 43.8 62 2 - 20 20 - 200 100 - 1000Acenaphthylene 208-96-8 274 43.8 180 5767 36.7 41 2 - 20 20 - 200 100 - 1000Aldrin 309-00-2 156 10.3 21 5577 26.9 230 0.1 - 1.0 1 - 10 5 - 50Alpha-Benzene Hexachloride 319-84-6 146 11.0 25 0.1 - 1.0 1 - 10 5 - 50Anthracene 120-12-7 273 59.7 484 6675 59.1 140 2 - 20 20 - 200 100 - 1000Antimony 7440-36-0 148 10.8 2800 6697 47.9 1330 200 (MDL) 2000 10000Arsenic 7440-38-2 368 97.0 7600 8167 73.0 8000 22000 220000 1100000Benzo(a)anthracene 56-55-3 256 72.3 1100 6958 69.3 210 2 - 20 20 - 200 100 - 1000Benzo(a)pyrene 50-32-8 271 67.2 1500 7164 70.4 220 2 - 20 20 - 200 100 - 1000Benzo(b)fluoranthene 205-99-2 92 84.8 3000 6571 70.7 340 2 - 20 20 - 200 100 - 1000Benzo(e)pyrene 192-97-2 5554 71.2 270 2 - 20 20 - 200 100 - 1000Benzo(g,h,i)perylene 191-24-2 265 62.3 1400 6563 70.1 310 2 - 20 20 - 200 100 - 1000Benzo(k)fluoranthene 207-08-9 94 75.5 1300 5723 72.7 430 2 - 20 20 - 200 100 - 1000Biphenyl 92-52-4 4902 74.0 450 2 - 20 20 - 200 100 - 1000Bis(2-ethylhexyl) phthalate 117-81-7 226 62.8 1300 6548 72.1 380 2 - 20 20 - 200 100 - 1000Bromoxynil 1689-84-5 1.0 / 3.0 - 30 10 / 30 - 300 50 / 150 - 1500Butyl benzyl phthalate 85-68-7 214 17.8 148 5809 62.6 360 2 - 20 20 - 200 100 - 1000C1-Chrysenes/Benzo(a)anthracene # 2 - 20 20 - 200 100 - 1000C1-dibenz(a,h)anthracene # 2 - 20 20 - 200 100 - 1000C1-fluoranthene/pyrene # 2 - 20 20 - 200 100 - 1000
1 of 4

Table 5. Occurance in Sediments 01/08/2007
SEDQUAL Freshwater (1) SEDQUAL Marine (2) Comparison values (3)
Chemical CASNumber of Samples % Detected
Median of detected
values ppbdw
Number of Samples
% Detected
Median of detected values
ppb dwMDL or
Reference Value 10X 50XC1-fluorenes # 2 - 20 20 - 200 100 - 1000C1-Naphthalenes # 2 - 20 20 - 200 100 - 1000C1-phenanthrene/anthracene # 2 - 20 20 - 200 100 - 1000C2-Chrysenes/Benzo(a)anthracene # 2 - 20 20 - 200 100 - 1000C2-dibenz(a,h)anthracene # 2 - 20 20 - 200 100 - 1000C2-fluorenes # 2 - 20 20 - 200 100 - 1000C2-Naphthalenes # 2 - 20 20 - 200 100 - 1000C2-phenanthrene/anthracene # 2 - 20 20 - 200 100 - 1000C3-Chrysenes/Benzo(a)anthracene # 2 - 20 20 - 200 100 - 1000C3-dibenz(a,h)anthracene # 2 - 20 20 - 200 100 - 1000C3-fluorenes # 2 - 20 20 - 200 100 - 1000C3-Naphthalenes # 2 - 20 20 - 200 100 - 1000C3-phenanthrene/anthracene # 2 - 20 20 - 200 100 - 1000C4-Chrysenes/Benzo(a)anthracene # 2 - 20 20 - 200 100 - 1000C4-Naphthalenes # 2 - 20 20 - 200 100 - 1000C4-phenanthrene/anthracene # 2 - 20 20 - 200 100 - 1000Cadmium 7440-43-9 401 79.8 1500 6587 74.4 500 1500 15000 75000Chlordane 57-74-9 95 0.0 ND 4491 64.3 340 0.1 - 1.0 1 - 10 5 - 50Chlorpyrifos 2921-88-2 3 0.0 ND 3451 76.2 301 2.5 25 125Chromium 7440-47-3 329 92.4 44300 5369 88.0 18154 85000 850000 4250000Chromium IV # 0.1 1 5Chrysene 218-01-9 275 70.5 1300 4319 80.4 274 2 - 20 20 - 200 100 - 1000Copper 7440-50-8 348 100.0 65600 5416 91.0 18000 53000 530000 2650000Dacthal 1861-32-1 0.1 - 1.0 1 - 10 5 - 50Diazinon 333-41-5 3 0.0 ND 2717 79.2 397 2.5 25 125Dibenz(a,h)anthracene 53-70-3 266 43.6 300 4169 60.0 250 2 - 20 20 - 200 100 - 1000Dibenzothiophene 132-65-0 2222 84.1 403 2 - 20 20 - 200 100 - 1000Dicamba 1918-00-9 1894 76.5 570 3.5 35 175Dichlobanil 1194-65-6 1 10 50Dieldrin 60-57-1 156 7.7 18 3636 38.1 380 0.2 - 2.0 2 - 20 10 - 100Dimethyl phthalate 131-11-3 192 16.1 140 3577 35.3 320 2 - 20 20 - 200 100 - 1000Di-n-butyl phthalate 84-74-2 218 17.0 23 3547 39.5 230 2 - 20 20 - 200 100 - 1000Di-n-octyl phthalate 117-84-0 185 18.4 46 3109 27.4 340 2 - 20 20 - 200 100 - 1000Diuron 330-54-1 3 30 150Endosulfan 115-29-7 5 40.0 0.2 1517 24.7 1600 0.1 - 1.0 1 - 10 5 - 50Endosulfan sulfate 1031-07-8 146 6.2 94 1629 13.1 3900 0.2 - 2.0 2 - 20 10 - 100Endrin 72-20-8 150 6.0 54 1477 7.4 1340 0.2 - 2.0 2 - 20 10 - 100Ethion 563-12-2 3 0.0 ND 406 12.6 34400 2.5 25 125Ethoxylated nonylphenol phosphate 51811-79-1 3 - 30 30 - 300 150 - 1500Ethylbenzene 100-41-4 141 10.6 2 1379 5.1 8 0.5 - 3.2 5 - 32 25 - 160Fenitrothion 122-14-5 2.5 25 125Fluoranthene 206-44-0 280 76.1 2080 1955 72.1 141 2 - 20 20 - 200 100 - 1000Fluorene 86-73-7 272 54.4 330 2116 43.0 32 2 - 20 20 - 200 100 - 1000
2 of 4

Table 5. Occurance in Sediments 01/08/2007
SEDQUAL Freshwater (1) SEDQUAL Marine (2) Comparison values (3)
Chemical CASNumber of Samples % Detected
Median of detected
values ppbdw
Number of Samples
% Detected
Median of detected values
ppb dwMDL or
Reference Value 10X 50Xgamma-BHC 58-89-9 157 8.3 19 2450 12.0 15 0.1 - 1.0 1 - 10 5 - 50Guthion 86-50-0 3 0.0 ND 455 32.3 9650 2.5 25 125Heptachlor 76-44-8 151 5.3 24 2593 9.8 19 0.1 - 1.0 1 - 10 5 - 50Heptachlor epoxide 1024-57-3 156 3.8 80 1235 10.6 110 0.2 - 2.0 2 - 20 10 - 100Heptachloronaphthalene 32241-08-0 3 - 30 / 0.5 - 5.0 30 - 300 / 5.0 - 50 150 - 1500 / 25 - 250Hexachlorobenzene 118-74-1 163 0.0 ND 2891 14.6 11 0.1 - 1.0 / 2 - 20 1 - 10 / 20 - 200 5 - 50 / 100 - 1000Hexachlorobutadiene 87-68-3 168 0.6 2 2849 10.4 35 2 -20 / 0.1 - 1.0 20 - 200 / 1.0 - 10 100 - 1000 / 5.0 - 50Hexachloroethane 67-72-1 161 0.6 730 2417 8.1 200 2 - 20 20 - 200 100 - 1000Hexachloronaphthalene 1335-87-1 3 - 30 / 0.5 - 5.0 30 - 300 / 5.0 - 50 150 - 1500 / 25 - 250Indeno(1,2,3-c,d)pyrene 193-39-5 269 63.6 1200 2791 40.6 111 2 - 20 20 - 200 100 - 1000Kelthane 115-32-2 15 0.0 ND 1.0 - 10 10 - 100 50 - 500Lead 7439-92-1 403 95.0 95000 4137 71.7 20000 20000 200000 1000000Mercury 7439-97-6 372 82.0 200 3931 63.4 173 150 1500 7500Methoxychlor 72-43-5 132 0.8 0.2 2850 42.7 23850 1.0 - 10 10 - 100 50 - 500Methyl parathion 298-00-0 18 0.0 ND 1715 52.7 410 2.5 25 125Methyltin trichloride 993-16-8 6 60 300Mirex 2385-85-5 5 0.0 ND 1219 51.8 576 0.1 - 1.0 1 - 10 5 - 50Naphthalene 91-20-3 282 52.5 510 2592 41.6 88 2 - 20 20 - 200 100 - 1000Nickel 7440-02-0 274 98.2 37000 2199 82.8 23413 42000 420000 2100000N-nitroso diphenylamine 86-30-6 171 2.9 10 2130 12.5 360 2 - 20 20 - 200 100 - 1000Nonylphenol 25154-52-3 2 - 20 20 - 200 100 - 1000Octachloronaphthalene 2234-13-1 3 - 30 / 0.5 - 5.0 30 - 300 / 5.0 - 50 150 - 1500 / 25 - 250Oxadiazon 19666-30-9 2.0 - 10 20 - 100 100 - 500Parathion 56-38-2 3 0.0 ND 408 30.9 860 2.5 25 125pentabromodiphenyl ether 32534-81-9 2 - 20 / 0.3 - 3.0 20 - 200 / 3.0 - 30 100 - 1000 / 15 - 150Pentachloroanisole 1825-21-4 2 0.0 ND 2 - 20 / 0.1 - 1.0 20 - 200 / 1.0 - 10 100 - 1000 / 5.0 - 50Pentachloronaphthalene 1321-64-8 3 - 30 / 0.5 - 5.0 30 - 300 / 5.0 - 50 150 - 1500 / 25 - 250Pentachlorophenol 87-86-5 189 15.9 35 1808 14.2 44 10 - 60 / 1.0 - 10 100 - 600 / 10 - 100 500 - 3000 / 50 - 500Perylene 198-55-0 299 69.9 26 2 - 20 20 - 200 100 - 1000Phenanthrene 85-01-8 279 70.3 1200 1561 68.7 89 2 - 20 20 - 200 100 - 1000Phenol 108-95-2 157 21.7 53 2097 30.3 42 2 - 20 20 - 200 100 - 1000Polybrominated terphenyls # 4 40 200Polychlorinated alkenes # 5 - 50 / 1.0 - 10 50 - 500 / 10 - 100 250 - 2500 / 50 - 500Polychlorinated Biphenyls 1336-36-3 250 24.8 310 2420 49.3 136 2.0 - 20 20 - 200 100 - 1000Polychlorinated Terphenyls 61788-33-8 4 40 200Polychlorodibenzodioxins # 453 26.9 252 0.0001 - 0.001 0.001 - 0.01 0.005 - 0.05Polychlorodibenzofurans # 304 29.3 100 0.0001 - 0.001 0.001 - 0.01 0.005 - 0.05Pronamide 23950-58-5 1.0 - 10 10 - 100 50 - 500Pyrene 129-00-0 278 76.3 2200 1591 77.3 170 2 - 20 20 - 200 100 - 1000Selenium 7782-49-2 170 24.7 680 1264 22.2 700 200 (MDL) 2000 10000Silver 7440-22-4 199 46.7 1000 1944 50.7 530 320 3200 16000Tetrachloroethene 127-18-4 110 1.8 10 918 10.9 107 0.5 - 3.2 5 - 32 25 - 160Tetrachloronaphthalene 1335-88-2 3 - 30 / 0.5 - 5.0 30 - 300 / 5.0 - 50 150 - 1500 / 25 - 250
3 of 4
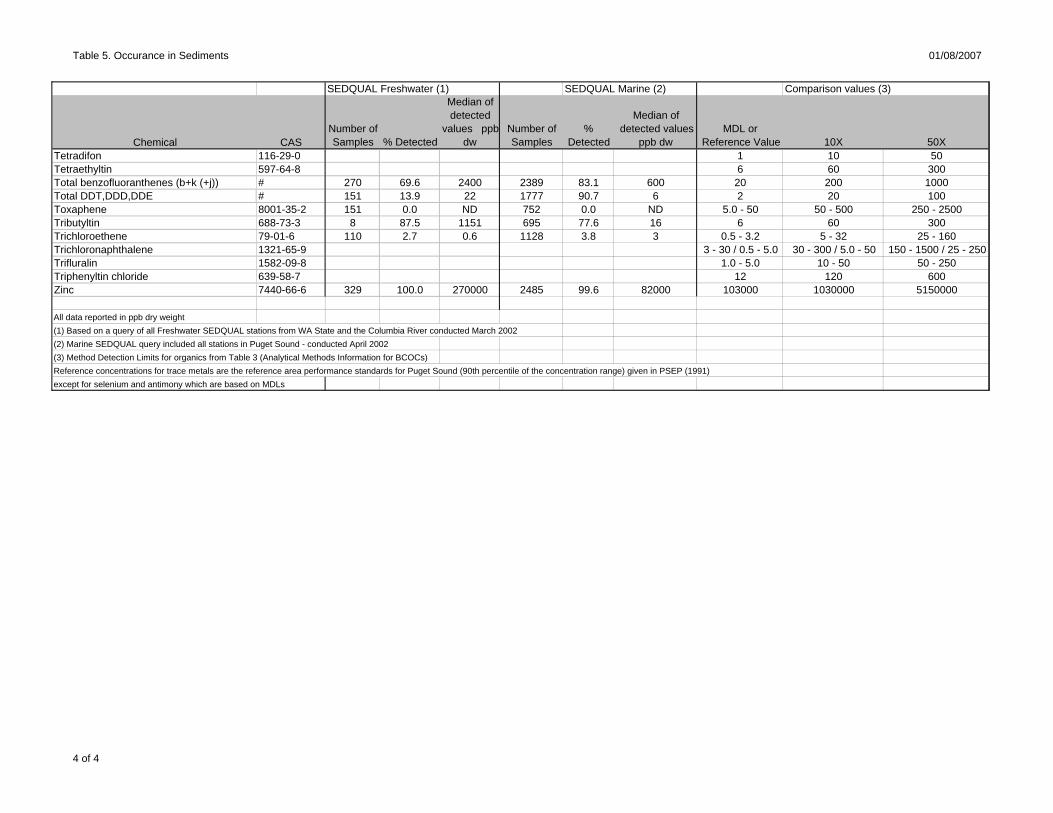
Table 5. Occurance in Sediments 01/08/2007
SEDQUAL Freshwater (1) SEDQUAL Marine (2) Comparison values (3)
Chemical CASNumber of Samples % Detected
Median of detected
values ppbdw
Number of Samples
% Detected
Median of detected values
ppb dwMDL or
Reference Value 10X 50XTetradifon 116-29-0 1 10 50Tetraethyltin 597-64-8 6 60 300Total benzofluoranthenes (b+k (+j)) # 270 69.6 2400 2389 83.1 600 20 200 1000Total DDT,DDD,DDE # 151 13.9 22 1777 90.7 6 2 20 100Toxaphene 8001-35-2 151 0.0 ND 752 0.0 ND 5.0 - 50 50 - 500 250 - 2500Tributyltin 688-73-3 8 87.5 1151 695 77.6 16 6 60 300Trichloroethene 79-01-6 110 2.7 0.6 1128 3.8 3 0.5 - 3.2 5 - 32 25 - 160Trichloronaphthalene 1321-65-9 3 - 30 / 0.5 - 5.0 30 - 300 / 5.0 - 50 150 - 1500 / 25 - 250Trifluralin 1582-09-8 1.0 - 5.0 10 - 50 50 - 250Triphenyltin chloride 639-58-7 12 120 600Zinc 7440-66-6 329 100.0 270000 2485 99.6 82000 103000 1030000 5150000
All data reported in ppb dry weight(1) Based on a query of all Freshwater SEDQUAL stations from WA State and the Columbia River conducted March 2002 (2) Marine SEDQUAL query included all stations in Puget Sound - conducted April 2002(3) Method Detection Limits for organics from Table 3 (Analytical Methods Information for BCOCs)Reference concentrations for trace metals are the reference area performance standards for Puget Sound (90th percentile of the concentration range) given in PSEP (1991) except for selenium and antimony which are based on MDLs
4 of 4

Table 6. Tissue Data 01/08/2007
SEDQUAL (1) PSAMP (2)
Chemical CASNumber of Samples
% Detected
Minimum Detected Values
(ppb) wet
Maximum Detected Values
(ppb) wet
95th%ile (or max)
of detected
data (ppb) wet
Chemical Qualifier
95th%ile (or max)
of ND data (ppb)
wet (3)Chemical Qualifier
Number of
Samples%
Detected
Minimum Detected Values
(ppb) wet
Maximum Detected Values
(ppb) wet
95th %ile of detected data (ppb)
wet Chemical Qualifier 1,2,3,4-Tetrachlorobenzene 634-66-21,2,3,5-Tetrachlorobenzene 634-90-21,2,3-Trichlorobenzene 87-61-61,2,4,5-Tetrachlorobenzene 95-94-31,2,4-Trichlorobenzene 120-82-1 178 0.0 ND ND 3200 U 173 01,2-Dichlorobenzene 95-50-1 189 0.0 ND ND 3100 U 173 01,3,5-Trichlorobenzene 108-70-31,3-Dichlorobenzene 541-73-1 189 0.0 ND ND 3100 U 173 01,4-Dichlorobenzene 106-46-7 189 0.0 ND ND 3100 U 173 01-methylnaphthalene 90-12-0 4 0.0 ND ND 82 U1-methylphenanthrene 832-69-92,3,7,8-Tetrachlorodibenzo-p-dioxin 1746-01-6 45 46.7 0.00027 0.026 0.0029 NE2,4'-DDD 53-19-0 191 3.1 0.71 9.8 9.6 90th - liver2,4'-DDE 3424-82-62,4'-DDT 789-02-6 127 2.3 2.5 37 37.0 max - liver2,6-Dimethyl naphthalene 581-42-02-methylnaphthalene 91-57-6 195 1.0 0.8 1 1 E 171 04,4'-DDD 72-54-8 374 0.3 16 16 16 562 24.7 1.6 157 84.5 liver4,4'-DDE 72-55-9 461 26.5 0.6 410 19 515 67.3 7.6 250 169.0 liver4,4'-DDT 50-29-3 442 15.4 0.1 69.9 45.3 503 4.9 1.2 24 23.4 liver4,4'-Dichlorobenzophenone 90-98-24-bromophenylphenylether 101-55-3 105 04-Nonylphenol 84852-15-3Acenaphthene 83-32-9 197 0.5 16 16 16 176 1.7 60 160 160.0 max - liverAcenaphthylene 208-96-8 197 0.0 ND ND 3100 U 173 0Aldrin 309-00-2 452 4.6 0.3 5.7 1.4 E 298 0Alpha-Benzene Hexachloride (BHC) 319-84-6 331 3 0.9 2.4 2.2 90th -whole bodyAnthracene 120-12-7 195 0.5 160 160 160 173 0Antimony 7440-36-0 235 17.0 24 2200 1200Arsenic 7440-38-2 458 98.3 160 32000 15900 297 100 200 60200 26850.0 liverBenzo(a)anthracene 56-55-3 194 2.1 7 220 17 ZE 173 0Benzo(a)pyrene 50-32-8 203 2.0 8.7 190 28 ZE 173 0Benzo(b)fluoranthene 205-99-2 137 2.2 4 400 4 E 173 0Benzo(e)pyrene 192-97-2Benzo(g,h,i)perylene 191-24-2 203 0.0 ND ND 3000 U 173 0Benzo(k)fluoranthene 207-08-9 137 0.7 20 20 20 E 173 0Biphenyl 92-52-4Bis(2-ethylhexyl) phthalate 117-81-7 176 5.7 8.7 5700 3000 159 32.1 20 3683 1862.0 muscleBromoxynil 1689-84-5Butyl benzyl phthalate 85-68-7 187 0.0 ND ND 3000 U 173 0.6 220 220 220.0 max - muscleC1-Chrysenes/Benzo(a)anthracene #C1-dibenz(a,h)anthracene #C1-fluoranthene/pyrene #C1-fluorenes #C1-Naphthalenes #
1 of 4

Table 6. Tissue Data 01/08/2007
Chemical CASNumber of Samples
% Detected
Minimum Detected Values
(ppb) wet
Maximum Detected Values
(ppb) wet
95th%ile (or max)
of detected
data (ppb) wet
Chemical Qualifier
95th%ile (or max)
of ND data (ppb)
wet (3)Chemical Qualifier
Number of
Samples%
Detected
Minimum Detected Values
(ppb) wet
Maximum Detected Values
(ppb) wet
95th %ile of detected data (ppb)
wet Chemical Qualifier C1-phenanthrene/anthracene #C2-Chrysenes/Benzo(a)anthracene #C2-dibenz(a,h)anthracene #C2-fluorenes #C2-Naphthalenes #C2-phenanthrene/anthracene #C3-Chrysenes/Benzo(a)anthracene #C3-dibenz(a,h)anthracene #C3-fluorenes #C3-Naphthalenes #C3-phenanthrene/anthracene #C4-Chrysenes/Benzo(a)anthracene #C4-Naphthalenes #C4-phenanthrene/anthracene #Cadmium 7440-43-9 447 68.7 1 2900 1500Chlordane 57-74-9 204 0.0 ND ND 50 U 305 17 12.8 104.5 101.7 liverChlorpyrifos 2921-88-2 24 0.0 ND ND 9 UE **Chromium 7440-47-3 241 56.4 50 43100 1500Chromium IV #Chrysene 218-01-9 206 1.9 8 400 30 E 173 0Copper 7440-50-8 451 82.9 100 30200 8700 294 100 2600 25400 12425.0 liverDacthal 1861-32-1Diazinon 333-41-5 37 0.0 ND ND 12 U **Dibenz(a,h)anthracene 53-70-3 203 0.0 ND ND 3000 U 132 0Dibenzothiophene 132-65-0Dicamba 1918-00-9Dichlobenil 1194-65-6Dieldrin 60-57-1 452 5.3 0.2 6 3 298 0.67 0.39 0.61 0.6 max - muscleDimethyl phthalate 131-11-3 178 0.0 ND ND 3200 U 173 0Di-n-butyl phthalate 84-74-2 176 2.3 530 5600 4400 133 5.26 20 90 88.0 90th - muscleDi-n-octyl phthalate 117-84-0 184 0.5 460 460 460 BE - max 173 0Diuron 330-54-1Endosulfan 115-29-7 8 0.0 ND ND 2 U 298 0Endosulfan sulfate 1031-07-8 217 0.9 2.5 3.6 3.6 E -max 298 0Endrin 72-20-8 350 0.6 0.8 1.8 1.8 E - max 298 0Ethion 563-12-2 24 0.0 ND ND 25 U **Ethoxylated nonylphenol phosphate 51811-79-1Ethylbenzene 100-41-4 20 0.0 ND ND 100 U **Fenitrothion 122-14-5Fluoranthene 206-44-0 264 29.9 0.5 740 358.3 173 0Fluorene 86-73-7 197 0.0 ND ND 3100 U 174 0.57 130 130 130.0 maxGamma-Benzene Hexachloride 58-89-9 452 1.8 0.2 2.3 1.5 E 307 0Guthion 86-50-0 37 0.0 ND ND 667 U **Heptachlor 76-44-8 432 3.5 0.5 7.5 3.4 E 307 0Heptachlor epoxide 1024-57-3 217 0.0 ND ND 100 U 322 0Heptachloronaphthalene 32241-08-0
2 of 4
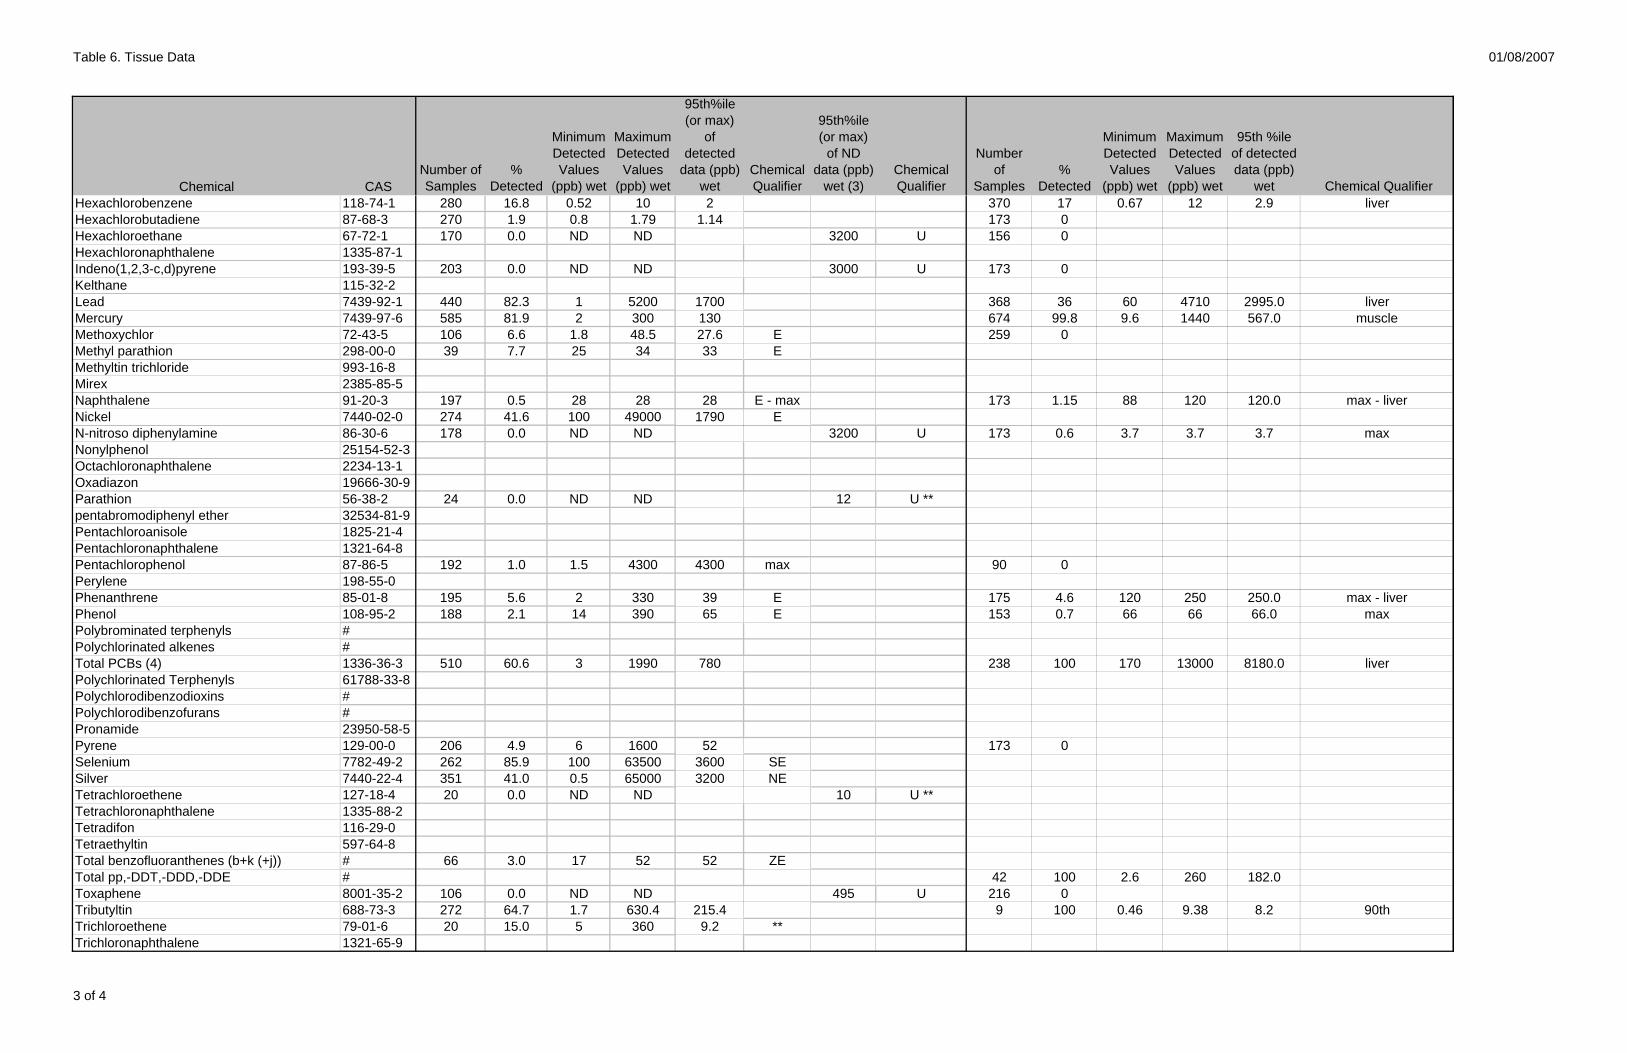
Table 6. Tissue Data 01/08/2007
Chemical CASNumber of Samples
% Detected
Minimum Detected Values
(ppb) wet
Maximum Detected Values
(ppb) wet
95th%ile (or max)
of detected
data (ppb) wet
Chemical Qualifier
95th%ile (or max)
of ND data (ppb)
wet (3)Chemical Qualifier
Number of
Samples%
Detected
Minimum Detected Values
(ppb) wet
Maximum Detected Values
(ppb) wet
95th %ile of detected data (ppb)
wet Chemical Qualifier Hexachlorobenzene 118-74-1 280 16.8 0.52 10 2 370 17 0.67 12 2.9 liverHexachlorobutadiene 87-68-3 270 1.9 0.8 1.79 1.14 173 0Hexachloroethane 67-72-1 170 0.0 ND ND 3200 U 156 0Hexachloronaphthalene 1335-87-1Indeno(1,2,3-c,d)pyrene 193-39-5 203 0.0 ND ND 3000 U 173 0Kelthane 115-32-2Lead 7439-92-1 440 82.3 1 5200 1700 368 36 60 4710 2995.0 liverMercury 7439-97-6 585 81.9 2 300 130 674 99.8 9.6 1440 567.0 muscleMethoxychlor 72-43-5 106 6.6 1.8 48.5 27.6 E 259 0Methyl parathion 298-00-0 39 7.7 25 34 33 EMethyltin trichloride 993-16-8Mirex 2385-85-5Naphthalene 91-20-3 197 0.5 28 28 28 E - max 173 1.15 88 120 120.0 max - liverNickel 7440-02-0 274 41.6 100 49000 1790 EN-nitroso diphenylamine 86-30-6 178 0.0 ND ND 3200 U 173 0.6 3.7 3.7 3.7 maxNonylphenol 25154-52-3Octachloronaphthalene 2234-13-1Oxadiazon 19666-30-9Parathion 56-38-2 24 0.0 ND ND 12 U **pentabromodiphenyl ether 32534-81-9Pentachloroanisole 1825-21-4Pentachloronaphthalene 1321-64-8Pentachlorophenol 87-86-5 192 1.0 1.5 4300 4300 max 90 0Perylene 198-55-0Phenanthrene 85-01-8 195 5.6 2 330 39 E 175 4.6 120 250 250.0 max - liverPhenol 108-95-2 188 2.1 14 390 65 E 153 0.7 66 66 66.0 maxPolybrominated terphenyls #Polychlorinated alkenes #Total PCBs (4) 1336-36-3 510 60.6 3 1990 780 238 100 170 13000 8180.0 liverPolychlorinated Terphenyls 61788-33-8Polychlorodibenzodioxins #Polychlorodibenzofurans #Pronamide 23950-58-5Pyrene 129-00-0 206 4.9 6 1600 52 173 0Selenium 7782-49-2 262 85.9 100 63500 3600 SESilver 7440-22-4 351 41.0 0.5 65000 3200 NETetrachloroethene 127-18-4 20 0.0 ND ND 10 U **Tetrachloronaphthalene 1335-88-2Tetradifon 116-29-0Tetraethyltin 597-64-8Total benzofluoranthenes (b+k (+j)) # 66 3.0 17 52 52 ZETotal pp,-DDT,-DDD,-DDE # 42 100 2.6 260 182.0Toxaphene 8001-35-2 106 0.0 ND ND 495 U 216 0Tributyltin 688-73-3 272 64.7 1.7 630.4 215.4 9 100 0.46 9.38 8.2 90thTrichloroethene 79-01-6 20 15.0 5 360 9.2 **Trichloronaphthalene 1321-65-9
3 of 4

Table 6. Tissue Data 01/08/2007
Chemical CASNumber of Samples
% Detected
Minimum Detected Values
(ppb) wet
Maximum Detected Values
(ppb) wet
95th%ile (or max)
of detected
data (ppb) wet
Chemical Qualifier
95th%ile (or max)
of ND data (ppb)
wet (3)Chemical Qualifier
Number of
Samples%
Detected
Minimum Detected Values
(ppb) wet
Maximum Detected Values
(ppb) wet
95th %ile of detected data (ppb)
wet Chemical Qualifier Trifluralin 1582-09-8Triphenyltin chloride 639-58-7Zinc 7440-66-6 435 95.2 1700 110000 44000
(1) Based on a 3/2002 analysis of all non-PSAMP fish tissue data from Sedqual.SEDQUAL chemical qualifier codes are as follows:E = estimated value; Z = blank corrected; value still above detection limit; S = Value estimated from nearby stations; U = undetected; N = Estimate based on presumptive evidence; M = Value is a mean** = data did not meet minimum tissue data requirements established by DMMP for this exercise. ND = not detected(2) Based on 10/2001 analysis of PSAMP Fish Component data limited to flatfish (English sole, starry flounder), rockfish (copper, quillback and brown), and Pacific herring. Only stations classified by PSAMP as Urban or Near urban were used. Summary stats were computed using only samples that had detected concentrations. All non-detects with MDL> 50 ppb were excluded from these summaries.(3) 95th %ile of nondetected data only calculated when all data are non-detect(4) SEDQUAL PCB data is total Aroclors; PSAMP PCB data is total PCBs estimated using HPLC/PDA method
4 of 4
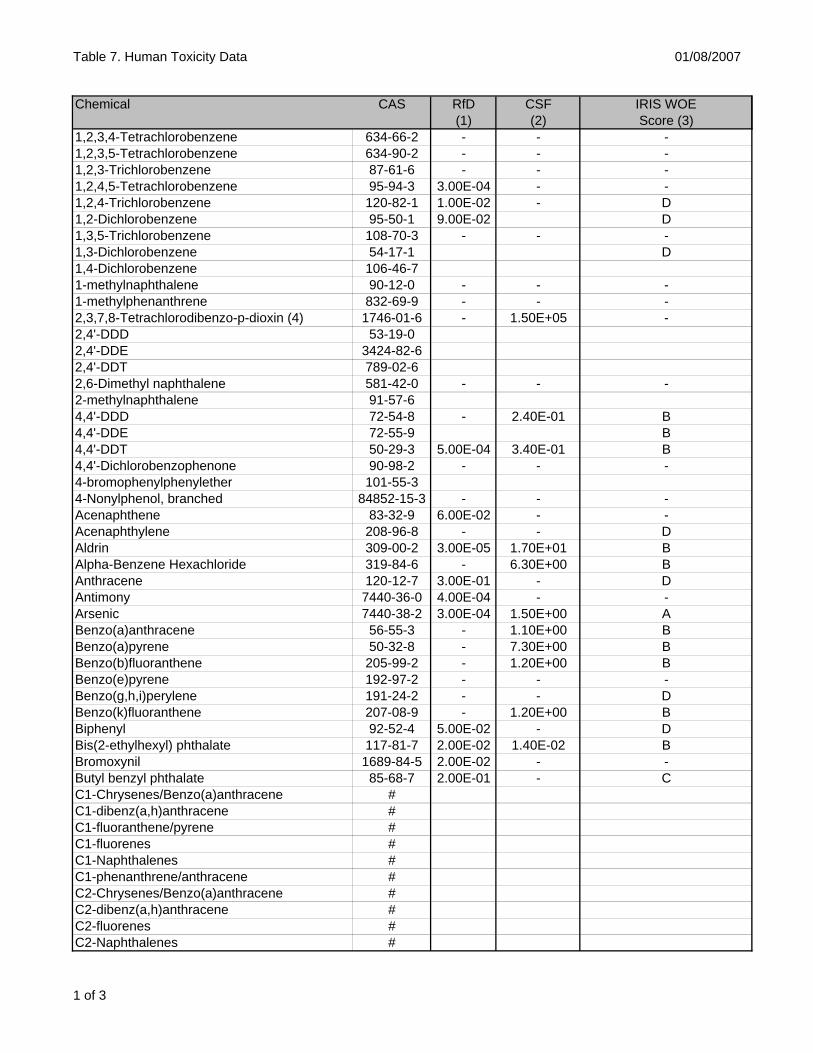
Table 7. Human Toxicity Data 01/08/2007
Chemical CAS RfD CSF IRIS WOE(1) (2) Score (3)
1,2,3,4-Tetrachlorobenzene 634-66-2 - - -1,2,3,5-Tetrachlorobenzene 634-90-2 - - -1,2,3-Trichlorobenzene 87-61-6 - - -1,2,4,5-Tetrachlorobenzene 95-94-3 3.00E-04 - -1,2,4-Trichlorobenzene 120-82-1 1.00E-02 - D1,2-Dichlorobenzene 95-50-1 9.00E-02 D1,3,5-Trichlorobenzene 108-70-3 - - -1,3-Dichlorobenzene 54-17-1 D1,4-Dichlorobenzene 106-46-71-methylnaphthalene 90-12-0 - - -1-methylphenanthrene 832-69-9 - - -2,3,7,8-Tetrachlorodibenzo-p-dioxin (4) 1746-01-6 - 1.50E+05 -2,4'-DDD 53-19-02,4'-DDE 3424-82-62,4'-DDT 789-02-62,6-Dimethyl naphthalene 581-42-0 - - -2-methylnaphthalene 91-57-64,4'-DDD 72-54-8 - 2.40E-01 B4,4'-DDE 72-55-9 B4,4'-DDT 50-29-3 5.00E-04 3.40E-01 B4,4'-Dichlorobenzophenone 90-98-2 - - -4-bromophenylphenylether 101-55-34-Nonylphenol, branched 84852-15-3 - - -Acenaphthene 83-32-9 6.00E-02 - -Acenaphthylene 208-96-8 - - DAldrin 309-00-2 3.00E-05 1.70E+01 BAlpha-Benzene Hexachloride 319-84-6 - 6.30E+00 BAnthracene 120-12-7 3.00E-01 - DAntimony 7440-36-0 4.00E-04 - -Arsenic 7440-38-2 3.00E-04 1.50E+00 ABenzo(a)anthracene 56-55-3 - 1.10E+00 BBenzo(a)pyrene 50-32-8 - 7.30E+00 BBenzo(b)fluoranthene 205-99-2 - 1.20E+00 BBenzo(e)pyrene 192-97-2 - - -Benzo(g,h,i)perylene 191-24-2 - - DBenzo(k)fluoranthene 207-08-9 - 1.20E+00 BBiphenyl 92-52-4 5.00E-02 - DBis(2-ethylhexyl) phthalate 117-81-7 2.00E-02 1.40E-02 BBromoxynil 1689-84-5 2.00E-02 - -Butyl benzyl phthalate 85-68-7 2.00E-01 - CC1-Chrysenes/Benzo(a)anthracene #C1-dibenz(a,h)anthracene #C1-fluoranthene/pyrene #C1-fluorenes #C1-Naphthalenes #C1-phenanthrene/anthracene #C2-Chrysenes/Benzo(a)anthracene #C2-dibenz(a,h)anthracene #C2-fluorenes #C2-Naphthalenes #
1 of 3

Table 7. Human Toxicity Data 01/08/2007
Chemical CAS RfD CSF IRIS WOE(1) (2) Score (3)
C2-phenanthrene/anthracene #C3-Chrysenes/Benzo(a)anthracene #C3-dibenz(a,h)anthracene #C3-fluorenes #C3-Naphthalenes #C3-phenanthrene/anthracene #C4-Chrysenes/Benzo(a)anthracene #C4-Naphthalenes #C4-phenanthrene/anthracene #Cadmium 7440-43-9 1.00 E-03 - BChlordane 57-74-9 6.00E-05 1.30E+00 BChlorpyrifos 2921-88-2 3.00E-03 - -Chromium 7440-47-3 - - -Chromium IV # 3.00E-03 - DChrysene 218-01-9 - 3.20E-02 BCopper 7440-50-8 - - -Dacthal 1861-32-1 1.00E-02 - -Diazinon 333-41-5 9.00E-04 - -Dibenz(a,h)anthracene 53-70-3 - 8.10E+00 BDibenzothiophene 132-65-0 - - -Dicamba 1918-00-9 3.00E-02Dichlobenil 1194-65-6 5.00E-04 - -Dieldrin 60-57-1 5.00E-05 1.60E+01 BDimethyl phthalate 131-11-3 - - DDi-n-butyl phthalate 84-74-2 1.00E-01 - DDi-n-octyl phthalate 117-84-0 2.00E-02 - -Diuron 330-54-1 2.00E-03Endosulfan 115-29-7 6.00E-03 - -Endosulfan sulfate 1031-07-8 - - -Endrin 72-20-8 3.00E-04 DEthion 563-12-2 5.00E-04 - -Ethoxylated nonylphenol phosphate 51811-79-1 - - -Ethylbenzene 100-41-4 1.00E-01 - DFenitrothion 122-14-5 - - -Fluoranthene 206-44-0 4.00E-02 - DFluorene 86-73-7 4.00E-02 - Dgamma-BHC /gamma-Hexachlorocyclohexane 58-89-9 3.00E-04 1.30E+00 -Guthion 86-50-0 - - -Heptachlor 76-44-8 5.00E-04 4.50E+00 BHeptachlor epoxide 1024-57-3 1.30E-05 9.10E+00 BHeptachloronaphthalene 32241-08-0 - - -Hexachlorobenzene 118-74-1 8.00E-04 1.60E+00 BHexachlorobutadiene 87-68-3 2.00E-04 7.80E-02 CHexachloroethane 67-72-1 1.00E-03 1.40E-02 CHexachloronaphthalene 1335-87-1 - - -Indeno(1,2,3-c,d)pyrene 193-39-5 - 4.00E-01 BKelthane 115-32-2 - -Lead 7439-92-1 - - -Mercury 7439-97-6 - - DMethoxychlor 72-43-5 5.00E-03 - D
2 of 3
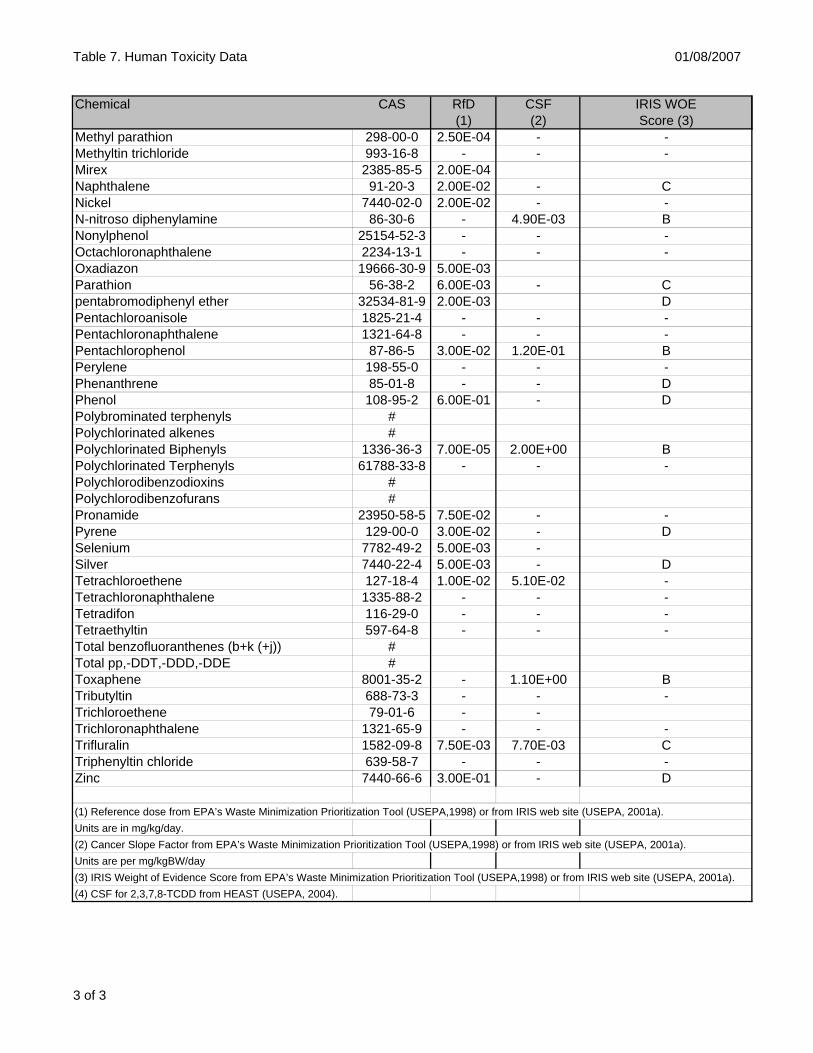
Table 7. Human Toxicity Data 01/08/2007
Chemical CAS RfD CSF IRIS WOE(1) (2) Score (3)
Methyl parathion 298-00-0 2.50E-04 - -Methyltin trichloride 993-16-8 - - -Mirex 2385-85-5 2.00E-04Naphthalene 91-20-3 2.00E-02 - CNickel 7440-02-0 2.00E-02 - -N-nitroso diphenylamine 86-30-6 - 4.90E-03 BNonylphenol 25154-52-3 - - -Octachloronaphthalene 2234-13-1 - - -Oxadiazon 19666-30-9 5.00E-03Parathion 56-38-2 6.00E-03 - Cpentabromodiphenyl ether 32534-81-9 2.00E-03 DPentachloroanisole 1825-21-4 - - -Pentachloronaphthalene 1321-64-8 - - -Pentachlorophenol 87-86-5 3.00E-02 1.20E-01 BPerylene 198-55-0 - - -Phenanthrene 85-01-8 - - DPhenol 108-95-2 6.00E-01 - DPolybrominated terphenyls #Polychlorinated alkenes #Polychlorinated Biphenyls 1336-36-3 7.00E-05 2.00E+00 BPolychlorinated Terphenyls 61788-33-8 - - -Polychlorodibenzodioxins #Polychlorodibenzofurans #Pronamide 23950-58-5 7.50E-02 - -Pyrene 129-00-0 3.00E-02 - DSelenium 7782-49-2 5.00E-03 -Silver 7440-22-4 5.00E-03 - DTetrachloroethene 127-18-4 1.00E-02 5.10E-02 -Tetrachloronaphthalene 1335-88-2 - - -Tetradifon 116-29-0 - - -Tetraethyltin 597-64-8 - - -Total benzofluoranthenes (b+k (+j)) #Total pp,-DDT,-DDD,-DDE #Toxaphene 8001-35-2 - 1.10E+00 BTributyltin 688-73-3 - - -Trichloroethene 79-01-6 - -Trichloronaphthalene 1321-65-9 - - -Trifluralin 1582-09-8 7.50E-03 7.70E-03 CTriphenyltin chloride 639-58-7 - - -Zinc 7440-66-6 3.00E-01 - D
(1) Reference dose from EPA’s Waste Minimization Prioritization Tool (USEPA,1998) or from IRIS web site (USEPA, 2001a). Units are in mg/kg/day.(2) Cancer Slope Factor from EPA’s Waste Minimization Prioritization Tool (USEPA,1998) or from IRIS web site (USEPA, 2001a). Units are per mg/kgBW/day(3) IRIS Weight of Evidence Score from EPA’s Waste Minimization Prioritization Tool (USEPA,1998) or from IRIS web site (USEPA, 2001a).(4) CSF for 2,3,7,8-TCDD from HEAST (USEPA, 2004).
3 of 3
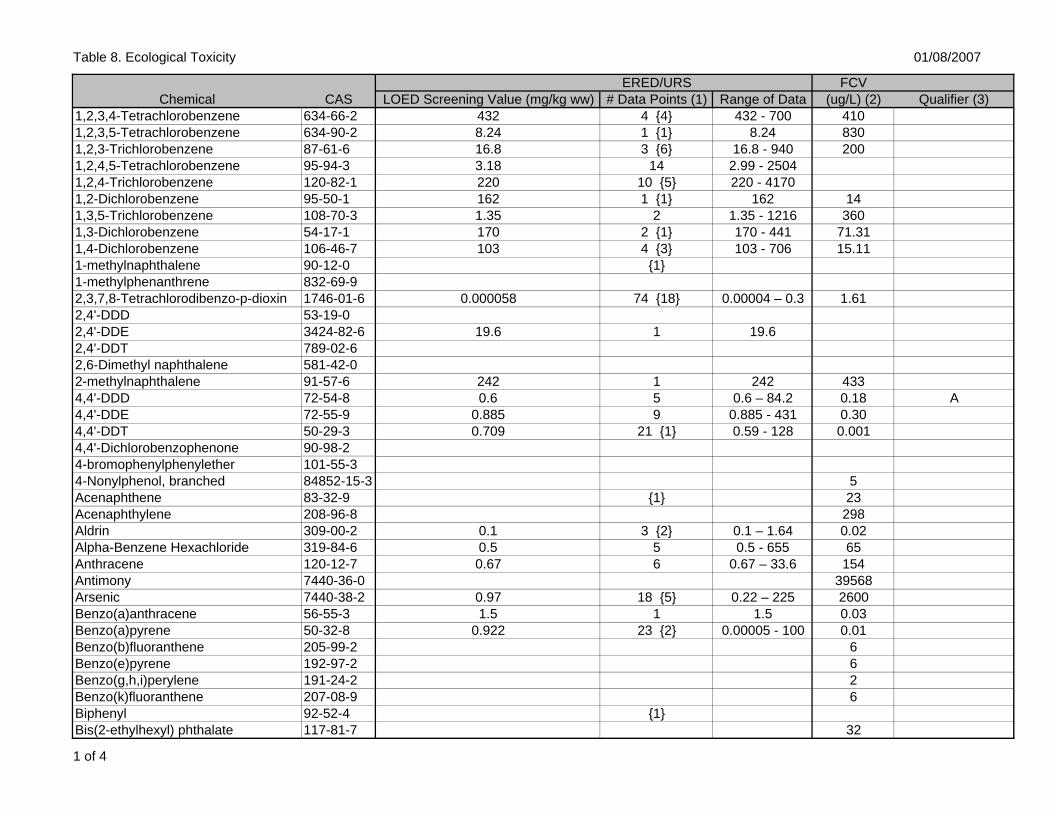
Table 8. Ecological Toxicity 01/08/2007
ERED/URS FCVChemical CAS LOED Screening Value (mg/kg ww) # Data Points (1) Range of Data (ug/L) (2) Qualifier (3)
1,2,3,4-Tetrachlorobenzene 634-66-2 432 4 {4} 432 - 700 4101,2,3,5-Tetrachlorobenzene 634-90-2 8.24 1 {1} 8.24 8301,2,3-Trichlorobenzene 87-61-6 16.8 3 {6} 16.8 - 940 2001,2,4,5-Tetrachlorobenzene 95-94-3 3.18 14 2.99 - 25041,2,4-Trichlorobenzene 120-82-1 220 10 {5} 220 - 41701,2-Dichlorobenzene 95-50-1 162 1 {1} 162 141,3,5-Trichlorobenzene 108-70-3 1.35 2 1.35 - 1216 3601,3-Dichlorobenzene 54-17-1 170 2 {1} 170 - 441 71.311,4-Dichlorobenzene 106-46-7 103 4 {3} 103 - 706 15.111-methylnaphthalene 90-12-0 {1}1-methylphenanthrene 832-69-92,3,7,8-Tetrachlorodibenzo-p-dioxin 1746-01-6 0.000058 74 {18} 0.00004 – 0.3 1.612,4'-DDD 53-19-02,4'-DDE 3424-82-6 19.6 1 19.62,4'-DDT 789-02-62,6-Dimethyl naphthalene 581-42-02-methylnaphthalene 91-57-6 242 1 242 4334,4'-DDD 72-54-8 0.6 5 0.6 – 84.2 0.18 A4,4'-DDE 72-55-9 0.885 9 0.885 - 431 0.304,4'-DDT 50-29-3 0.709 21 {1} 0.59 - 128 0.0014,4'-Dichlorobenzophenone 90-98-24-bromophenylphenylether 101-55-34-Nonylphenol, branched 84852-15-3 5Acenaphthene 83-32-9 {1} 23Acenaphthylene 208-96-8 298Aldrin 309-00-2 0.1 3 {2} 0.1 – 1.64 0.02Alpha-Benzene Hexachloride 319-84-6 0.5 5 0.5 - 655 65Anthracene 120-12-7 0.67 6 0.67 – 33.6 154Antimony 7440-36-0 39568Arsenic 7440-38-2 0.97 18 {5} 0.22 – 225 2600Benzo(a)anthracene 56-55-3 1.5 1 1.5 0.03Benzo(a)pyrene 50-32-8 0.922 23 {2} 0.00005 - 100 0.01Benzo(b)fluoranthene 205-99-2 6Benzo(e)pyrene 192-97-2 6Benzo(g,h,i)perylene 191-24-2 2Benzo(k)fluoranthene 207-08-9 6Biphenyl 92-52-4 {1}Bis(2-ethylhexyl) phthalate 117-81-7 32
1 of 4

Table 8. Ecological Toxicity 01/08/2007
ERED/URS FCVChemical CAS LOED Screening Value (mg/kg ww) # Data Points (1) Range of Data (ug/L) (2) Qualifier (3)
Bromoxynil 1689-84-5 67Butyl benzyl phthalate 85-68-7 19C1-Chrysenes/Benzo(a)anthracene #C1-dibenz(a,h)anthracene #C1-fluoranthene/pyrene #C1-fluorenes #C1-Naphthalenes #C1-phenanthrene/anthracene #C2-Chrysenes/Benzo(a)anthracene #C2-dibenz(a,h)anthracene #C2-fluorenes #C2-Naphthalenes #C2-phenanthrene/anthracene #C3-Chrysenes/Benzo(a)anthracene #C3-dibenz(a,h)anthracene #C3-fluorenes #C3-Naphthalenes #C3-phenanthrene/anthracene #C4-Chrysenes/Benzo(a)anthracene #C4-Naphthalenes #C4-phenanthrene/anthracene #Cadmium 7440-43-9 0.118 129 {13} 0.005 – 50400 1.43Chlordane 57-74-9 0.02 12 {2} 0.01 - 281 0.004Chlorpyrifos 2921-88-2 0.21 34 {2} 0.038 - 770 0.01Chromium 7440-47-3 0.87 7 {7} 0.87 - 11 10.98Chromium IV # {5}Chrysene 218-01-9 30 1 30 19Copper 7440-50-8 3.1 91 {9} 2.22 - 2500 5.16Dacthal 1861-32-1 223Diazinon 333-41-5 211 3 {3} 211 - 1064 0.22Dibenz(a,h)anthracene 53-70-3 2Dibenzothiophene 132-65-0 {1}Dicamba 1918-00-9Dichlobanil 1194-65-6 400Dieldrin 60-57-1 0.08 18 {4} 0.054 - 1550 0.06Dimethyl phthalate 131-11-3 33000 ADi-n-butyl phthalate 84-74-2 32000 1 32000 33Di-n-octyl phthalate 117-84-0 0.09
2 of 4

Table 8. Ecological Toxicity 01/08/2007
ERED/URS FCVChemical CAS LOED Screening Value (mg/kg ww) # Data Points (1) Range of Data (ug/L) (2) Qualifier (3)
Diuron 330-54-1 160 AEndosulfan 115-29-7 0.031 6 0.031 – 1.1 0.01Endosulfan sulfate 1031-07-8 386Endrin 72-20-8 0.019 33 {4} 0.01 - 741 0.01Ethion 563-12-2 0.06 AEthoxylated nonylphenol phosphate 51811-79-1Ethylbenzene 100-41-4 10200 AFenitrothion 122-14-5 800Fluoranthene 206-44-0 1.15 17 {3} 0.112 - 1011 8.10Fluorene 86-73-7 6.6 4 6.6 - 23 3.90Gamma-Benzene Hexachloride 58-89-9 0.0136 8 {6} 0.0136 - 1246 0.08Guthion 86-50-0 0.01Heptachlor 76-44-8 0.021 8 {2} 0.021 – 211 0.004Heptachlor epoxide 1024-57-3 0.01 5 {2} 0.01 – 4.2 0.004Heptachloronaphthalene 32241-08-0 0.40Hexachlorobenzene 118-74-1 0.34 2 0.34 – 18.81 16Hexachlorobutadiene 87-68-3 17.8 7 17.8 – 800 90 AHexachloroethane 67-72-1 12Hexachloronaphthalene 1335-87-1 1.32Indeno(1,2,3-c,d)pyrene 193-39-5 2Kelthane 115-32-2 16Lead 7439-92-1 0.451 41 {8} 0.29 - 6356 2.50Mercury 7439-97-6 0.27 108 {8} 0.039 - 140 0.91Methoxychlor 72-43-5 0.3 19 0.15 - 28 0.03Methyl parathion 298-00-0 0.03Methyltin trichloride 993-16-8 78Mirex 2385-85-5 0.02 21 {2} 0.015 - 63 1010 ANaphthalene 91-20-3 1.8 8 {1} 1.8 - 1025 24Nickel 7440-02-0 15 5 {2} 15 - 118 29.02N-nitroso diphenylamine 86-30-6 696Nonylphenol 25154-52-3 100Octachloronaphthalene 2234-13-1 0.12Oxadiazon 19666-30-9Parathion 56-38-2 0.0000227 15 {2} 0.0000167 - 119 0.01pentabromodiphenyl ether 32534-81-9Pentachloroanisole 1825-21-4Pentachloronaphthalene 1321-64-8 4Pentachlorophenol 87-86-5 2.34 32 {9} 0.498 - 927 4.05
3 of 4

Table 8. Ecological Toxicity 01/08/2007
ERED/URS FCVChemical CAS LOED Screening Value (mg/kg ww) # Data Points (1) Range of Data (ug/L) (2) Qualifier (3)
Perylene 198-55-0 6Phenanthrene 85-01-8 0.78 7 {1} 0.78 - 476 6.30Phenol 108-95-2 1.8 5 {6} 1.8 – 960 157Polybrominated terphenyls #Polychlorinated alkenes #Polychlorinated Biphenyls 1336-36-3 0.15 91 {16} 0.04 - 1100 0.01Polychlorinated Terphenyls 61788-33-8Polychlorodibenzodioxins #Polychlorodibenzofurans #Pronamide 23950-58-5 1053Pyrene 129-00-0 0.01 8 {2} 0.01 - 566 55Selenium 7782-49-2 0.52 53 {2} 0.23 – 42 5Silver 7440-22-4 0.33 24 0.06 - 2510Tetrachloroethene 127-18-4 2189 1 2189 120Tetrachloronaphthalene 1335-88-2 14Tetradifon 116-29-0Tetraethyltin 597-64-8 23Total benzofluoranthenes (b+k (+j)) #Total pp,-DDT,-DDD,-DDE #Toxaphene 8001-35-2 0.4 23 0.36 - 52 0.0002Tributyltin 688-73-3 0.013 37 0.01 - 202 0.02Trichloroethene 79-01-6 775 1 775 2000 ATrichloronaphthalene 1321-65-9 44Trifluralin 1582-09-8 3Triphenyltin chloride 639-58-7 0.92Zinc 7440-66-6 27.8 37 {5} 22.6 - 6400 66.60
(1) First value indicates the number of LOED residue-effect values used to derive the 5th %ile and range concentrations. The value in { } indicates the number of LC50 residue-effect values that are available for a particular chemical. (2) A Final Chronic Value is generally the 5th percentile LC or EC-50 value from a data set involving water-only, long-term exposure to 3 or more taxa. Alternatively, if this data is not available, an FCV is estimated by applying an acute-chronic ratio to the 5th percentile LC/EC50 from the acute exposure data set for a particular chemical. (3) "A" indicates lowest acute data point (from EPA's AQUIRE database) used because no FCV available.
4 of 4

Draft April 24, 2003 DMMP ISSUE PAPER REVISIONS TO THE BIOACCUMULATIVE CONTAMINANTS OF CONCERN (BCOC) LIST Prepared by Erika Hoffman (EPA) for the DMMP agencies INTRODUCTION Washington State’s Dredged Material Management Program (DMMP) currently identifies thirty-one bioaccumulative chemicals of concern (BCOCs) that are listed in Table 6-5 of the Users Manual (2000). If sediment concentrations of any these BCOCs exceed bioaccumulation trigger levels (BT) established by the DMMP, then there is "reason to believe" that a potential risk may be posed to human and/or ecosystem health due to the accumulation of contaminants in aquatic organisms. In such cases, the DMMP agencies require bioaccumulation testing in addition to toxicity tests in order determine suitability for unconfined, open-water disposal. PROBLEM IDENTIFICATION The current list of BCOCs (Attachment 1) was developed fifteen years ago based on the best available sediment monitoring and risk assessment information (PSDDA, 1988). In 1998, the DMMP presented the rationale and general approach for re-evaluating bioaccumulation testing and interpretation which included revising the list of bioaccumulative contaminants required for analysis (DMMP, 1998 and Hoffman, 1998). The DMMP also convened the Bioaccumulation Work Group (BWG) to participate in the list revision. The BWG is a technical advisory group made up of representatives from regulatory agencies, tribes, research organizations, regulated entities, and environmental consulting firms. In 2001-02, the BWG recommended an approach to list revision, that included specifying: • a list of prospective chemicals for consideration, • the data needed to characterize a chemical of bioaccumulative concern, and • the conceptual criteria for defining four different BCOC lists. Four draft BCOC lists were presented as an Issue Paper at the 2002 SMARM (DMMP, 2002). Based on feedback received in 2002 at the BWG meeting and at the SMARM, revisions were made to the draft lists. These revisions primarily address concerns about the adequacy of the tissue data used to determine the list placement of a chemical. Specifically, the DMMP defined the minimum criteria for data sufficiency that must be met for a chemical to be placed on Lists 1-4. The DMMP also decided to use only detected concentrations when deriving summary statistics for tissue data.
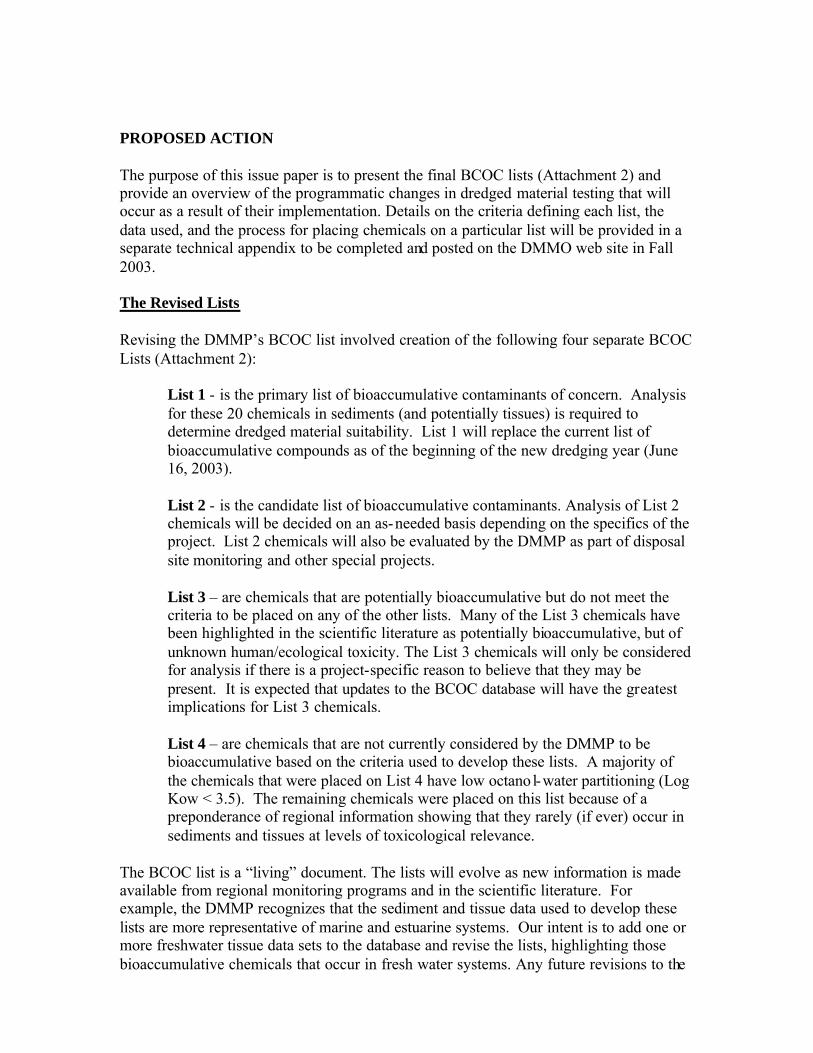
PROPOSED ACTION The purpose of this issue paper is to present the final BCOC lists (Attachment 2) and provide an overview of the programmatic changes in dredged material testing that will occur as a result of their implementation. Details on the criteria defining each list, the data used, and the process for placing chemicals on a particular list will be provided in a separate technical appendix to be completed and posted on the DMMO web site in Fall 2003. The Revised Lists Revising the DMMP’s BCOC list involved creation of the following four separate BCOC Lists (Attachment 2):
List 1 - is the primary list of bioaccumulative contaminants of concern. Analysis for these 20 chemicals in sediments (and potentially tissues) is required to determine dredged material suitability. List 1 will replace the current list of bioaccumulative compounds as of the beginning of the new dredging year (June 16, 2003).
List 2 - is the candidate list of bioaccumulative contaminants. Analysis of List 2 chemicals will be decided on an as-needed basis depending on the specifics of the project. List 2 chemicals will also be evaluated by the DMMP as part of disposal site monitoring and other special projects.
List 3 – are chemicals that are potentially bioaccumulative but do not meet the criteria to be placed on any of the other lists. Many of the List 3 chemicals have been highlighted in the scientific literature as potentially bioaccumulative, but of unknown human/ecological toxicity. The List 3 chemicals will only be considered for analysis if there is a project-specific reason to believe that they may be present. It is expected that updates to the BCOC database will have the greatest implications for List 3 chemicals.
List 4 – are chemicals that are not currently considered by the DMMP to be bioaccumulative based on the criteria used to develop these lists. A majority of the chemicals that were placed on List 4 have low octano l-water partitioning (Log Kow < 3.5). The remaining chemicals were placed on this list because of a preponderance of regional information showing that they rarely (if ever) occur in sediments and tissues at levels of toxicological relevance.
The BCOC list is a “living” document. The lists will evolve as new information is made available from regional monitoring programs and in the scientific literature. For example, the DMMP recognizes that the sediment and tissue data used to develop these lists are more representative of marine and estuarine systems. Our intent is to add one or more freshwater tissue data sets to the database and revise the lists, highlighting those bioaccumulative chemicals that occur in fresh water systems. Any future revisions to the

lists will go through the BWG and the SMARM public review process. A schedule for periodically updating the BCOC lists is under development. Implementation of the lists Analysis of List 1 chemicals will be required for all sediments being tested for open water disposal effective as of the beginning of the new dredging year (June 16, 2003). There are three chemicals (chromium, selenium, and alpha-benzene hexachloride)1 on List 1 which are new to the DMMP program and are being added to the DMMP’s Chemicals of Concern List (COC) (Attachment 3). Standard methods for analyzing these three chemicals are listed in Table 1. Note that selenium is the only new List 1 chemical whose inclusion requires the addition of a new standard method. When measured sediment concentrations of the List 1 contaminants exceed the bioaccumulation trigger values (BT) presented in Table 1, bioaccumulation testing must be performed to determine the suitability of the test sediment. Twelve of the twenty chemicals in List 1 already have BT values. Interim BT values (italicized in Table 1) were developed for six of the new List 1 chemicals using the same algorithm2 that was used to derive BTs for the original BCOC list (EPTA, 1988). Interim BTs for selenium and alpha-benzene hexachloride were developed in consideration of sediment concentrations reported in the literature to be associated with adverse ecological effects from bioaccumulation. These values are designated as “interim” pending a planned BWG review of all List 1 BTs and Target Tissue Levels (TTLs) in 2003/04. Where available, the TTLs listed in Table 1 will be used to interpret the results of bioaccumulation testing. For chemicals that don’t currently have a TTL, a residue-effect based value will be developed on a project-by-project basis as has been done in the past for other chemicals. 1 Dioxins and Furans do not appear on the DMMP COC list because they are only required for sediments (and tissue) evaluation when there is a site-specific reason-to-believe that they may be present. 2 All six chemicals (cadmium, chromium, copper, lead, pyrene, and zinc) have either sediment screening level (SL) and maximum level (ML) values or Low AET and High AET values. The BT was calculated as 70% of the difference between the ML (or HAET) and the SL (or LAET) (EPTA, 1988).

Table 1. Bioaccumulation Triggers (BT), Target Tissue Levels (TTL) and Method Information for List 1 Chemicals Chemical BT
ug/kg dry wt. 1 TTL mg/kg wet wt.
Method
Alpha-Benzene Hexachloride
10 mg/kgOC 2 TBD SW846 M.8081
Arsenic 507.1 mg/kg 10.1 SW846 M.6020 Cadmium 11.3 mg/kg TBD SW846 M.7131 Chlordane 3 37 0.3 SW846 M.8081 Chromium 267 mg/kg TBD SW846 M.6020 Copper 1027 mg/kg TBD SW846 M.6020 Dioxins/Furans 5 ng/kg 4 n/a EPA 1613 Fluoranthene 4600 8400 SW846 M.8270 Hexachlorobenzene 168 180 SW846 M.8081 Lead 975 mg/kg TBD SW846 M.7421 Mercury 1.5 mg/kg 1.0 SW846 M.7471 Nickel 370 mg/kg 20,000 SW846 M.6020 Pentachlorophenol 504 900 SW846 M.8270 Pyrene 11,980 TBD SW846 M.8270 Selenium 3 mg/kg 5 TBD SW846 M.7740 6 Silver 6.1 200 SW846 M.7761 TBT 0.15 ug/L 7 0.6 8 Krone/Unger Total Aroclor PCB 38 mg/kg OC 0.75 8 SW846 M.8081/2 Total DDT 9 50 5.0 SW846 M.8081 Zinc 2783 TBD SW846 M.6010 Italics indicate Interim BTs TBD = to be determined on a project-specific basis.
1Except where noted otherwise. 2Intermin BT based on the severe effect level from the Ontario Provincial Sediment Quality Guideline for for Alpha-BHC. 3Chlordane includes all chlordane isomers including cis -Chlordane, trans-Chlordane, cis -Nonachlor, trans-Nonachlor, alpha-Chlordene, gamma-Chlordene, and heptachlor 4Value refers to bulk 2378-TCDD. Alternatively, a 15 ng/kg TEQ will trigger bioaccumulation testing. 5Interim BT for selenium based on review of sediment effect values from the literature and BPJ. 6Method 7740 is not currently required on the DMMP’s COC list. 7Measured in interstitial water. 8Target Tissue Level is based on site-specific considerations which may not be appropriate for all disposal sites. 9Total DDT is determined by summing the p,p’- isomers of DDT and it’s metabolites (DDD, and DDE).

REFERENCES DMMP. 1998. Revision of Guidelines for Bioaccumulative Chemicals of Concern. DMMP issue paper. Prepared by John Malek (EPA) and Tom Gries (Ecology) for the DMMP agencies. DMMP. 2002. Proposed Revisions to the Bioaccumulative Contaminants of Concern (BCOC) List. DMMP issue paper. Prepared by Erika Hoffman for the DMMP agencies. Hoffman, E. 1998. Technical Support Document: Revision of the Dredged Material Management Program Bioaccumulative Chemicals of Concern List. Prepared for the Dredged Material Management Program, September, 1998. 43 pages. PSDDA. 1988. Evaluation Procedures Technical Appendix (EPTA) - Phase I. U.S. Army Corps of Engineers – Seattle District; U.S. Environmental Protection Agency - Region X; Washington State Department of Natural Resources; Washington State Department of Ecology. PSDDA. 2000. Dredged Material Evaluation and Disposal Procedures – A Users Manual for the Puget Sound Dredged Disposal Analysis (PSDDA) Program. February, 2000.

Technical Support Document for Revision ofthe Dredged Material Management ProgramBioaccumulative Chemicals of Concern List
September, 1998
Prepared for the Agencies of the Dredged Material Management Program
By: Erika HoffmanUS EPA Region 10
2
TABLE OF CONTENTS
ACRONYMS................................ ................................ ................................ .............................. 4
EXECUTIVE SUMMARY................................ ................................ ................................ ......... 5
BACKGROUND ................................ ................................ ................................ ........................ 6Existing Framework for Bioaccumulation Testing................................ ................................ .... 6Rationale and Context for Revising the DMMP’s Bioaccumulative Contaminantsof Concern List ................................ ................................ ................................ ....................... 7
PURPOSE ................................ ................................ ................................ ................................ .. 8
SCOPE ................................ ................................ ................................ ................................ ....... 8
SOURCES OF INFORMATION USED ................................ ................................ ..................... 9Overview ................................ ................................ ................................ ................................ 9State and Regional Pesticide Use ................................ ................................ ........................... 10Recommendations for Regional Sediment and Tissue Monitoring................................ .......... 10Chemicals Appearing On Other Bioaccumulative Chemicals Of Concern Lists ....................... 12Tissue Monitoring Data from WA State ................................ ................................ ................ 14Sediment Monitoring Data from WA State ................................ ................................ ............ 16Other Information Related to Bioaccumulation Potential ................................ ....................... 17Information on the Ecological Effects Associated With Bioaccumulated Chemicals ............... 19
RECOMMENDATIONS ................................ ................................ ................................ .......... 20Chemicals For Consideration................................ ................................ ................................ . 20Sources of Information on Bioaccumulation................................ ................................ .......... 20Draft Criteria for Developing a Revised BCoC List ................................ ............................... 21
REFERENCES................................ ................................ ................................ ......................... 24
FOOTNOTES TO TABLES 2-7................................ ................................ ............................... 27
ADDITIONAL FOOTNOTES TO TABLE 7................................ ................................ ............ 30

3
LIST OF TABLES
Table 1. Current DMMP List of Chemicals of Concern for Bioaccumulation............................... 6
Table 2. WA State Pesticide Use and Recommendations for MonitoringError! Bookmark not defined.
Table 3. Chemicals Appearing On Other Bioaccumulative Chemicals Of Concern ListsError! Bookmark not defined.
Table 4. Tissue Monitoring Data from WA State......................... Error! Bookmark not defined.
Table 5. Sediment and Tissue Monitoring Data from WA State ... Error! Bookmark not defined.
Table 6. Other Information Related to Bioaccumulation Potential and Information on theEcological Effects Associated with Bioaccumulated ChemicalsError! Bookmark not defined.
Table 7. Recommended Criteria for Developing a BCoC List ...... Error! Bookmark not defined.

4
LIST OF ACRONYMS
BCoC - bioaccumulative contaminant of concernBT - bioaccumulation trigger levelsBCF - bioconcentration factorCoC - chemicals of concernCOE - Corps of EngineersDAIS - Dredged Analysis Information SystemDMMP - Dredged Material Management ProgramEPA - Environmental Protection AgencyEPWG - Evaluation Procedures WorkgroupERED – Environmental Residue Effects DatabaseFW – fresh waterLOED – lowest observed effects doseLog Kow – log of the octanol/water partitioning coefficientLUED – lowest unquantified effects doesML – maximum levelNOED – no observed effects dosePAH - polycyclic aromatic hydrocarbonPCB - polychlorinated biphenylPOC – pollutant of concernPS – Puget SoundPSDDA - Puget Sound Dredged Disposal AnalysisPSEP- Puget Sound Estuary ProgramSQC - sediment quality criteriaSL – screening levelSW – sea waterWDOE - Washington State Department of EcologyWSPMP - Washington State Pesticide Monitoring Program

5
EXECUTIVE SUMMARY
The DMMP Bioaccumulative Contaminant of Concern (BCoC) list, in its current form, isnot an accurate reflection of the chemicals that are being used in the State of Washington ordetected in sediments and tissue monitoring programs. There are several chemicals on the list thatare rarely, if ever, observed in aquatic organisms. Other chemicals are missing from the BCoC listthat have the potential to be or are chemicals of concern relative to bioaccumulation in aquaticorganisms. This report recommends a list of chemicals to be considered when revising the BCoClist. It also provides chemical-specific information on the use, distribution, and bioaccumulativepotential of these chemicals, and suggests important criteria to be used in deciding whether or notto include a chemical on the revised BCoC list.

6
BACKGROUND
Existing Framework for Bioaccumulation Testing
Washington State’s Dredged Material Management Program (DMMP) developed theexisting conceptual framework for conducting and interpreting bioaccumulation tests ten yearsago (EPTA, 1988). Under this framework, bioaccumulation testing is conducted on dredgedmaterial for which there is a “reason to believe” that chemicals of concern may accumulate tounacceptable levels in the tissues of target organisms. The DMMP currently identifies thirtybioaccumulative chemicals of concern (BCoC). If sediment concentrations of any these BCoCsexceed bioaccumulation trigger levels (BT) established by the DMMP (see Table 1), then there is“reason to believe” there is a potential risk to human health and/or that aquatic organisms couldaccumulate contaminants to levels constituting an unacceptable adverse effect.
Table 1. Current DMMP List of Chemicals of Concern for Bioaccumulation
Metals/Organometals: Phthalates:Antimony Dimethyl phthalateArsenic Di-n-butyl phthalateMercury Bis(2-ethylhexyl)phthalateNickelSilver Chlorinated Hydrocarbons:Tributyltin 1,2-Dichlorobenzene
1,3-Dichlorobenzene PAHS: 1,4-Dichlorobenzene Benzo(a)pyrene Hexachlorobenzene Fluoranthene
Phenols:Pesticides: Phenol
Aldrin Pentachlorophenol Chlordane DDT (total) Misc. Extractables: Dieldrin Hexachloroethane Heptachlor Hexachlorobutadiene
N-NitrosodiphenylamineVolatile Organics:
Ethylbenzene Other:Trichloroethene PCB (total)Tetrachloroethene PCDD/PCDF

7
In such cases, the DMMP agencies require bioaccumulation testing, in addition to toxicity tests, inorder determine sediment suitability for unconfined, open-water disposal. This approach to theevaluation of dredged material proposed for unconfined aquatic disposal is consistent with therecently finalized EPA/COE national guidance contained in the Evaluation of Dredged MaterialProposed for Discharge in Waters of the United States, or “Inland Testing Manual” (COE/EPA,1998).
The original BCoC list and corresponding BT values were derived in 1988 by theEvaluation Procedures Workgroup (EPWG) of the Puget Sound Dredged Disposal Analysis(PSDDA) program. EPWG evaluated and reached consensus on the BCoC list based on aconsideration of the best available monitoring and risk assessment information at the time. Thisinformation included both human health risk and ecological risk, as required by the Clean WaterAct and implementing regulations. However, because relatively little was known about tissueresidues and associated effects in 1988, the guidelines developed and currently implemented reliedheavily on human health considerations. To ensure ecological health was addressed, the agenciesestablished safety factors in the form of other guidelines for management of open-water disposalsites (EPTA 1988, MPR 1988). The agencies recognized that issues associated withbioaccumulation would need to be revisited as more tissue-effects data and ecological riskinformation became available.
Rationale and Context for Revising the DMMP’s Bioaccumulative Contaminants ofConcern List
Revising the DMMP’s current BCoC list is necessary because in many respects this listdoes not adequately reflect those chemicals that are actually measured and detected in sedimentsand tissues of aquatic organisms in Washington State. For example, several contaminantscurrently on the list are rarely detected in sediments or tissues while other frequently detectedcontaminants that are expected to bioaccumulate do not appear on the list. Furthermore, thescope and availability of residue-effects information is now greatly expanded, facilitating use ofecological risk information in dredged material management decisions.
However, revising the BCoC list is just a first step in a larger process to reevaluate theDMMP’s existing framework for assessing bioaccumulation. The proposed process has beenoutlined in a draft Issue Paper presented at the 1998 Sediment Management Annual ReviewMeeting (Malek and Gries, 1998). There are several reasons why the DMMP agencies havedecided to revise the bioaccumulation framework and guidance. First, some of the human healthinformation on which existing BTs are based needs to be updated (e.g., fish consumption rates).Second, there have been many advances since 1988 in the state of knowledge of bioavailability,bioaccumulation, biomagnification and their implications for human health and ecological risk.Finally, EPA Regions and Corps Districts are expected to jointly develop and issue regionalimplementation guidance for dredged material testing based on the recently finalized InlandTesting Manual (COE/EPA, 1998).

8
Information in this report was compiled by EPA staff during the summer and fall of 1997and presented to the DMMP agencies for review. Following limited internal and externaltechnical review, the report was finalized. The final report was presented for broader peer andpublic review as an attachment to a draft Status Report at the 1998 Sediment ManagementAnnual Review Meeting. Development of the revised BCoC list will be the responsibility of aworkgroup made up of agency staff, technical experts and affected users (e.g., port districts). Inaddition to revising the DMMP’s BCoC list, the charge of the workgroup will be to re-evaluatethe conceptual framework for addressing bioaccumulation within the overall context of dredgedmaterial management.
PURPOSE
The purpose of this report is to summarize and discuss the extensive body of informationcharacterizing the distribution, bioavailability and risks associated with various contaminantsfound in sediments and tissues of aquatic organisms in Washington State. Summary informationfrom the general scientific literature is presented in order to characterize the bioavailability ofthese contaminants and the toxic effects that have been observed when they concentrate in thetissues of aquatic organisms. It is envisioned that the list of chemicals and information presentedin this report will be considered in any DMMP process to develop a new BCoC list.
SCOPE
Sixty-five chemicals are proposed here for consideration in revising the DMMP’s BCoClist. This list includes all of the 30 chemicals that are on the current list (Table 1), as well as anadditional 35 chemicals with documented bioaccumulative properties and that have been detectedin Washington State sediment and tissue monitoring programs. Summary information pertainingto potential bioaccumulative risk is presented for each of these chemicals in Tables 2-6. Note thatthe focus of the presentation is on ecological receptors and endpoints. This information isintended to supplement, rather than replace, the human risk considerations that already form alarge part of the DMMP’s existing conceptual framework for conducting and interpretingbioaccumulation tests.
Several earlier studies have produced lists of chemicals (primarily pesticides)recommended for monitoring in the tissue of aquatic organisms in Washington State (see below).Although many of the chemicals recommended by these studies are included in Tables 2-6, otherswere not included because there was little evidence that they occur in State sediments and/ortissues at levels that would pose a risk to ecological or human receptors. Thus, the followingchemicals were excluded from further consideration based on a low propensity to bioaccumulate

9
in tissues (e.g., log Kow< 3.51), a lack of documented use in Washington State, and/or low ratesof detection in regional sediment and tissue monitoring programs:
Azinphos-methyl EndrinBromoxynil FenvalerateBiphenyl Methyl-parathionButyl benzyl phthalateMirexDicamba OxadiazonDichlorobenzophenone PronamideDiuron TetradifonEthion
SOURCES OF INFORMATION USED
Overview
Numerous reports and databases, including data from studies of both fresh and salt-waterenvironments, were reviewed in order to collect the quantitative and qualitative informationpresented in Tables 2-6. Particular emphasis was placed on summarizing the results of studiesdocumenting the occurrence, bioavailability, or bioaccumulation of contaminants in WashingtonState. However, it was also important to include more general information on bioavailability andtoxicity from the scientific literature in order to more fully characterize the bioaccumulativepotential of these chemicals. Sources of information summarized in this report fall into thefollowing general categories:
· Inventories of the types and quantities of pesticides used by government, industry,agriculture and households in Washington State;
· Recommendations for regional sediment and tissue monitoring;· Chemicals appearing on other BCoC lists;· Data from WA State tissue monitoring programs;· Data from WA State sediment monitoring programs;· Information from the scientific literature on the partitioning, persistence and
bioaccumulation potential of chemicals and their degradation products;· Information on the ecological effects associated with bioaccumulated chemicals.
1 The octanol-water partition coefficient, Kow, is defined as the ratio of the equilibrium concentrations of achemical in the two phases of a system consisting of n-octanol and water. The log of Kow is used as an indicatorof the tendency for a chemical to partition into the lipid/organic phase of a medium. Chemicals with log Kowvalues that greater than 3.5 are generally considered likely to partition into organic media such as lipids oforganisms and natural organic matter.

10
Below, a brief description (organized by category) is provided for each of the sourcedocuments included in Tables 2-6, including (where appropriate) indication of any particularstrengths or weaknesses that could have bearing on its use for the purposes of revising the BCoClist.
State and Regional Pesticide Use
The pesticides included in the current DMMP BCoC list are limited to organochlorinecompounds whose use is either highly restricted or banned (e.g., DDT, Chlordane, Aldrin). Thus,it was deemed particularly important to review recent use information in Washington State todetermine if other currently used organochlorine pesticides or persistent pesticides from otherclasses (e.g., organophosphate) would be appropriate to consider for addition to the BCOC list.
· Tetra Tech (1988). Pesticides of Concern in the Puget Sound Basin: A Review ofContemporary Pesticide Usage, TC 3338-32.
Gives estimations of urban (city government, commercial, and private household) andnon-urban (military, agriculture, right-of-ways, and forestry) use of pesticides in thePuget Sound Basin based on published county surveys, telephone and letter surveys ofusers, and extrapolation based on pesticide usage in the San Francisco Bay area.Information is somewhat dated and there is a particularly high degree of uncertaintyassociated with the extrapolated estimates of urban usage.
· Washington Agricultural Chemical Usage Summaries (various 1993-1996).Washington Agricultural Statistics Service, US Dept. of Agriculture and WA StateDept. of Agriculture.
Tallies annual pesticide use information for a given crop variety (e.g., wheat, carrots,pears). Because annual use information is not consistently available for all cropsreceiving applications of a particular pesticide, it is not possible to calculate a totalannual usage by summing information for all applicable crops in any given year.Instead, the information presented in Table 2 represents the highest annual usagerecorded for a single crop during the period 1993-1996. Thus, for most chemicals,total annual usage is likely to be higher than the quantity given in Table 2.
Recommendations for Regional Sediment and Tissue Monitoring
The following studies summarize historical sediment and tissue data from the Puget Soundarea and recommend the biological receptors and chemicals of concern on which to focus futuremonitoring efforts.

11
· PSEP (1991a). Toxic Contaminants in Puget Sound Wildlife - Literature Review andRecommendations for Research and Monitoring, Sept. 1991, EPA 910/9-91-023.
Reviews historical monitoring data in order to document the range of concentrationsof specific contaminants that have been observed in Puget Sound wildlife. The scopeof the report was limited to bird and marine mammal species that feed in marine areasof Puget Sound. However, many of these species (e.g., gray whales, raptorial birds,and sea lions) are migratory and/or feed in areas outside of Puget Sound. Tissueresidues in these organisms may or may not be reflective of exposures tocontamination within Puget Sound. Furthermore, the information reviewed wasderived from studies that focused on a subset of highly persistent compounds (e.g.,DDT, Dioxins/Furans, PCBs) rather than looking at a broad range of possiblecontaminants. Recommendations on the contaminants that should be included in fishand wildlife tissue monitoring programs are based on filling data gaps and estimates ofthe bioaccumulative potential of various chemicals as well as documented evidence ofwhat chemicals actually bioaccumulate.
· PTI (1991). 1990 Puget Sound Pesticide Reconnaissance Survey, August 1991, EPA910/9-91-020
Analyzed six sediment samples from four streams in the Puget Sound area for a largenumber of compounds including organophosphate and organochlorine pesticides,chlorinated herbicides, triazine herbicides, and carbamates and urea pesticides.Detected concentrations of all pesticides were below 33 ppb (dry weight). Chemicalswere recommended for inclusion in monitoring efforts based on (1) detection at levelsexceeding theoretically estimated thresholds for acute toxicological effects; or (2)detection in previous surveys.
· PSEP (1991b) Pollutants of Concern in Puget Sound. April 1991, EPA 910/9-91-003.
Summarizes information on regulatory status, existing numerical criteria, sources, andmonitoring data for 64 pollutants identified as contaminants of concern in PugetSound. Contaminants selected for final pollutants of concern list meet all of thefollowing general criteria: 1) high toxicity as measured in laboratory studies, 2) highpersistence in the environment, 3) high bioaccumulation potential and at least one ofthe following specific criteria relative to Puget Sound: high measured water column oreffluent concentrations; existence of known sources; high concentrations relative tosediments from Puget Sound reference areas; widespread distribution in sediments.
· WA Department of Health. (1995) Tier I Report: Development of SQC for theProtection of Human Health. June 1995.
Describes the first tier of a two-tiered process to establish numerical sediment qualitycriteria for the protection of human health. Over 200 chemicals of concern (CoCs)were identified and divided into the following three groups based on their toxicity, log
12
Kow, and frequency of detection in the sediment samples from the State’s SEDQUALdatabase. Group 1 chemicals (likely to impact human health) have an EPA toxicityvalue, log Kow greater than 3.5, and a greater than 5% detection rate in SEDQUALurban bay sediment stations; Group 2 chemicals (less likely to impact human health)have an EPA toxicity value, and a log Kow less than 3.5 or less than 5% detection ratein SEDQUAL; Group 3 chemicals have no EPA toxicity values but are considered tobe of potential human health concern and are reserved for assessment in the future.One limitation of this report is that the CoC list and subsequent groupings are drawnonly from those chemicals that appear in the SEDQUAL data base. Furthermore,although results of tissue monitoring are summarized in the report, this informationwas not used to derive the CoC list or the chemical groups due to the limited size andquality of the tissue database.
Chemicals Appearing On Other Bioaccumulative Chemicals of Concern Lists
Numerous programs have developed lists of target analytes for fish tissue monitoring (seeUS EPA, 1995). The criteria for selection of target analytes vary depending on the specificprogram objectives and regional conditions. Many of these programs, however, have taken aconservative approach in assuming that any contaminant that has been measured in sediment orwater can potentially bioaccumulate in tissues of aquatic organisms. The resulting lists of targetanalytes can be huge, sometimes in excess of 200 contaminants. The lists discussed below weredeveloped or have been refined to include only those contaminants that have been clearlydemonstrated to be of bioaccumulative concern
· Target Analytes in Tissues for Dredged Material Testing in US EPA Regions 1, 2,and 9
Bioaccumulation testing, a standard requirement of the dredged material testingprogram, is used to evaluate the suitability of sediments for unconfined disposal inboth ocean and inland (404) waters. A list potential target analytes for sediment andtissue testing is presented in both the Green Book (1991) and in the Inland TestingManual (1998). These lists are intended to serve as a basis for developing regionaland site-specific lists. Individual regions are encouraged to modify their lists based onregion-specific chemical use patterns and monitoring data. Analyte lists presented inTable 3 are from three EPA Regions, other than Region 10, which regularly requirebioaccumulation testing for their dredged material testing programs.
· Ontario Ministry for the Environment Primary List of Candidate Substances forBans, Phase-outs or Reductions - Multimedia Revision (October 1993).
Chemicals appearing on this list are considered to be persistent, bioaccumulative andtoxic by virtue of persisting in water, sediment, soil, or sludge for greater than 50 days,a BCF greater than 500, and demonstrated lethal or sublethal toxicity. As aconsequence, these substances are given first consideration as candidates for bans or

13
phase-outs. The Ontario Ministry’s list was reviewed and adopted by WDOE’sBioaccumulative Chemicals of Concern (BCC) Workgroup as a starting point fordeveloping its own list for use in programs agency-wide. Note that chemicalsappearing on this list do not necessarily occur in Washington State.
· Great Lakes Water Quality Initiative Bioaccumulative Chemicals of Concern fromFR Vol. 60, no. 56, March 23, 1995.
The Great Lakes Bioaccumulative Chemicals of Concern list is limited to anychemical, “…which upon entering the surface waters, by itself or as its toxictransformation product, bioaccumulates in aquatic organisms by a human healthbioaccumulation factor greater than 1,000, after considering metabolism and otherphysicochemical properties that might enhance or inhibit bioaccumulation…” Notethat a high bioaccumulation factor criterion was used to limit the list of chemicals forwhich regulatory criteria would need to be developed.
· US EPA (1995). Guidance for Assessing Chemical Contaminant Data for Use inFish Advisories: Vol. 1 Fish Sampling and Analysis, 2nd Edition, Sept. 1995. EPA823-R-95-007.
Chemicals were included in the Recommended Target Analyte list based on thefrequency of their inclusion in national monitoring programs and the number of Statesin which they are the basis of a consumption advisory. Source, potential tobioaccumulate, expected human health risk, and feasibility of analysis were alsoconsiderations in developing this list.
· Research Triangle Institute, 1993. National Listing of State Fish and ShellfishConsumption Advisories and Bans, Research Triangle Park, NC.
Lists the number of States issuing advisories for various chemicals. Current as of July22, 1993.
· EPA (1997) Draft Bioaccumulation Testing and Interpretation for the Purpose ofSediment Quality Assessment: Status and Needs (August 1997)
List of potential bioaccumulative chemicals of concern was developed based on inputfrom the Bioaccumulation Analysis Workgroup and review of various agencydocuments. All chemicals in this list are found in the sediment and in animal tissues atlevels associated with toxic effects. Chemicals ranked as highest priority (1) hadinformation readily available, were of immediate concern and known to bioaccumulate,and considered important in one or more EPA programs. Residue and effectsinformation for these chemicals is summarized in the Appendices of the Status andNeeds document. Chemicals ranked as secondary priority (2) are known tobioaccumulate and will be researched when more funds are available while thoseranked last (3) have the potential to bioaccumulate but will not be researched further.

14
Tissue Monitoring Data from WA State
The following studies represent the most recent information available (since 1988)documenting concentrations of contaminants of concern in the tissues of various aquaticorganisms.
· Puget Sound Estuary Program (PSEP) (1991c). Chemical Contamination of HarborSeal Pups in Puget Sound, September 1991, EPA 910/9-91-003.
Reports concentrations of various contaminants in the blubber and liver tissue of dead,newborn harbor seal pups from two locations in northern and southern Puget Sound.Major conclusions were that tissue levels of PCBs and p,p’-DDE have declinedsubstantially in Puget Sound. Aside from DDE, most of the other pesticides evaluatedin this study were not detected. Note that data for the pesticide toxaphene areambiguous in that reported concentrations in all samples were below detection but thedetection limit (2.4 ppm wet weight) was unusually high for this pesticide.
· PSEP (1991d) Bioaccumulation of Contaminants in Crab and Clams in BellinghamBay, September 1991, EPA 910/9-91-042
Reports concentrations of various contaminants in field-collected edible crab and clamtissue. The highest detected concentrations of both trace metals and organiccompounds were generally low, being comparable to concentrations found in PugetSound reference areas with presumably low levels of contamination.
· Washington State Pesticide Monitoring Program (WSPMP) (1994). ReconnaissanceSampling of Fish Tissue and Sediments (1992), December 1994, WDOE Pub. No 94-194.
Reconnaissance survey conducted to refine the target analyte list, analytical methods,and field sampling techniques for the biota and sediment sampling portion of theWashington State Pesticide Monitoring Program. Concentrations of pesticides andPCBs were measured in sediments and tissues from field-collected fish from sevenfreshwater sites in eastern and western Washington. Study concluded that measuredtissue concentrations in fish were unlikely to impair reproduction. Note that the targetpesticide list used in this study is substantial, covering nearly all of the pesticides thatare proposed for consideration in revising the DMMP’s BCoC list.
· WSPMP (1995). 1993 Fish Tissue and Sediment Sampling Report, October 1995,WDOE Pub. No 95-356
Reports concentrations of pesticides and PCBs from eighteen fish tissue samplescollected from nine freshwater sites scattered throughout the State. Results for DDTand PCBs from several locations exceeded US EPA screening values for human healthand/or proposed wildlife criteria. Concentrations of all other pesticides were below

15
these criteria. Study concluded that some piscivorous wildlife within certain areas ofthe State may be at risk from consumption of contaminated fish.
· WSPMP (1996). 1994 Fish Tissue and Sediment Sampling Report, December 1996,WDOE Pub. No 96-352.
Reports concentrations of pesticides and PCBs from fourteen fish tissue samples andfive sediment samples collected from six (mostly eastern Washington) freshwater sites.Results for DDT and PCBs from several locations exceeded US EPA screening valuesfor human health and/or proposed wildlife criteria. Concentrations of all otherpesticides were below these criteria.
· WSPMP (1998). 1995 Fish Tissue and Sediment Sampling Report, WDOE, Olympia,WA.
Reports concentrations of pesticides and PCBs from twenty-four fish tissue samplescollected from eight (mostly eastern Washington) freshwater sites. Results for DDT,PCBs, and aldrin/dieldrin from several locations exceeded US EPA screening valuesfor human health and/or proposed wildlife criteria. Concentrations of all otherpesticides were below these criteria.
· WSPMP (1996). Pesticides and PCBs in Marine Mussels - 1995, March 1996,WDOE Pub. No 96-301.
Reports concentrations of pesticides and PCBs in field-collected marine mussels fromfive sites in Puget Sound and one site at the mouth of the Columbia River. Allsampling sites were located near agricultural, urban, or industrial sources ofcontamination. Sampling was timed to coincide with the period when pesticides aremost frequently detected in Puget Sound tributary waters. Pesticide concentrations inall samples were less than U.S. EPA human health criteria and were below levelsconsidered a concern for consumption by wildlife.
· Washington Department of Health (1995). Tier I Report: Development of SQC forthe Protection of Human Health, June 1995.
Summarizes results of fish and shellfish tissue monitoring from the following studies:
· PTI (1991). Pollutants of Concern in Puget Sound· Landolt et al. (1987). Potential Toxicant Exposure Among Consumers of
Recreationally Caught Fish from Urban Embayments of Puget Sound· Puget Sound Ambient Monitoring Program data from 1990 and 1991 as
summarized in WDOH (1995)· U.S. EPA (1985) Commencement Bay Nearshore/Tideflats Remedial Investigation· SEDQUAL - Query of 1993 version

16
· U.S. EPA (1988) Health Risk Assessment of Chemical Contaminants in PugetSound Seafood
· USGS (1992) Surface-water Quality Assessment of the Yakima River Basin,
Washington: Pesticide and Other Trace-Organic-Compound Data for Water,Sediment, Soil, and Aquatic Biota, 1987-91. USGS Report 92-644.
Reports testing results for bed sediment, suspended sediments and fish tissuescollected from various parts of the Yakima River basin in south-central Washingtonduring 1987-1991. Bed-sediment samples were collected from 26 stations and fish,mollusks, and crayfish were collected from 32 stations both upstream and downstream from human activities throughout the basin. Aquatic biota samples wereanalyzed for a suite of organochlorine compounds. Mollusks were also analyzed forPAHs. Bed sediment samples were analyzed for organochlorine and semi-volatileorganic compounds only.
· Munn, M.F., and D.J Gruber (1997) The relationship between land use andorganochlorine compounds in streambed sediment and fish in the Central ColumbiaPlateau, Washington and Idaho, USA, Environmental Toxicology and Chemistry,Vol. 16, No. 9. Pp. 1877-1887.
Reports the results of testing streambed sediment and fish from the Central ColumbiaPlateau for organochlorine pesticides and PCBs. Sampling design was orientedaround the objective of examining the relationship between land use and thedistribution of these compounds. Sixteen compounds were detected in sediment andfish with tissue samples usually having a greater frequency of pesticide detection.Generally, sediment concentrations were only slightly elevated relative to detectionlimits, while relatively high concentrations of DDT and its metabolites, Dieldrin, andPCBs were detected in many of the tissue samples. Study concludes thatorganochlorine are still present in the environment at concentrations that may pose athreat to various trophic levels in the ecosystem and that eroding agricultural soils area long-term source of many of these compounds to streambed sediments andultimately into the food web.
Sediment Monitoring Data from WA State
An important indication of the persistence and potential bioavailability of aquaticcontaminants is their retention in sediments. The sediment monitoring data provided in Table 5represents both marine and fresh water sediments from three different types of locations: smallstreams and sloughs, areas proximal to or influenced by urban/industrial activities, and harbors,marinas, and navigational channels where dredging occurs.

17
· Bortleson G.C., and D.A. Davis (June 1997), Pesticides in Selected Small Streams inthe Puget Sound Basin, 1987-1995, USGS Fact Sheet 067-97.
Summarizes data from several studies that monitored for a broad range of pesticides insmall streams and sloughs in the Puget Sound Basin. Generally, data were collectedduring spring and summer when pesticide concentrations in water and bed sedimentwould be expected to be highest. The highest pesticide concentrations measured inboth media were only slightly above detection limits and there were no exceedances ofaquatic life or human health criteria.
· SEDQUAL
Provides frequency of detection and exceedances of the DMMP’s 1994 ScreeningLevel (SL) and Maximum Level (ML) values among urban bay stations in theSEDQUAL database (sample basis, n = 2721). Query conducted in November 1997.
· DAIS (Dredged Analysis Information System)
Provides frequency of detection and exceedances of DMMP’s 1994 Screening Level(SL) and Maximum Level (ML) values based on a query of all data in the DAISdatabase (total of 97 surveys) including sediments from dredging projects in PugetSound, Grays Harbor, and Willipa Bay. Query conducted in November 1997.
Other Information Related to Bioaccumulation Potential
· Karickhoff and Long (1995). EPA Internal Report on Summary of Measured,Calculated, and Recommended Log Kow values Prepared for Elizabeth Southerland.April 10, 1995.
Summarizes measured and modeled log Kow values reported in the literature fornumerous organic compounds. For each chemical, a single log Kow value isrecommended based on an approach that considers measured, calculated and estimatedvalues from the literature (U.S. EPA, 1996). This approach was applied to an array ofnon-ionic organic chemicals and released as a draft internal report to EPA’s Office ofWater. The draft report is now under review by an interagency committee chargedwith standardizing log Kow values.
Log Kow values reported in the scientific literature are notoriously variable,particularly for highly hydrophobic compounds (log Kow > 5). Measurement errorappears to be the most significant reason for this variability, whereby values for asingle chemical can vary by an order of magnitude or more. Log Kow values havebeen provided in earlier PSDDA documents (e.g., PSDDA, 1996) and in the finalizedInland Testing Manual (EPA/COE, 1998). However, neither of these sourcesprovided log Kow values for all the chemicals being considered nor were the sources
18
of those values readily apparent. Karickhoff and Long’s recommended values,although only available in a draft report, were deemed a preferable source of LogKows for the purposes of this report since they covered nearly all of the chemicalspresented2 and were derived by applying best professional judgement to all of theavailable data.
· Howard, P.H., R.S. Boethling, W.F. Jarvis, W.M. Meylan, and E.M. Michalenko(1991) Handbook of Environmental Degradation Rates. Lewis Publishers, INC.
Reviews the existing literature and reports rate constants for individual abiotic andbiotic degradation processes for a variety of organic compounds. Established a rangeof half-lives3 for both individual degradation processes and specific environmentalcompartments (soil, surface water, ground water and air). Half-lives for specificenvironmental media reflect observations of the rate of disappearance of the chemicalfrom that particular compartment, without necessarily identifying the mechanism ofloss or accounting for the transport of a chemical between compartments. Thus,overall ranges given are not necessarily representative of a chemical’s actualpersistence within a particular medium. Ranges of half-lives for soil are used in thisreport as a relative measure of persistence with which to compare chemicals.
· Environmental Effects of Dredging Technical Notes: Trophic Transfer andBiomagnification Potential of Contaminants in Aquatic Ecosystems, US Army Corpsof Engineers Waterways Experimental Station, Technical Note EEDP-01-33 (January1995).
Examines the potential of various classes of organic and inorganic chemicals tobiomagnify4 in aquatic systems. Information demonstrating trophic transfer (or thelack thereof) of contaminants in laboratory and field experiments was summarized andcompared to results from published aquatic food web models. General conclusionswere then drawn for various chemicals/classes concerning whether biomagnification isexpected to occur within aquatic systems.
· Aquatic Toxicity Information Retrieval Database (AQUIRE)
2 Log Kow values for 2,6-dichlorobenzonitrile (dichlobenil) and pentachloroanisol were obtained from theHazardous Substances data base.
3 The half-life of a chemical in the environment depends not only on the intrinsic properties of the chemical, butalso on the nature of the surrounding environment. Reported half-lives are highly variable, depending on factorssuch as meteorology, temperature, and the nature of the media and its microbial community. Thus, it is morerealistic to characterize a chemical’s half-life in a particular medium using a range of values.
4 Biomagnification is the phenomenon whereby the concentration of a contaminant increases in the tissues oforganisms at successively higher tropic levels.
19
EPA’s online database of aquatic toxicity information. Developed in 1981, AQUIREsummarizes various forms of toxicity data from literature published primarily duringthe period from 1970 to the present. Bioconcentration factors (BCF)5 are providedfor various marine, estuarine and fresh water species based on exposures that wereeither aqueous, through the diet, or by injection. Results of sediment toxicity testingare not reported in AQUIRE. The AQUIRE database can be accessed on-line bygovernment offices using a variety of methods. There are several commercial vendorswho provide access to AQUIRE by the private sector.
· Verschueren, Karel (1983). Handbook of Environmental Data On OrganicChemicals (Second Edition), Van Nostrand Reinhold Co.
Presents a wide variety of physical, chemical, and biological information on variousorganic chemicals. Fish BCF data are given for 28-day and steady state aqueousexposures. The most commonly tested species for which information is provided arefathead minnow (Pimephales promelas) and bluegill sunfish (Lepomis macrochirus).
· Mackay, D., Shiu, W.Y., and K.C. Ma (1995). Illustrated Handbook of Physical -Chemical Properties and Environmental Fate for Organic Chemicals (Vols. 1 - 4),CRC Press.
Provides physical, chemical, and biological data for similarly structured groups ofchemical substances focusing on those properties that influence the fate of thesechemicals in the air, water, soils, sediments and biota. The log BCFs given are derivedfrom various sources.
Information on the Ecological Effects Associated with Bioaccumulated Chemicals
· Environmental Residue-Effects Database (ERED)
The U.S. Army Corps of Engineers/U.S. Environmental Protection AgencyEnvironmental Residue-Effects database is a compilation of data, taken from theliterature, where biological effects (e.g., reduced survival, growth, etc.) and tissuecontaminant concentrations were simultaneously measured in the same organism.Currently, the database is limited to those instances were biological effects observed inan organism are linked to a specific contaminant within its tissues. Residue-effectsinformation was compiled from studies of freshwater, estuarine, and marine organismsand includes data for numerous organic and inorganic chemicals. ERED is available at
5 A bioconcentration factor is a unitless value that describes the degree to which a chemical can be concentrated inthe tissues of an organism in the aquatic environment where the water is the sole contaminant source. A BCF isthe concentration of the chemical in one or more tissues of the aquatic organism divided by the averageconcentrations of the chemical in the surrounding water.

20
no cost on the COE Waterways Experiment Station’s Web Site(www.wes.army.mil/el/ered). The information provided in Table 6 represents (whereavailable) the lowest tissue concentrations that have been associated with some formof whole organism adverse effects (e.g., reduced survival, growth, or reproduction).Cellular and subcellular response data were not considered. Note that this informationdoes not represent an absolute threshold for effects. Rather, it is intended to serve asan indication of whether and what kind of residue-effects information is available for aparticular chemical, and as a low-end benchmark for comparison with the highestmeasured tissue concentrations from the monitoring data.
RECOMMENDATIONS
Chemicals for Consideration
This report identifies sixty-five chemicals that are recommended for consideration in futureefforts to revise the DMMP’s Bioaccumulative Chemicals of Concern list. Chemicals wereincluded for consideration either because they already appear on the current BCoC list or becausethey exhibit characteristics indicating that they may be of bioaccumulative concern in the State ofWashington. Note, however, that these chemicals do not comprise the final BCoC list. The finallist will reflect modifications based on workgroup recommendations and the DMMP reviewprocess.
Sources of Information on Bioaccumulation
This report draws upon various sources of information describing the bioaccumulativecharacteristics of a set of chemicals. The most important sources include regional chemical-useand monitoring data, and information from the scientific literature describing the persistence,partitioning, bioavailability, and residue-effects relationships. This information is recommended asa starting point, to be used in development of the final BCoC list.
The sources used in this report, however, by no means comprise an exhaustive list of theinformation available for characterizing bioaccumulation. It is recommended that the workgroupalso consider consulting the following on-line sources for general information on thebioaccumulative properties of various compounds:
· Toxicity fact sheets - Agency for Toxic Substances and Disease Registry(www.atsdr.cdc.gov)
· Chemical fact sheets - US EPA Office of Pollution Prevention and Toxics(www.epa.gov/opptintr/chemfact/)
· Environment Writer - The National Safety Council (www.nsc.org/ehc/ewtoppg.htm)· Chemical fact sheets - Spectrum Laboratories Inc. (www.speclab.com/search.html)

21
· Integrated Risk Information System (IRIS) – US EPA(www.epa.gov/ngispgm3/iris/index.html);
· Pesticide information profiles - Extension Toxicology Network(pmep.cce.cornell.edu/profiles/extoxnet/)
Draft Criteria for Developing a Revised BCoC List
Re-evaluating the DMMP’s BCoC list will necessarily involve consideration of a vastarray of physical, chemical and biological information. The question remains, however, as to howa workgroup should use this information in deciding the composition of the BCoC list. It isrecommended that the workgroup adopt specific criteria relating to occurrence, persistence,bioavailability, and bioaccumulative risk (such as those provided below) to be used as weightingfactors in determining the composition of the final BCoC list.
In this section, a set of draft criteria (and their rationale) are presented that are derivedfrom the information sources used in this report. These draft criteria are then applied to the list ofsixty-five chemicals proposed for consideration. Table 7 presents the weight of evidence both for(indicated with “+”) and against (indicated by “-“) including any particular chemical on the revisedBCoC list. A blank signifies the criterion does not apply to a given chemical (e.g., log Kowvalues do not exist for trace metals), the chemical has not been monitored, or no information wasavailable. Note that chemicals used in WA State, but for which monitoring data are lacking, maystill be of concern for the purposes of developing a BCoC list.
· Log Kow greater than 3.5
Chemicals with log Kow values that greater than 3.5 are generally considered likely topartition into organic materials including lipids of organisms.
· Soil half-life greater than 50 days
Provided as a comparable indicator of persistence. Soil values were used because half-lifeinformation was not available for sediments. Fifty days was selected as a threshold based onthe scoring system developed by the Ontario Ministry of the Environment (1993)
· Demonstrated biomagnification in the aquatic food web
Although ability to biomagnify is not a requirement for a chemical to be of concern forbioaccumulation (there are many chemicals which are bioaccumulated at one or more trophiclevels but do not biomagnify between trophic levels), it is, nevertheless, an importantindication of the persistence of a chemical within the food web.

22
· Documented use in the State of Washington
Regional use is a critical consideration, particularly for persistent contaminants that are notcurrently found on the BCoC list or for which limited monitoring information is available. Thisis also useful information for interpreting the relevance of BCoC lists from other regions.
· Detection frequency in marine sediments greater than 10%; greater than 50%; Detected infreshwater sediment
Chemicals that are rarely detected in sediments may be unlikely candidates for the DMMP’srevised BCoC list. These threshold detection frequencies are given as examples and have noparticular significance except to make the distinction between compounds that are detected“regularly”(>10%) and those that are detected “frequently”(>50%).
· SL exceedance frequency in sediments greater than 40%· ML exceedence frequency in sediments greater than 10%
Characterization based on frequency of SL/ML exceedence is an elaboration on the questionof how often and at what levels are chemicals observed in sediments. These thresholdexceedence frequencies are given as examples and have no particular significance except as anindication of when a chemical “frequently” exceeds an SL or ML value.
· Detection in freshwater and marine tissue monitoring programs
Detection in tissues of aquatic organisms is a direct indication of a chemical’s bioavailability.Unfortunately, WA State tissue monitoring data has not yet been comprehensively compiled ina single data base (as has been done with the sediment data) making it difficult to develop andapply criteria based on frequency of detection.
· Residue-effects data available in literature
Chemicals for which research has been performed to determine residue-effects concentrations,typically exhibit some degree of bioaccumulation and toxicity. Furthermore, this informationwould facilitate any future efforts to develop DMMP bioaccumulation guidance.
· Highest measured tissue concentrations equal to or greater than lowest residue-effectsconcentration.
A measured tissue concentration of a chemical that is in excess of a reported residue effectsconcentration is an indication that bioaccumulated levels of that chemical have the potential tocause an adverse ecological effect. Note, however, that the residue effects concentrationsused for comparison in this report are not absolute thresholds for effects.
· Included on bioaccumulative chemicals of concern lists from other national/regionalmonitoring programs.

23
A chemical that is identified to be of bioaccumulative concern nationally, and regionally, isworth further examination by the workgroup.

24
REFERENCES
Bortleson G.C., and D.A. Davis, 1997. Pesticides in Selected Small Streams in the Puget SoundBasin, 1987-1995, USGS Fact Sheet 067-97.
Dredged Material Management Program (DMMP), 1998. Revision of Guidelines forBioaccumulative Chemicals of Concern. Draft Issue Paper prepared for the 1998 SedimentManagement Annual Review Meeting.
EPTA, 1988. Evaluation Procedures Technical Appendix. Prepared by the Corps of Engineers inCooperation with the Environmental Protection Agency, Region 10, and the Washington StateDepartments of Ecology and Natural Resources.
Great Lakes Water Quality Initiative, 1995. Bioaccumulative Chemicals of Concern, from FRVol. 60, no. 56, March 23, 1995.
Howard, P.H., R.S. Boethling, W.F. Jarvis, W.M. Meylan, and E.M. Michalenko (1991).Handbook of Environmental Degradation Rates. Lewis Publishers, Inc.
Karickhoff S.W., and J.M. Long, 1995. EPA Internal Report on Summary of Measured,Calculated, and Recommended Log Kow values, Prepared for Elizabeth Southerland. April 10,1995.
Landolt, M., D. Kalman, A. Nevissi, G. van Belle, K. Van Ness, and F. Hafer, 1987. PotentialToxicant Exposure Among Consumers of Recreationally Caught Fish from Urban Embayments ofPuget Sound: Final Report. NOAA Tech. Memo NOS OMA 33.
Mackay, D., Shiu, W.Y., and K.C. Ma, 1995. Illustrated Handbook of Physical - ChemicalProperties and Environmental Fate for Organic Chemicals (Vols. 1 - 4), CRC Press.
MPR, 1988. Puget Sound Dredged Disposal Analysis (PSDDA) Management Plan Report.Unconfined Open-Water Disposal of Dredged Material, Phases I (Central Puget Sound). Preparedby the Corps of Engineers in Cooperation with the Environmental Protection Agency, Region 10,and the Washington State Departments of Ecology and Natural Resources.
Munn, M.F., and D.J Gruber, 1997. The relationship between land use and organochlorinecompounds in streambed sediment and fish in the Central Columbia Plateau, Washington andIdaho, USA, Environmental Toxicology and Chemistry, Vol. 16, No. 9. pp. 1877-1887.
Ontario Ministry for the Environment, 1993. Primary List of Candidate Substances for Bans,Phase-outs or Reductions - Multimedia Revision, October 1993.

25
PTI, 1991. 1990 Puget Sound Pesticide Reconnaissance Survey, August 1991, EPA 910/9-91-020. Prepared for U.S. EPA Region 10.
PSDDA, 1996. Sediment Bioaccumulation Testing Refinements: Sample Volume Requirements,Simultaneous Co-Testing of Two Species Within a Single Aquarium, and Species Substitution.Clarification paper presented in the 1996 Sediment Management Program Biennial Report(Dredging Years 1994/1995), March 1996.
Puget Sound Estuary Program (PSEP), 1991a. Toxic Contaminants in Puget Sound Wildlife -Literature Review and Recommendations for Research and Monitoring, Sept. 1991, EPA 910/9-91-023. Prepared by PTI for U.S. EPA Region 10.
PSEP, 1991b. Pollutants of Concern in Puget Sound, April 1991, EPA 910/9-91-003. Preparedby PTI for U.S. EPA Region 10.
PSEP, 1991c. Chemical Contamination of Harbor Seal Pups in Puget Sound, September 1991,EPA 910/9-91-003. Prepared by PTI for U.S. EPA Region 10.
PSEP, 1991d. Bioaccumulation of Contaminants in Crab and Clams in Bellingham Bay,September 1991, EPA 910/9-91-042. Prepared by Washington State Department of Ecology.
Research Triangle Institute, 1993. National Listing of State Fish and Shellfish ConsumptionAdvisories and Bans, Research Triangle Park, NC.
Tetra Tech, 1988. Pesticides of Concern in the Puget Sound Basin: A Review of ContemporaryPesticide Usage. Final Report. TC 3338-32. Prepared for U.S. EPA Region 10, Office of PugetSound, Seattle, WA.
U.S. Army Corps of Engineers (COE), 1995. Environmental Effects of Dredging TechnicalNotes: Trophic Transfer and Biomagnification Potential of Contaminants in Aquatic Ecosystems,Technical Note EEDP-01-33, US Army Corps of Engineers Waterways Experimental Station,January 1995.
U.S. Environmental Protection Agency (EPA), 1985. Commencement Bay Nearshore/TideflatsRemedial Investigation. Vols. 1,2,3 and 4. Prepared by the Dept. of Ecology, Olympia, WA andEPA Region 10.
U.S. EPA, 1988. Health Risk Assessment of Chemical Contaminants in Puget Sound Seafood.Prepared by Tetra Tech, Inc., Bellevue, WA.
U.S. EPA, 1995. Guidance for Assessing Chemical Contaminant Data for Use in Fish Advisories:Vol. 1 Fish Sampling and Analysis, 2nd Edition, EPA 823-R-95-007, September 1995.
U.S. EPA, 1996. Draft Protocol for Setting Kow Values, NERL Athens, September 5, 1996.

26
U.S. EPA, 1997. Bioaccumulation Testing and Interpretation for the Purpose of SedimentQuality Assessment: Status and Needs (Draft - August 1997).
U.S. EPA-U.S. COE, 1991. Evaluation of Dredged Material Proposed for Ocean Disposal(Testing Manual). EPA-68-C8-0105. U.S. EPA, Office of Marine and Estuarine Protection,Washington, D.C.
U.S. EPA-U.S. COE, 1998. Evaluation of Dredged Material Proposed for Discharge in Inlandand Waters of the U.S. (Testing Manual). EPA-823-B-98.
U.S. Geological Survey (USGS), 1992. Surface-water Quality Assessment of the Yakima RiverBasin, Washington: Pesticide and Other Trace-Organic-Compound Data for Water, Sediment,Soil, and Aquatic Biota, 1987-91. USGS Report 92-644.
Verschueren, Karel, 1983. Handbook of Environmental Data On Organic Chemicals (SecondEdition), Van Nostrand Reinhold Co.
Washington State Department of Health, 1995. Tier I Report: Development of SQC for theProtection of Human Health. June 1995. Office of Toxic Substances.
Washington State Pesticide Monitoring Program (WSPMP), 1994. Reconnaissance Sampling ofFish Tissue and Sediments (1992), WDOE Pub. No 94-194, December 1994.
WSPMP, 1995. 1993 Fish Tissue and Sediment Sampling Report, October 1995, WDOE Pub. No95-356
WSPMP, 1996. 1994 Fish Tissue and Sediment Sampling Report, WDOE Pub. No 96-352.December 1996.
WSPMP, 1996. Pesticides and PCBs in Marine Mussels - 1995, WDOE Pub. No 96-301, March1996.
WSPMP, 1998. 1995 Fish Tissue and Sediment Sampling Report, WDOE, Olympia, WA.

Table 2. Washington State Pesticide Use and Recommendations for Monitoring
Chemical PS Basin use WA Ag. use PSEP Wildlife PTI Pest. PSEP POC WDOH COCtons/yr (1) tons/yr (2) (3) Recon. (4) (5) group (6)
1,2-Diclorobenzene - 21,3-Diclorobenzene + 31,4-Diclorobenzene + 12,6-dichlorobenzonitrile (dichlobenil) 3.5 +Aldrin + 1Anthracene + 1Antimony + 1Arsenic + 1Benzo(a)anthracene + 1Benzo(a)pyrene + 1Benzo(g,h,i)perylene + 1Benzofluoranthenes + 1Biphenyl 1Bis(2-ethylhexyl) phthalate + 1Butyl benzyl phthalate - 1Cadmium + 1Chlordane 25* + - 2Chlorpyrifos 20 134 +Chromium + 1Chrysene + 1Copper + 1DCPA (dacthal) 22.8DDT (total) + + + 1Diazinon 41.5 5.9 +Dibenzo(a,h)anthracene + 3Dicofol (kelthane) 0.43 0.15Dieldrin + + 2Dimethyl phthalate - 2Di-n-butyl phthalate - 1Di-n-octyl phthalate - 1Endosulfan I/II 7 48.1 + 2Endosulfan sulfateEndrin - 2Ethylbenzene + 2
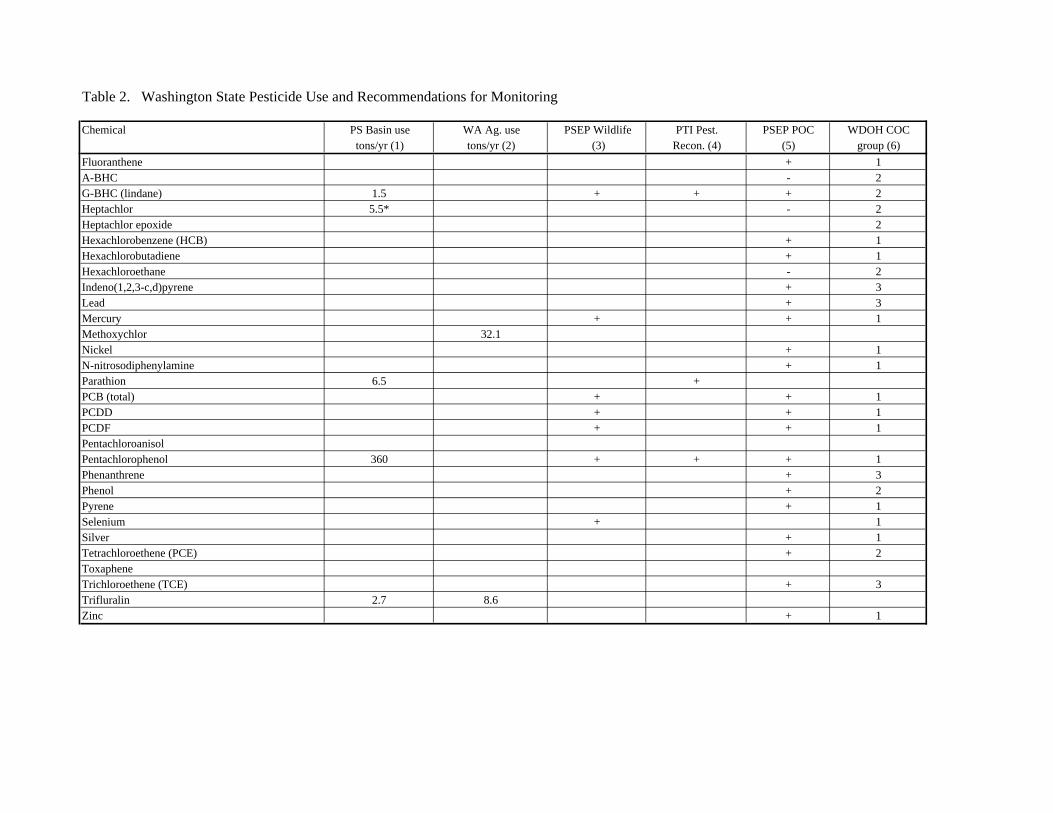
Table 2. Washington State Pesticide Use and Recommendations for Monitoring
Chemical PS Basin use WA Ag. use PSEP Wildlife PTI Pest. PSEP POC WDOH COCtons/yr (1) tons/yr (2) (3) Recon. (4) (5) group (6)
Fluoranthene + 1A-BHC - 2G-BHC (lindane) 1.5 + + + 2Heptachlor 5.5* - 2Heptachlor epoxide 2Hexachlorobenzene (HCB) + 1Hexachlorobutadiene + 1Hexachloroethane - 2Indeno(1,2,3-c,d)pyrene + 3Lead + 3Mercury + + 1Methoxychlor 32.1Nickel + 1N-nitrosodiphenylamine + 1Parathion 6.5 +PCB (total) + + 1PCDD + + 1PCDF + + 1PentachloroanisolPentachlorophenol 360 + + + 1Phenanthrene + 3Phenol + 2Pyrene + 1Selenium + 1Silver + 1Tetrachloroethene (PCE) + 2ToxapheneTrichloroethene (TCE) + 3Trifluralin 2.7 8.6Zinc + 1
27
FOOTNOTES TO TABLES 2-7
All tissue data are given in ppb wet weight units except where noted otherwise.All sediment data are given in ppb dry weight units.NA = not applicable; ND = not detected; NDA = no data available;
(1) Estimated non-urban and urban usage (tons/year) of pesticides in the Puget Sound (PS) Basin fromTetra Tech (1988) Pesticides of concern in the Puget Sound Basin: A review of contemporarypesticide usage. (*) Indicates that compound has been canceled or has restricted use.
(2) Highest yearly agricultural usage (tons/year) on a single crop between 1993-1996. FromWashington Agricultural Chemical Usage Summaries (1993-1996).
(3) Listed as a recommended contaminant of concern for fish and wildlife monitoring in PSEP (1991a)Toxic Contaminants in Puget Sound Wildlife - Literature Review and Recommendations forResearch and Monitoring.
(4) Recommended for sediment monitoring based on sediment data collected from four streams andpresented in PTI (1991) 1990 Puget Sound Pesticide Reconnaissance Survey.
(5) Appears (+) on pollutants of concern (POC) list in PSEP (1991b) Pollutants of Concern in PugetSound. (-) Indicates that compound appeared on list of contaminants of potential concern but wasnot included on the final POC list.
(6) Ranking as a chemical of concern in Washington from WDOH (1995) Tier I Report: Developmentof SQC for the Protection of Human Health. Rankings made according to the followinggroupings: (1) Group 1 chemicals have an EPA toxicity value, Log Kow >3.5, and detectionfrequency > 5% in SEDQUAL urban bay sediment data; (2) Group 2 chemicals have an EPAtoxicity value, and Log Kow < 3.5 or detection frequency< 5% in SEDQUAL; (3) Group 3chemicals have no EPA toxicity values.
(7) Required analytes in tissue testing for determining dredged material suitability in US EPA Region1 (New England).
(8) Required analytes in tissue testing for determining dredged material suitability in US EPA Region2 (New York/New Jersey).
(9) Required analytes in tissue testing for determining dredged material suitability in US EPA Region9 (California/Hawai’i).
(10) The Ontario Ministry for the Environment Primary List of Candidate Substances for Bans, Phase-outs or Reductions (1993). Chemicals on list persist in the environment for greater than 50 days,have BCF values greater than 500, and are toxic to aquatic organisms.
(11) Great Lakes Water Quality Initiative Bioaccumulative Chemicals of Concern from FederalRegister Volume 60, no. 56, March 23, 1995.

28
(12) Recommended Target Analytes from U.S. EPA (1995) Guidance for Assessing ChemicalContaminant Data for Use in Fish Advisories: Volume 1 (second edition). (*) Indicates chemicalsthat are under evaluation for possible future inclusion as recommended target analytes in State fishand shellfish contaminant monitoring programs.
(13) Number of states issuing advisories for contaminants. From Research Triangle Institute 1993.National Listing of State Fish and Shellfish Consumption Advisories and Bans (as of July 22,1993). (*) Indicates that three states have advisories based on fish contaminated with PAHs but noinformation is available on which (if any) particular PAH compounds are the cause of theadvisories.
(14) Ranking as a potential bioaccumulative chemical of concern from U.S. EPA (1997) DraftBioaccumulation Testing and Interpretation for the Purpose of Sediment Quality Assessment:Status and Needs. Rankings indicate: (1) = highest priority, (2) = will be researched when newfunds available; (3) = on list but no plans to researched further for this effort.
(15) Maximum concentrations of contaminants detected in the blubber and/or liver tissue of seal pups.From PSEP (1991c) Chemical Contamination of Harbor Seal Pups in Puget Sound. (*) Indicatesdata quality questionable due to unusually high detection limit.
(16) Maximum concentrations of contaminants detected in crab and clam tissue from the PSEP (1991d)Bioaccumulation of Contaminants in Crab and Clams in Bellingham Bay.
(17) Maximum concentrations of pesticides and PCBs detected in fish tissue from the WSPMP (1994)Reconnaissance Sampling of Fish Tissue and Sediments (1992).
(18) Maximum concentrations of pesticides and PCBs detected in fish tissue from the WSPMP (1995)1993 Fish Tissue Sampling Report.
(19) Maximum concentrations of pesticides and PCBs detected in fish tissue from the WSPMP (1996)1994 Fish Tissue and Sediment Sampling Report.
(20) Maximum concentrations of pesticides and PCBs detected in fish tissue from the WSPMP (1998)1995 Fish Tissue and Sediment Sampling Report.
(21) Maximum concentrations of pesticides and PCBs detected in marine mussels from the WSPMP(1996).
(22) Maximum fish and shellfish residues reported in various studies as summarized in WDOH (1995)Tier I Report: Development of SQC for the Protection of Human Health.
(23) Frequency of detection and exceedances of 1994 Screening Level (SL) and Maximum Level (ML)values among urban bay stations in the SEDQUAL database (sample basis, n = 2721).
(24) Frequency of detection and exceedances of 1994 Screening Level and Maximum Level valuesamong all surveys in the DAIS database (n = 97 surveys).
(25) DMMP Screening Level (SL) and Maximum Level (ML) values from Sediment ManagementProgram Biennial Report - Dredging Years 1994/1995, Appendix B.

29
(26) Highest concentrations of pesticides detected in fresh water bed sediment as summarized in G.C.Bortleson and D.A. Davis (1997) Pesticides in Selected Small Streams in the Puget Sound Basin,1987-1995.
(27) Highest concentrations measured in fish (F) and/or sediment (S) as reported in USGS (1992)Surface-Water Quality Assessment of the Yakima River Basin, WA 1987-91.
(28) Highest concentrations of pesticides detected in fresh water sediment and fish from the CentralColumbia Plateau as reported in Munn and Gruber (1997) The relationship between land use andorganochlorine compounds in streambed sediment and fish in the Central Columbia Plateau,Washington and Idaho, USA.
(29) Recommended log Kow values from Karickhoff and Long (1995) EPA Internal Report onSummary of Measured, Calculated, and Recommended Log Kow values. (*) Log Kow values for2,6-dichlorobenzonitrile (dichlobenil) and pentachloroanisol were obtained from the HazardousSubstances Data Bank compiled by the National Library of Medicine.
(30) Ranges of half-lives in soil as summarized in Howard et al., (1991) Handbook of EnvironmentalDegradation Rates. (*) Indicates that range of soil half-life values for 2,6-dichlorobenzonitrile(dichlobenil) obtained from the Hazardous Substances Data Bank compiled by the NationalLibrary of Medicine.
(31) Biomagnification potential based on information from Table 1 in COE (1995) EnvironmentalEffects of Dredging Technical Notes: Trophic Transfer and Biomagnification Potential ofContaminants in Aquatic Ecosystems.
(32) Lowest tissue concentrations at which adverse effects have been observed for aquatic organismsfrom the COE/EPA Environmental Residue Effect Database (ERED). For each chemical, it isindicated whether ERED includes residue-effects data for freshwater (FW) and/or marine/estuarine(SW) organisms. When available, quantified endpoints are preferentially reported (e.g., LD50 -Lethal dose with 50% mortality, ED50 - sublethal dose with 50% effect). Use of a “less than”symbol (<) indicates that more than one data point of a given type is reported in ERED. Whenquantified effects data are unavailable, the lowest LUED (Lowest unquantified effects dose) valueis reported. When no effects data are available NOED (no observed effects dose) concentrationsare provided. Cellular and subcellular effects data were not considered in this summary. Note thatthis information is not intended to represent an absolute threshold for effects. It is providedhere as an indication of whether and what kind of residue-effects information is available for aparticular chemical, and as a low-end benchmark for comparison with the highest measured tissueconcentrations presented in Tables 4 and 5. All data given in wet weight units. (*) EREDinformation given for total DDT is based on an LD50 for p,p’ DDT.
(33) Range of bioconcentration factors (BCF) are provided as an indication of a chemical’s propensityto bioaccumulate in tissues following exposure to the soluble form of the compound. BCFs forfresh water and marine organisms are from one of the following three sources: (a) Mackay et al.,Illustrated Handbook of Physical - Chemical Properties and Environmental Fate for OrganicChemicals, (b) Hazardous Substances Data Bank compiled by the National Library of Medicine,(c) Verschueren (1983). Handbook of Environmental Data on Organic Chemicals, and (d) EPA'sAQUIRE database.

Table 3. Chemicals Appearing On Other Bioaccumulative Chemicals Of Concern Lists
Chemical Region 1 Region 2 Region 9 Ontario GLWQI USEPA # States with EPA Status(7) (8) (9) (10) (11) (12) Advisories (13) ranking (14)
1,2-Diclorobenzene 31,3-Diclorobenzene 31,4-Diclorobenzene + + 32,6-dichlorobenzonitrile (dichlobenil)Aldrin + + + + + 1Anthracene + + + + * 3AntimonyArsenic + + + * 1 1Benzo(a)anthracene + + + + * * 1Benzo(a)pyrene + + + + * * 1Benzo(g,h,i)perylene + + + + * * 1Benzofluoranthenes + + + * * 1BiphenylBis(2-ethylhexyl) phthalateButyl benzyl phthalateCadmium + + + + + 2 1Chlordane + + + + + + 24 1Chlorpyrifos + 1Chromium + + + 1 1Chrysene + + + * *Copper + + + 1 1DCPA (dacthal) 3DDT (total) + + + + + + 9 1Diazinon + 1Dibenzo(a,h)anthracene + + + * * 3Dicofol (kelthane) + 1Dieldrin + + + + + + 3 1Dimethyl phthalateDi-n-butyl phthalateDi-n-octyl phthalateEndosulfan I/II + + + + + 3Endosulfan sulfate + + + +Endrin + + + + 3Ethylbenzene

Table 3. Chemicals Appearing On Other Bioaccumulative Chemicals Of Concern Lists
Chemical Region 1 Region 2 Region 9 Ontario GLWQI USEPA # States with EPA Status(7) (8) (9) (10) (11) (12) Advisories (13) ranking (14)
Fluoranthene + + + * * 1A-BHC + + + 3G-BHC (lindane) + + + + + 3Heptachlor + + + + 1Heptachlor epoxide + + + + 1 3Hexachlorobenzene (HCB) + + + + 2 2Hexachlorobutadiene + 1 3Hexachloroethane 3Indeno(1,2,3-c,d)pyrene + + + * * 3Lead + + + * 4 1Mercury + + + + + + 27 1Methoxychlor + 3Nickel + + + 1N-nitrosodiphenylamineParathionPCB (total) + + + + + 31 1PCDD + + + + + + 22 1PCDF + + + + + 22 1Pentachloroanisol 3Pentachlorophenol + 1 1Phenanthrene + + * * 1PhenolPyrene + + + * * 1Selenium + + 5 1Silver + + 1TBT + + 1 1Tetrachloroethene (PCE)Toxaphene + + + + + 2 1Trichloroethene (TCE)Trifluralin + 3Zinc + + + 1 1

Table 4. Tissue Monitoring Data from WA State
Chemical PSEP Seals Belli Bay WSPMP WSPMP WSPMP WSPMP WSPMP WDOH Tier I(15) Crab/Clam (16) 1994 (17) 1995 (18) 1996 (19) 1998 (20) Mussels (21) sum. data (22)
1,2-Diclorobenzene ND1,3-Diclorobenzene ND < 530 1,4-Diclorobenzene ND ND2,6-dichlorobenzonitrile (dichlobenil)Aldrin ND ND ND ND ND ND ND NDAnthracene ND ND < 130Antimony < 14,400Arsenic < 132 < 5600 < 32,000 Benzo(a)anthracene ND ND <310 Benzo(a)pyrene ND ND <240 Benzo(g,h,i)perylene ND ND <21 Benzofluoranthenes ND ND <330 BiphenylBis(2-ethylhexyl) phthalate ND < 9100 Butyl benzyl phthalate NDCadmium <6.1 < 230 < 1610Chlordane ND ND < 97 < 36 < 33 < 36 < 1.2 Chlorpyrifos ND ND ND ND ND < 28 NDChromium < 2330Chrysene ND ND < 360 Copper < 26,800 <204 ppmDCPA (dacthal) < 5 < 25 < 150 < 0.33DDT (total) < 74 ND <1700 < 707 < 2800 < 3728 <17 < 410Diazinon ND ND ND ND NDDibenzo(a,h)anthracene ND ND < 58 Dicofol (kelthane) < 50 ND ND ND NDDieldrin ND ND < 42 < 10 < 13 < 44 < 0.7 NDDimethyl phthalate ND < 260 Di-n-butyl phthalate ND < 67 Di-n-octyl phthalate ND < 1700Endosulfan I/II ND ND ND ND ND ND < 36 < 3Endosulfan sulfate ND ND ND < 8 ND < 11 < 7.9 Endrin ND ND ND ND ND NDEthylbenzene < 48

Table 4. Tissue Monitoring Data from WA State
Chemical PSEP Seals Belli Bay WSPMP WSPMP WSPMP WSPMP WSPMP WDOH Tier I(15) Crab/Clam (16) 1994 (17) 1995 (18) 1996 (19) 1998 (20) Mussels (21) sum. data (22)
Fluoranthene ND ND < 970A-BHC <180 ND ND ND < 0.38 ND ND < 6G-BHC (lindane) ND ND < 8 < 1 < 0.44 ND ND < 0.66Heptachlor ND ND ND < 0.5 ND ND ND NDHeptachlor epoxide ND ND < 8.3 < 8.2 < 14 ND NDHexachlorobenzene (HCB) ND ND < 20 < 10 < 5.7 < 0.45 < 29 Hexachlorobutadiene ND < 70 Hexachloroethane NDIndeno(1,2,3-c,d)pyrene ND ND < 23Lead < 48.2 < 290 < 11.2 ppmMercury <2200 < 160 < 1500Methoxychlor ND ND ND ND < 1.2 ND NDNickel < 78.4 < 6500N-nitrosodiphenylamine ND NDParathion ND ND ND ND NDPCBs (total) < 23,000 ND < 379 < 1230 < 99 < 314 < 46 < 2100PCDD < 0.064PCDF < 0.019Pentachloroanisol ND ND ND NDPentachlorophenol ND ND ND ND < 480 Phenanthrene ND ND < 740Phenol ND NDPyrene ND ND < 920 Selenium < 1050 < 8500Silver < 203 < 340TBTTetrachloroethene (PCE) < 230 Toxaphene ND* ND ND ND < 240 NDTrichloroethene (TCE) NDTrifluralin < 14Zinc ND < 130 ppm

Table 5. Sediment and Tissue Monitoring Data from WA State
Chemical SEDQUAL (23) DAIS (24) PSDDA 1994 (25) USGS/WDOE USGS Yakima USGS % detected % > SL % > ML % detected % > SL % > ML SL ML (26) (27) East WA (28)
1,2-Diclorobenzene 3.5 46.5 1.4 0.7 20 0 19 350 ND (S)1,3-Diclorobenzene 4.2 4.6 NA 0.1 0 NA 170 NA ND (S)1,4-Diclorobenzene 9.2 56.6 6.3 1.7 15.4 7.7 26 260 ND (S)2,6-dichlorobenzonitrile (dichlobenil) NA NA NA NA NA NA NA NA < 40Aldrin 3.3 15.8 NA 22.7 17.8 NA 10 NA < 40 (F) ND (S) ND (F) (S)Anthracene 65.4 50.8 11.1 45 14 1.8 130 1300 ND (F) < 99 (S)Antimony 68.9 17.0 1.7 69.1 1.4 0.2 20 200Arsenic 92.5 10.9 2.6 90.5 0.5 0 57 700Benzo(a)anthracene 81.3 41.8 6.5 65 14 0.21 450 4500 < 130 (S)Benzo(a)pyrene 78.1 33.5 3.1 62.3 6 0 680 6800 < 10 (F) < 160 (S)Benzo(g,h,i)perylene 62.1 26.5 2.0 48.1 3.7 0 540 5400 ND (F) < 160 (S)Benzofluoranthenes 80.0 47.3 8.6 63.6 15.4 0 800 8000 ND (F) < 340 (S)Biphenyl 86.50 NA NA NA NA NA NA NABis(2-ethylhexyl) phthalate 57.7 7.3 NA 66.1 2.3 NA 3100 NAButyl benzyl phthalate 28.1 12.2 NA 13.2 1 NA 470 NA < 360 (S)Cadmium 80.5 41.4 1.9 87.2 24.3 0 0.96 9.6Chlordane 0.6 25.0 NA 7.5 30.8 NA 10 NA < 25 < 30 (F) < 15 (S) < 53 (F) < 8 (S)Chlorpyrifos NA NA NA NA NA NA NA NAChromium 97.5 NA NA NA NA NA NA NAChrysene 84.4 41.6 6.1 70.5 11.3 0 670 6700 ND (F) < 160 (S)Copper 99.1 36.0 NA 98.2 14.3 0.14 81 810DCPA (dacthal) NA NA NA NA NA NA NA NA < 67 (F) < 58.5 (S)DDT (total) NDA NDA NDA 36.4 46.6 9.2 6.9 69 < 40 < 3400 (F) < 1700 (S) < 3000 (F) < 77 (S)Diazinon NA NA NA NA NA NA NA NA < 10 Dibenzo(a,h)anthracene 44.5 40.5 4.9 20.4 81.8 0 120 1200 ND (S)Dicofol (kelthane) NA NA NA NA NA NA NA NA < 300 (F)Dieldrin 2.8 14.6 NA 20.3 32.9 NA 10 NA <170 (F) <47 (S) < 260 (F) < 10 (S)Dimethyl phthalate 16.0 16.7 NA 3.9 7.1 NA 160 NA ND (S)Di-n-butyl phthalate 24.2 7.8 NA 13.8 1 NA 1400 NA < 160 (S)Di-n-octyl phthalate 15.8 5.2 NA 8.54 0 NA 6200 NA < 190 (S)Endosulfan I/II 0.0 NA NA NA NA NA NA NA < 20 <70 (S) ND (F) (S)Endosulfan sulfate 0.0 NA NA NA NA NA NA NAEndrin 0.5 NA NA NA NA NA NA NA ND (F) < 17 (S) < 10 (F) ND (S)Ethylbenzene 4.3 57.7 19.2 2.1 42.9 21.4 10 50

Table 5. Sediment and Tissue Monitoring Data from WA State
Chemical SEDQUAL (23) DAIS (24) PSDDA 1994 (25) USGS/WDOE USGS Yakima USGS % detected % > SL % > ML % detected % > SL % > ML SL ML (26) (27) East WA (28)
Fluoranthene 88.1 49.7 9.3 76.3 18.6 1.62 63 6300 < 50 (F) < 120 (S)A-BHC 0.0 NA NA NA NA NA NA NA ND (F) ND (F) (S)G-BHC (lindane) 0.8 58.3 NA 12.9 1.1 NA 10.0 NA ND (F) ND (S) ND (F) < 5 (S) Heptachlor 2.4 17.5 NA 3.9 18.5 NA 10.0 NA ND (F) ND (S) ND (F) (S)Heptachlor epoxide 0.7 NA NA NA NA NA NA NA < 20 (F) < 2 (S) < 23 (F) < 4.5 (S)Hexachlorobenzene (HCB) 11.3 32.8 8.7 4.4 3.1 0.0 23.0 230.0 ND (F) ND (S) < 33 (F) < 6 (S)Hexachlorobutadiene 9.3 36.8 11.9 0.1 100 0 29 290 ND (S)Hexachloroethane 3.4 9.8 0.0 0 0 0 1400 14000 ND (S)Indeno(1,2,3-c,d)pyrene 65.4 74.2 1.8 48.5 52.8 0 69 5200 ND (S)Lead 95.6 35.9 4.4 93.5 16.9 0 66 660Mercury 80.5 48.9 3.1 82.3 26.8 0.66 0.21 2.1Methoxychlor 0.0 NA NA NA NA NA NA NA < 10 (S) ND (F) (S)Nickel 98.1 1.1 NA 97.8 1 NA 140 NAN-nitrosodiphenylamine 4.6 63.4 15.9 0.6 0 0 28 220 ND (S)Parathion 0.0 NA NA NA NA NA NA NAPCB (total) 62.7 51.5 3.7 44.8 46.8 4.7 130 2500 < 820 (F) ND (S)PCDD 94.7 NA NA NA NA NA NA NAPCDF 84.2 NA NA NA NA NA NA NA < 900 (F) < 700 (S)Pentachloroanisol NA NA NA NA NA NA NA NA ND (F) (S)Pentachlorophenol 7.6 31.1 6.7 1.4 40 0 100 690 < 40 < 1200 (S)Phenanthrene 77.4 43.9 8.6 67.3 13.5 1.2 320 3200 < 90 (F) K6< 140 (S)Phenol 29.9 49.0 5.9 21.8 19.4 0 120 1200 < 870 (S)Pyrene 88.2 59.2 8.4 79.5 31 1.04 430 7300 ND (F) < 190 (S)Selenium 36.2 NA NA NA NA NA NA NASilver 69.6 18.3 2.6 65.6 6.6 0.62 1.2 6.1TBT 90.4 NA NA NA NA NA NA NATetrachloroethene (PCE) 5.9 50.0 13.3 0.1 0 0 14 210Toxaphene 0.0 NA NA NA NA NA NA NA < 1200 (F) ND (S) ND (F) (S)Trichloroethene (TCE) 4.4 16.3 12.2 0 0 0 160 1600Trifluralin NA NA NA NA NA NA NA NAZinc 97.3 23.0 3.1 98.5 13.7 0 160 1600

Table 6. Other Information Related to Bioaccumulation Potential and Information on the Ecological Effects Associated with Bioaccumulated Chemicals
Chemical Log kow Soil 1/2 life Biomag. ERED BCF(29) days (30) Pot. (31) residue-effect concs. (32) (33)
1,2-Diclorobenzene 3.43 28 - 180 NO FW LD100 >138 ppm 40-28,000 (a)1,3-Diclorobenzene 3.53 28 - 180 NO FW ED50 1440 ppm 66-10,000 (a)1,4-Diclorobenzene 3.42 28 - 180 NO FW ED100 > 47 ppm 60-400,000 (a)2,6-dichlorobenzonitrile (dichlobenil) 2.74 * 133-196 * FW NOED 2 ppm 15-53 (b)Aldrin 6.5 21 - 592 NO FW LD/ED50 0.8 ppm 350-4500 (c)Anthracene 4.55 50 - 460 NO FW NOED 45.5 ppm 7-16,600 (a)Antimony NA NA NDA 0.1-14 (d)Arsenic NA NA YES FW LD50 > 8.1 ppm NDABenzo(a)anthracene 5.7 102 - 680 NO FW NOED 17.5 ppm 347-100,000 (a)Benzo(a)pyrene 6.11 57 - 530 YES FW&SW ED50 > 2.1 ppm 13-9 mil. (a)Benzo(g,h,i)perylene 6.7 590 - 650 NO NDA 28,000-350,000 (a)Benzofluoranthenes 6.2 360 - 2140 NO NDA 2-140,000 (a)Biphenyl 4.84 1.5 - 7 FW&SW ED50 15.6 ppm 436 (c)Bis(2-ethylhexyl) phthalate 7.3 5 - 23 NO NDA 20-107,700 (d)Butyl benzyl phthalate 4.84 1 - 7 NO NDA 663 (c)Cadmium NA NA NO FW&SW ED100 > 0.83 ppm 1-5000 (d)Chlordane 6.32 238 -1386 NO NDA 108-7300 (c)Chlorpyrifos 5.26 17 - 119 FW&SW ED38 0.4 ppm 42-28,300 (d)Chromium NA NA NO FW LD50 55ppm 20-40 (CrVI) (d)Chrysene 5.7 371 - 1000 NO FW NOED 2.6 ppm 6-52,000 (a)Copper NA NA NO FW&SW ED100 > 1.6 ppm 37-51,500 (d)DCPA (dacthal) 4.4 18 - 92 NDA NDADDT (total) 6.1-6.7 730 - 6250 YES FW&SW LC50 95 ppm * 700-70,000 (a)Diazinon 3.81 14 - 87 SW ED50 > 0.3 ppm 2-2800 (d)Dibenzo(a,h)anthracene 6.69 361 - 940 NO FW NOED 0.5 ppm 10-70,000 (a)Dicofol (kelthane) 6.06 NA NDA 1600-18,900 (d)Dieldrin 5.37 175 - 1080 YES FW&SW LD50 1.1 700-5500 (c)Dimethyl phthalate 1.57 1 - 7 NO NDA 57 (d)Di-n-butyl phthalate 4.61 2 - 23 NO FW LUED 32 ppm 500-6700(d)Di-n-octyl phthalate 8.06 7 - 28 NO NDA 2600-13,600 (d)Endosulfan I/II 4.1 0.02 - 9 NO NDA 9000-10,000 (d)Endosulfan sulfate 3.66 77 - 140 NDA NDAEndrin 5.06 NA YES FW&SW ED50 > 0.2 ppm 500-13,000 (c)Ethylbenzene 3.14 3 - 10 NDA 5-204 (a)

Table 6. Other Information Related to Bioaccumulation Potential and Information on the Ecological Effects Associated with Bioaccumulated Chemicals
Chemical Log kow Soil 1/2 life Biomag. ERED BCF(29) days (30) Pot. (31) residue-effect concs. (32) (33)
Fluoranthene 5.12 140 - 440 NO FW&SW ED50 > 1.9 ppm 5-80,000 (a)A-BHC 3.8 14 - 135 NO NDA 60-500 (c)G-BHC (lindane) 3.73 14 - 240 NO FW&SW LUED > 0.13 ppm 10-15,000 (d)Heptachlor 6.26 1 - 5 NO SW LD39 10.4 ppm 200-21,000 (a)Heptachlor epoxide 5 33 - 552 SW LD39 8 ppm 200-14,400 (d)Hexachlorobenzene (HCB) 5.89 969 - 2089 NO NDA 1230-290,000 (a)Hexachlorobutadiene 4.81 28 - 180 NDA NDAHexachloroethane 4 28 - 180 FW NOED > 0.86 ppm 139 (d)Indeno(1,2,3-c,d)pyrene 6.65 600 - 730 NO NDA NDALead NA NA NO FW ED50 > 70 ppm 1-12 (d)Mercury NA NA YES FW&SW ED35 > 1.6 ppm 47-27,000 (d)Methoxychlor 5.08 180 - 365 NDA 1-8574 (d)Nickel NA NA NO FW&SW LD50 223 ppm 5000-10,000 (d)N-nitrosodiphenylamine 3.16 10 - 34 FW NOED 2 ppm 217 (d)Parathion 3.83 10 - 168 FW&SW LD50 > 0.3 ppm 60-747 (d)PCBs (total) vary vary YES FW&SW LD33 1.1 ppm NDAPCDD vary vary NO FW LD50 > 6.5E-5 ppm NDAPCDF vary vary FW NOED 9E-5 ppm NDAPentachloroanisol 5.45 * NA NDA 9100-20,000 (b)Pentachlorophenol 5.09 23 - 178 NO FW&SW LD100 >13.8 ppm 40-5600 (a)Phenanthrene 4.55 16 - 200 NO FW&SW ED50 > 30.7 ppm 6-25,000 (a)Phenol 1.48 1 - 10 NDA 17-123,000 (a)Pyrene 5.11 210 - 1900 NO FW&SW ED50 189 ppm 5-44,600 (a)Selenium NA NA YES FW LD35 1.6 ppm 0.3-322 (d)Silver NA NA NO SW LUED > 1650 ppm 16-16,000 (d)TBT NA NA FW&SW LD50 > 0.57 ppm NDATetrachloroethene (PCE) 2.67 180 - 360 FW NOED 0.17 ppm 40-115 (a)Toxaphene 5.5 NA YES FW&SW LD90 36 ppm 400-152,000 (d)Trichloroethene (TCE) 2.71 180 - 360 FW NOED > 0.14 ppm 17-40 (a)Trifluralin 5.34 21 - 190 NDA 1030-6000 (c)Zinc NA NA YES FW&SW ED100 130 ppm 3-8800 (d)

Tab
le 7
. R
ecom
men
ded
Cri
teri
a fo
r D
evel
opin
g a
BC
oC L
ist
Che
mic
al
Log Kow > 3.5 (29)
Soil 1/2 life > 50 days (30)
Biomagnifies (31)
Pesticides Used in Puget Sound Basin (1)
Pesticides Used in Eastern Washington (2)
Marine Sediment Detection Frequency > 10% (23,24)
Marine Sediment Detection Frequency > 50% (23,24)
SL Exceedences > 40% (23,24)
ML Exceedences > 10% (23,24)
Detected in Fresh water Sediment (26,27,28)
Detected in Marine Tissue Monitoring (15,16,21,22)
Detected in Fresh Water Tissue Monitoring (16-
20,27,28)
Residue-Effects Data in Literature
Highest Tissue Concs. > tissue LOEDs from ERED
(32)
Included on COC Lists From Other
National/Regional Tissue Monitoring Programs
1,2-
Dic
loro
benz
ene
-+
--
+-
--
+-
-
1,3-
Dic
loro
benz
ene
++
--
--
-+
+-
-
1,4-
Dic
loro
benz
ene
-+
--
+-
--
+-
+2,
6-di
chlo
robe
nzon
itrile
(di
chlo
beni
l)-
++
--
--
-+
+-
-
Ald
rin
++
--
+-
--
--
-+
-+
Ant
hrac
ene
++
++
++
++
-+
-+
Ant
imon
y+
+-
-+
--
Ars
enic
++
+-
-+
++
+B
enzo
(a)a
nthr
acen
e+
++
++
-+
++
-+
Ben
zo(a
)pyr
ene
++
++
+-
-+
++
+-
+B
enzo
(g,h
,i)pe
ryle
ne+
++
+-
-+
+-
-+
Ben
zofl
uora
nthe
nes
++
++
+-
++
--
+B
iphe
nyl
+-
++
+-
-
Bis
(2-e
thyl
hexy
l) p
htha
late
+-
++
-+
--
But
yl b
enzy
l pht
hala
te+
-+
--
+-
--
Cad
miu
m+
++
-+
++
+C
hlor
dane
++
--
--
-+
++
-+
Chl
orpy
rifo
s+
++
+-
-+
+-
+C
hrom
ium
+
++
+-
+C
hrys
ene
++
++
+-
++
-+
-+
Cop
per
++
-+
++
+D
CPA
(da
ctha
l)+
+-
++
++
--

Table 7. Recommended Criteria for Developing a BCoC List
Chemical
Log K
ow > 3.5 (29)
Soil 1/2 life > 50 days (30)
Biom
agnifies (31)
Pesticides U
sed in Puget
Sound Basin (1)
Pesticides U
sed in Eastern
Washington (2)
Marine Sedim
ent Detection
Frequency > 10%
(23,24)
Marine Sedim
ent Detection
Frequency > 50%
(23,24)
SL E
xceedences > 40%
(23,24)
ML
Exceedences > 10%
(23,24)
Detected in F
resh water
Sediment (26,27,28)
Detected in M
arine Tissue
Monitoring (15,16,21,22)
Detected in F
resh Water
Tissue M
onitoring (16-20 ,27,28)
Residue-E
ffects Data in
Literature
Highest T
issue Concs. >
tissue LO
ED
s from E
RE
D
(32)
Included on CO
C L
ists F
rom O
ther N
ational/Regional T
issue M
onitoringP
rograms
DDT (total) + + + - - + - + - + + + + - +Diazinon + + + + + - + - +Dibenzo(a,h)anthracene + + + - + - - + + - +Dicofol (kelthane) + + + - + - +Dieldrin + + + - - + - - + + + + - +Dimethyl phthalate - - + - - - + - -
Di-n-butyl phthalate + - + - - + + + - -
Di-n-octyl phthalate + - + - - + + - -
Endosulfan I/II + - + + - - + + - - +Endosulfan sulfate + + - - + + - +Endrin + + - - - - + - + + - +Ethylbenzene - + - - + + + - -
Fluoranthene + + + + + - + + + + - +A-BHC + + - - - + + - +G-BHC (lindane) + + + - + - + - + + + - +Heptachlor + - - - - - - - - + + - +Heptachlor epoxide + + - - + - + + - +Hexachlorobenzene (HCB) + + + - - - - + + - +Hexachlorobutadiene + + - - + + - + - +Hexachloroethane + + - - - - - - + - -
Indeno(1,2,3-c,d)pyrene + + + + + - - + - +Lead + + - - + + - +

Tab
le 7
. R
ecom
men
ded
Cri
teri
a fo
r D
evel
opin
g a
BC
oC L
ist
Che
mic
al
Log Kow > 3.5 (29)
Soil 1/2 life > 50 days (30)
Biomagnifies (31)
Pesticides Used in Puget Sound Basin (1)
Pesticides Used in Eastern Washington (2)
Marine Sediment Detection Frequency > 10% (23,24)
Marine Sediment Detection Frequency > 50% (23,24)
SL Exceedences > 40% (23,24)
ML Exceedences > 10% (23,24)
Detected in Fresh water Sediment (26,27,28)
Detected in Marine Tissue Monitoring (15,16,21,22)
Detected in Fresh Water Tissue Monitoring (16-
20,27,28)
Residue-Effects Data in Literature
Highest Tissue Concs. > tissue LOEDs from ERED
(32)
Included on COC Lists From Other
National/Regional Tissue Monitoring Programs
Mer
cury
++
++
-+
++
+M
etho
xych
lor
++
-+
--
+-
+-
+N
icke
l+
+-
-+
+-
+N
-nitr
osod
iphe
nyla
min
e-
--
-+
+-
-+
--
Para
thio
n+
++
--
--
-+
--
PCB
(to
tal)
++
++
++
-+
++
++
PCD
D+
++
++
++
+PC
DF
++
++
++
++
++
Pent
achl
oroa
niso
l+
--
--
Pent
achl
orop
heno
l+
++
--
-+
-+
+-
+-
+Ph
enan
thre
ne+
++
++
-+
++
+-
+Ph
enol
--
+-
+-
+-
--
Pyre
ne+
++
++
-+
+-
+-
+Se
leni
um+
+-
++
++
Silv
er+
+-
-+
+-
+T
ribu
tyl t
in+
++
-+
Tet
rach
loro
ethe
ne (
PCE
)-
+-
-+
++
+-
-
Tox
aphe
ne+
+-
--
--
-+
+-
+T
rich
loro
ethe
ne (
TC
E)
-+
--
-+
-+
--
Tri
flur
alin
++
++
+-
+Z
inc
++
+-
-+
++
+
30
ADDITIONAL FOOTNOTES TO TABLE 7
(+) Meets criteria(-) Does not meet criteria.Blank signifies that the criterion does not apply to a given chemical, the chemical has not been monitored,or that no information was available.LOED - Lowest Observed Effect DoseCOC - Contaminants of Concern

CLARIFICATION PAPER
SEDIMENT BIOACCUMULATION TESTING REFINEMENTS: SAMPLE VOLUME REQUIREMENTS, SIMULTANEOUS CO-TESTING OF TWO SPECIES WITHIN A SINGLE AQUARIUM, AND SPECIES SUBSTITUTION
David Kendall (Corps of Engineers) for the PSDDA agencies.
INTRODUCTION
To be consistent with Environmental Protection Agency / U.S. Army Corps of Engineers guidance contained in the 1994 draft "Inland Testing Manual" (EPA/COE, 1994), the PSDDA program adopted bioaccumulation testing with two species (ARM 1994 Issue paper). The two species must represent different trophic niches: a suspension-feeding/filter-feeding organism and a burrowing deposit-feeding organism. A test exposure of 28 days is followed by tissue analysis for chemicals of human health and ecological effects concern following the EPA protocol (Lee et al., 1993; ASTM 1995). Ecological effects are evaluated through a statistical comparison with a reference area sediment.
A bioaccumulation test will be conducted on those dredged materials in which a "reason to believe" has been established that specific chemicals of concern may be accumulated in the tissues of target organisms. A bioaccumulation test using two species is required if any one of twenty-nine identified chemicals of concern are shown to have concentrations exceeding the bioaccumulation trigger value established under the PSDDA program (Table 1). These values establish the "reason to believe" levels for chemicals likely to bioaccumulate in marine organisms. Organic compounds with octanol water partition coefficients (Kow) greater than 5.5 are considered much more likely to bioaccumulate in tissues than less hydrophobic chemicals (Table 1).
PROBLEM IDENTIFICATION
Sediment volume requirements. There has been some confusion concerning the amount of sediment needed to conduct the bioaccumulation test. The PSDDA program generally requires applicants to address contingencies for exceedances of biological testing triggers including bioaccumulation testing in their sampling and analysis plan. In high concern areas, PSDDA agencies generally recommend archiving sufficient sample for potential biological testing (acute/chronic bioassays and bioaccumulation tests) requirements. Sediment archival requirements necessary to conduct the 28-day bioaccumulation test are quite onerous as depicted in Table 2 below. Depending on the species selected, the total test sediment volume requirement can exceed 32.5 liters for each dredged material management unit (DMMU) if each of the two required species are tested separately. A similar volume must also be collected and archived for the reference sediment and negative control sediment. Large projects can become unmanageable with respect to sampling volumes and storage requirements needed.

Table 1. Sediment chemistry trigger values for bioaccumulation testing.
CHEMICAL log Kow CONCENTRATION METALS (ppm dry weight basis)
Antimony NA 146 Arsenic NA 507.1
Mercury NA 1.5 Nickel NA 1,022 Silver NA 4.6
ORGANIC COMPOUNDS (ppb dry weight basis) Fluoranthene 5.5 4,600
Benzo(a)pyrene 6.0 4,964 1,2-Dichlorobenzene 3.4 37 1,3-Dichlorobenzene 3.4 1,241
1,4-Dichlorobenzene 3.5 190 Dimethyl phthalate 1.6 1,168
Di-n-butyl phthalate 5.1 10,220 Bis(2-ethylhexyl) phthalate 4.2 13,870 Hexachloroethane 3.9 10,220
Hexachlorobutadiene 4.3 212 Phenol 1.5 876
Pentachlorophenol 5.0 504 Ethylbenzene 3.1 27 N-Nitrosodiphenylamine 3.1 161
Hexachlorobenzene 5.2 168 Tributyltin - 219
Trichloroethene 3.9 1,168 Tetrachloroethene 2.4 10 Total DDT (5.7 - 6.0) 50
Aldrin 3.0 37 Chlordane 6.0 37
Dieldrin 5.5 37 Heptachlor 5.4 37

Total PCBs (4.0 - 6.9) 38 (carbon-normalized)
Note: Polychlorinated dibenzodioxins (PCDDs) and polychlorinated dibenzofurans (PCDFs) may also require bioaccumulation testing, although no bioaccumulation trigger has been established for PCDDs and PCDFs. The requirement to conduct bioaccumulation testing will be made by the agencies utilizing best professional judgment after reviewing the Tier II data.
Table 2. Species specific testing volume requirements.
Species Sediment Volume Requirements
Macoma nasuta
>250 ml/beaker x 10 beakers/8 L-aquarium = 2.5 L/aquarium
5 replicate aquaria = >12.5-20 liters
Nereis virens
200 mL per worm x 20 worms per 20 gallon aquarium = 4 L/aquarium
5 replicate aquaria = >20 liters
Arenicola marina or Abarenicola sp.
>500 mL per beaker x 4 beakers per 8 L-aquarium = 2 L/aquarium
5 replicate aquaria = >10 liters
Co-testing:
Macoma/Nephtys
3.87 L per 37.8 liter aquarium (10 gallon)
5 replicate aquaria = >20 liters
Because of the prohibitively high volumes of material needed to conduct this test with two species, dredging applicants may elect not to archive material necessary to conduct the bioaccumulation test against the risk of exceeding a chemical bioaccumulation trigger. If a bioaccumulation trigger is exceeded for one or more of the twenty-nine chemicals of concern, an applicant must remobilize to collect the sediment needed to conduct the bioaccumulation test.
In the event resampling is necessary the sediment sample must be reanalyzed for the chemical(s) exceeding bioaccumulation triggers to properly assess the actual test exposure levels. A recent experience where resampling was necessary resulted in a five-fold difference between the initial and resampled sediment chemical concentration. In the this case, the agencies, utilizing best professional judgment, adjusted the bioaccumulation tissue concentrations proportionally upward based on the ratio between the first and second round sediment chemical concentrations.

Species substitution /Co-testing of two species. The current PSDDA testing protocol calls for conducting a 28-day bioaccumulation test with a facultative deposit/suspension-feeding adult bivalve (Macoma nasuta) and a deposit- feeding adult polychaete (i.e., either Nereis virens or Arenicola marina/Abarenicola sp. Conducting bioaccumulation tests with either of the aforementioned adult polychaete species will gene rally require conducting separate tests (e.g., adult bivalve and adult polychaete tests).
The "Green Book", (EPA/COE, 1991) also recognizes Nephtys sp. as an approved adult polychaete species suitable for evaluating acute toxicity and bioaccumulation concerns in dredged material for ocean disposal. Nephtys sp. may be conducted in aquaria with Macoma nasuta. The PSDDA agencies recently conducted a successful bioaccumulation test co-testing Macoma nasuta and Nephtys caecoides within the same aquaria following the protocol developed by Battelle (1992). This reduced sediment testing volume requirements and setup costs. The general co-testing setup volume requirements are noted in Table 2.
PROPOSED ACTION/MODIFICATION
To provide flexibility and enable co-testing of two species in a single testing chamber (aquarium), the PSDDA program will allow the substitution of Nephtys sp. in place of either Nereis virens or Arenicola/Abarenicola sp. when conducting the bioaccumulation test. Applicants proposing to co-test species within the same aquarium should follow the Battelle (1992) protocol, and must articulate their bioaccumulation testing approach in a PSDDA approved sampling and analysis plan.
Applicants electing not to archive samples for potential bioaccumulation testing, and where resampling is necessary to accomplish bioaccumulation testing, will be required to reanalyze the targeted chemical(s) triggering the bioaccumulation testing.
REFERENCES
ASTM 1995. Designation: E-1688-95. Standard guide for determination of bioaccumulation of sediment associated contaminants by benthic invertebrates. 1995 Annual Book of ASTM Standards. Vol 11.05. Biological Effects and Environmental Fate: Biotechnology; Pesticides.
Battelle, 1992. Ecological evaluation of proposed discharge of dredged material from Oakland Harbor into ocean waters (Phase III A of -42 foot Project). Volume 1: Analyses and Discussion. Prepared by J.A. Ward; J.Q. Word; M.R. Pinza; H.L. Mayhew; E.S. Barrows; and L.F. Lefkovitz, Pacific Northwest Laboratory for U.S. Army Corps of Engineers under Contract DE-AC06-76RL) 1830.
EPA/COE. 1991. Evaluation of dredged material proposed for ocean disposal - Testing Manual ("Green Book"). Prepared by the United States Environmental Protection Agency, and the Department of the Army, U.S. Army Corps of Engineers.

EPA/COE. 1994. Evaluation of dredged material proposed for discharge in Inland and Near Coastal Waters - Inland Testing Manual (Draft). Prepared by the United States Environmental Protection Agency, and the Department of the Army, U.S. Army Corps of Engineers.
EPTA, 1988. Evaluation Procedures Technical Appendix. Prepared by the Corps of Engineers in cooperation with the Environmental Protection Agency, Region 10, and the Washington State Departments of Ecology and Natural Resources.
Lee, R, B.L. Boese, J. Pelletier, M Winsor, D.T. Specht, and R.C. Randall. 1993. Guidance Manual: Bedded Sediment Bioaccumulation Tests. U.S. Environmental Protection Agency, Pacific Ecosystems Branch, Bioaccumulation Team, Newport, OR. EPA-600/R-93-193.

ISSUE PAPER
REFINEMENTS TO BIOACCUMULATION TESTING REQUIREMENTS: ADOPTION OF SECOND TEST SPECIES FOR CONSISTENCY WITH NATIONAL GUIDANCE
David Kendall (Corps of Engineers) for the PSDDA agencies.
INTRODUCTION
The PSDDA program requirements for bioaccumulation testing currently require a single 28-day test using the facultative deposit-feeding adult bivalve, Macoma nasuta to evaluate human and ecological health concerns [1]. The current guidance specifies how human health assessments will be done but does not provide specificity on how ecological health assessments will be conducted. The 1993 draft Inland (404) Testing Manual and 1991 "Green Book" (Ocean Dumping Guidance Manual) provide additional guidance on how bioaccumulation testing should be conducted on dredged material [2,3].
The current human health sediment guidelines used by the PSDDA program were developed for deep water disposal sites somewhat removed from natural resources and human resource conflict areas. Future human health sediment criteria being developed by Ecology and the Department of Health may significantly alter the chemicals of concern list, testing triggers and action levels used in regulating dredged material and contaminated sediments.
Development of these criteria are mandated as part of the State of Washington's Sediment Management Standards (SMS, WAC 173-204) [4]. The standards developed must consider the adverse impacts of contaminated sediments on the environment (aquatic, and other organisms) and on human beings. The criteria are being developed and are expected to be in draft form sometime during 1994 for review.
Subsequent to adoption by Ecology through the rule-making process, the new criteria will be implemented in Puget Sound. They may replace the current "reason to believe" sediment bioaccumulation triggers (BTs) and human health interpretive guidelines. The PSDDA program will continue to use the BTs and interpretive guidance specified in the Evaluation Procedures Technical Appendix and Phase II Management Plan Report.
PROBLEM IDENTIFICATION
The PSDDA program is currently out of compliance with national Corps/EPA guidance, and needs to adopt a second bioaccumulation test species to provide a better assessment of bioaccumulation potential. Current national guidance specified in the draft Inland Testing Manual calls for conducting bioaccumulation tests using appropriately sensitive species from two trophic niches, and representing a suspension-feeding/filter- feeding organism and the other a burrowing deposit- feeding organism [2].

The PSDDA program also needs to update its bioaccumulation testing requirements consistent with current national guidance contained within the Green Book and draft Inland Testing Manual [1,2]. However, bioaccumulation testing guidance and human health criteria development are in a state of flux at the national and regional level, and will not be finalized for at least another year. Therefore, formal changes to the bioaccumulation test evaluation and test interpretation guidelines would better be addressed in the future after these issues are finalized. Until more definitive guidance is adopted, the PSDDA agencies will use best professional judgment to conduct bioaccumulation testing and test interpretation.
PROPOSED ACTION/MODIFICATION
To be consistent with national Corps/EPA guidance the PSDDA program proposes to add an additional bioaccumulation test to the current test suite using a deposit- feeding adult polychaete (i.e., either Nereis virens or Arenicola marina). This will augment the test currently conducted with the adult facultative deposit- feeding bivalve, Macoma nasuta.
Conducting Tier III 28-day bioaccumulation tests on a dredged material management unit will require two separate tests using the adult bivalve, Macoma nasuta, and an adult polychaete (Nereis virens or Arenicola marina). The test exposure duration will be 28 days utilizing the EPA protocol [5], after which a chemical analysis will be conducted of the tissue residue to determine the concentration of selected chemicals of human health concern triggering the test. The results of the test sediment tissue assays will assess ecological effects through a statistical comparison with bioaccumulation results from a suitable reference area sediment. Protocols for tissue digestion and chemical analysis will follow the PSEP-recommended procedures for metals and organic chemicals [6,7].
REFERENCES
1. EPTA, 1988. Puget Sound Dredged Disposal Analysis (PSDDA) Evaluation Procedures Technical Appendix. Prepared by the Corps of Engineers in cooperation with the Environmental Protection Agency Region X, and the Washington State Departments of Ecology and Natural Resources.
2. Inland Testing Manual, 1993. Evaluation of Dredged Material Proposed for Discharge in Inland and Near Coastal Waters - testing Manual (Draft) - Inland Testing Manual. Prepared by the United States Environmental Protection Agency, and the Department of the Army, U.S. Army Corps of Engineers.
3. Green Book, 1991. Evaluation of Dredged Material Proposed for Ocean Disposal - Testing Manual. EPA-503/8-91/001, Washington, D.C. Prepared by United States Environmental Protection Agency, and the Department of the Army, U.S. Army Corps of Engineers.
4. SMS, 1991. Sediment Management Standards. Chapter 173-204 WAC, April 1991. Prepared by Washington State Department of Ecology.
5. Lee, H., B.L. Boese, J. Pelliter, M. Winsor, D.T. Specht, and R.C. Randall. 1989. Guidance Manual: Bedded Sediment Tests. U.S. Environmental Protection Agency, Pacific Ecosystems Branch, Bioaccumulation Team, Newport, OR. EPA-600/x-89-302.
6. PSEP. 1989. Recommended guidelines for measuring metals in Puget Sound water, sediment, and tissue samples. Prepared for Puget Sound Estuary Program by PTI Environmental Services. In: Recommended Protocols for Measuring Selected Environmental Variables in Puget Sound. U.S. Environmental Protection Agency, Region 10, Seattle, WA.
7. PSEP. 1989. Recommended guidelines for measuring organic compounds in Puget Sound sediment and tissue samples. Prepared for Puget Sound Estuary Program by PTI Environmental Services. In: Recommended Protocols for Measuring Selected Environmental Variables in Puget Sound. U.S. Environmental Protection Agency, Region 10, Seattle, WA.