sediment and waste deposition in new york harbor
TRANSCRIPT
SEDIMENT AND WASTE DEPOSITION IN NEW YORK HARBOR*
M. Grant Gross?
Marine Sciences Research Center The State University of New York
Stony Brook, New York 1 1 790
Introduction
Since the first settlement of Manhattan Island in 1625, man has worked steadily to change the Hudson Estuary. Some of these changes were deliberate: shores were bulkheaded, and docks were built to make the estuary more useful as a port. Other changes were unintentional but inevitable; small streams were changed into covered sewers, and large streams into dredged channels and sometimes open sewers.
Initially these changes were small and they affected only the area immediate- ly around Manhattan. With the development of the steam engine and the introduction of large-scale dredging in the late 188Os, these changes to the Hudson Estuary have grown in size. In 1972 these changes were large enough to affect the entire Hudson Estuary and the adjoining New York Bight.
In this paper the physical alterations of the Hudson River estuary are discussed. Particular attention is paid to the sediments and waste deposits that covered much of the harbor bottom and large areas of New York Bight in 1972. From these two examples we can see the importance of man as a geologic and oceanographic agent.
Hudson Estuary and New York Harbor
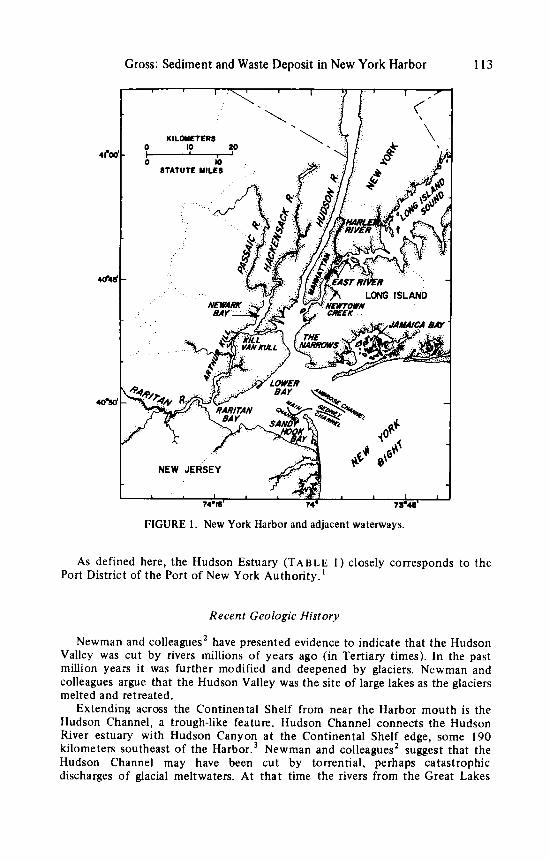
New York Harbor occupies the Hudson Estuary and its adjoining waterways, a complex of estuaries and tidal straits that include western Long Island Sound (FIGURE 1). Water, wastes, and sediment move throughout this system, which must be considered as a single unit, influenced by the Hudson River and the New York Metropolitan Region. We might also include a large part of the New York Bight, a triangular segment of coastal ocean that lies between Long Island and New Jersey. That part of the coast is obviously affected by the Hudson River and New York City. In this larger sense, I include the following waterways within the Hudson Estuary:
Lower Bay (including Raritan Bay and Sandy Hook Bay, but excluding
New York Bight, within 6 miles of the Harbor entrance; Upper Bay and Newark Bay (including Kill Van Kull and Arthur Kill); Lower Hudson River (between the Battery and Tappan Zee Bridge); East River (Battery to Throgs Neck); Western Long Island Sound (between Harts Island and Throgs Neck
Jamaica Bay);
Bridge).
*This research was suggested in part by the Solid Waste Research Division of the Environmental Protection Agency and by the Coastal Engineering Center of the United States Army Corps of Engineers.
thesent address: National Science Foundation, Washington, D.C. 20550.
112
Gross: Sediment and Waste Deposit in New York Harbor 113
FIGURE 1. New York Harbor and adjacent waterways.
As defined here, the Hudson Estuary (TABLE I ) closely corresponds to the Port District of the Port of New York Authority.'
Recent Geologic History
Newman and colleagues* have presented evidence to indicate that the Hudson Valley was cut by rivers millions of years ago (in Tertiary times). In the past million yeais it was further modified and deepened by glaciers. Newman and colleagues argue that the Hudson Valley was the site of large lakes as the glaciers melted and retreated.
Extending across the Continental Shelf from near the Harbor mouth is the Hudson Channel, a trough-like feature. Hudson Channel connects the Hudson River estuary with Hudson Canyon at the Continental Shelf edge, some 190 kilometers southeast of the H a r b ~ r . ~ Newman and colleagues' suggest that the Hudson Channel may have been cut by torrential, perhaps catastrophic discharges of glacial meltwaters. At that time the rivers from the Great Lakes
114 Annals New York Academy of Sciences
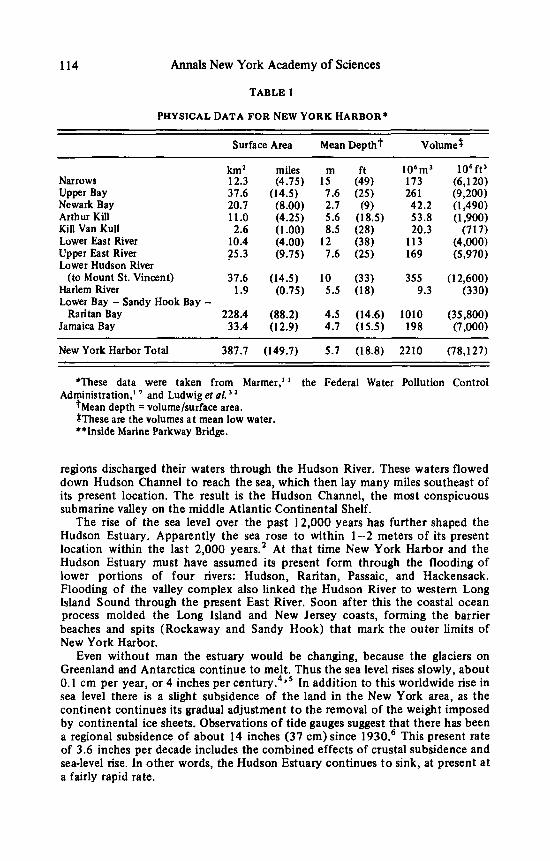
TABLE 1
PHYSICAL DATA FOR NEW YORK HARBOR*
Surface Area Mean Depth? Volume$
km’ Narrows 12.3 Upper Bay 37.6 Newark Bay 20.7 Arthur Kill 11.0 Kill Van Kull 2.6 Lower East River 10.4 Upper East River 25 .3 Lower Hudson River
(to Mount St. Vincent) 37.6 Harlem River 1.9 Lower Bay - Sandy Hook Bay -
Raritan Bay 228.4 Jamaica Bay 33.4
miles (4.75)
(14.5) (8.00) (4.25) (1 .OO) (4.00) (9.75)
(14.5) (0.75)
(88.2) (12.9)
m
7.6 2.7 5.6
15
8.5 12 7.6
10 5.5
4.5 4.7
1 0 ~ 173 26 1 42.2 53.8 20.3
113 169
355 9.3
1010 198
New York Harbor Total 387.7 (149.7) 5.7 (18.8) 2210 (78,127)
*These data were taken from Marmer,’ ’ the Federal Water Pollution Control
?Mean depth = volume/surface area. $These are the volumes at mean low water. **Inside Marine Parkway Bridge.
Administration,’ ’ and Ludwig et of. *
regions discharged their waters through the Hudson River. These waters flowed down Hudson Channel t o reach the sea, which then lay many miles southeast of its present location. The result is the Hudson Channel, the most conspicuous submarine valley on the middle Atlantic Continental Shelf.
The rise of the sea level over the past 12,000 years has further shaped the Hudson Estuary. Apparently the sea rose to within 1-2 meters of its present location within the last 2,000 years.* At that time New York Harbor and the Hudson Estuary must have assumed its present form through the flooding of lower portions of four rivers: Hudson, Raritan, Passaic, and Hackensack. Flooding of the valley complex also linked the Hudson River t o western Long Island Sound through the present East River. Soon after this the coastal ocean process molded the Long Island and New Jersey coasts, forming the barrier beaches and spits (Rockaway and Sandy Hook) that mark the outer limits of New York Harbor.
Even without man the estuary would be changing, because the glaciers on Greenland and Antarctica continue to melt. Thus the sea level rises slowly, about 0.1 cm per year, or 4 inches per ~ e n t u r y . ~ ’ ’ In addition to this worldwide rise in sea level there is a slight subsidence of the land in the New York area, as the continent continues its gradual adjustment t o the removal of the weight imposed by continental ice sheets. Observations of tide gauges suggest that there has been a regional subsidence of about 14 inches (37 cm) since 1930.6 This present rate of 3.6 inches per decade includes the combined effects of crustal subsidence and sea-level rise. In other words, the Hudson Estuary continues t o sink, at present a t a fairly rapid rate.
Gross: Sediment and Waste Deposit in New York Harbor 115
Human Influence
Although the Hudson Estuary was primarily shaped by geological processes during the past 15,000 years, human activities over the past 350 years have modified those outlines substantially by ( 1) bulkheading the shoreline; (2) build- ing docks, piers, and railroad terminals; (3) filling wetlands and small streams; (4) dredging channels for navigation and anchorage areas; and (5) producing sand and gravel.
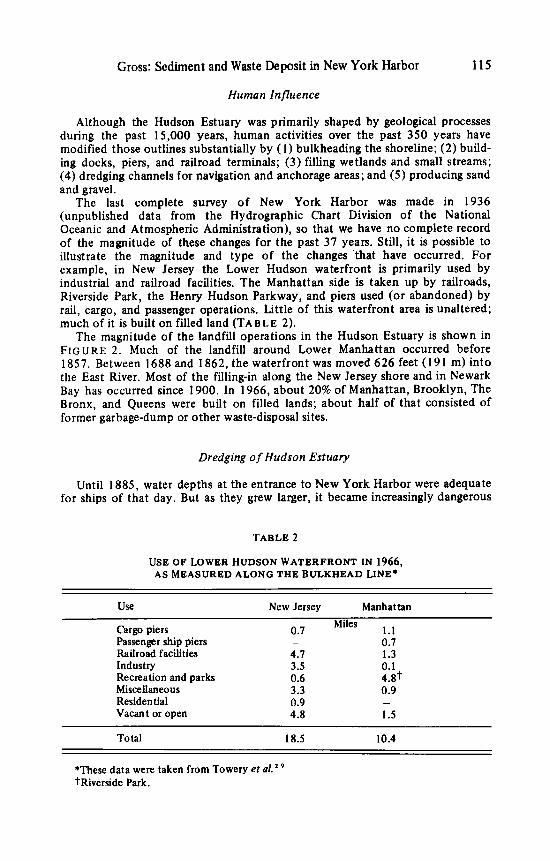
The last complete survey of New York Harbor was made in 1936 (unpublished data from the Hydrographic Chart Division of the National Oceanic and Atmospheric Administration), so that we have no complete record of the magnitude of these changes for the past 37 years. Still, it is possible to illustrate the magnitude and type of the changes ‘that have occurred. For example, in New Jersey the Lower Hudson waterfront is primarily used by industrial and railroad facilities. The Manhattan side is taken up by railroads, Riverside Park, the Henry Hudson Parkway, and piers used (or abandoned) by rail, cargo, and passenger operations. Little of this waterfront area is unaltered; much of it is built on filled land (TABLE 2).
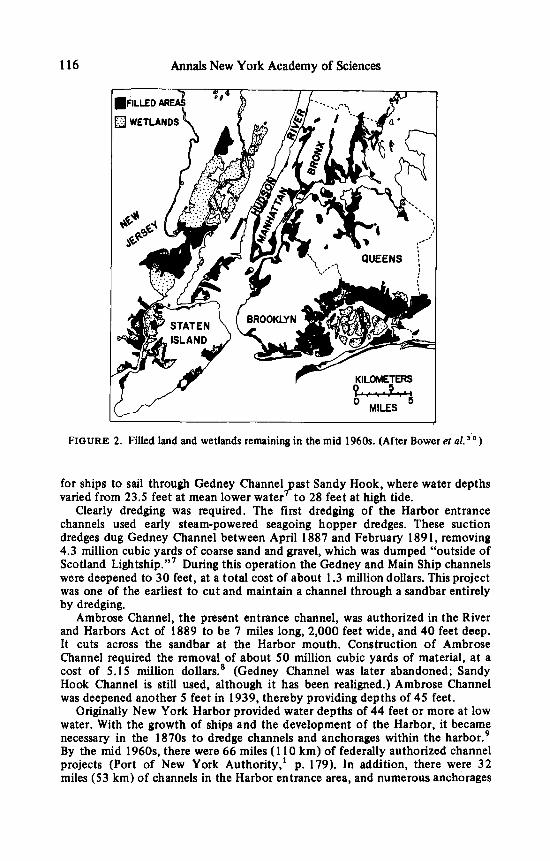
The magnitude of the landfill operations in the Hudson Estuary is shown in F I G U R E 2. Much of the landfill around Lower Manhattan occurred before 1857. Between 1688 and 1862, the waterfront was moved 626 feet (191 m) into the East River. Most of the filling-in along the New Jersey shore and in Newark Bay has occurred since 1900. In 1966, about 20% of Manhattan, Brooklyn, The Bronx, and Queens were built on filled lands; about half of that consisted of former garbage-dump or other waste-disposal sites.
Dredging of Hudson Estuary
Until 1885, water depths at the entrance to New York Harbor were adequate for ships of that day. But as they grew larger, it became increasingly dangerous
TABLE 2
USE OF LOWER HUDSON WATERFRONT IN 1966, A S MEASURED ALONG THE BULKHEAD LINE*
Use New Jersey Manhattan Miles l.l Cargo piers 0.1
Passenger ship piers - 0.1 Railroad facilities 4.7 1.3 Industry 3.5 0.1 Recreation and parks 0.6 4.8t Miscellaneous 3.3 0.9 Residential 0.9 - Vacant or open 4.8 1.5
Total 18.5 10.4
*These data were taken from Towery et uf.’ ’ ?Riverside Park.
116 Annals New York Academy of Sciences
FIGURE 2. Filled land and wetlands remaining in the mid 1960s. (After Bower et al. ‘1
for ships to sail through Gedney Channel past Sandy Hook, where water depths vaned from 23.5 feet at mean lower water’ to 28 feet at high tide.
Clearly dredging was required. The first dredging of the Harbor entrance channels used early steam-powered seagoing hopper dredges. These suction dredges dug Gedney Channel between April 1887 and February 189 1 , removing 4.3 million cubic yards of coarse sand and gravel, which was dumped “outside of Scotland Lightship.”’ During this operation the Gedney and Main Ship channels were deepened to 30 feet, at a total cost of about 1.3 million dollars. This project was one of the earliest to cut and maintain a channel through a sandbar entirely by dredging.
Ambrose Channel, the present entrance channel, was authorized in the River and Harbors Act of 1889 to be 7 miles long, 2,000 feet wide, and 40 feet deep. It cuts across the sandbar at the Harbor mouth. Construction of Ambrose Channel required the removal of about 50 million cubic yards of material, at a cost of 5.15 million dollars.* (Gedney Channel was later abandoned; Sandy Hook Channel is still used, although it has been realigned.) Ambrose Channel was deepened another 5 feet in 1939, thereby providing depths of 45 feet.
Originally New York Harbor provided water depths of 44 feet or more at low water. With the growth of ships and the development of the Harbor, it became necessary in the 1870s to dredge channels and anchorages within the harbor.’ By the mid 1960s, there were 66 miles ( 1 10 km) of federally authorized channel projects (Port of New York Authority,’ p. 179). In addition, there were 32 miles (53 km) of channels in the Harbor entrance area, and numerous anchorages
Gross: Sediment and Waste Deposit in New York Harbor 117
for vessels throughout the harbor complex. In all, more than 26 square miles (67 sq k m ) of Harbor bottom were involved in these projects. As we shall see later, some of these projects require maintenance dredging every yerr (Lower Hudson River, Ambrose Channel). Others (The Narrows, East River) require little or n o dredging t o maintain water depths adequate for navigation.
The effects of dredging on the Harbor are not easily documented. I t seems highly probable that the larger channels at the Harbor entrance have increased exchange of waters between Lower Bay and New York Bight. The best evidence of this change in water movement comes from the change in annual tidal ranges at Fort Hamilton (at The Narrows), where the tidal range chan ed from 4.49 feet in 1893-1895 t o 4.8 feet in 1903-1907 (Schureman,Fo p. 41; and Marmer' ' ).
It should be pointed out that the dredging of the Hudson River had even more dramatic effects on the tides. Cutting a 400-foot ( 1 20-m) wide, 27-foot (8.2-m) deep channel through rock and sandbars between the Town of Hudson and Albany resulted in a greatly increased tidal range. During the years in which this dredging was carried out , the tidal range a t Albany increased from 2.37 feet (0 .722m)in 1926 to4 .01 f e e t ( 1 . 2 2 m ) i n 1930."
Water Movements
Because of its complicated geometry, and its connections to New York Bight and through the East River to Long Island Sound, the Hudson Estuary has a complicated current regime.' ' Tides enter the Harbor from the open Atlantic Ocean (coming through Lower Bay) and from Long Island Sound (coming through the East River). The tidal range and phasing of the tides from these areas differ. For example, the ebb (southward-setting) tide from the East River begins 1.5 hours before slack tide, and the ebb begins in the Hudson River.12 Marmer' ' discusses tides and tidal currents in the Harbor.
A second factor that influences the currents in New York Harbor is the complicated bottom topography. For example, sills (submerged ridges) in the East River and Hudson River greatly affect the movements of near-bottom waters. The sill a t Hell Gate effectively blocks the westward flow of near-bottom waters from western Long Island Sound.I3 The constriction at the George Washington Bridge affects the movement of near-bottom currents, and very probably the movement and deposition of sediment in the Lower Hudson River. ' '
Thirdly, the excess outflow of low salinity water from the Hudson and other rivers, combined with local precipitation and sewage discharge, sets up an estuarine circulation in the Harbor. That circulation in turn controls the movements of sediments and waste solids in the region.
Estuarine circulation is a two-layered flow system. Lower salinity water is commonly less dense than seawater in the New York Bight. Therefore the river discharge tends t o flow over the seawater, forming a less saline surface layer. Because o f friction between the t w o moving layers, tidal currents and irregularities of the Harbor bottom, and winds, the two layers are mixed. The resulting mixed water is less saline than the original seawater and thus moves up into the surface layers; this process is known as entrainment. At this point we have two layers. One is the less saline surface, which tends to move seaward out of the Harbor. The other is the subsurface layer, which tends t o flow into the Harbor to replenish the salt water entrained in the surface layer.
118 Annals New York Academy of Sciences
Materials dissolved in river water, or in sewage plant effluents, move seaward with the surface layers, unless they are removed by organisms (primarily phytoplankton) or incorporated into sediment particles that later settle out. This circulation is thus a sediment trap, and tends to retain biologically or chemically reactive materials. Particles that settle out of the surface layers fall into subsurface layers, to be moved landward by the estuarine circulation. Such materials tend to accumulate where the landward moving subsurface layer is limited by some constriction, or where the landward movement is balanced by the seaward flow of river water. In the Hudson Estuary, sediment accumulates in the lower Hudson River near the George Washington Bridge, where the river is constricted by its rocky shores. Navigation channels in that segment of the river require maintenance dredging every year in order t o maintain the desired water depths.' ' Apparently a similar situation does not occur in the East River. There stronger tidal currents and greater turbulence prevent massive accumulation of sediment. It also appears that less sediment is supplied t o the East River.
The central point about water flows in the Hudson Estuary, or indeed in any system in which the discharge of low -salinity water exceeds evaporation, is that the flow in the estuary has a major influence on the movement of particles and of any substance that is likely to become associated with these particles.
Sediment Sources
Sediments deposited in the Hudson River estuary come from several sources: riverborne sediment and particulate wastes; littoral drift of sands along beaches; direct dumping of waste solids in the Harbor; and deposition of wastes discharged by sewers and industries located on the estuary. The first two sources are common to most of the world's estuaries. The last two are typically found in urbanized estuaries, and are particularly important in the New York Metropol- itan Region.
Rivers in the New York-New Jersey region carry sediments derived from their drainage basins through weathering and erosion. In the long-settled and variously developed parts of the river drainage basins, the sediment yield varies substantially. From the woodlands that constitute about one-half of the metropolitan region,' '*I4 the yield of sediment is usually quite low' (around 15 tons per square mile per year). Agricultural regions may produce between 200 and 500 tons per square mile per year. Construction sites, which are common in the suburbs and cities, produce from 1,000 to 100,000 tons per square mile per year.' These activities have increased the sediment yield of streams in northern New Jersey.'
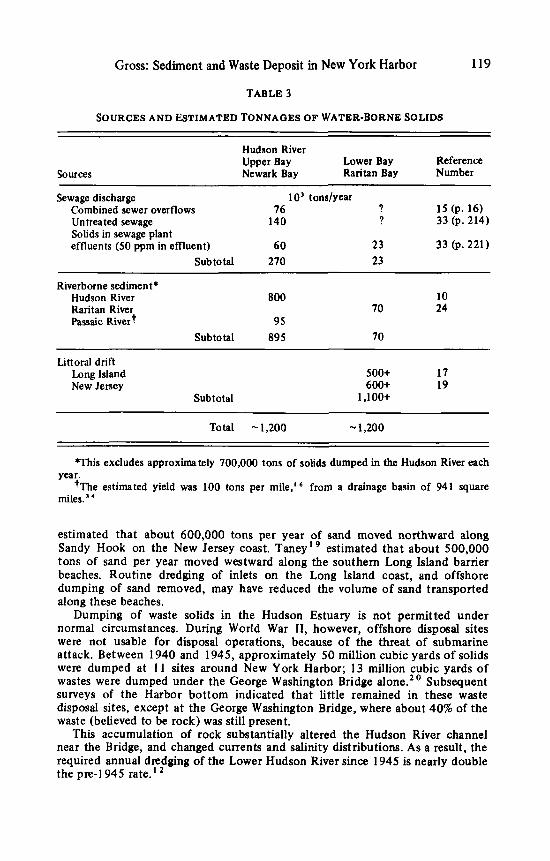
i he Hudson River sediment load is estimated at approximately 800,000 tons per year.' * The sediment yields of other urban streams are estimated at about 70,000 and 95,000 tons per year for the Raritan and Passaic Rivers respectively (TABLE 3).
In addition t o these sediment loads, there are riverborne wastes. Cities around the estuary are major waste contributors." Because of the paucity of data, the river sediment loads are only guesses. They could well be twice as high as these estimated sediment loads, with the volumes of dredging materials taken from the rivers.
Movement of sand along the Long Island-New Jersey beaches contributes sand to the harbor, most of it deposits in the Harbor mouth. This littoral drift of sediment has been studied because of severe beach erosion problems. Caldwell'
Gross: Sediment and Waste Deposit in New York Harbor 119
TABLE 3
SOURCES AND ESTIMATED TONNAGES OF WATER-BORNE SOLIDS
sources
Hudson River Upper Bay Lower Bay Reference Newark Bay Raritan Bay Number
Sewage discharge lo3 tons/year 76 ? 15 (p. 16) Combined sewer overflows
Untreated sewage 140 ? 33 (p. 214) Solids in sewage plant effluents (50 ppm in emuent) 60 23 33 @. 221)
Sub total 270 23
Riverborne sediment* Hudson River 800 Raritan River Passaic Riverf 95
Subtotal 895
10 70 24
70
Littoral drift Long Island New Jersey
Subtotal
500+ 17 600+ 19
1 ,loo+
Total -1,200 -1,200
*This excludes approximately 700,000 tons of solids dumped in the Hudson River each
?The estimated yield was 100 tons per mile,16 from a drainage basin of 941 square year.
miles.’
estimated that about 600,000 tons per year of sand moved northward along Sandy Hook on the New Jersey coast. Taney” estimated that about 500,000 tons of sand per year moved westward along the southern Long Island barrier beaches. Routine dredging of inlets on the Long Island coast, and offshore dumping of sand removed, may have reduced the volume of sand transported along these beaches.
Dumping of waste solids in the Hudson Estuary is not permitted under normal circumstances. During World War 11, however, offshore disposal sites were not usable for disposal operations, because of the threat of submarine attack. Between 1940 and 1945, approximately 50 million cubic yards of solids were dumped at 1 1 sites around New York Harbor; 13 million cubic yards of wastes were dumped under the George Washington Bridge alone.? Subsequent surveys of the Harbor bottom indicated that little remained in these waste disposal sites, except at the George Washington Bridge, where about 40% of the waste (believed to be rock) was still present.
This accumulation of rock substantially altered the Hudson River channel near the Bridge, and changed currents and salinity distributions. As a result, the required annual dredging of the Lower Hudson River since 1945 is nearly double the pre-I945 rate.’ ’
120 Annals New York Academy of Sciences
Some direct disposal of wastes into New York Harbor continues. For example, scows that transport about 10,000 tons of refuse, garbage, and incinerator ash to landfill on Staten Island contribute some wastes, owing to spills and accidents. The Harbor bottom around refuse-transfer stations on the waterfront is commonly covered with refuse.
In addition, the Corps of Engineers issues permits for the disposal of an estimated 700,000 tons of waste solids each year to various disposal sites in the Hudson River (unpublished data from the Supervisor of New York Harbor, United States Army Corps of Engineers). There are no data to indicate whether these wastes remain in the disposal areas or are carried downstream by river currents. Because of this lack of data, I exclude direct waste discharges to the River from my estimates of sediment sources (TABLE 3).
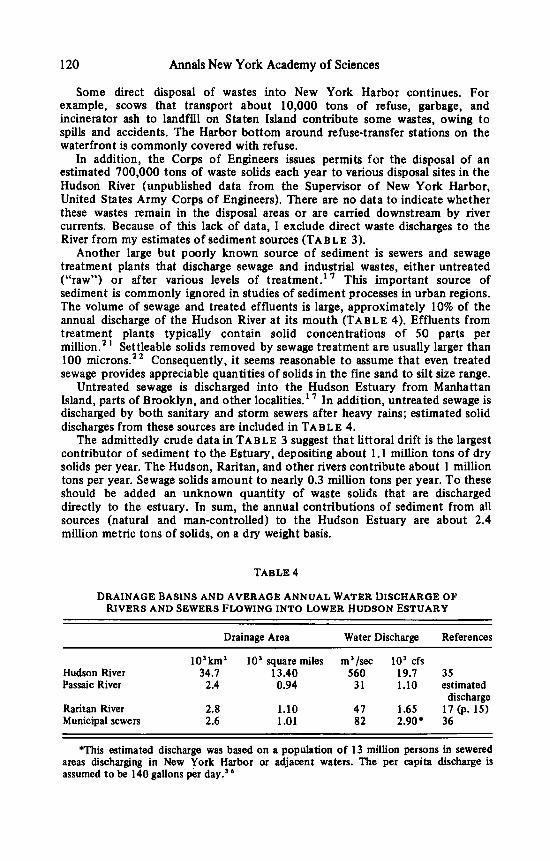
Another large but poorly known source of sediment is sewers and sewage treatment plants that discharge sewage and industrial wastes, either untreated (“raw”) or after various levels of treatment.I7 This important source of sediment is commonly ignored in studies of sediment processes in urban regions. The volume of sewage and treated effluents is large, approximately 10% of the annual discharge of the Hudson River at its mouth (TABLE 4). Effluents from treatment plants typically contain solid concentrations of 50 parts per million.2 ’ Settleable solids removed by sewage treatment are usually larger than 100 microns.22 Consequently, it seems reasonable to assume that even treated sewage provides appreciable quantities of solids in the fine sand to silt size range.
Untreated sewage is discharged into the Hudson Estuary from Manhattan Island, parts of Brooklyn, and other localities.I7 In addition, untreated sewage is discharged by both sanitary and storm sewers after heavy rains; estimated solid discharges from these sources are included in TABLE 4.
The admittedly crude data in TABLE 3 suggest that littoral drift is the largest contributor of sediment to the Estuary, depositing about 1.1 million tons of dry solids per year. The Hudson, Raritan, and other rivers contribute about 1 million tons per year. Sewage solids amount to nearly 0.3 million tons per year. To these should be added an unknown quantity of waste solids that are discharged directly to the estuary. In sum, the annual contributions of sediment from all sources (natural and man-controlled) to the Hudson Estuary are about 2.4 million metric tons of solids, on a dry weight basis.
TABLE 4
DRAINAGE BASINS AND AVERAGE ANNUAL WATER DISCHARGE OF RIVERS AND SEWERS FLOWING INTO LOWER HUDSON ESTUARY
Drainage Area Water Discharge References
i03km2 lo3 square miles m 3 / w lo3 cfs Hudson River 34.7 13.40 560 19.7 35 Passaic River 2.4 0.94 31 1.10 estimated
discharge Raritan River 2.8 1.10 47 1.65 17@. 15) Municipal sewers 2.6 1.01 82 2.90* 36
*This estimated discharge was based on a population of 13 million persons in sewered areas discharging in New York Harbor or adjacent waters. The per capita discharge is assumed to be 140 gallons per day.3
Gross: Sediment and Waste Deposit in New York Harbor 121
Maintenance Dredging in Hudson Estuary
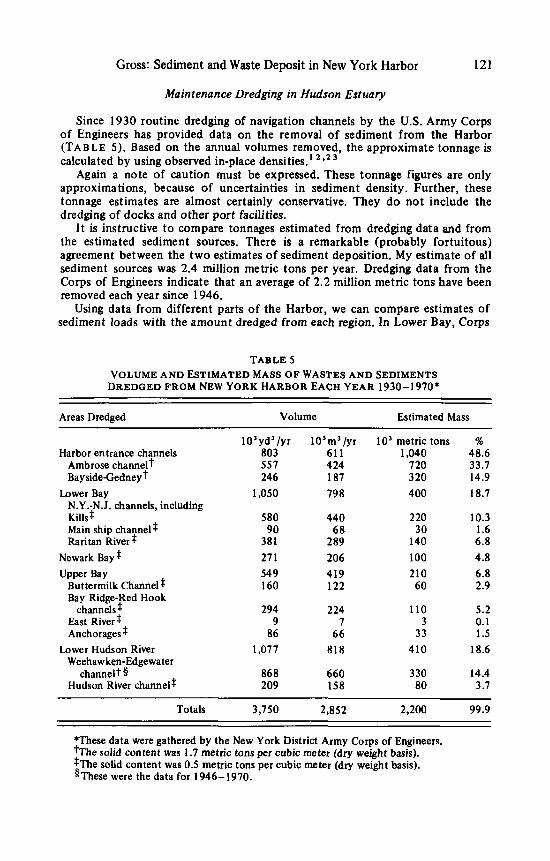
Since 1930 routine dredging of navigation channels by the U.S. Army Corps of Engineers has provided data on the removal of sediment from the Harbor (TABLE 5 ) . Based on the annual volumes removed, the approximate tonnage is calculated by using observed in-place densities.’ ’ >’
Again a note of caution must be expressed. These tonnage figures are only approximations, because of uncertainties in sediment density. Further, these tonnage estimates are almost certainly conservative. They do not include the dredging of docks and other port facilities.
It is instructive to compare tonnages estimated from dredging data and from the estimated sediment sources. There is a remarkable (probably fortuitous) agreement between the two estimates of sediment deposition. My estimate of all sediment sources was 2.4 million metric tons per year. Dredging data from the Corps of Engineers indicate that an average of 2.2 million metric tons have been removed each year since 1946.
Using data from different parts of the Harbor, we can compare estimates of sediment loads with the amount dredged from each region. In Lower Bay, Corps
TABLE 5 VOLUME AND ESTIMATED MASS OF WASTES AND SEDIMENTS DREDGED FROM NEW YORK HARBOR EACH YEAR 1930-1970*
Areas Dredged Volume Estimated Mass
103yd3/yr 103m3/yr lo3 metric tons % Harbor entrance channels 803 61 1 1,040 48.6
BaysideGedney f 246 187 3 20 14.9 Lower Bay 1,050 798 400 18.7
N.Y.-N.J. channels, including Kills$ 580 440 2 20 10.3 Main ship channel$ 90 68 30 1.6 Raritan River * 381 289 140 6.8
Newark Bay $ 27 1 206 100 4.8 Upper Bay 54 9 4 19 210 6.8
Buttermilk Channel$ 160 122 60 2.9 Bay Ridge-Red Hook
channelst 294 2 24 110 5.2
Ambrose channel? 557 4 24 7 20 33.7
East River$ 9 I 3 0.1 Anchorages$ 86 66 33 1.5
Lower Hudson River 1,077 818 410 18.6
channel? 9 86 8 660 330 14.4 Weehawken-Edgewater
Hudson River channel$ 209 158 80 3.7
Totals 3,750 2,852 2,200 99.9
*These data were gathered by the New York District Army Corps of Engineers. ?The solid content was 1.7 metric tons per cubic meter (dry weight basis). *The solid content was 0.5 metric tons per cubic meter (dry weight basis). BThese were the data for 1946-1970.
122 Annals New York Academy of Sciences
of Engineers dredges removed about 1 million tons per year from Sandy Hook and Ambrose channels. This compares remarkably well with the 1.1 million metric tons estimated t o be moving in the littoral drift along New Jersey and Long Island shorelines.
To turn now to the rivers: about 140,000 metric tons have been dredged from the Raritan River, about twice the estimated sediment load around 1 900.2 Assuming that sediments carried by the Passaic and Hackensack rivers deposit in Newark Bay, the dredging data for Newark Bay indicate that these rivers together carry no more than about 100,000 tons per year. In this case the estimate may well be a maximum, since we have no data on other waste discharges into Newark Bay, which is highly industrialized.
The dredging data suggest that about half of the sediment load apparently transported by the Hudson River deposits in Lower Hudson River (between George Washington Bridge and the Battery). If the deposits dredged from Upper Bay are Hudson River sediment, the total Hudson River sediment load could be as much as 600,000 metric tons per year. This is about twethirds of the sediment load estimated by Panuzio.' Clearly it is not possible to evaluate the sediment load of the Hudson River from these data, or t o determine where the sediment deposits. We would, for example, need additional data on sediment accumulation in the Hudson River in the Tappan Zee, t o see whether any significant amount of sediment accumulates there. Nonetheless, the data suggest that Panuzio's estimate of the Hudson River sediment load may be too large, or that part of the sediment is deposited in Western Long Island Sound or New York Bight.
This leaves the question of the importance of sewers and industries as sediment sources. Several navigation channels require frequent dredging and yet have no obvious sediment source; these include the Buttermilk and Bay Ridge-Buttermilk channels between Governors Island and Brooklyn, and the Arthur Kill and Kill van Kull around Staten Island. Perhaps these deposits come from various waste sources. To determine the origin of these deposits, it would be useful t o make more detailed analyses of the chemical and physical characteristics of the deposits to see if they resemble Hudson River sediments or solids from known waste sources, such as sewage treatment plants or industrial operation^.^
In summary, data from maintenance dredging indicate that about 2.2 million metric tons of sediment and waste were removed from New York Harbor each year between 1930 and 1970. About half was dredged from the entrance channels, apparently the result of deposition of sands from littoral drift. The remainder came from sediment transported by rivers, predominantly the Hudson River. Waste solids apparently contribute to the volume of sediment dredged, although the exact contribution cannot be evaluated at this time.
Sand and Gravel Production in New York Harbor
In addition to the removal of bottom materials to provide needed water depths for navigation, extensive dredging for sand and some gravel production has taken place in Lower New York Bay. These sands have been used primarily for hydraulic fill.
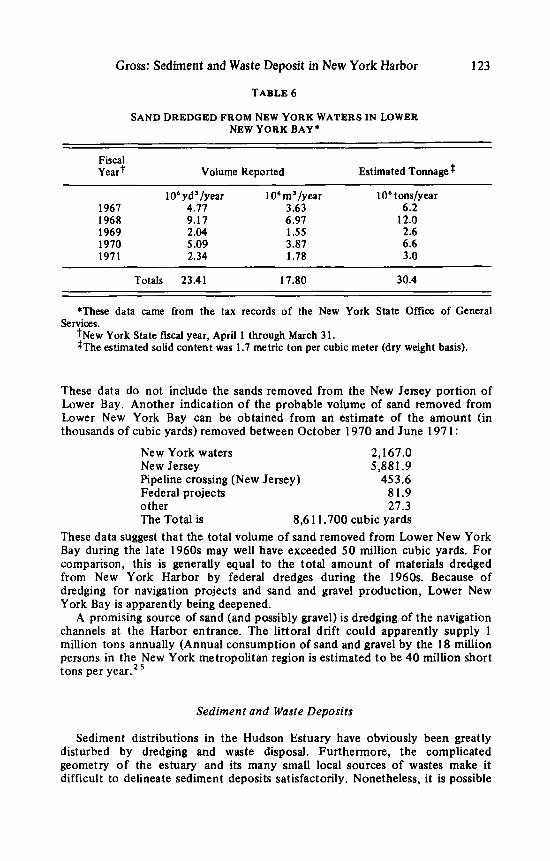
The volume of material removed is poorly known. Records of the New York State Office of General Services indicate that state taxes were paid on the removal of 23 million cubic yards of sand (equivalent to about 30 million metric tons) from New York waters during fiscal years 1967 through 1971 (TABLE 6).
Gross: Sediment and Waste Deposit in New York Harbor 123
TABLE 6
SAND DREDGED FROM NEW YORK WATERS IN LOWER NEW Y ORK BAY *
Fiscal Yeart Volume Reported Estimated Tonnage$
1 O6 yd /year 106m3/year 1 O6 tons/year 1967 4.17 3.63 6.2 1968 9.17 6.91 12.0 1969 2.04 1.55 2.6 1970 5.09 3.87 6.6 1971 2.34 1.78 3 .O
Totals 23.41 17.80 30.4
*These data came from the tax records of the New York State Office of General
?New York State fiscal year, April 1 through March 31. $The estimated solid content was 1.7 metric ton per cubic meter (dry weight basis).
Services.
These data do not include the sands removed from the New Jersey portion of Lower Bay. Another indication of the probable volume of sand removed from Lower New York Bay can be obtained from an estimate of the amount (in thousands of cubic yards) removed between October 1970 and June 197 1 :
New York waters 2,167.0 New Jersey 5,881.9 Pipeline crossing (New Jersey) 453.6 Federal projects 81.9 other 27.3 The Total is 8,6 11.700 cubic yards
These data suggest that the total volume of sand removed from Lower New York Bay during the late 1960s may well have exceeded 50 million cubic yards. For comparison, this is generally equal to the total amount of materials dredged from New York Harbor by federal dredges during the 1960s. Because of dredging for navigation projects and sand and gravel production, Lower New York Bay is apparently being deepened.
A promising source of sand (and possibly gravel) is dredging of the navigation channels at the Harbor entrance. The littoral drift could apparently supply 1 million tons annually (Annual consumption of sand and gravel by the 18 million persons in the New York metropolitan region is estimated to be 40 million short tons per year.’
Sediment and Waste Deposits
Sediment distributions in the Hudson Estuary have obviously been greatly disturbed by dredging and waste disposal. Furthermore, the complicated geometry of the estuary and its many small local sources of wastes make it difficult to delineate sediment deposits satisfactorily. Nonetheless, it is possible
124 Annals New York Academy of Sciences
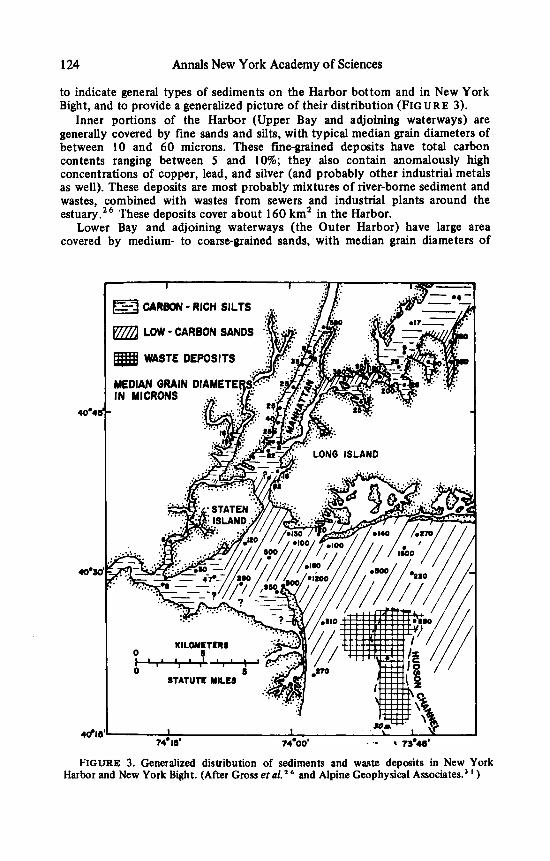
to indicate general types of sediments on the Harbor bottom and in New York Bight, and to provide a generalized picture of their distribution (FIGURE 3).
Inner portions of the Harbor (Upper Bay and adjoining waterways) are generally covered by fine sands and silts, with typical median grain diameters of between 10 and 60 microns. These fine-grained deposits have total carbon contents ranging between 5 and 10%; they also contain anomalously high concentrations of copper, lead, and silver (and probably other industrial metals as well). These deposits are most probably mixtures of river-borne sediment and wastes, combined with wastes from sewers and industrial plants around the estuary.2 These deposits cover about 160 km2 in the Harbor.
Lower Bay and adjoining waterways (the Outer Harbor) have large area covered by medium- to coarse-grained sands, with median grain diameters of
dl "
FIGURE 3. Generalized distribution of sediments and waste deposits in New York
I I \
74.16' 74'00' . '- 1 73*48'
Harbor and New York Bight. (After Gross et u1.l and Alpine Geophysical Associates.' ' )
Cross: Sediment and Waste Deposit in New York Harbor 125
between 100 microns and 1 mm. Carbon and metal concentrations in these deposits are substantially lower than in sediments from the inner harbor. In fact, these Lower Bay sands are comparable in their chemical characteristics to the sands on the Continental Shelf outside the Harbor, and are unaffected by waste disposal operations.
Sediment distributions in the waste disposal areas in New York Bight are more difficult t o characterize. Before waste disposal began, there were probably two different types of sediment in this area. On the Continental Shelf there were relatively coarse-grained sands and some gravels. In Hudson Channel, the sediments were probably fine-grained sands and silts. To complete this initially complicated distribution of sediment, millions of tons of wastes ranging from large blocks of construction and demolition rubble to the fine-grained sewage solids were dumped here. The resulting distribution of sediment and waste deposits has not been well mapped, but general outlines are indicated in F I G U R E 3. Carbon-rich, metal-rich waste deposits cover about 150 km2 in New York Bight.
Waste deposits have been dumped around the region, so that a detailed study of sediment distribution, including extensive coring, is required t o determine the present distribution and to study the effects of waste disposal on the New York Bight.
It is interesting to compare sediments from the inner harbor with those found by McCrone2' in the Hudson River north of the Port region. McCrone found fine silts, with median grain diameters of between 4 and 8 microns. These are much finer-grained than the deposits in the Lower Hudson River. Furthermore, McCrone reported that these deposits contained 2.6% oxidizable carbon. This is 75% of the amount of organic carbon in comparable deposits from the inner harbor. (Gross and colleagues" p. 17). The disparity of these sediments in the Hudson River above the city, and those deposited in the harbor, suggests that the Hudson is by no means the source of fine-grained sediment for the Harbor. Also, the discrepancy between Panuzio's estimated sediment load and the reported volume dredged from the Lower Hudson and Upper Bay areas suggests that more study of Hudson River sediment is needed.
In short, our limited data do not permit definitive answers at this time. It is interesting t o speculate that much of the fine-grained Hudson Sediment load is deposited in Tappan Zee, north of the Harbor, or is transported widely throughout the Harbor, and may eventually deposit in western Long Island Sound. Some sediment may also escape from the Harbor to be deposited in New York Bight.
This hypothesis suggests that most of the increased dredging of the Lower Hudson River after the changes in the channel does not result from more effective trapping of Hudson River sediment. Instead it suggests that much of the increased dredging is the result of more effective trapping and local deposition of waste solids discharged by industries and cities on the estuary.
Future Changes in Hudson Estuary
By now it should be obvious that the changes made to the estuary, and along its shores, have had a profound influence on New York Harbor. While the data are difficult to obtain and to interpret, there is little doubt that the rate of change has been accelerating rapidly since 1900. Likewise there is little reason to doubt that the rate of change will accelerate even more in the future. For
126 Annals New York Academy of Sciences
example, population growths for the region through 1985** indicate that the population of the 18 counties in New York and New Jersey that border the Harbor will grow by about 3.7 million persons; this is roughly 71% of the total growth in the 23-county New York Metropolitan Region.
To give some idea of the type and scope of the changes likely in the Hudson Estuary, I will mention some major projects under consideration in 1972. The list is by no means complete.
Development of port facilities for deep-draft vessels carrying bulk commod- ities, primarily petroleum, seems highly probable. Two sites are most promising. One is in Sandy Hook Bay, about 1.5 nautical miles west of Sandy Hook. The other is at the head of Hudson Channel, where waters deeper than 100 feet occur within about 5 nautical miles of the coast. Development of a site involves dredging channels, building transfer and storage facilities, and probably building a pipeline from the site to refineries or distribution points on land. At either site, building an island for the terminal facilities will necessitate large amounts of dredging and filling to make a large enough space. There is also the problem of dredging a deep channel through the bar at the harbor entrance. The ships being considered require channels around 100 feet deep. Existing channels provide 40 feet at most in Ambrose Channel, and 35 feet in Sandy Hook Channel. So for the Sandy Hook Bay site, a large volume of sand and gravel must be dredged in order to provide necessary water depths. Both sites are likely to require the construction of pipelines t o transport petroleum to storage and refinery facilities on land.
These projects will initially require large-volume dredging projects. In the process of dredging, fine-grained sediment is usually suspended, and may be transported widely throughout the estuary and deposited far froin the original dredging site. Any deep channels will probably serve as efficient sediment traps for sediment moved by littoral drift and other processes along the beaches and Continental Shelf. Thus large amounts of maintenance dredging are likely to be necessary to maintain these channel depths.
A second project under consideration is the diking of a large area in Lower Bay, south of Staten Island, to be used for the disposal of dredge spoil and incinerator ash. This facility is being considered, and if built will be operated by the Corps of Engineers. Such a massive structure will almost certainly change water circulation in Lower Bay. The effects of this structure on the Harbor will be studied, using the hydraulic model of New York Harbor in the Waterways Experiment Station of the Corps of Engineers at Vicksburg, Mississippi.
A third project in the stage of concept formulation is the construction of an offshore airport center t o provide additional airport facilities for the metropol- itan region. One site discussed is several miles south of Long Island. Although outside the immediate boundaries of the Harbor, the airport would be close enough to affect it. If a solid structure, the airport would be likely to change water circulation in New York Bight, t o alter wave action on local beaches, and to change patterns of sediment movement on the Continental Shelf. These are only a few of the direct effects. There would also be secondary effects such as local spills of petroleum fuels and chemicals from airport operations.
Finally, there is the continuing alteration of the waterfront." Many of the existing facilities are obsolescent or obsolete for modem marine transport. Changes in ships and cargo handling in the past 20 years have greatly reduced the number of these facilities needed to handle cargo passing through the Harbor. Thus these facilities are likely t o be rebuilt; many have already been abandoned. The traditional means of reconstructing port facilities is to fill around the old
Gross: Sediment and Waste Deposit in New York Harbor 127
piers and docks and to extend the facilities farther into the waterways. This process can be seen in Newark Bay and on the North River (Hudson) side of Lower Manhattan. The net result over the next several years is likely to be further growth of Lower.Manhattan into its adjoining waters. The shallow waters in Upper Bay along the Bayonne-Jersey City area are also likely to be filled. Many of these newly-made land areas will probably be used for industry and residential development, replacing the railroads and other transportation facilities that have long dominated the waterfront.
To sum up, the Hudson River Estuary has been extensively altered by past development schemes. Future development seems likely to continue these alterations. As a result, water circulation and the deposition of sediment and waste solids in the estuary will probably change. These changes are more than academically interesting. They may well limit the benefits obtained from water quality control schemes and the maintenance of navigation facilities in the Harbor. Geologists and oceanographers have a contribution to make in working out the future of the estuary and its management.
References
1. PORT OF NEW AUTHORITY. 1963. Metropolitan Transportation - 1980. Compre- hensive Planning Office, Port of New York Authority. New York, N. Y.
2. NEWMAN, W. S., D. H. THURBER, H. S. ZEISS, A. ROKACH & L. MUSICH. 1969. Later Quaternary geology of the Hudson River estuary: A preliminary report. Trans. N. Y. Acad. Sci. Series I1 31(5): 548-570.
3. VEATCH & SMITH. 1939. Atlantic submarine valleys of the United States and the Congo submarine valley. Geol. SOC. Amer. Spec. Paper. 7 (101~) .
4. GUTENBERG, B. 1941. Changes in sea level, postglacial Uplift and mobility of the earth’s interior. Bull. Geol. SOC. America 52: 721-772.
5. MUNK, W. H. & R. REVELLE. 1952. Sea level and the rotation of the earth. Amer. J. Sci. 250: 329-833.
6. HICKS, S. D. 1972. Vertical crustal movements from sea level measurements along the east coast of the United States. Annual Meeting of American Geophysical Union.
7. EDWARD, J. 1893. Improvement of New York Harbor, 1885 to 1891. Wynkoop & Hallenback. New York. N. Y.
8. WIGMORE, H. L. 1909. Memorandum on dredging work in Ambrose Channel. Prof. Mem. Eng. Bur. U. S. Army 1: 57-62.
9. WORKS PROGRESS ADMINISTRATION WRITERS PROJECT. 1941. A Maritime History of New York. Doubleday. Doran, and Company, Inc. Garden City, N. Y.
10. SCHUREMAN, P. 1934. Tides and currents in Hudson River. U.S. Coast and Geodetic Survey Special Publ. 180.
11. MARMER, H. A. 1935. Tides and currents in New York Harbor. U.S. Coast and Geodetic Survey Special Publication 111 (revised ed.)
12. PANUZIO, F. L. 1965. Lower Hudson River siltation. In Proceedings of the Ferral Inter Agency Sedimentation Conference, 1963: 5 12-550. Miscellaneous Publication No. 970. Agricultural Research Service.
13. HARDY, C. D. 1972. Hydrographic conditions in Long Island Sound and adjoining waters. Marine Sciences Research Center, Technical Report No. 6. State University of New York. Stony Brook, N. Y.
14. GOTTMAN, J. 1961. Megalopolis: The urbanized northeastern seaboard of the United States. The Massachusetts Institute of Technology Press. Cambridge, Mass.
15. WOLMAN, M. G. & A. P. SCHICK. 1967. Effects of construction on fluvial sediment, urban and suburban areas of Maryland. Water Resources Research 3: 451 -464.
16. ANDERSON, P. W. & I. E. MCCOLL. 1968. Urbanization’s effect on sediment yield in New Jersey. I. Soil and Water Conservation 23: 142-144.
128 Annals New York Academy of Sciences
17. FEDERAL WATER POLLUTION CONTROL ADMINISTRATION. 1969. Proceedings of the Conference in the Matter of Pollution in the Interstate Waters of the Hudson River and its Tributaries - New York and New Jersey. Third Session.
18. CALDWELL, J. M. 1966. Coastal processes and beach erosion. J. SOC. Civil Engineers
19. TANEY, N. H. 1961. Littoral materials of the south shore of Long Island, New York. Beach Erosion. Office Chief Engineers Tech. Mem. 192.
20. SIMMONS, H. B. & W. H. BOBB. 1965. Hudson River Channel, New York and New Jersey. Plans to reduce shoaling in Hudson River channels and adjacent pier slips. Technical Report No. 2-694. U.S. Army Engineer Waterways Experiment Station. Vicksburg, Miss.
Unpublished data. 22. RICKERT, D. A. & J. V. HUNTER. 1967. Rapid fractionation and materials balance of
solids fractions in wastewater and wastewater effluent. J. Water Pollution Control Federal 39: 1475-1483.
23. GROSS, M. C. 1970. New York Metropolitan Region - A major sediment source. Water Resources Research 6: 927-931.
24. DOLE, R. B. & H. STABLER. 1909. Denudation. In Papers on the Conservation of Water Resources: 78-93. U.S. Geol. Survey Water-Supply Paper 234.
25. NEW YORK STATE OFFICE OF PLANNING COORDINATION. 1970. Long Island Sand and Gravel Mining. New York, N. Y.
26. GROSS, M. G. and others. 1971. Survey of marine waste deposits, N. Y. Metropolitan Region. Tech. Rep. 9. Marine Sciences Research Center, State University of New York at Stony Brook. Stony Brook, N. Y.
27. MCCRONE, A. W. 1967. The Hudson River Estuary. J. Sediment. Petrol. 37: 475-486. 28. FRANZMAN, C. A., H. FRIEDMAN & OTHERS. 1966. The Next Twenty Years. Port
of New York Authority. New York. N. Y. 29. TOWERY, F. C., P. ISRAEL. S. B. TANKEL & B. PUSHKAREREV. 1966. The Lower
Hudson. Regional Plan Association W. B. SHORE, ED. Bull. 104. New York, N. Y. 30. BOWER, B. T., G. P. LARSON. A. MICHAELS & W.M. PHILLIPS. 1968. Waste
Management. Regional Plan Association. New York. Bull. 107. 31. ALPINE GEOPHYSICAL ASSOCIATES. Raritan Estuary Sedimentation Study.
Unpublished report prepared for Federal Water Pollution Control Administration, Department of the Interior.
32. LUDWIG, H. F. & associates. 1970. Spring Creek auxiliary water pollution control project. Final Report, Year 1. Forest Hills, N.Y.
ings of the Conference in the Matter of Pollution of the Interstate Waters of the Hudson River and its Tributaries - New York and New Jersey. 2 vol.
34. LEIGHTON, M. 0. 1902. Sewage pollution in the metropolitan area near New York City and its effect on inland water resources. U.S. Geological Survey Water-Supply Paper 72.
35. GIESE, G. L. & J. W. BARR. 1967. The Hudson River estuary: A preliminary investigation of flow and water quality characteristics. New York Water Resources Commission Bull. 61.
36. TRI-STATE REGIONAL PLANNING COMMISSION. 1969. Water and waste in the tri-state region. Interim Technical Report 4136-3 110 (mimeographed). New York, N.Y.
53: 142-157.
21. ENVIRONMENTAL PROTECTION ADMINISTRATION, NEW YORK CITY. 1967.
33. U.S. DEPARTMENT OF HEALTH, EDUCATION, AND WELFARE. 1965. Proceed-