security this page a iii, i - apps.dtic.mil · deintercalate up to 64%/ of the lithium....
TRANSCRIPT
SECURITY CLASSif-CA71ON Of THIS PAGE I OUETTO AE1.A4
I~' A lM o ! ibNeu cyv A RiG11iiI 1,1 111 III, 111 111 EI 11 I lb IETITEMRIG
E. I L3. DITI TN3~l!5kYfi oW q ppiovedfor puli rlease crad sale, its
2b DELASSIICATIN/DO I~tdistLributi$oUn is unImhIo&PERFORMING ORGA' ZAW OR!T Nuff 5 MON'TORiNG ORGANIZATION REPORT NUMBER(S)
64 %AME O~ FQ .G-OFA\ S'%30k 7a 0; \. DJ 70: 0 . O A 'ONDept. of Chemistry (1 piCable) Office of Naval ResearchCornell UniversityI
6r. ADDRE SS (City, State, and ZIP Code) 7b. ADDRESS (City. State. and ZIP Code)Dept. of Chemistry Chemistry ProgramCornell University 800 N. Quincy St.Ithaca, NY 14853-1301 Alexandria, VA 22217
Sa- NAME OF FUNDING /SPONSORING 6b OFFICE SYMBOL 9 PROCUREMENT INSTRUMENT IDENTIFICATION NUMBER
Office of Naval Research _______N000l4-9l-J-269
SC. ADDRESS (City. State, and ZIP Code) 10 SO,:RCE OF FUND!NG NUMBERS
Chemistry Program PROGRAM IPROJECT TASK WOAK UNIT
800 N. Quincy St. ELEMENT NO NO NO ACCESSION NO.Al1exandria. VA 22217 1AI
11. TITLE (include Security Clasification)L~iMoN 2 :The First Metallic Layered Nitride
12.PERSONAL AUTHOR(S) S. H. Elder, Linda H. Doerrer, F. J. DiSalvo, J. B. Parise,D. Guyomard, J. M. T arasco13j. TYPE OF REPORT jl3b TIME COVERED 14t DATE OF REPORT (Year. Aionth, Day) I1S PAGE COUNTTechnical Rpt. #16 1FROM 12./91 TO_.lL.L24 I 92-April-216. SUPPLEMEN4TARY NOTATION%
Submitted to: Chemistry of Materials
17, COSATI CODES 18 SUBJECT TERMS (Continue on reverse if necessary and identify by block number)FIELD GROUP SUB-GROUP ISolid State Nitrides Li batteries
Crystal Structure Magnetic & Electrical Properties
19 ABSTRACT (Continue on reverse if necessary an~d .&deni by block number)
We report the first example of a layered ternary lithium nitride in which the lithium can bedeintercalated and reintercalated. This ternary nitride, 11MoN 2, has been synthesized by thereaction of two different precursors, i2MO(NtBu)4 and Li2MoO4, with ammonia gas. Thestructure was refined using a combination of X-ray and neutron powder diffraction data In thespace group R3 and the lattice parameters are (A) a=2.8672(3) and c=15.813(3) which wereobtained from the neutron data. The ideal structure consists of MoN2 layers with Mo intrigonal prismatic holes and Li in octahedral holes between the MoN2 layers. The diffractionstudies indicate the presence of cation anti-site defects; the structure is best described as
(CONTINUED ON REVERSE)
20 DISTRIBUTION /AVAILABILITY OF ABSTRACT 21. ABSTRACT SECURITY CLASSIFICATIONGUNCLASSIFIEDlJNLIMITED 0 SAME AS APT 0 DTIC USERS Unclassified
22a NAME OF RESPONSIBLE INDIVIDUAL 22b TELEPHONE (Includ Are od)22 FFICE SYMBOLDr. John Pazik 202-696-4409
DD Form 1473, JUN 86 Oresoui editiori ire obsolete SECLIPITY CLASSIFICATION OF T14I5 PAGE
;'N O1O?-LF-OlA'-6603
(Uo.84Moo.16)oct(Moo.84Lio.16)tpN2. LiMoN2 is metallic and Pauliparamagneticwith'XO = 0.59 x 10.6 emu g-1. We have employed a variety of different oxidizingagents for the -deintercalation of the litbIum from LiMoN2 and have been able todeintercalate up to 64%/ of the lithium. Tho-deintercalated species can bereintercalated with n-butyllithium, (in hekcane) at room temperature.Electrochemical studies show a large hysteresis in ch~ge-discharge cycles.
OFFICE OF NAVAL RESEARCH
Grant or Contract N00014-91-J-1269
R&T Code 4134037
Technical Report No. 16
LiMoN2: the First Metallic Layered Nitride
by
S. H. Elder, L. H. Doerrer, F. J. DiSalvoJ. B. Parise, D. Guyomard and J. M. Tarascon
Submitted toAcceiot for
Chemistry of Materials
DTIh3 TAP,Uhra. :;'o.'r~ccd -
Cornell University Ju a .........
Department of Chemistry ByI t h a c a , N Y 1 4 8 5 3 B y .......................... --- -----------. .....
Dist,-ibutio .
April 2, 1992 vDist Svai'
Reproduction in whole or in part is permitted for any purposeof the United States Government
This document has been approved for public releaseand sale; its distribution is unlimited
9f 4 10 105 92-0937311111111 .II
LiMoN2: The First Metalic Layered Nitride
&IEL EOder, linda IL Doerrer and F. J. DiSalvo*
Department of Chemistry, Baker Laboratory
Cornell University, Ithaca, New York 14853-1301
J.B&.Parise
Mineral Physics Institute, State University
of New York at Stony Brook, Stony Brook, NY 11794
D. Guyomard and J. AL Tarascn
Bell Communications Research, 311 Newman Springs Rd., Redbank, NJ 07701
*t whom correspondence should be addressed
3
Introduction
Binary nitrides are known for most metals of the periodic table with the
exception of the alkali metals (excluding Li) and the late 4d and 5d
elements. However, ternary nitrides are not well studied, except for the
well known lithium rich transition metal nitrides.1-3 Many lithium rich
ternary nitrides have been synthesized; however, the synthetic route has
been similar in all cases: growth from a lithium nitride flux. Likewise, the
structures show great similarities; almost all are superstructures of anti-
fluorite.
Recent work has produced numerous alkaline and alkaline earth
transition metal nitrides with interesting chemical, structural and
physical properties: MNiN (M = Ca, Sr or Ba),4,5 Ca 3MN (M = P, As, Sb, Bi,
Ge, Sn, Pb), 6 MTaN2 (M = Na, K, Rb, Cs), 7 Ca 3CrN3 ,8 Ca 6MN 5 (M = Ga and
Fe),9 Ba 3MN 4 (M = Mo and W),1° Ba 3FeN 3 " and M2LiFe2N3 (M = Sr and
Ba).12
The chemistry and properties of the lithium intercalated dichalcogenide
layered compounds LiMX2 (X = S, Se; M = IVb, Vb, VIb transition metals)
have been known and studied for over 25 years.13 ,14 Long term interest in
these materials is due in part to their potential use in recyclable lithium
batteries 15 and as catalysts.
Since nitrides have small free energies of formation due in part to the
strong triple bond in dinitrogen, the synthesis of such phases at the high
temperatures necessary to obtain reasonable solid state diffusion is often
precluded because the phases are only stable at lower temperatures.
Therefore, we are developing lower temperature synthesis strategies based
4
on the reaction of suitable mixed metal precursors with ammonia gas to
produce ternary nitrides. Herein we report the synthesis of a new metallic,
layered nitride, LiMoN2 , from two such precursors, and discuss its
chemical and physical properties.
E e etal Section
Starting Materials. The precursor Li2Mo(NtBu) 4 was prepared
according to published methods.1 6 Lithium molybdate was prepared by
heating a 1:1 mixture of Li2CO 3 (99.99% metals purity) and MoO3 (ACS
grade) at 6500 C for approximately 18h in air; Li2MoO4 was identified as a
pure product by X-ray powder diffraction methods. All manipulations of
Li2Mo(N tBu)4 and LiMoN 2 were carried out in an argon filled box or on a
vacuum/argon manifold due to their known or anticipated air sensitivity.
Synthesis of LiMoN2. The title compound was first synthesized by
decomposing Li2Mo(N tBu)4 (in an alumina boat) under flowing ammonia
gas at 6500 C in a nitriding apparatus.' 7 The product formed was a free
flowing, black powder that appeared graphitic-like on grinding. The X-ray
powder pattern consisted of a small number of intense peaks and several
weak peaks. The intense peaks could be indexed by assuming a hexagonal
unit cell with a = 2.868 A and c = 15.787 A, with systematic zeroes that
suggest rhombohedral symmetry. Since no binary Mo-N phases have these
lattice parameters, it was clear that a ternary phase had formed. Due to
the graphitic nature of the compound, we also suspected that the structure
5
was layered.
Since LiVS2 can be prepared by heating Li2CO 3 and V20 5 in flowing H2S
gas at 7500 C,18 it seemed possible that the a ternary nitride phase could be
obtained by the reaction of Li 2MoO 4 with ammonia gas. We found that the
same well crystallized black powder, as identified by X-ray diffraction,
could be prepared by exposing a melt of Li2MoO 4 (in an alumina boat) to
flowing ammonia gas at 7100 C for 16h in the nitriding apparatus (large
scale reactions may require grinding and reheating in flowing ammonia
gas for complete reaction). Again, weak peaks could be seen in the X-ray
diffraction pattern. In this latter case, the weak peaks could be entirely
accounted for by the presence of lithium oxide. Since the preparation of
Li 2Mo(N tBu)4 is relatively time consuming, we now exclusively synthesize
the ternary nitride from Li2MoO 4.
The thermal decomposition of Li2MoO 4 in flowing ammonia gas occurs
in at least a few distinct steps. When Li2MoO 4(s) was heated in ammonia,
it turned black by approximately 4500 C. Upon grinding, the powder was
gray and the only crystalline phase detected by X-ray powder diffraction
was Li 2MoO 4. This was indicative that a black, amorphous coat had
formed on the Li2MoO 4 particles. At 5000 C the powder was black when
ground and one crystalline phase, Li4MoO5 , was detected by X-ray
diffraction. A second phase that must be present for mass balance
remained amorphous. Within the range of 650 - 7100 C, the ternary nitride
and Li2O were the only phases observed as determined by X-ray diffraction
and mass loss from the reaction. Finally, by 8500 C the ternary nitride
decomposed and the Li20 sublimed leaving only --Mo 2N in the reaction
vessel as determined by X-ray diffraction and mass loss.
6
When a melt of Li2MoO 4 (Mp = 7050 C) was exposed to ammonia at
7100 C, a homogeneous, black powder quickly formed; upon heating for
20min at 7100 C and then quenching, only Li4MoO 5 was detected by X-ray
diffraction. However, when the heating of this powder was continued for
12h it was converted completely to the ternary phase and Li 20.
The thermal stability of the ternary phase seems to lie in a fairly narrow
temperature range. When reaction temperatures are below the melting
point of Li2MoO 4 (for example at 6750C), the kinetics of the reaction are
slowed dramatically yielding incomplete ammonolysis of the oxide.
However, at temperatures greater than -735 0C partial decomposition to 7-
Mo 2N is evident by both X-ray and neutron powder diffraction, as well as an
increased concentration of anti-site defects in the ternary phase (vide infra).
An increased time of heating appears to increase the degree of
decomposition.
In order to determine the composition, structure and properties of this
new ternary nitride, it was necessary to remove the lithium oxide.
Although the lithium oxide was readily removed by washing with water,
the title compound appeared to be somewhat reactive towards water and/or
aqueous base. Washing the nitride with water lead to a mass loss which
was too great for the loss of lithium oxide exclusively; also some ammonia
gas was produced as evident by its acrid odor. Washing with dried ethanol
also removed the lithium oxide, but again it appeared to allow some small
side reaction, as determined by new peaks in the X-ray diffraction pattern
and mass loss, although the loss is much less than with water. We have
not pursued this ethanol reaction further.
We found that the lithium oxide could be most successfully removed by
condensing ammonia (approximately 10mL NH 3 / 0.15g nitride), predried
7
over sodium, onto a mixture of ammonium chloride and the nitriding
reaction product; 19 2.2 moles of ammonium chloride were used for every
mole of lithium oxide present. The products of this reaction are lithium
chloride, ammonia and water. This mixture was periodically stirred for 2h
at approximately -350 C in an H-cell. 19 The ammonia was decanted off and
the nitride was washed several times with fresh ammonia to remove the
less soluble lithium chloride and any remaining ammonium chloride. The
X-ray powder pattern was clean, no reactions with the ammonia or side
products were evident. The presence of the small amount of water from
this reaction did not seem to cause side reactions perhaps due to two
factors: the reaction takes place below 00C leading to slow kinetics, and the
small amount of water produced should be strongly coordinated to the
lithium cations present.
Analysis. Solutions of the ternary phases were prepared by dissolution
of the solids in aqua regia (this requires several hours at room
temperature); Li2MoO 4, dissolved in a like manner, was used as a
standard. Metals analysis was done on solutions using Plasma Emission
Spectroscopy (PES). The molybdenum line (% = 202.2nm) was analyzed on a
Jarrel-Ash I.C.A.P 61 update spectrometer and the lithium line (X =
670.8nm) on a model 82-000 modified Ebert Mount spectrometer. The Li:Mo
ratio ranged from 0.95 - 0.97:1.00 leading to a stoichiometry (expected
accuracy of ± 2%) of Lio.96MoN 2; we refer to this hereafter as LiMoN 2.
Metals analysis (PES) indicated the stoichiometry (or the ratio of the metals)
of the parent compound deintercalated (see section on chemical properties)
with DDQ and NOBF 4 to be Lio.44MoN 2 and Lio.36MoN 2 respectively
8
(assumed nitrogen content).
Since LiMoN 2 will not dissolve in H 3PO420 or H 2SO4 (Kjeldahl method),
the nitrogen content could not be directly determined from evolved
ammonia. Using the modified Dumas method, 2 ' we obtained 76% of the
expected N2. However, the sample could not be completely reacted with
carbon dioxide even at 10000C as was evident by the black color of the sample
after the reaction (complete reaction would leave a white oxide or carbonate
powder). Consequently, this measurement can only put a lower limit on
the N:Mo ratio of 1.5. However, by mass difference from the PES data, the
N:Mo ratio is 2.2:1 (± 15 %).
The weight loss upon reaction of Li 2MoO 4 with ammonia was consistent
with the formation of one half mole lithium oxide and one mole of LiMoN 2
for each mole of Li 2MoO 4 . Also, the measured density22 of LiMoN 2 powder
was 5.72 g cm -3 (±2%) compared with the calculated density of 5.79 g cm 3
(see section on structure).
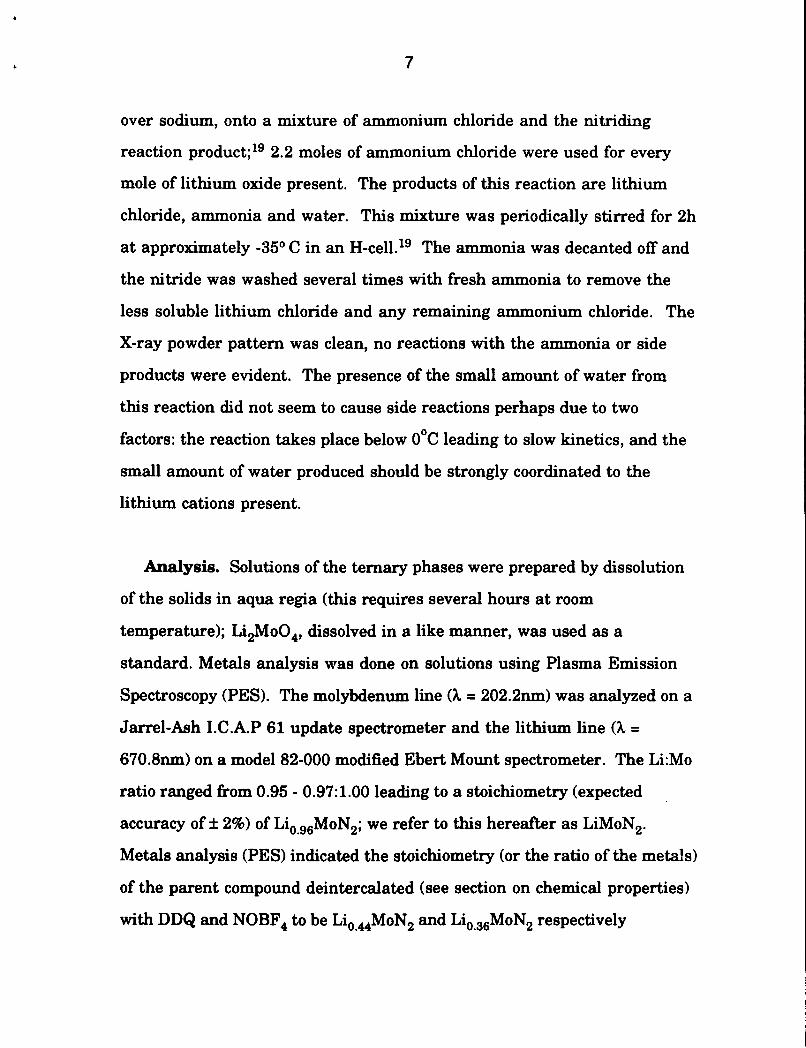
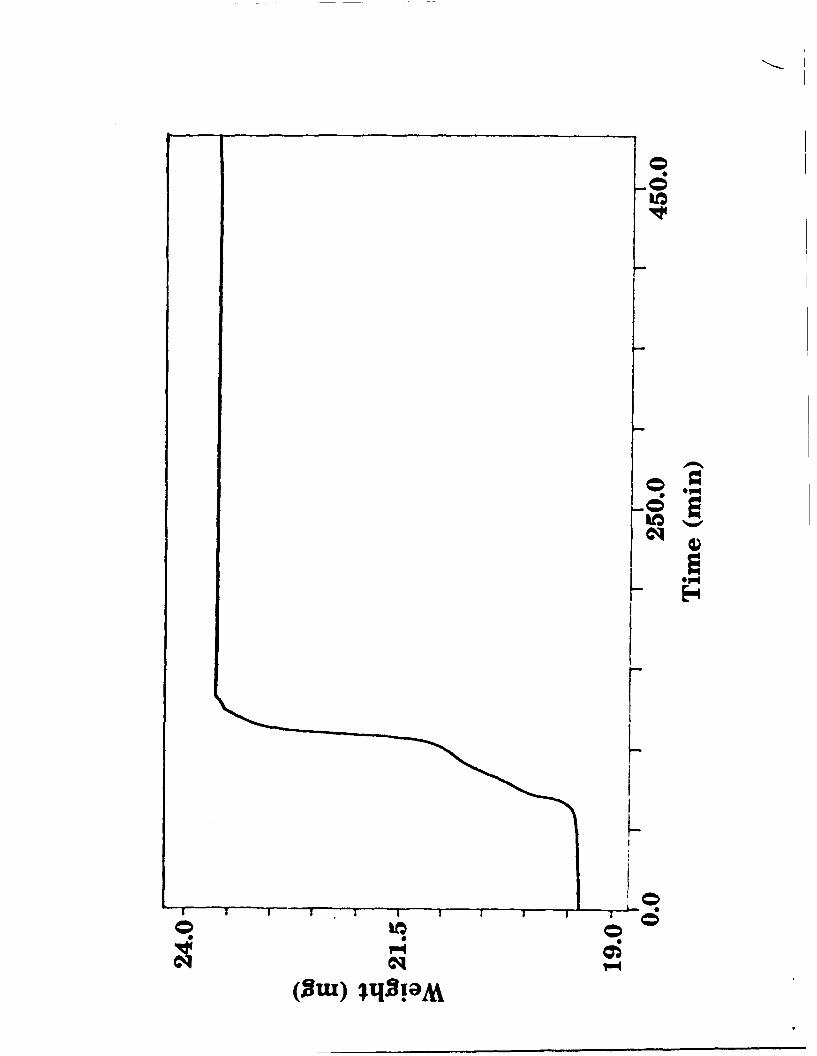
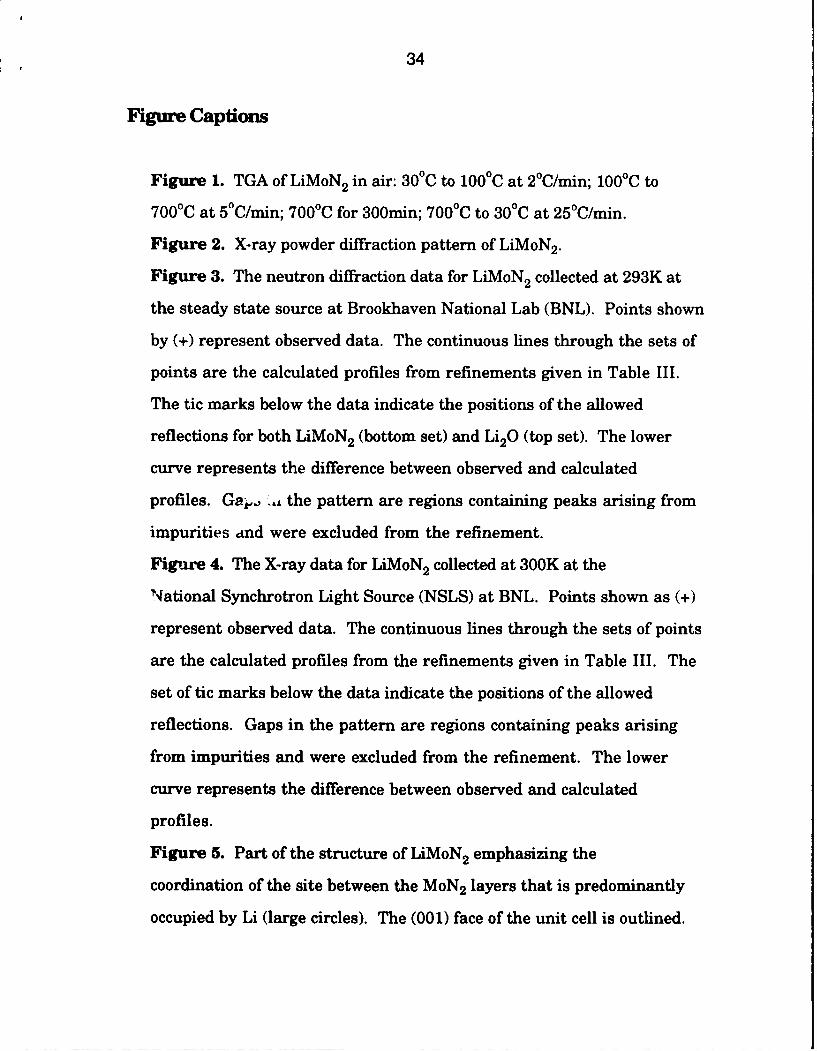
Although we have been unable to make a direct analysis for nitrogen,
thermal gravimetric analysis (TGA) does give an upper limit of oxide
contamination. Figure 1 shows the mass change upon heating LiMoN 2 in
air.
The mass gain of 21.08% is close to the theoretical value of 21.38% for the
decomposition of LiMoN 2 to 1/2 Li20 and MoO 3 or corresponding ternary
oxides; this places an upper limit of about 10% oxygen content in the nitride
(i.e. LiMoN 2.Ox ; x < 0.2) Coupled with the fact that the LiMoN 2 initially
9
synthesized from Li 2Mo(NtBu) 4 had lattice parameters identical to that of
the LiMoN 2 prepared from the oxide, leads us to believe that the
oxygen"contamination" is much smaller than 10%.
Structure Determination.
X-ray Diffraction. Initial X-ray powder diffraction data4 were collected
with a Scintag XDS 2000 diffractometer using CuKa radiation.
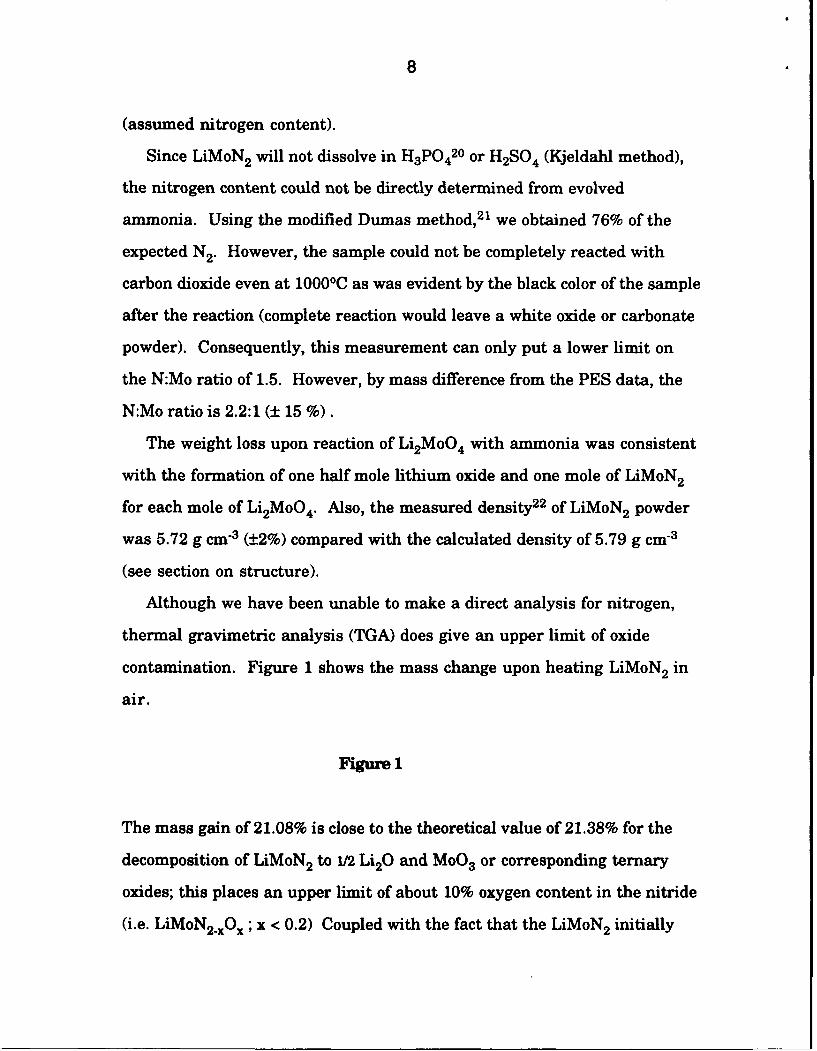
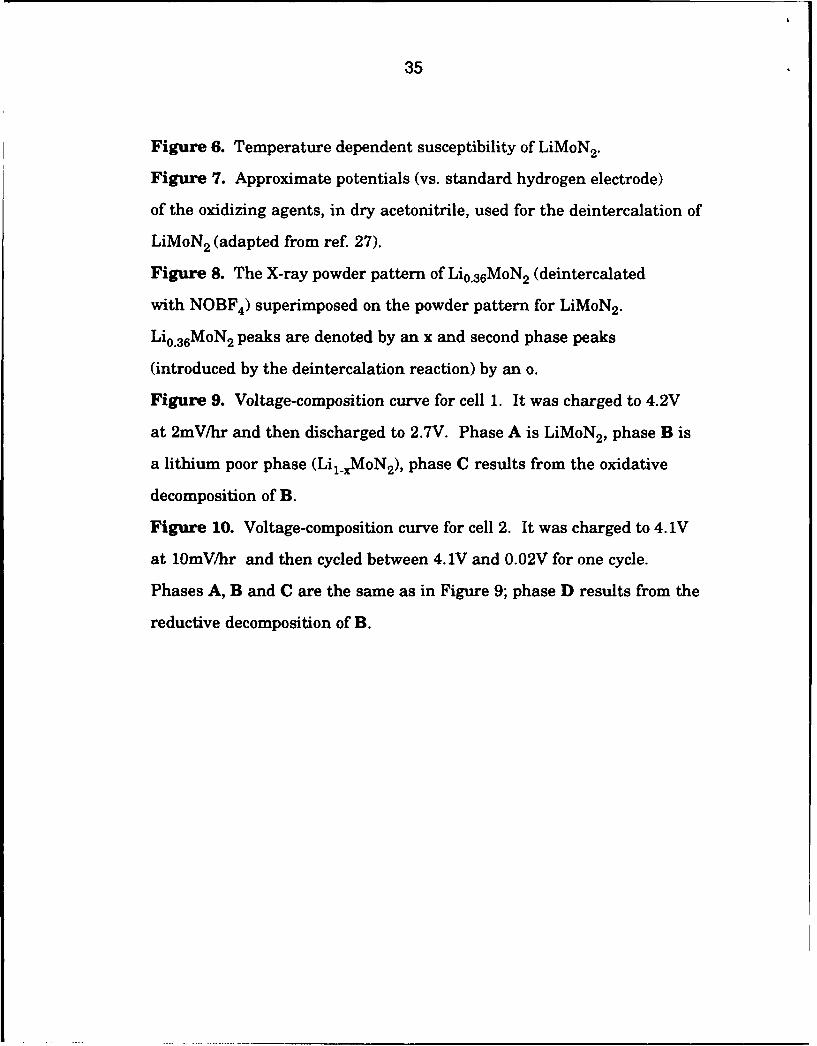
The X-ray powder pattern (Fig. 2) was easily indexed on a hexagonal
unit
Figure 2
cell with a = 2.868 A and c = 15.787 A. However, the systematic absences in
the (101) and the (001) lines show that the correct space group is
rhombohedral. Assuming that the structure consists of MoN 2 layers with
close-packed layers of nitrogen sandwiching a layer of molybdenum and
octahedral coordination for lithium (as is found in the layered sulfides), we
were limited to two rhombohedral space groups: R-3m (no. 166) and R3
(no. 146). The only difference between these two space groups is the
nitrogen coordination about the molybdenum; R-3m places the
molybdenum in an octahedrl hole while R3 places it in a trigonal
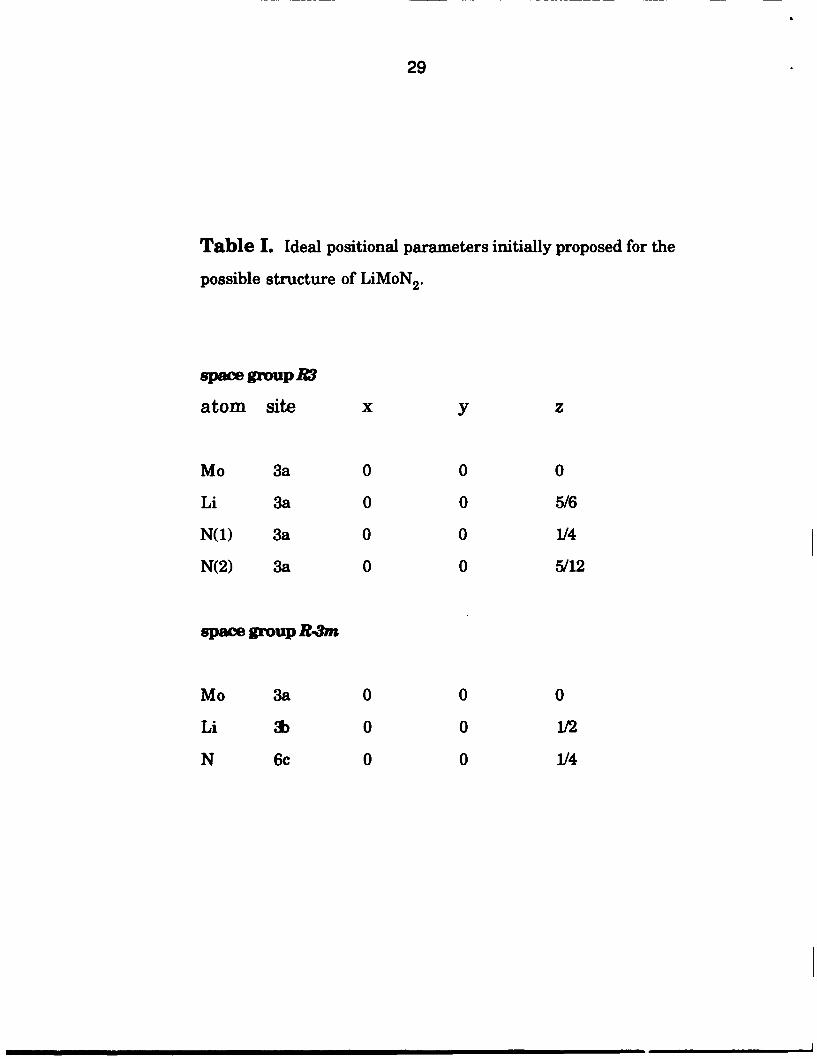
prismatic one. The assumed atomic positions in both space groups are
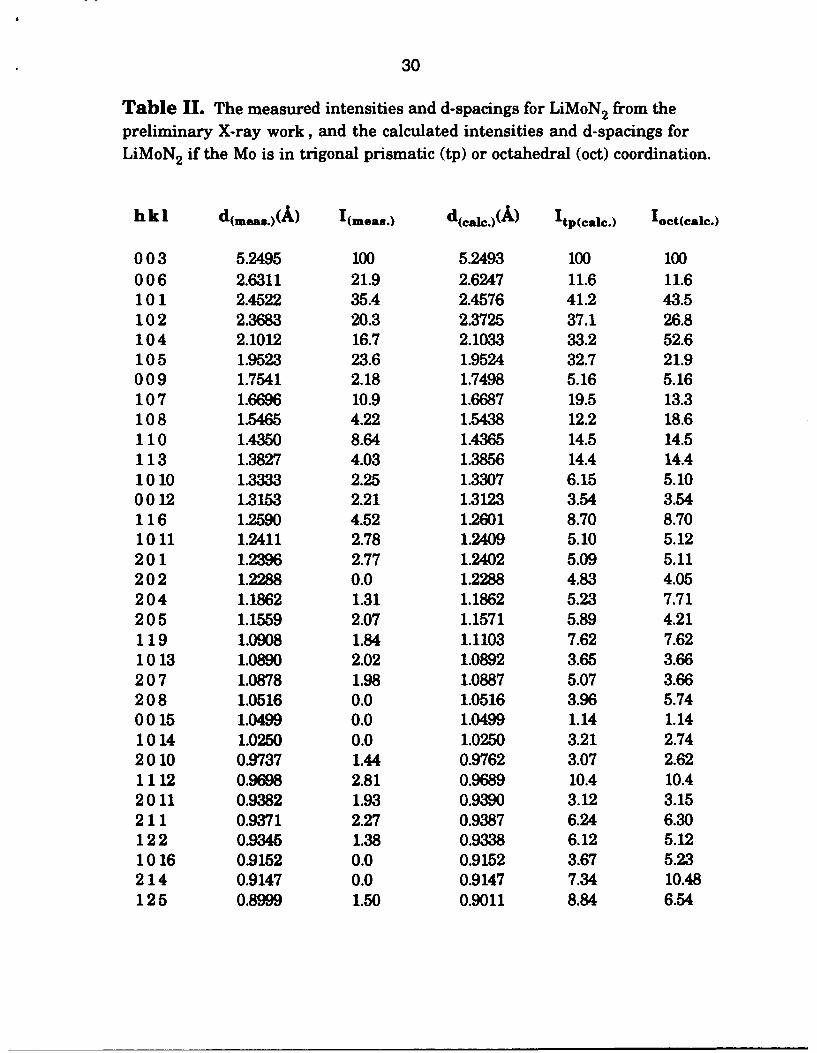
listed in Table I. Table II lists the measured intensities and d-spacings
from the X-ray powder pattern, as well as the calculated 2 intensities for
the R-3m and R3 structures.
10
Table I & H
There are some significant differences between the measured and the
calculated intensities in either of the space groups; this is due in part to the
preferred orientation that occurs when the graphite-like powder is packed
into the X-ray sample holder. Even though the relative intensities of the
(001) reflections are not affected by preferred orientation, they show
considerable variance with the calculated intensities, especially the 006 and
009 lines. This was the first indication that some molybdenum may be
located on lithium sites and vice versa.24 Since X-ray powder diffraction is
not sensitive for the detection of light atoms such as nitrogen and lithium,
we collected neutron powder diffraction data which does not suffer from the
sensitivity problems just mentioned.
Neutron Diffraction. A 6g sample of LiMoN 2 (a different sample than
was used in the X-ray study) was loosely packed into a 1.5cm diameter
vanadium can in an argon filled dry box. An aluminum cap was secured
to the top with epoxy to prevent air exposure. The Li 20 was not washed out
because of the difficulty in handling such large volumes of liquid ammonia;
hence this sample also contained about 0.5g of Li 20.
Neutron diffraction measurements on the sample were performed on a
triple axis diffractometer at the H4S station of the Brookhaven High Flux
Beam Reactor. The instrument configuration consisted of a pyrolytic
graphite monochromator and analyzer, in the (002) and (004) settings
respectively, along with collimator of 20' in-pile, 40' monochromator-
sample, 40' sample-analyzer and 20' analyzer-detector. The higher order
harmonics were eliminated with a pyrolytic graphite filter. The
S 11
wavelength was calibrated using CeO 2 (a = 5.4113A) and its value was
1.3585A.
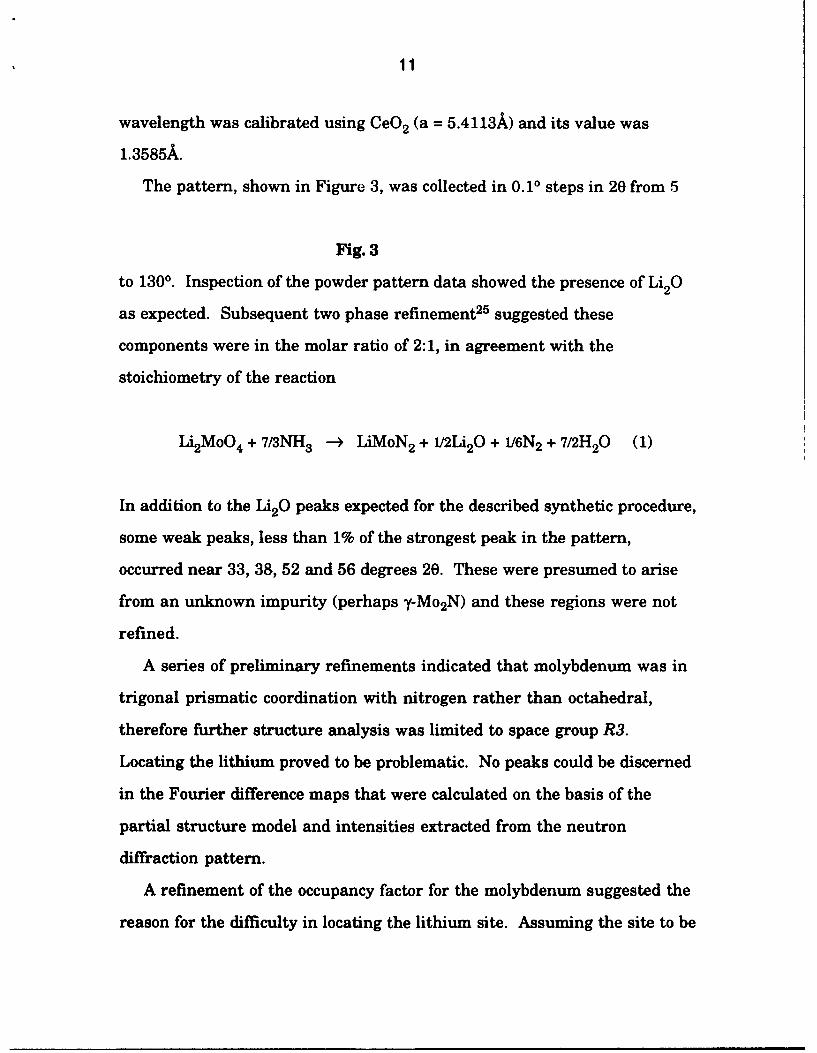
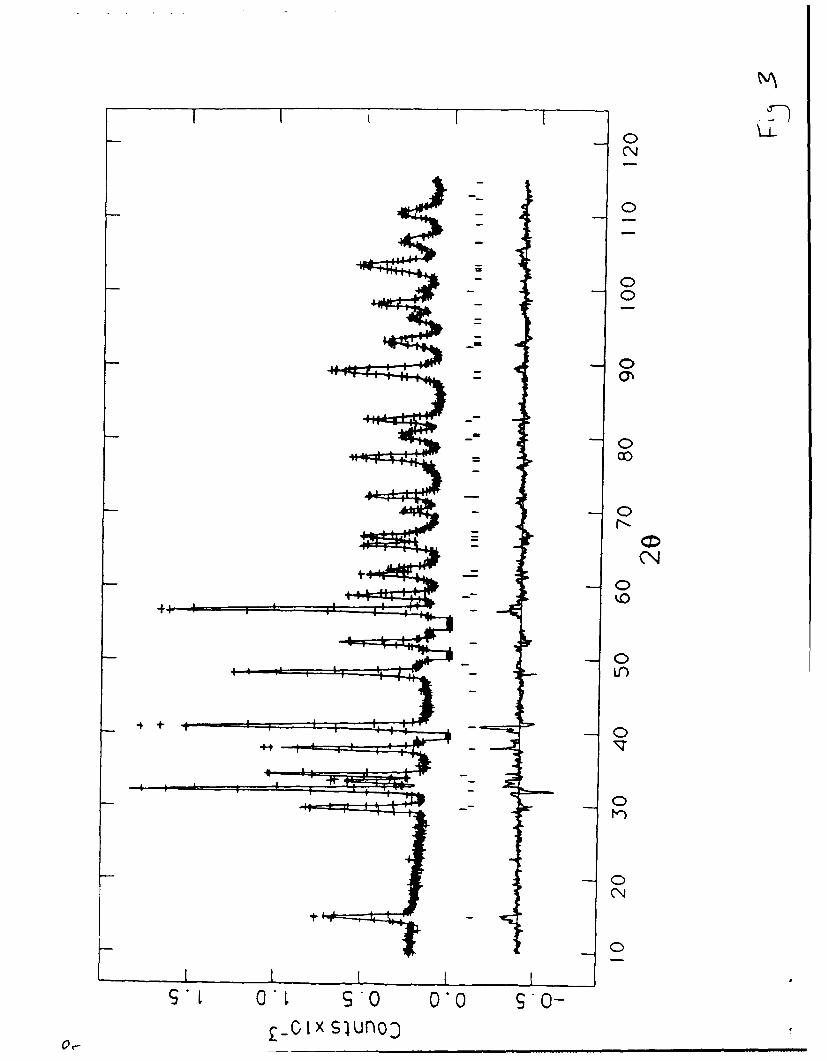
The pattern, shown in Figure 3, was collected in 0. 10 steps in 20 from 5
Fig. 3
to 1300. Inspection of the powder pattern data showed the presence of Li 20
as expected. Subsequent two phase refinement 25 suggested these
components were in the molar ratio of 2:1, in agreement with the
stoichiometry of the reaction
Li2MoO 4 + 7/3NH 3 - LiMoN 2 + 1/2Li 20 + 1/6N 2 + 7/2H 20 (1)
In addition to the Li20 peaks expected for the described synthetic procedure,
some weak peaks, less than 1% of the strongest peak in the pattern,
occurred near 33, 38, 52 and 56 degrees 20. These were presumed to arise
from an unknown impurity (perhaps y-Mo 2N) and these regions were not
refined.
A series of preliminary refinements indicated that molybdenum was in
trigonal prismatic coordination with nitrogen rather than octahedral,
therefore further structure analysis was limited to space group R3.
Locating the lithium proved to be problematic. No peaks could be discerned
in the Fourier difference maps that were calculated on the basis of the
partial structure model and intensities extracted from the neutron
diffraction pattern.
A refinement of the occupancy factor for the molybdenum suggested the
reason for the difficulty in locating the lithium site. Assuming the site to be
12
occupied exclusively by molybdenum, its refined occupancy was 0.8 rather
than 1.0. Since the stoichiometry LiMoN 2 is consistent with the chemistry
of this material and the relative proportions of Li20 and LiMoN 2 refined to
35% and 65% respectively, as expected, we assumed that there must be
mixing between the lithium and molybdenum metal layers. As such, any
deficiency in the molybdenum site should be coupled with a replacement of
an equivalent of lithium in the lithium site by the molybdenum. The
composition of the trigonal prismatic site can be easily estimated by 1)
assuming the site to be fully occupied and 2) from the apparent scattering
length observed for the site, presuming it to contain only molybdenum.
Simultaneous solution of the equations suggested the compositions of the
trigonal prismatic site and the as yet undisclosed lithiated site were
(Moo.84Lio.16) and (Lio.84Moo.16) respectively. The total scattering expected
from the latter site is then (0.8 4 bLi + 0.16bMo = -0.07), where the b's refer to
the scattering lengths of the elements occupying this site at random within
the structure. This small value is consistent with the lack of peaks in the
Fourier difference map.
The expected advantage neutron diffraction has over X-ray diffraction in
this case is the large scattering difference between trigonal prismatic and
octahedral coordination, and the inter-layer cations. This latter advantage
has largely been negated by the anti-site defects. However, the presence of
molybdenum in the lithium sites suggests favorable conditions for X-ray
scattering. At sin0/k = 0.0 the scattering expected for each lithium rich site
is about 0.84fLi + 0.16fMO = 9.2 electrons.
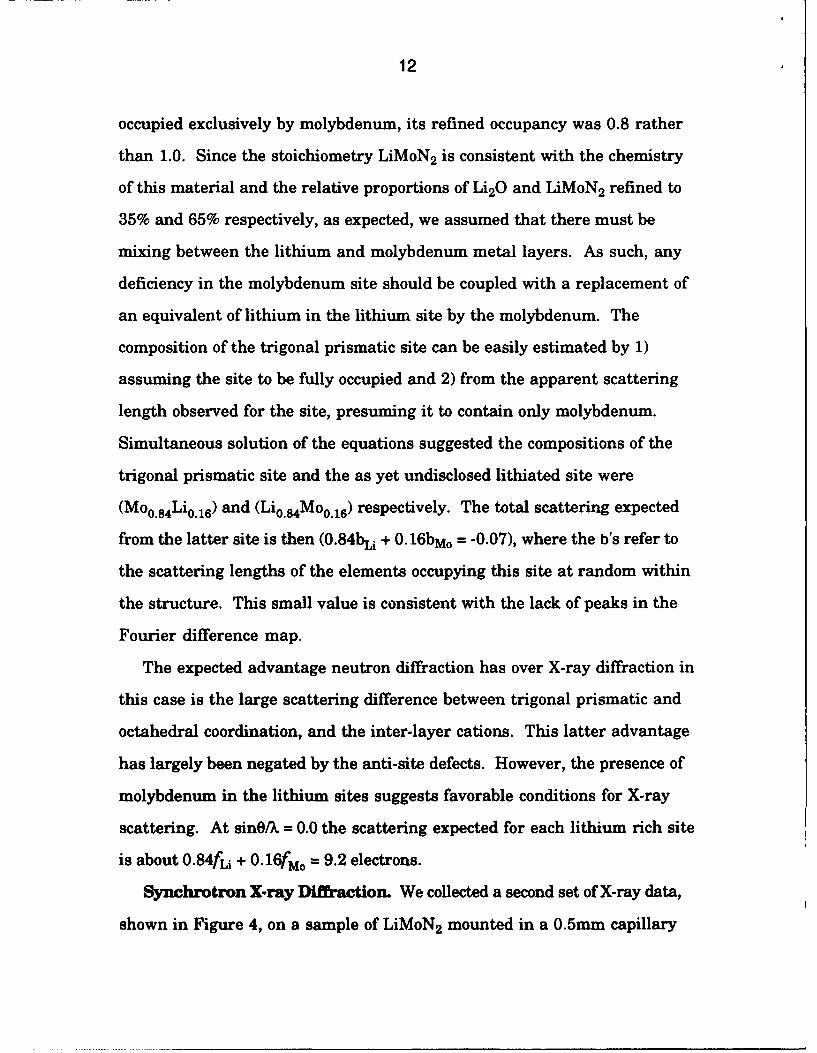
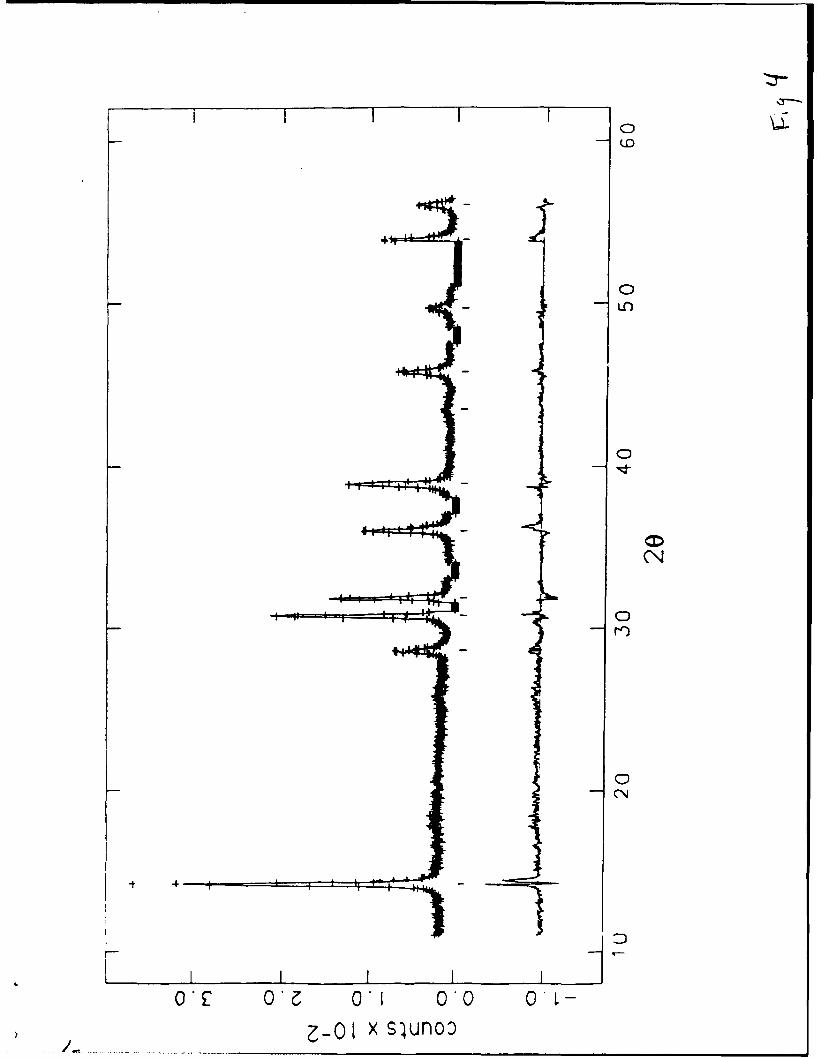
Synchrotron X-ray Diffraction. We collected a second set of X-ray data,
shown in Figure 4, on a sample of LiMoN 2 mounted in a 0.5mm capillary
13
Fig. 4
at a X=1.2981A to obtain more quantitative information. This technique was
used to correct for the preferred orientation expected in the powder
diffraction for this layered material. Using the parameters obtained for the
structure model derived from the neutron data, a Fourier difference map
was calculated based on the X-ray data. This revealed a peak of height 5
electrons/A-3 in the octahedral site between the MoN 2 layers. This was
estimated to correspond to 0.12Mo. Inclusion of this site lowered the profile
discrepancy from 0.297 to 0.260. Inclusion of this same amount of
scattering at the tetrahedral site (0,0,1/2) raised the discrepancy to 0.341.
The unique information offered by the X-ray and neutron experiments
were combined in a refinement using both the X-ray and neutron powder
diffraction data. Since these two sets of data were collected at different
temperatures, three phases were used in the refinement. The first two of
these were LiMoN 2. One phase for the X-ray data and one for the neutron
data; the positional and thermal parameters for the two phases were
constrained to be equal. Although the difference in the temperatures at
which the two data sets were collected was small, 10K, this caused a
measurable difference in the c cell parameter (see Table III). The third
phase defined was Li20, a significant component of the sample used in the
data collection. Both data sets were corrected for the effects of absorption
(for X-ray case personal communication with J. Hriljac and for the neutron
case A. W. Hewat, Acta. Cryst. A35, 248 (1979) as implemented in GSAS).
The model was refined with lithium/molybdenum mixed in the trigonal
prismatic site and the inter-layer octahedral site. The refinement was
14
constrained such that the formula was maintained, LiMoN 2, and all sites
were presumed to be fully occupied. The final refinement employed
independent isotropic thermal parameters for all sites. The z parameter of
the molybdenum site was fixed at zero in order to define the origin along the
c axis.
We attempted to refine the neutron diffraction data in space groups that
allowed the lithium to be placed in tetrahedral holes, molybdenum in
octahedral holes (in the molybdenum rich layer) and combinations of these
arrangements, but these refinements lead to structures that contained
unreasonable metal-nitrogen bond lengths (much shorter than the
expected: Li-N - 2.0 A and Mo-N ~ 2. A),26,10 and the fit between
experimental and calculated data was not good.
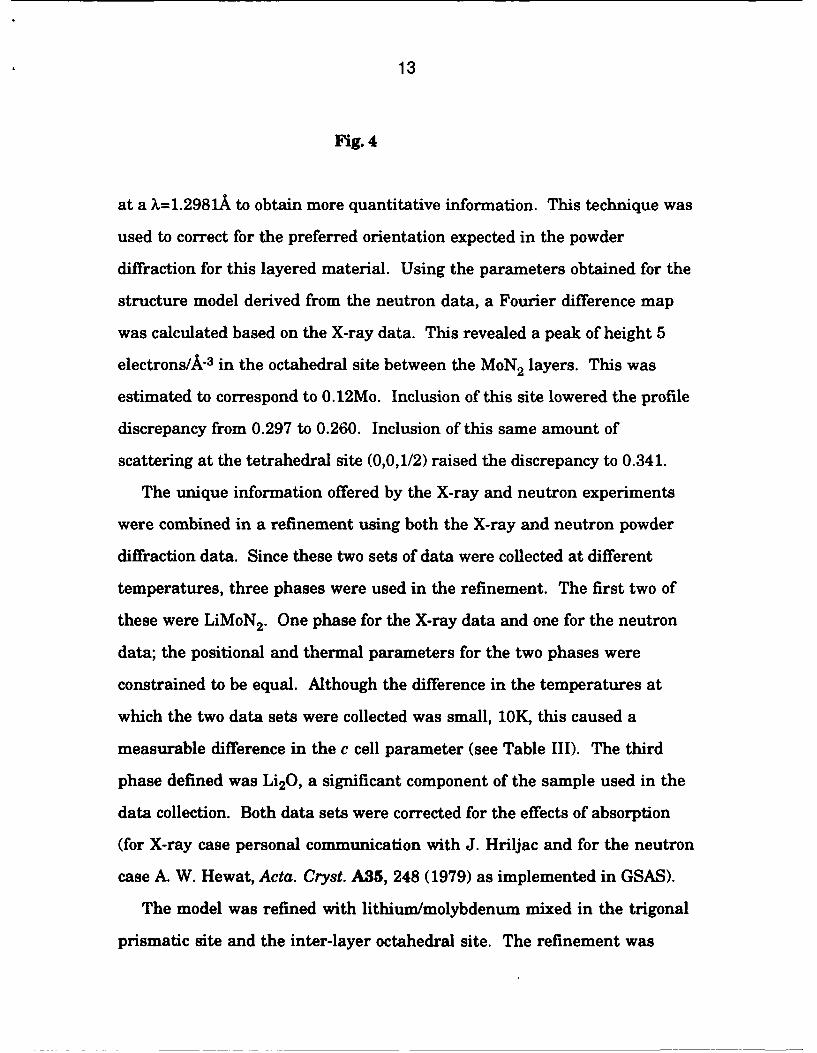
The comparatively large thermal parameters for the lithium site may
indicate some positional disorder for the lithium and molybdenum. The
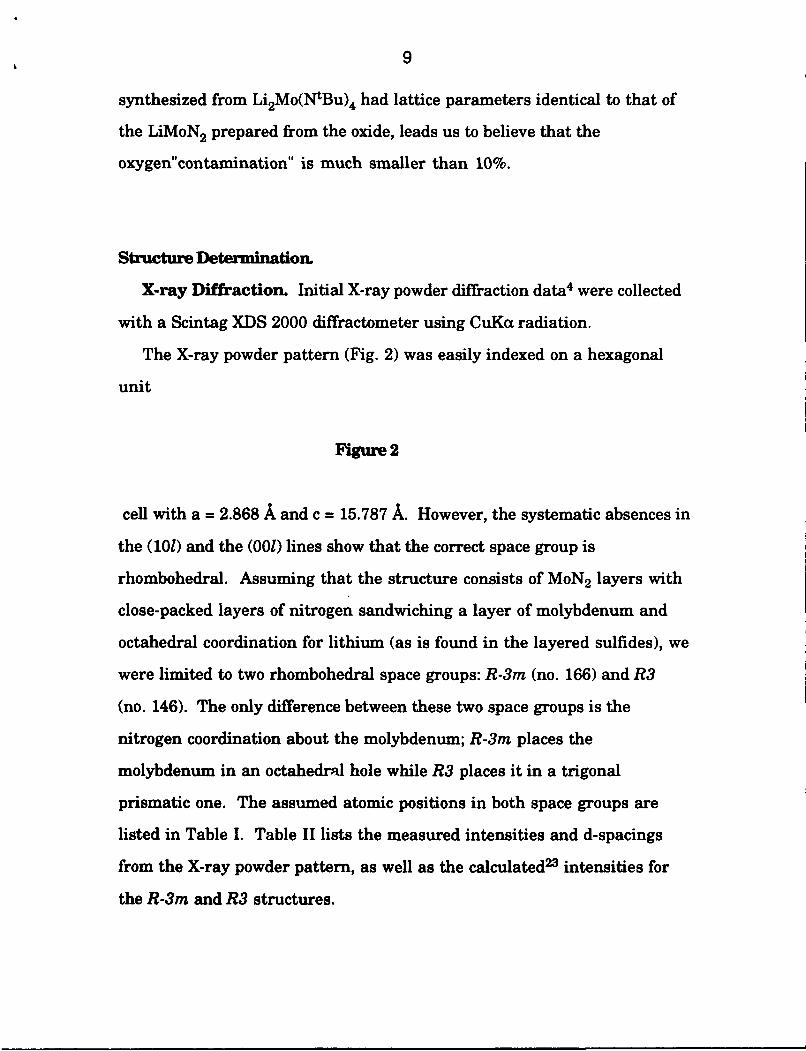
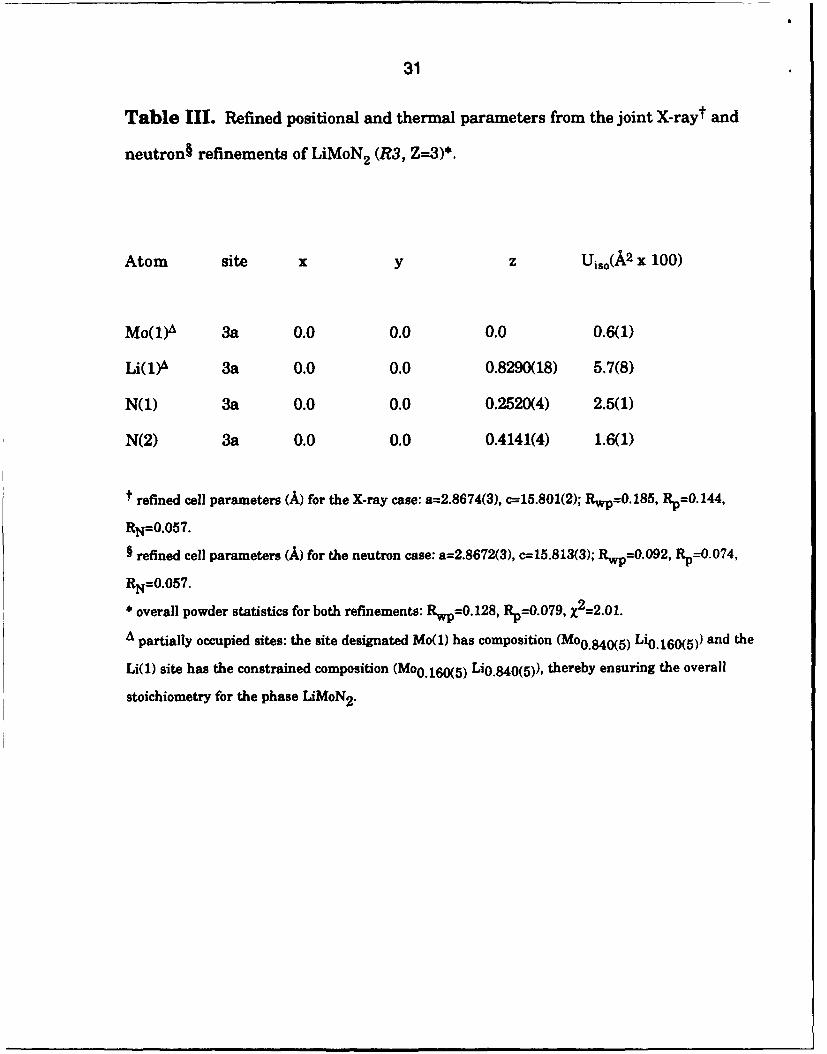
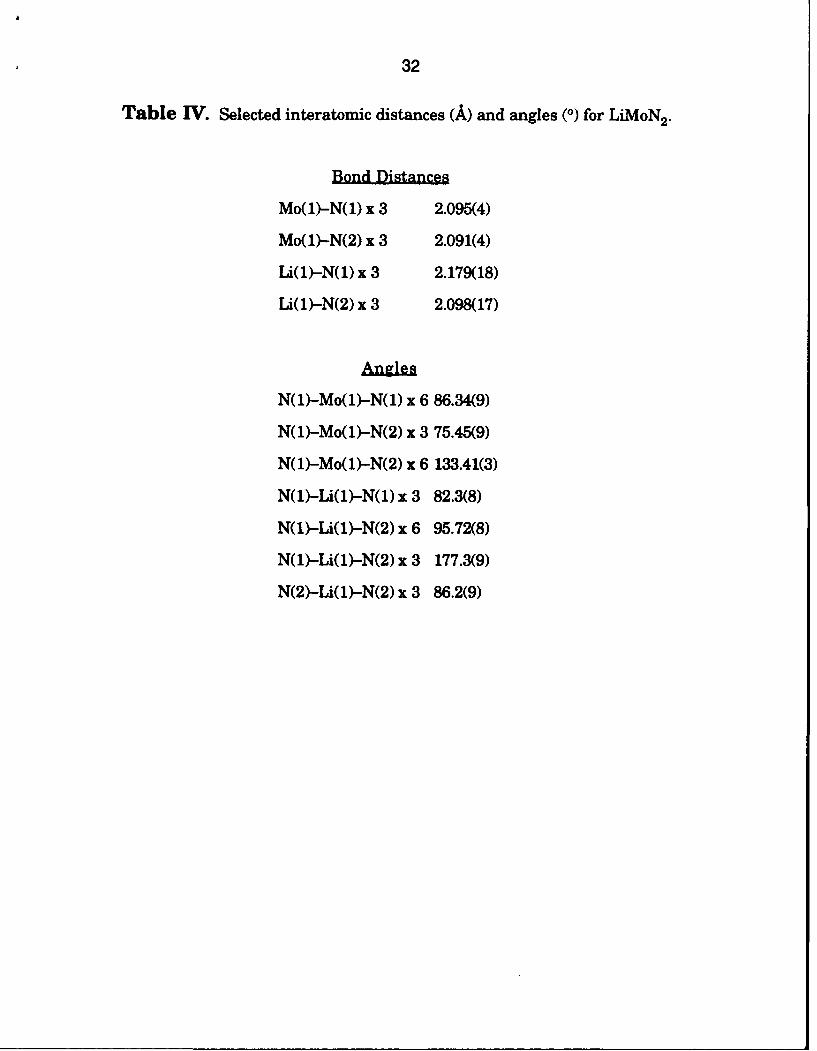
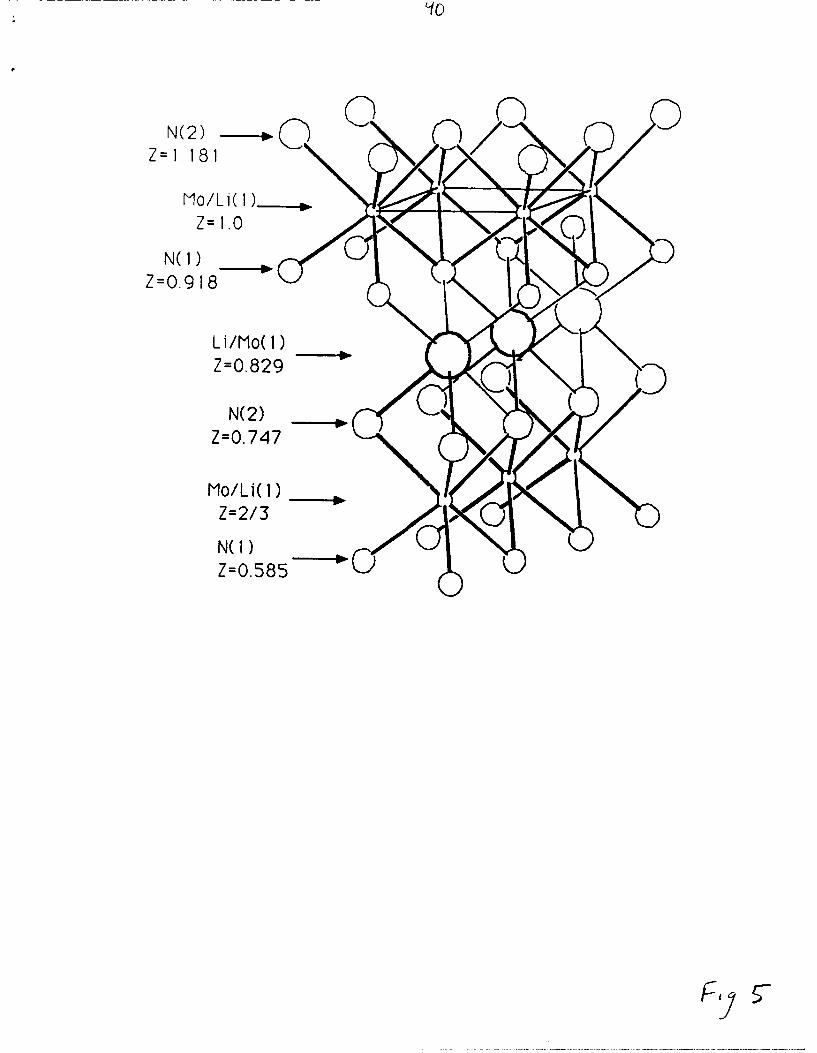
resulting structure and structural data from the refinement are displayed
in Figure 5 and Tables III & IV
Fig. 5, Tables JI&V
We have observed in X-ray powder diffraction experiments that when
LiMoN 2 is reheated in ammonia gas the 006 line intensity increases by as
much as 15%, indicating that the anti-site defect concentration or the
disorder is increasing. We also considered the possibility that the structure
may at least partially order at a lower temperature. A sample of LiMoN 2,
containing 16% anti-site defects, was sealed in an evacuated quartz tube
and annealed at 3000C for 34 days. An X-ray pattern of the resulting black
*15
powder showed no visible decomposition and the relative intensities of the
003 and 006 reflections remained the same, indicating that the anti-site
defect concentration was unaffected.
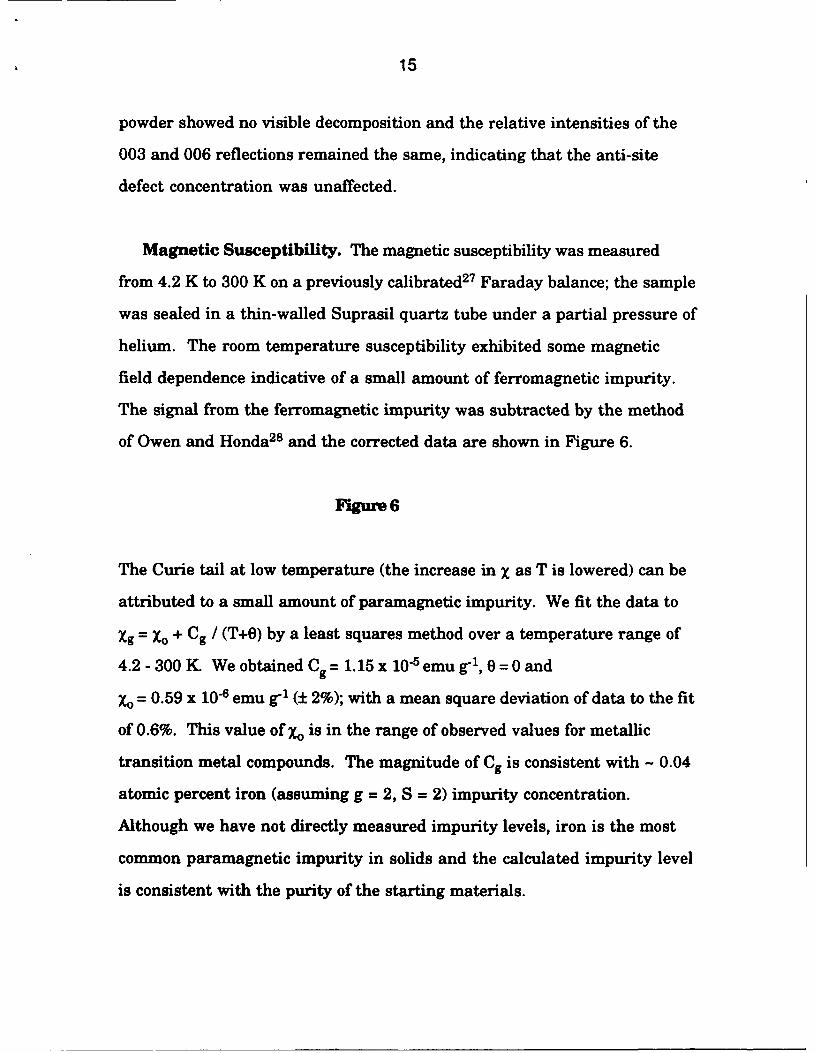
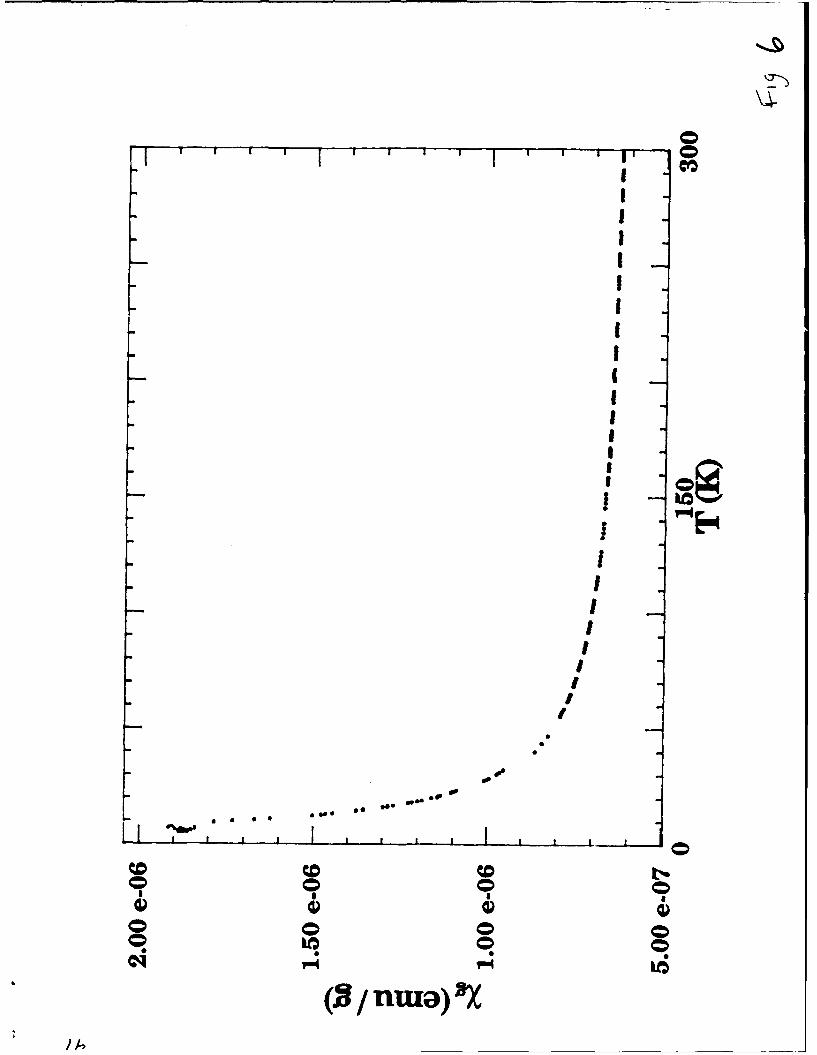
Magnetic Susceptibility. The magnetic susceptibility was measured
from 4.2 K to 300 K on a previously calibrated 27 Faraday balance; the sample
was sealed in a thin-walled Suprasil quartz tube under a partial pressure of
helium. The room temperature susceptibility exhibited some magnetic
field dependence indicative of a small amount of ferromagnetic impurity.
The signal from the ferromagnetic impurity was subtracted by the method
of Owen and Honda 28 and the corrected data are shown in Figure 6.
Figure6
The Curie tail at low temperature (the increase in X as T is lowered) can be
attributed to a small amount of paramagnetic impurity. We fit the data to
X5 = X. + Cg / (T+0) by a least squares method over a temperature range of
4.2 - 300 K We obtained C9 = 1.15 x 10⁻⁵ emu g-1, 0 = 0 and
x0 = 0.59 x 10⁻⁶ emu g (± 2%); with a mean square deviation of data to the fit
of 0.6%. This value of X0 is in the range of observed values for metallic
transition metal compounds. The magnitude of Cg is consistent with - 0.04
atomic percent iron (assuming g = 2, S = 2) impurity concentration.
Although we have not directly measured impurity levels, iron is the most
common paramagnetic impurity in solids and the calculated impurity level
is consistent with the purity of the starting materials.
16
Electrical Properties. A simple two-point resistance measurement of
LiMoN 2 was made by pressing a sample of the powder (2.3mm thick,
2.6mm diameter) between two metal rods in an insulating alumina
cylinder. The resistance of the pellet was less than 0.01 Q (the lower limit of
the measurement) greater than that measured when no powder was
present between the rods; this lead to a calculated resistivity at room
temperature of less than or equal to 2 x 101 Qz - cm. One major limitation of
the two probe method is that it may be dominated by particle - particle
contact resistance. Consequently, we can presently only give an upper limit
of resistivity. Attempts to make sintered pellets for four probe resistivity
measurements were unsuccessful due to the fragile nature of the pressed
pellets.
Chemical Properties. Lithium can generally be intercalated into or
deintercalated from layered structures; hence we felt this compound would
be amenable to such reactions.
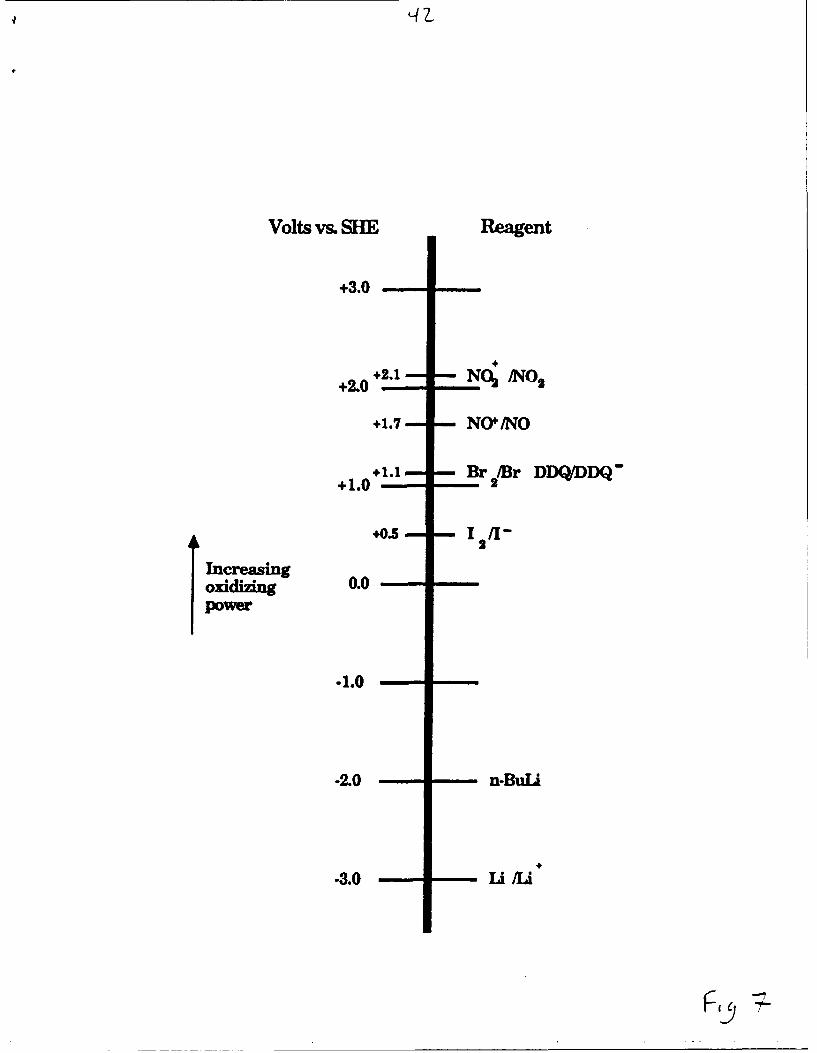
Several different oxidizing agents to remove lithium from LiMoN 2 were
investigated, including: 12, Br 2, DDQ (2,3-dichloro-5,6-
dicyanobenzoquinone), NOBF 4 and NO2BF 4. The potentials of these
oxidizing agents (in acetonitrile) versus a standard hydrogen electrode are
shown in Figure 7. 29 The expected reactions, if all lithium were removed,
are, for example:
LiMoN 2 + 1/212 --> MoN 2 + LiI (2)
LiMoN2 + 1/2Br 2 -- MoN 2 + LiBr (3)
LiMoN 2 + DDQ -- MoN 2 + Li*DDQ" (4)
LiMoN2 + NOBF 4 -- MoN 2 + LiBF 4 + NO(g) (5)
17
LiMoN2 + NO2BF4 -- MoN 2 + LiBF 4 + NO 2 (g) (6)
Figure 7
In each case the product salts are soluble in acetonitrile, while the MoN 2
and LiMoN 2 are insoluble.
The general procedure was to reflux approximately 150mg of the nitride
with a two-fold excess of the oxidizing agent dissolved in 50mL of dry
(stirred over powdered 3A sieves for at least 24h) acetonitrile for 1-2d. The
mixture was filtered, washed with fresh acetonitrile and dried in the
glovebox under vacuum. The extent of both deintercalation and side
reaction was determined by X-ray powder diffraction, mass loss and PES
analysis (see section on analysis).
No decolorization of the iodine (0. 1M in acetonitrile) solution was
observed when one equivalent of iodine was refluxed with the nitride.
Furthermore, there was little or no lithium iodide formation (no mass
change of the black LiMoN 2 powder), and there were no changes in the X-
ray powder diffraction pattern. We concluded that iodine was not a strong
enough oxidizing agent to remove more than perhaps a few percent of the
lithium.
The oxidizing power of the remaining agents was strong enough for at
least partial deintercalation. When the first 0.1-0.2 equivalents of bromine
solution (0. 1M in acetonitrile) were added, decolorization of the solution was
observed indicating deintercalation. However, when more than 0.2
equivalents of bromine were added, the solution became yellow indicating
some decomposition of the LiMoN 2. The resulting X-ray powder pattern
18
showed some broadening of the peaks indicating that a small fraction of
lithium had indeed been removed.
In the case of NOBF 4 and NO2BF 4 the evolution of gas (NO and NO2) was
observed which was indicative of reaction. However, there was a
reasonable amount of decomposition of the nitride with the use of NOBF 4
and NO2BF 4. This was indicated by a yellow or brown fitrate after
refluxing and washing the nitride, and a mass loss that was too great for
just the removal of one equivalent of lithium from LiMoN 2. The products of
decomposition have not been studied. The evolved NO(g) and NO2 (g) also
appear to react with the nitride. If the evolved gas was not rapidly removed
during the refluxing process, the resulting deintercalated species could not
be reintercalated with n-butyllithium. It was likely that a pacifying coating
had formed on the particles due to these oxidizing gases. When the gases
were swept away by bubbling argon gas through the solution at - 0.5 cc/s,
the deintercalated nitride could be reintercalated with n-butyllithium (in
hexane) at room temperature as was indicated by a shift of the lines in the
X-ray diffraction pattern back to the original positions observed in LiMoN 2.
Reaction with DDQ produced a deep reddish-orange solution which was
consistent with the formation of the Li DDQ" salt. The mass loss was
consistent with little or no side reaction. In all the above cases, significant
shifts to smaller d-spacings for the (001) lines were observed in the X-ray
powder diffraction pattern. This is the expected result since this set of lines
is most influenced by a change in the lithium content in layered
compounds.
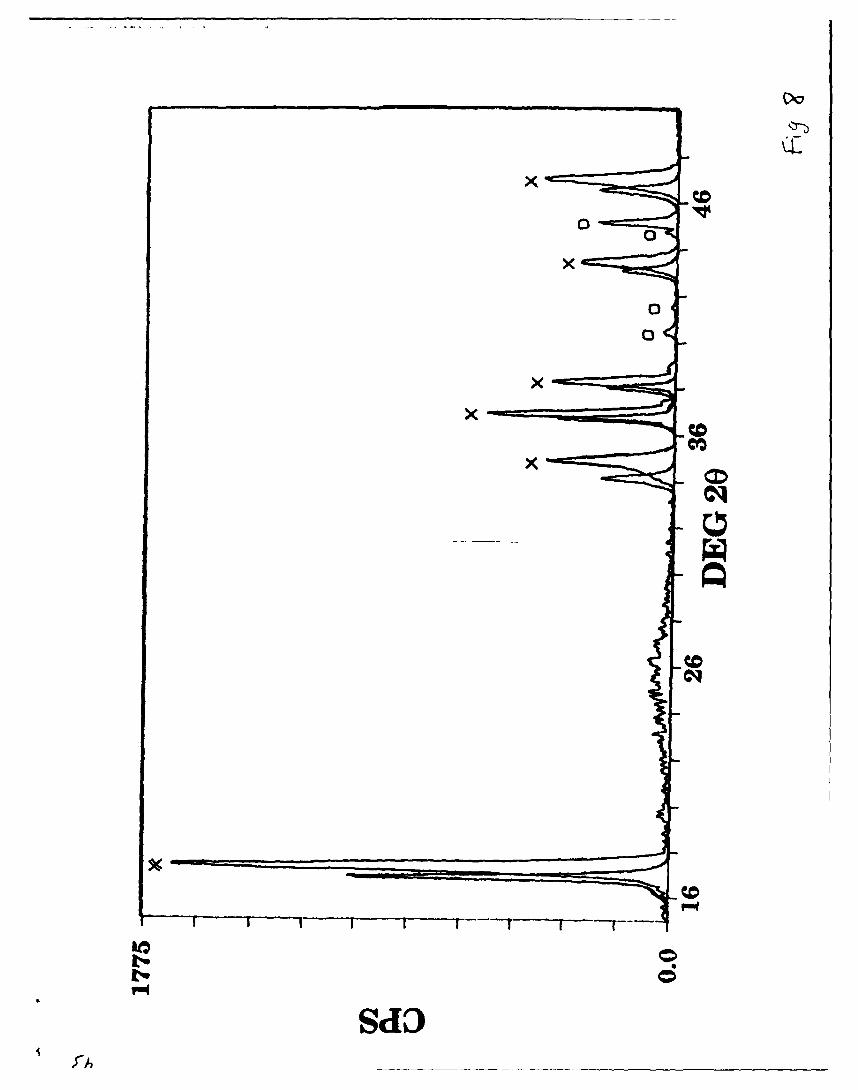
The X-ray powder pattern of the most lithium deficient phase obtained,
Li0 .36MoN 2, along with that for LiMoN 2, is displayed in Figure 8; the lattice
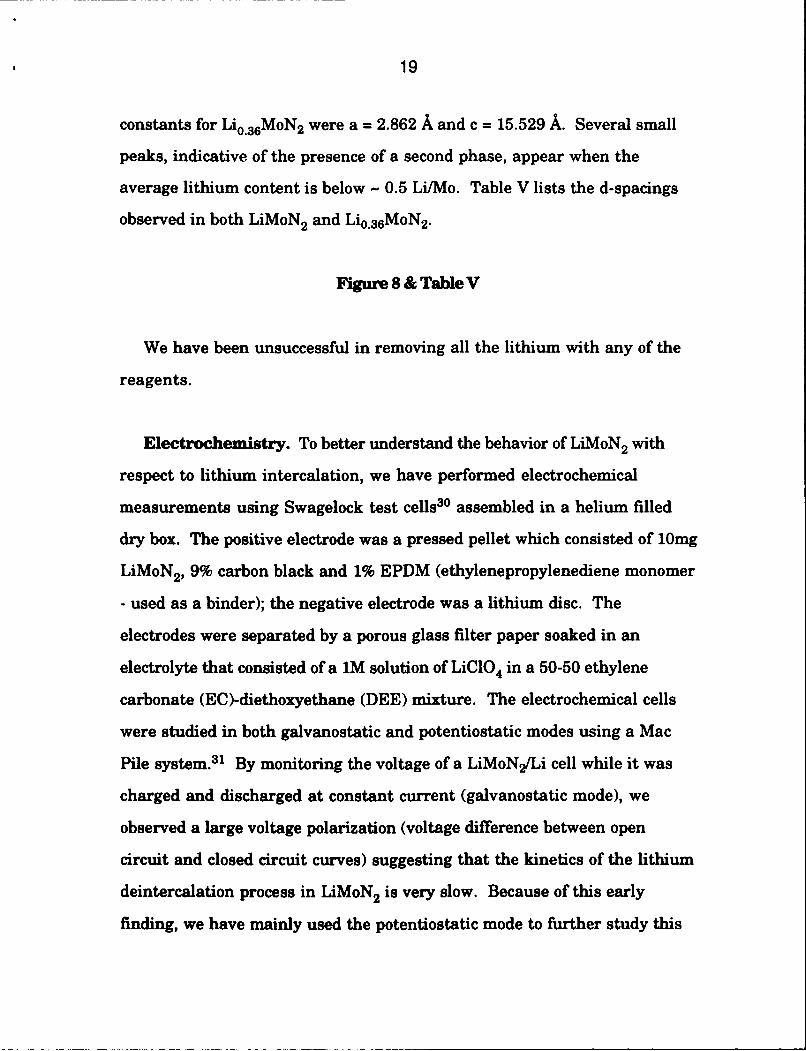
19
constants for Lio.36MoN 2 were a = 2.862 A and c = 15.529 A. Several small
peaks, indicative of the presence of a second phase, appear when the
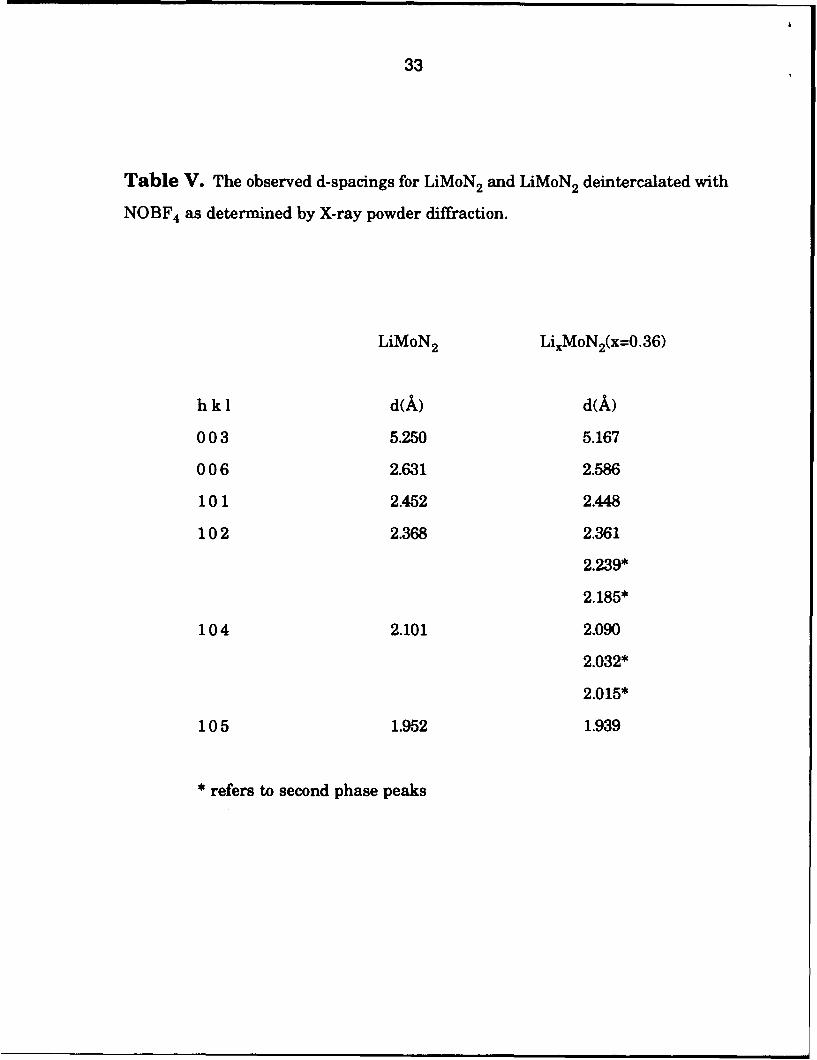
average lithium content is below - 0.5 Li/Mo. Table V lists the d-spacings
observed in both LiMoN 2 and Lio.36MoN 2.
Figure 8 & Table V
We have been unsuccessful in removing all the lithium with any of the
reagents.
Electrochemistry. To better understand the behavior of LiMoN 2 with
respect to lithium intercalation, we have performed electrochemical
measurements using Swagelock test cells 30 assembled in a helium filled
dry box. The positive electrode was a pressed pellet which consisted of 10mg
LiMoN 2, 9% carbon black and 1% EPDM (ethylenepropylenediene monomer
- used as a binder); the negative electrode was a lithium disc. The
electrodes were separated by a porous glass filter paper soaked in an
electrolyte that consisted of a 1M solution of LiClO 4 in a 50-50 ethylene
carbonate (EC)-diethoxyethane (DEE) mixture. The electrochemical cells
were studied in both galvanostatic and potentiostatic modes using a Mac
Pile system.31 By monitoring the voltage of a LiMoN2/Li cell while it was
charged and discharged at constant current (galvanostatic mode), we
observed a large voltage polarization (voltage difference between open
circuit and closed circuit curves) suggesting that the kinetics of the lithium
deintercalation process in LiMoN 2 is very slow. Because of this early
finding, we have mainly used the potentiostatic mode to further study this
20
system.
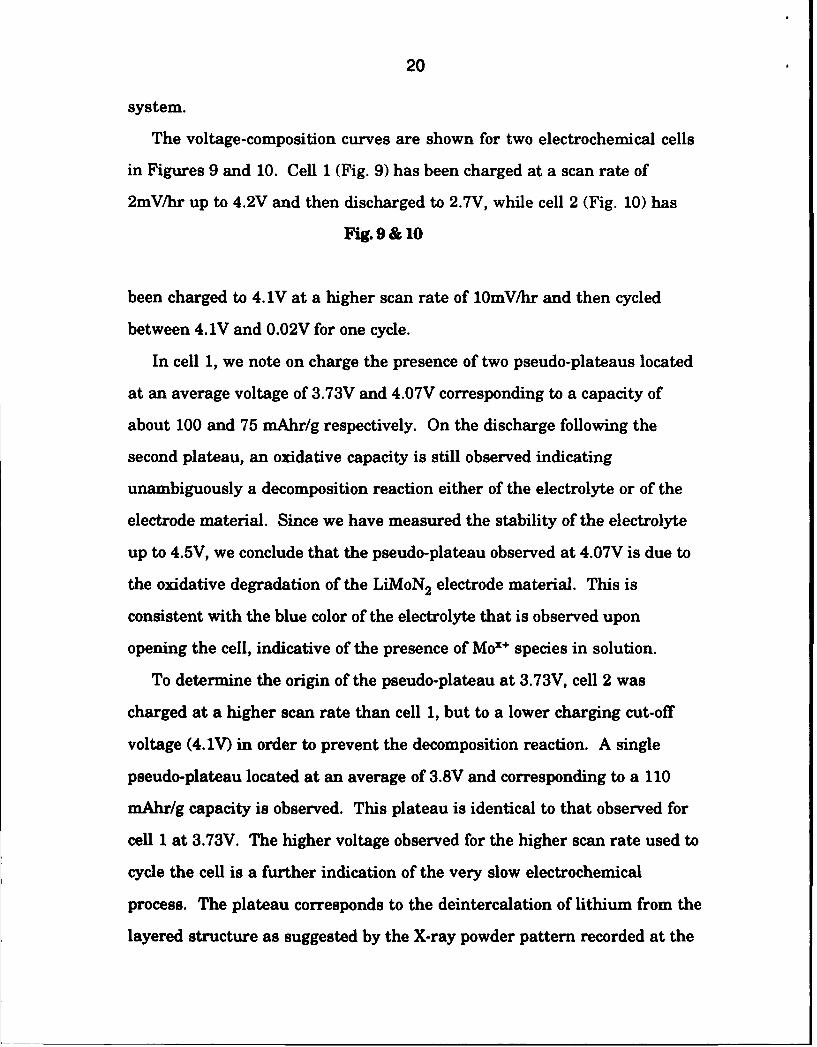
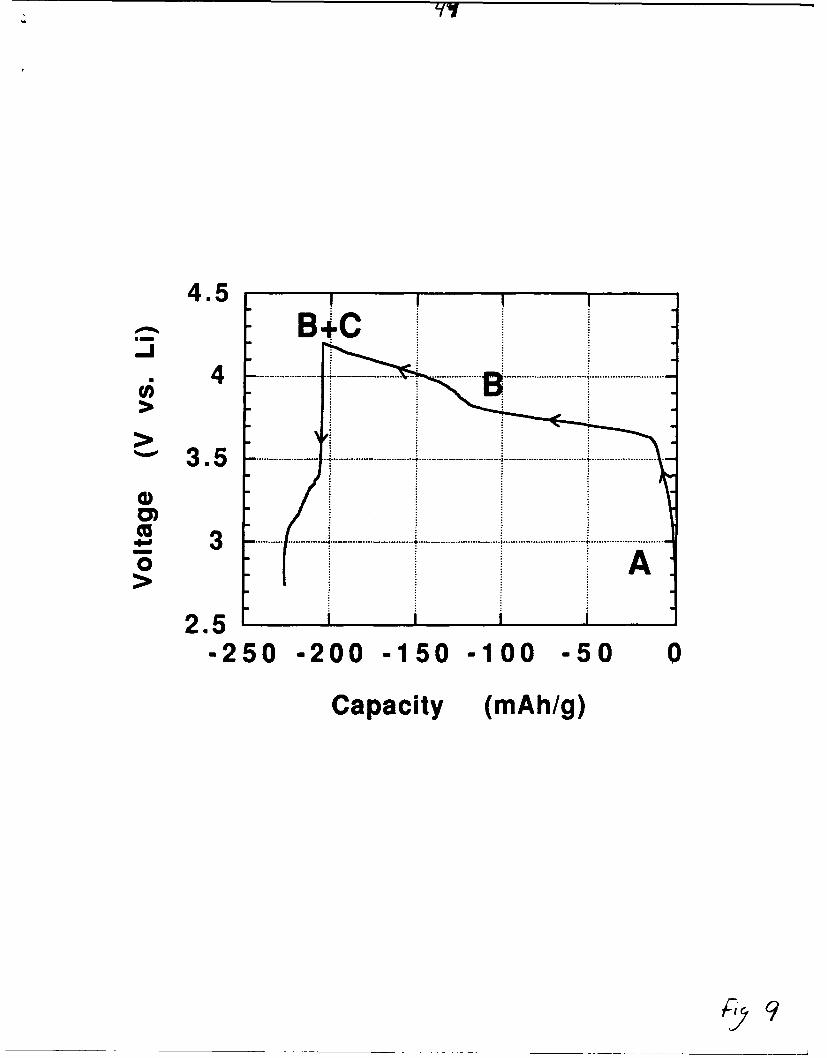
The voltage-composition curves are shown for two electrochemical cells
in Figures 9 and 10. Cell 1 (Fig. 9) has been charged at a scan rate of
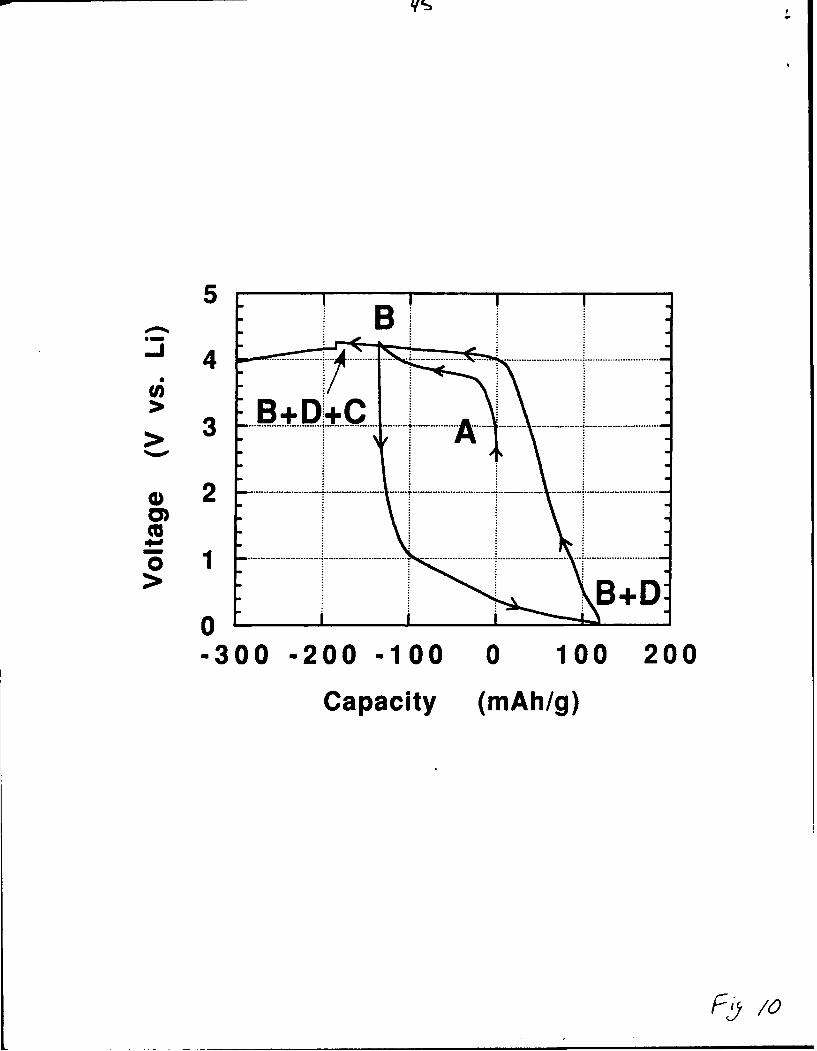
2mV/hr up to 4.2V and then discharged to 2.7V, while cell 2 (Fig. 10) has
Fig.9& 1o
been charged to 4. 1V at a higher scan rate of 10mV/hr and then cycled
between 4. 1V and 0.02V for one cycle.
In cell 1, we note on charge the presence of two pseudo-plateaus located
at an average voltage of 3.73V and 4.07V corresponding to a capacity of
about 100 and 75 mAhr/g respectively. On the discharge following the
second plateau, an oxidative capacity is still observed indicating
unambiguously a decomposition reaction either of the electrolyte or of the
electrode material. Since we have measured the stability of the electrolyte
up to 4.5V, we conclude that the pseudo-plateau observed at 4.07V is due to
the oxidative degradation of the LiMoN 2 electrode material. This is
consistent with the blue color of the electrolyte that is observed upon
opening the cell, indicative of the presence of Mox+ species in solution.
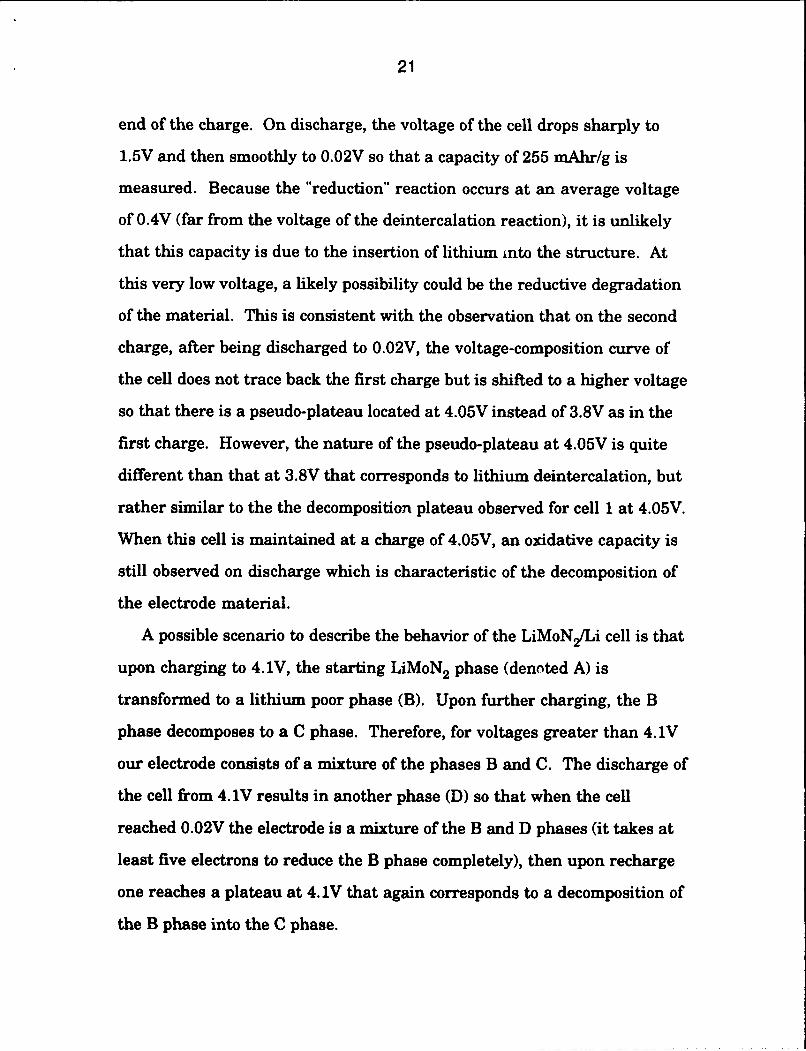
To determine the origin of the pseudo-plateau at 3.73V, cell 2 was
charged at a higher scan rate than cell 1, but to a lower charging cut-off
voltage (4. 1V) in order to prevent the decomposition reaction. A single
pseudo-plateau located at an average of 3.8V and corresponding to a 110
mAhr/g capacity is observed. This plateau is identical to that observed for
cell I at 3.73V. The higher voltage observed for the higher scan rate used to
cycle the cell is a further indication of the very slow electrochemical
process. The plateau corresponds to the deintercalation of lithium from the
layered structure as suggested by the X-ray powder pattern recorded at the
21
end of the charge. On discharge, the voltage of the cell drops sharply to
1.5V and then smoothly to 0.02V so that a capacity of 255 mAhr/g is
measured. Because the "reduction" reaction occurs at an average voltage
of O.4V (far from the voltage of the deintercalation reaction), it is unlikely
that this capacity is due to the insertion of lithium into the structure. At
this very low voltage, a likely possibility could be the reductive degradation
of the material. This is consistent with the observation that on the second
charge, after being discharged to 0.02V, the voltage-composition curve of
the cell does not trace back the first charge but is shifted to a higher voltage
so that there is a pseudo-plateau located at 4.05V instead of 3.8V as in the
first charge. However, the nature of the pseudo-plateau at 4.05V is quite
different than that at 3.8V that corresponds to lithium deintercalation, but
rather similar to the the decomposition plateau observed for cell 1 at 4.05V.
When this cell is maintained at a charge of 4.05V, an oxidative capacity is
still observed on discharge which is characteristic of the decomposition of
the electrode material.
A possible scenario to describe the behavior of the LiMoN 2/Li cell is that
upon charging to 4. 1V, the starting LiMoN 2 phase (denoted A) is
transformed to a lithium poor phase (B). Upon further charging, the B
phase decomposes to a C phase. Therefore, for voltages greater than 4. 1V
our electrode consists of a mixture of the phases B and C. The discharge of
the cell from 4.1V results in another phase (D) so that when the cell
reached 0.02V the electrode is a mixture of the B and D phases (it takes at
least five electrons to reduce the B phase completely), then upon recharge
one reaches a plateau at 4. 1V that again corresponds to a decomposition of
the B phase into the C phase.
22
Discussion
The ideal structure of LiMoN 2 is composed of stacked hexagonal close-
packed sheets of nitrogen with the molybdenum in trigonal prismatic
coordination between nitrogen sheets and lithium in octahedral
coordination. The X-ray/neutron diffraction data unequivocally shows that
the molybdenum is in trigonal prismatic coordination in the predominantly
molybdenum layers as predicted for d1 transition metals in layered
dichalcogenide compounds3 2 and the lithium is in octahedral coordination
in the predominantly lithium layers. However, the data indicates that
there are on the order of 16% anti-site defects between the lithium and
molybdenum metal layers. The defect concentration appears to be
unchanged when LiMoN 2 is annealed at 3000C.
The N-N distance of 2.8672 A is the shortest of any binary or ternary nitride
known; for example, Li3N (3.65 A), TiN (3.00 A)33 or Ca3CrN3 (3.01 A),
indicating a significant amount of covalency in LiMoN 2 .
In contrast to the structure of LiMoN 2, LiMoO 2 crystallizes in two
different structures. The low temperature form, which is prepared by
intercalating lithium into MoO 2,34 has a distorted rutile structure and
crystallizes in the space group P2 1 /c. The high temperature form,
prepared by reacting Li2MoO 4 with molybdenum metal at 9000C, has a
hexagonal layered structure (R-3m).3 5 In both structural forms, the
molybdenum ( d3 ) and lithium atoms are in octahedral holes.
The molybdenum in LiMoN 2 contains one unpaired d electron which
23
leads one to predict that this compound should exhibit metallic behavior as
in for example 2H-TaS 2 or 2H-NbSe2. 32 We have found supporting
evidence for this: black in color, Pauli-paramagnetic behavior and a
resistivity less than 2 x 10 -30 - cm.
The asymmetric peaks (Fig. 8) of the deintercalated LiMoN 2 are likely
due to inhomogeneous removal of the lithium: some particles contain more
lithium than others or the region near particle surfaces contain less
lithium than the middle of the particles. It seems reasonable that this
could be quite sensitive to the particle size distribution and to the actual
diffusion rate, or the possibility that LilxMoN2 may not form a continuous
single phase for all x.
None of the chemical oxidizing agents were able to completely
deintercalate the lithium. This may be due in part to a lower lithium
diffusion rate at low lithium content, the 0. 16Li in the molybdenum layer
may be much less mobile than the lithium in the the lithium rich layer, or
the potential needed to remove more and more lithium exceeds the
oxidizing power of the deintercalating agents being used. This latter
possibility is supported by the analytical data showing that more lithium
can be deintercalated by NOBF 4 (+4.7 V vs. Li / Li+) than by DDQ (+4.1 V vs.
Li / Li+). Unfortunately, good PES data was not consistently obtained for the
deintercalation products that resulted from using NO2BF 4 (+5.1 V vs. Li /
Li+). The lithium can be reinserted at room temperature with n-
butyllithium if the oxidizing gases (NO and NO2) are swept away.
From the electrochemical data, one can conclude that 0.6 Li can be
removed from the structure by charging the cell to 4. 1V which is in
reasonable agreement with the chemical deintercalation data. Attempts to
remove more than 0.6 Li resulted in an oxidative decomposition of the
24
LiMoN 2 phase. This electrochemical process is not reversible since
attempts to reinsert lithium electrochemically have been unsuccessful. It
is unusual that reintercalation cannot be accomplished electrochemically
while chemically it can be. If it is assumed that some oxidative degradation
occurs in both methods of deintercalation, it is possible that the degradation
product is soluble in refluxing acetonitrile, effectively cleaning the particle
surfaces making it possible for reintercalation. However, in the
electrochemical case the particles may remain coated making it difficult for
reintercalation thus requiring lower potentials for insertion and eventually
reductive degradation.
The electrochemical properties of a compound are usually directly
related to their structure. The neutron diffraction data indicates the
presence of anti-site defects and it is well known 24 that the presence of 3d
metal ions within the lithium layers slow the kinetics of the
intercalation/deintercalation chemistry considerably. It is possible that as
lithium is being removed from the structure the anti-site defect
concentration is increased, blocking the lithium diffusion paths and
making subsequent lithium intercalation/deintercalation more difficult or
even impossible.36,37 This may also be a source of irreversibility in the
electrochemical reactions.
CodusWiM
We have synthesized a new ternary nitride, LiMoN 2 from two different
precursors and ammonia gas. The resistivity and the Pauli-
25
paramagnetism indicate metallic behavior. It has a layered structure and
the lithium can be deintercalated with several different oxidizing agents, as
well as in an electrochemical cell; reintercalation is accomplished using n-
butyllithium.
Acknowledgments
We are grateful to the Office of Naval Research for its generous support
of our nitride work and the Department of Education Fellowship supporting
SHE.
We are are also grateful to: Mike Rutzke in the Department of Fruit and
Vegetables at Cornell University for assistance in the FES analysis, Daccai
Xie at the H4S High Flux Beam Reactor at BNL for collecting the neutron
diffraction data and Joe Hriljac for the ,ynchrotron X-ray diffraction data
collection on beamline X-7A at NSLS supported by the Division of Materials
Science (DOE) under contract DE-AC02-76CH0001 to D. E. Cox.
26
(1) Gudat, A.; Rabenau, A.; Bronger, W. and Ruschewitz, U. J, Less -
Comm. Met. 1990,,161, 3 1.
(2) Gudat, A.; Haag, S.; Kniep, R. and Rabenau, A. Z. Naturforsch. 1990,
45b, 111.
(3) Juza, V. A.; Gieren, W. and Haug, J. Z. Z. Anorg. Alug. Chem. 1959,
300,61.
(4) Chemn, M. Y. and DiSalvo, F. J. J. Solid State Chem. 1990, 88, 459.
(5) Gudat, A.; Haag, S.; Kniep, R. and Rabenau, A. J.Less - Comm. Met.
1990,159, L29.
(6) Chemn, M. Y.; Vennos, D. A. and DiSalvo, F. J. J Solid State Chem.
1992,96,415.
(7) Jacobs, H. and von Pinkowski, E. J. Less - Comm. Met. 1989, 146, 147.
(8) Vennos, D. A.; Badding, M. E. and DiSalvo, F. J. Inorg. Chem. 1990,
29,4059.
(9) Cordier, G.; Hohn, P.; Kniep, R. and Rabenau, A. Z. Anorg. Au~g.
Chem., in press.
(10) Gudat, A.; Hohn, P.; Kniep, R. and Rabenau, A. Z. Naturforsch. B, in
press.
(11) Hohn, P.; Kniep, R. and Rabenau, A. Z. Kristallog. in press.
(12) Hohm, P. et al. Angew. Chem. Int. Ed. Engl. 1991, 30(no. 7),
831.
(13) Whittingham, M. S. Prog. Solid State Chem. 1978, 12,41.
(14) Rouxel, J. In Physics and Chemistry of Compounds with Layered
Structures; Levy, F., Ed.; Reidel Pubi.: Dordrecht, Netherlands, 1979;
p 201.
27
(15) Whittingham, M. S. J. Electrochem. Soc. 1976, 123, 315.
(16) Danopoulos, A. A.; Wilkinson, G.; Hursthouse, M. B. and Hussain, B.
Polyhedron 1989, 8(24), 2947.
(17) Rauch, P. E. and DiSalvo, F. J. Inorg. Synth. in press.
(18) Murphy, D. W.; Cros, C.; DiSalvo, F. J. and Waszczak, J. V.
Inorg. Chem. 1977, 16, 3027.
(19) Dye, J. L., Michigan State University, personal communication, 1991.
(20) Boilman, D. H. Anal. Chem. 1972, 44, 887.
(21) Czechowicz, D. G., Los Alamos National Laboratory, personal
communication, 1989.
(22) Cherm, M. Y.; Mariani, R. D.; Vennos, D. A. and DiSalvo, F. J.
Rev. Sci. Instrum. 1990, 61(6), 1733.
(23) Yvon, K.; Jeitschko, W. and Parthe, E. J. Appi. Crystallogr. 1977, 10,
73.
(24) Thomas, M. G. S. R.; David, W. I. F. and Goodenough, J. B. Mat. Res.
Bull. 1985, 20, 1137.
(25) Larson, A. C. and Von Dreele, R. B., Generalized Structure Analysis
System, LANCE, MS-H805, Los Alamos National Laboratory, Los
Alamos, NM 87545.
(26) Rabenau, A. and Schulz, H. J. Less - Comm. Met. 1976, 50, 155.
(27) Vassiliou, J.; Hornbostel, M.; Ziebarth, R. and DiSalvo, F. J. J. Solid
State CThem. 1989, 81, 208.
(28) Selwood, P. W. Magnetochemistry; Wiley-Interscience: New
York, 1979; p 186.
(29) Wizansky, A. R.; Rauch, P. E. and DiSalvo, F. J. J. Solid State Chem.
1989,81,208.
28
(30) Guyomard, D. and Tarascon, J. M. J. Electrochem. Soc, in press.
(31) Mac Pile Data Acquisition System for Insertion Compounds, CNRS,
Grenoble, France.
(32) Mattheiss, L. F. Phys. Rev. B 1973,8, 3719.
(33) Beattie, H. J. and VerSnyder, F. L. Trans. Am. Soc. Met. 1953, 45,
397.
(34) Murphy, D. W.; DiSalvo, F. J.; Carides, J. N. and Waszczak, J. V.
Mat. Res. Bull. 1978, 13, 1395.
(35) Aleandri, L. E. and McCarley, R. E. Inorg. Chem. 1988, 27, 1041.
(36) Murphy, D. W. NATO Conf Ser. E. 1985, 101, 18 1.
(37) Sandre, E.; Brec, R. and Rouxel, J. J. Solid State Chem. 1990, 88, 269.
1ooeq 4
(.SuI) R-STOO
29
Table I. Ideal positional parameters initially proposed for the
possible structure of LiMoN 2.
spB(c group R
atom site x y z
Mo 3a 0 0 0
Li 3a 0 0 5/6
N(1) 3a 0 0 1/4
N(2 3a 0 0 5/12
space group R-3ym
MO 3a 0 0 0
Li 3b0 0 1/2
N 6c 0 0 1/4
30
Table II. The measured intensities and d-spacings for LiMoN 2 from thepreliminary X-ray work, and the calculated intensities and d-spacings forLiMoN 2 if the Mo is in trigonal prismatic (tp) or octahedral (oct) coordination.
h k I d(meua.)(A) I(meas.) d(calC.)(A) itp(calc.) Ioct(calc.)
003 5.2495 100 5.2493 100 100006 2.6311 21.9 2.6247 11.6 11.6101 2.4522 35.4 2.4576 41.2 43.5102 2.3683 20.3 2.3725 37.1 26.8104 2.1012 16.7 2.1033 33.2 52.6105 1.9523 23.6 1.9524 32.7 21.9009 1.7541 2.18 1.7498 5.16 5.16107 1.6696 10.9 1.6687 19.5 13.3108 1.5465 4.22 1.5438 12.2 18.6110 1.4350 8.64 1.4365 14.5 14.51 13 1.3827 4.03 1.3856 14.4 14.41010 1.3333 2.25 1.3307 6.15 5.100012 1.3153 2.21 1.3123 3.54 3.541 16 1.2590 4.52 1.2601 8.70 8.701011 1.2411 2.78 1.2409 5.10 5.12201 1.2396 2.77 1.2402 5.09 5.11202 1.2288 0.0 1.2288 4.83 4.05204 1.1862 1.31 1.1862 5.23 7.71205 1.1559 2.07 1.1571 5.89 4.211 19 1.0908 1.84 1.1103 7.62 7.621013 1.0890 2.02 1.0892 3.65 3.66207 1.0878 1.98 1.0887 5.07 3.66208 1.0516 0.0 1.0516 3.96 5.740015 1.0499 0.0 1.0499 1.14 1.141014 1.0250 0.0 1.0250 3.21 2.742010 0.9737 1.44 0.9762 3.07 2.621112 0.9698 2.81 0.9689 10.4 10.42011 0.9382 1.93 0.9390 3.12 3.15211 0.9371 2.27 0.9387 6.24 6.30122 0.9345 1.38 0.9338 6.12 5.121016 0.9152 0.0 0.9152 3.67 5.23214 0.9147 0.0 0.9147 7.34 10.48125 0.8999 1.50 0.9011 8.84 6.54
31
Table III. Refined positional and thermal parameters from the joint X-rayt and
neutron§ refinements of LiMoN 2 (R3, Z=3)*.
Atom site x y z Uio(A2 x 100)
Mo(1)A 3a 0.0 0.0 0.0 0.6(1)
Li(1)A 3a 0.0 0.0 0.8290(18) 5.7(8)
N(1) 3a 0.0 0.0 0.2520(4) 2.5(1)
N(2) 3a 0.0 0.0 0.4141(4) 1.6(1)
t refined cell parameters (A) for the X-ray case: a=2.8674(3), c=15.801(2); Rwp=O. 185, Rp=O. 144,
RN=0.057.
§ refined cell parameters (A) for the neutron case: a=2.8672(3), c=15.813(3); Rwp=0.092, Rp=0.074,
RN=0.0 5 7 .
overall powder statistics for both refinements: Rwp=0.128, Rp=0.079, X2=2.01.
A partially occupied sites: the site designated Mo(1) has composition (Mo0.840(5) Li0 .160(5)) and the
Li(1) site has the constrained composition (Mo0 .160(5) Li0.840(5)), thereby ensuring the overall
stoichiometry for the phase LiMoN2 .
32
Table IV. Selected interatomic distances (A) and angles (0) for LiMoN 2.
Bond Distances
Mo(1)-N(1) x 3 2.095(4)
Mo(1)-N(2) x 3 2.091(4)
Li(1)-N(1) x 3 2.179(18)
Li(1)-N(2) x 3 2.098(17)
Angle
N(1)-Mo(1)-N(1) x 6 86.34(9)
N(1)-Mo(1)-N(2) x 3 75.45(9)
N(1)-Mo(1)-N(2) x 6 133.41(3)
N(1)-Li(1)-N(1) x 3 82.3(8)
N(1)-Li(1)-N(2) x 6 95.72(8)
N(1)-Li(1)-N(2) x 3 177.3(9)
N(2)-Li(1)-N(2) x 3 86.2(9)
33
Table V. The observed d-spacings for LiMoN 2 and LiMoN 2 deintercalated with
NOBF 4 as determined by X-ray powder diffraction.
LiMoN 2 LixMoN 2(X=0.36)
hkI d(A) d(A)
003 5.250 5.167
006 2.631 2.586
101 2.452 2.448
102 2.368 2.361
2.239*
2.185*
104 2.101 2.090
2.032*
2.015*
105 1.952 1.939
* refers to second phase peaks
34
Figure Captions
Figure 1. TGA of LiMoN 2 in air: 30 0C to 1000C at 20C/min; 1000C to
700'C at 50C/min; 7000C for 300min; 7000C to 300C at 25 0C/min.
Figure 2. X-ray powder diffraction pattern of LiMoN2.
Figure 3. The neutron diffraction data for LiMoN 2 collected at 293K at
the steady state source at Brookhaven National Lab (BNL). Points shown
by (+) represent observed data. The continuous lines through the sets of
points are the calculated profiles from refinements given in Table III.
The tic marks below the data indicate the positions of the allowed
reflections for both LiMoN 2 (bottom set) and Li20 (top set). The lower
curve represents the difference between observed and calculated
profiles. Ga .,, the pattern are regions containing peaks arising from
impurities ind were excluded from the refinement.
Figure 4. The X-ray data for LiMoN 2 collected at 300K at the
National Synchrotron Light Source (NSLS) at BNL. Points shown as (+)
represent observed data. The continuous lines through the sets of points
are the calculated profiles from the refinements given in Table III. The
set of tic marks below the data indicate the positions of the allowed
reflections. Gaps in the pattern are regions containing peaks arising
from impurities and were excluded from the refinement. The lower
curve represents the difference between observed and calculated
profiles.
Figure 5. Part of the structure of LiMoN 2 emphasizing the
coordination of the site between the MoN 2 layers that is predominantly
occupied by Li (large circles). The (001) face of the unit cell is outlined.
35
Figure 6. Temperature dependent susceptibility of LiMoN 2.
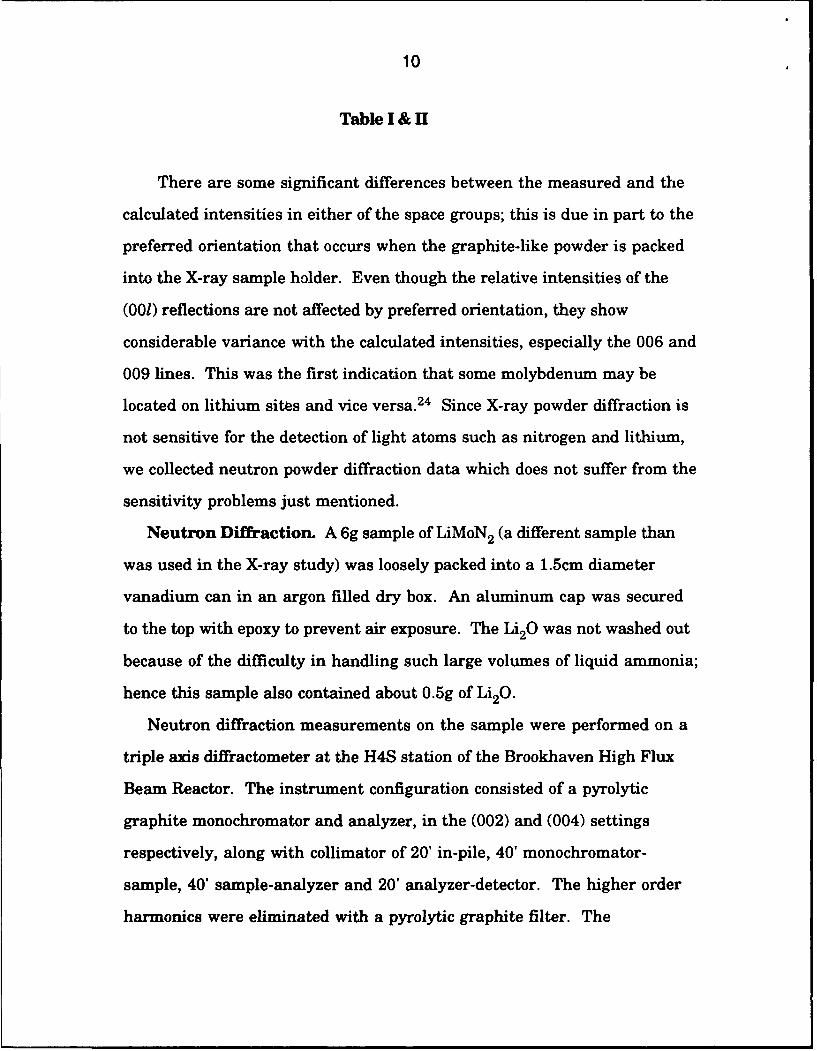
Figure 7. Approximate potentials (vs. standard hydrogen electrode)
of the oxidizing agents, in dry acetonitrile, used for the deintercalation of
LiMoN 2 (adapted from ref. 27).
Figure 8. The X-ray powder pattern of Lio.36MoN 2 (deintercalated
with NOBF 4) superimposed on the powder pattern for LiMoN 2.
Lio.36MoN 2 peaks are denoted by an x and second phase peaks
(introduced by the deintercalation reaction) by an o.
Figure 9. Voltage-composition curve for cell 1. It was charged to 4.2V
at 2mV/hr and then discharged to 2.7V. Phase A is LiMoN 2, phase B is
a lithium poor phase (Li1 xMoN 2), phase C results from the oxidative
decomposition of B.
Figure 10. Voltage-composition curve for cell 2. It was charged to 4. 1V
at 1OmV/hr and then cycled between 4.1V and 0.02V for one cycle.
Phases A, B and C are the same as in Figure 9; phase D results from the
reductive decomposition of B.
72>
0
IOqm~
0
H
0 0
(guI) ~
I
0
0
cq
ho
0
o 0o
Sd2~I ~
0
0N
0
0410
0
a')
s 0 00
E-cix jun0
CLO~
0
C
0' E. 0 0 0'I-- I x £slo2)
N(2) nZ=1. 181
N( I)Z=O9()18
Li/Mo( 1)Z=0.829
N(2)7=0.747
Z=2/3
NO1)
CC
IIIIIIIIII1IIIII ho~#
-~
IIIII
II
II
aa
0
- 1sO... I
~4hsi~ * * * * *0 -~
a a a a I ~ a
o 0 0 0I I0 0 0 0o 0 0 0o o
0 0 0
(~/nuI~X//~
Volts vs. SHE Reagent
+3.0
+102.1- N0 2 /N0 2
+1.7- NO'*/NO
+*0 1.1 - B r 2/Mr DDQ/DDQ -
.0.5 - /1-
IIncreasing 0.oxidiz ng0.power
.1.0
-2.0 n-BuUi
-3.0 Li/L
xx
S d
0
3.5
2.5 1III__
-2 50 -2 00 -15 0 -10 0 -50 0
Capacity (mAh/g)
BB0. ...... ... .. ............ ......... ................ .............
-30-0 10; 0 0
3 B D!Cpct .... (...m . ------------h/..........g) .....
TECHNICAL REPORT DISTRIBUTION LIST - GENERAL
Office of Naval Research (2)" Dr. Richard W. Drisko (1)Chemistry Division, Code 1113 Naval Civil Engineering800 North Quincy Street LaboratoryArlington, Virginia 22217-5000 Code L52
Port Hueneme, CA 93043
Dr. James S. Murday (1) Dr. Harold H. Singerman (1)Chemistry Division, Code 6100 David Taylor Research CenterNaval Research Laboratory Code 283Washington, D.C. 20375-5000 Annapolis, MD 21402-5067
Dr. Robert Green, Director (1) Chief of Naval Research (1)Chemistry Division, Code 385 Special Assistant for MarineNaval Weapons Center Corps MattersChina Lake, CA 93555-6001 Code OOMC
800 North Quincy StreetArlington, VA 22217-5000
Dr. Eugene C. Fischer (1)Code 2840David Taylor Research Center Defense Technical InformationAnnapolis, MD 21402-5067 Center (2)
Building 5, Cameron StationAlexandria, VA 22314
Dr. Elek Lindner (1)Naval Ocean Systems CenterCode 52San Diego, CA 92152-5000
Commanding Officer (1)Naval Weapons Support CenterDr. Bernard E. DoudaCrane, Indiana 47522-5050
* Number of copies to forward
11
E2cJ~sure (2 )