security in old age for older single women without children
TRANSCRIPT

Security in old age for older singlewomen without childrenMyra Hamilton, Helen Hodgson, Bruce Bradbury, Mary Ip,Elizabeth Adamson and Georgia van Toorn
17/IO CRICOS 00026A
sydney.edu.au/business
This report presents findings from the project Security in old age for older single women without children, a collaborative project between the University of Sydney, the University of New South Wales and Curtin University, funded by CPA Australia. ISBN: 978-1-74210-482-9 Published: November 2020 Research Team: Myra Hamilton, Helen Hodgson, Bruce Bradbury, Mary Ip, Elizabeth Adamson and Georgia van Toorn. Contact for further information: Associate Professor Myra Hamilton [email protected]
Acknowledgements: The research team would like to thank CPA Australia for funding this research project. We would also like to express our thanks to the Project Steering Group (Professor Miranda Stewart, Associate Professor Elizabeth Hill, and Professor Louise Chappell) for their extremely valuable input and feedback. We would also like to thank all of the older women and stakeholders who gave up their time to participate in this project. We would like to express our gratitude to the Australian Human Rights Institute at the University of New South Wales for its important role in supporting the development of this project, and for its support in hosting the project in its earlier stages. We also thank Richard Webb at CPA Australia for his useful feedback on the draft report, and Ann-Charlotte Stent and Glenn Howell for their excellent support with copyediting and desktop publishing.
Suggested citation: Hamilton, M; Hodgson, H; Bradbury, B; Ip, M; Adamson, E, van Toorn, G (2020) Security in old age for older single women without children, Report funded by CPA Australia, University of Sydney: Sydney.
Security in old age for older single women without children Myra Hamilton, Helen Hodgson, Bruce Bradbury, Mary Ip, Elizabeth Adamson and Georgia van Toorn
Contents Summary 3 1. Introduction 10 2. Method 12
Phase 1: Literature and policy review 12 Phase 2: HILDA analysis 13 Phases 3 and 4: Qualitative methods 14
3. Literature and policy review 16 3.1 Employment, income and savings 16 3.2 Housing 20 3.3 Aged care 22 3.4 Summary 23
4. Comparing the circumstances of older SWWC to others using HILDA 25 4.1 Summary 36
5. Perspectives of older SWWC and financial advisors 38 5.1 Employment, income and savings 38 5.2 Housing 45 5.3 Family care 51 5.4 Financial capability and financial advice 58 5.5 Summary 67
6. Conclusions and recommendations 70 Employment, earnings and superannuation 70 Housing 71 Family care 71 Intersectional inequality 72 Single and precarious 72 The ‘unencumbered worker’ and the ‘unencumbered carer’ 73 Older single women without children and COVID-19 73 The role of financial services 74

References 76 Appendix A. Detailed HILDA results 83 Appendix B. Online community questions 102 Appendix C. Stakeholder Interviews – Topic Guide 104

3
Summary Australia's population is ageing. Women are much more likely than men to live in poverty in old age, especially single women (AHRC, 2010). Improving the economic security of single older women is a policy priority. It is also an important objective for financial advisors. Most research into the reasons behind single older women’s economic insecurity focuses on the ‘motherhood penalty’: the effects of having and rearing children on labour market participation, incomes and retirement incomes. In Australia, however, 16 per cent of women do not have children (Koropeckyj-Cox & Call 2007) and this proportion is growing. Little is known about older single women who do not have children, including how they are faring leading up to and after retirement and to what extent, when children are removed from the equation, gender inequalities persist.
This report presents the results of new research, providing a detailed picture of what shapes the financial security and wellbeing of older single women without children (whom for the purposes of this project we will call older SWWC). Funded by CPA Australia, the research asks:
How are older SWWC faring in employment, superannuation, housing and aged care? How does this compare with other gender and relationship groups?
How can public policies support SWWC to obtain financial security in later life? How can accountants/financial advisors support SWWC to navigate these systems?
To answer these questions, the report draws on a review of national legislation, analysis of Australia’s Household, Income and Labour Dynamics in Australia (HILDA) Survey, an online community with 45 older SWWC, and interviews with 10 financial stakeholders (i.e. financial advisors and housing specialists). Findings will inform policy and practice of governments and the financial services sector.
Who are older single women without children? Single women without children are women who do not currently have a partner and have never had children. This paper focuses on single women without children aged 45 and above, as 45 and above is the age range used by the Australian Bureau of Statistics to define ‘mature’ workers, an age above which people begin to experience age-related challenges and barriers in the labour market. The financial security of this cohort is affected by the combination of their age, gender, not having a partner and not having children, and other factors (such as socio-economic circumstances, cultural background and relationship histories). This cohort faces specific challenges in earnings, wealth, housing and care, particularly as they age. Older SWWC need well-designed policy and access to financial information and advice that takes into account the specific issues they face.
How are older SWWC faring in employment, earnings and superannuation?
“I feel as I don’t have family responsibilities, more is expected of me in my own time”
While not having children is associated with better incomes, being a woman and being single, in different ways, are associated with poorer incomes and wealth, and these outcomes worsen as they age.
Our analysis of HILDA suggests:
4
In Australia, there is a gender pay gap meaning that women have lower average full-time earnings than men. The gap narrows between single women and men without children but persists.
While not having children creates some advantages for SWWC, this is overshadowed by disadvantages associated with being single.
Not having children is associated with higher personal incomes – SWWC have higher personal incomes than mothers (partnered or single).
Partnered people, however, do better than single people (regardless of whether or not they have children) on all other measures of income and wealth. SWWC have lower equivalised household incomes, personal superannuation wealth and household net wealth than all other groups, with and without children, except single parents.
Having a spouse/partner is also a protective factor when it comes to financial hardship. Single people (with or without children) are more likely than partnered people (with or without children) to be unable to pay a utility bill on time or to ask for financial help from friends or family.
In spite of not having children, the data suggests that SWWC experience career interruptions, especially later in life. SWWC have longer working lives than mothers, but shorter working lives than all groups of men (children or no children) and partnered women without children.
Employed single women experience a decline in income and job security as they become older.
Our qualitative findings suggest:
Gender was broadly conceived by participants as limiting earnings due to the gender pay gap. All older SWWC and financial stakeholders reported that not having children increased employment
opportunities and personal earnings. Older SWWC reported that not having children exerted a stronger effect on their employment
opportunities than their gender. This was because they were in a position to be more flexible in their career decisions and daily work patterns, more flexibly meet their employers’ needs, more easily participate in networking opportunities outside of working hours and even to build closer relationships with colleagues and employers, all important contributors to career progression. They reported that this was viewed by employers as a positive attribute.
In contrast to the HILDA analysis, participants in the qualitative phases conflated ‘being single’ with ‘not having children’ when describing their employment and earnings opportunities.
While being single could be an advantage for employment and earnings opportunities, this did not translate into opportunities to accumulate superannuation and wealth. Both older women and financial stakeholders described the financial benefits of being a couple: economies of scale; extra security; greater ability to manage unexpected financial shocks; and extra disposable income that can be invested in superannuation, the housing market or other assets.
It is a misconception that SWWC – because they do not have children – do not have career interruptions. Two thirds of participants had experienced an involuntary career interruption (e.g. because of ill health, care responsibilities or redundancy). When they occurred, the impacts were substantial as there was no second income to cushion the financial shock.
Consequently, job security was more important to most SWWC’s sense of financial security than income.
Participants reported that opportunities for employment became more limited as they aged.
How are older SWWC faring in housing?
“being single has put me at a disadvantage when getting and renegotiating a mortgage … because there is no back-up person”
For older SWWC, housing challenges are strongly associated with being single and these challenges worsen as they age.

5
Our analysis of HILDA suggests:
Being single is associated with lower levels of home ownership. SWWC have lower levels of home ownership than partnered people (with and without children), and single women with children fare even worse.
Our qualitative findings suggest:
Some participants identified benefits of not having children in negotiating the housing market, such as more flexibility, the need for less space, and the perception that landlords may think they are cleaner tenants.
However, both older SWWC and financial stakeholders reported that being single could be a strong barrier to obtaining suitable housing.
Being single prevented some from acquiring a home loan. Others simply did not try as they believed they would not be approved on a single income. The barriers to securing a home loan intensified as they aged, permanently locking some renters out of the housing market.
Being single was also a barrier to obtaining a rental property without the extra income and security of a second earner.
For some, their pets were their family, but those pets presented an added barrier to finding appropriate rental accommodation.
While homeowners felt more financially secure than renters, they also experienced a sense of precarity in their housing arrangements because they were on one income. Some felt compromised in their capacity to continue paying rates, strata fees, or maintenance and upkeep of their properties as they aged and their incomes decreased. Managing large mortgage repayments alone limited their capacity to contribute to their superannuation.
Several homeowners wanted to downsize or move to a property that better accommodated their declining health but reported that a drop in their income as they aged had prevented them from re-mortgaging.
About 1 in 5 participants who were homeowners reported renting out a room of their house to a housemate or placing a room on Airbnb to help manage the costs.
These challenges gave many a sense of having limited housing choices available to them because they were single, even when they had reasonable means.
How are older SWWC providing and receiving care?
“I’m really nice to my nieces”
Older SWWC often take on the lion’s share of unpaid care responsibilities for ageing parents, but they are concerned about having their own care needs met in future.
Our analysis of HILDA suggests:
SWWC aged 55-64 are much more likely than any other group (including partnered women and men with or without children and single parents) to be caring for an older relative or relative with a disability or chronic illness.
Our qualitative findings suggest:
Older SWWC with care responsibilities reported that their families thought that because they did not have children, they were freer and more flexible with their time. Consequently, there were familial obligations and expectations that they take on primary care responsibilities for ageing parents, often resulting in interruption to their employment and earnings.

6
About a third of the sample reported having chronic health conditions themselves, which affected their capacity to work, earn and save. For most, living alone (or with roommates) during periods of ill health meant they had limited access to the day-to-day care and support they needed with recovery, treatment, transport and household tasks. Some reported that this prolonged their absence from work.
Participants expressed a strong fear about growing older and not knowing who would be there to support and care for them in the future. They were concerned that without a spouse or children of their own, they would not have any informal support to help them remain living at home in the community.
Participants had considered varied approaches to meeting these needs in the absence of immediate family. Some talked about close relationships with nieces and nephews, indicating that they hoped they would provide support as they got older; some planned to pay for private support.
Others were concerned that they may have to give up on their desire to continue living independently in the community and move into a residential aged care facility prematurely.
The ‘unencumbered worker’ and the ‘unencumbered carer’ Older SWWC can observe benefits for their employment associated with not having children. However, it is the very absence of children that can see them treated differently in workplaces and families. In workplaces, the view that they are ‘unencumbered’ by childcare responsibilities means that employers sometimes expect more of them at work than they do of parents with children. Participants reported that this could lead to extra pressure by employers on their personal and non-work time, such as being asked to stay back late when others had left to pick up their children, or being told they could not take annual leave over certain holiday periods because parents with school-aged children had priority.
At the same time, in families, the view that they are ‘unencumbered’ by childcare responsibilities means that families sometimes expect more involvement from SWWC in the care of ageing parents compared with siblings who have childcare responsibilities. Some older SWWC are therefore being squeezed from both angles as both employers and families view them as freer and more flexible with their time. Consequently, while some employers view SWWC as unencumbered by childcare, they are the most likely cohort to have other care responsibilities, such as for ageing parents. This can set up circumstances in which older SWWC face excessive pressure that affect their work-life balance and health and wellbeing.
Intersectional inequality: single and precarious For older SWWC, opportunities for financial security and wellbeing emerge at the intersections of four axes of inequality: being female, being single, not having children, and being mature aged. These axes intersect in different ways in the domains of employment, income and wealth, housing and family care. Overall, not having children can be of benefit for employment and earning opportunities, can be neutral for housing opportunities, but can limit access to family care in later life.
Gender is associated with poorer outcomes across all domains as lower earnings resulting from the gender pay gap result in lower superannuation and wealth, and more restricted housing opportunities. Gender is also associated with higher levels of care provision for older relatives and relatives with a disability or chronic illness.
Across all domains, being single is associated with poorer outcomes and greater precarity. This is most obvious in housing, where single women have lower levels of home ownership than partnered women, and single renters face among the highest levels of housing stress (Power 2020). Both homeowners and renters experienced high levels of housing precarity. Being on one income created challenges in meeting the high costs of housing and generated anxiety about what would happen if their income dropped and

7
there was no second income to mitigate the impact. The same precarity could be seen in employment and earnings. Being single is associated with poorer household incomes and wealth. The lack of a second (or potential second) income offered by a partner meant that meeting the costs of living could be a struggle, limiting opportunities to invest in superannuation or other assets that could boost financial security in later life. While SWWC do not experience interruptions to their career associated with children, when they do experience career interruptions beyond their control, they do not have the security of a second income to cushion the effects. Consequently, the effects of a relatively small financial shock can be catastrophic. When it comes to care in old age, being single deepens the precarity of the cohort, as they navigate formal care systems alone. Being single, therefore, stands out as the strongest determinant of poorer outcomes in later life for this cohort.
As they age, the disadvantage experienced by SWWC in employment, income and housing, and in providing and receiving care deepens. Hence, while it would be tempting to assume older single women without children are a relatively advantaged group – free of the high costs of bearing and rearing children for careers, incomes and retirement incomes – this conceals the challenges at the intersections of gender, relationship status, and age experienced by many in this cohort as they navigate employment, housing and their ageing futures.
While most of the data for this project was collected prior to COVID-19, many of the challenges faced by older SWWC, such as vulnerability in the face of financial shocks, greater housing precarity, and challenges associated with providing care for ageing relatives, are likely to have been exacerbated by COVID-19.
How can public policies support SWWC to obtain financial security in later life? Older single women are one of the fastest growing cohorts of people experiencing poverty in Australia, with 38.7 per cent of older single females living below the poverty line (Senate Economics References Committee 2016:13). They are also at significantly higher risk of homelessness and housing stress (Senate Economics References Committee 2016) than single older men. Currently, policies on taxation, the age pension, superannuation and housing, do not discriminate between men and women, but nor do they address the underlying inequalities that lead to poorer income and superannuation outcomes for women. Being childless does not exacerbate these issues (in fact it has benefits), but being single places women at even greater risk of economic insecurity in later life, especially those women who have never owned a home or lost a home through divorce. For these women, the safety net is currently not meeting their needs, leaving a cohort of older single women facing homelessness and poverty, children or no children. When the need for care arises, the absence of informal care networks – especially children – means that SWWC have limited access to informal care. In an aged care system in which living in the community relies heavily on care and support from informal networks, many older SWWC will have few options but to enter residential care.
Recommendations Based on the findings above, we propose the following recommendations for policy:
Anti-discrimination legislation should be amended to make clear that discrimination on the basis of having family responsibilities or not having family responsibilities is unlawful. Better education for employers should include information about discrimination on the basis of not having family responsibilities, as well as on the basis of gender and age.

8
Education and training opportunities should be developed to support employment prospects for single women in later life. This is especially important for women who may have lost jobs, taken career breaks for ill health or caring responsibilities, or experienced relationship breakdowns that affected their career trajectory.
Housing options should be developed to meet the needs of older women (i.e. affordable housing, social housing and co-housing) and more funding should be directed to organisations that provide housing advice and services to older women.
Commonwealth Rent Assistance should be reviewed, with the rates increased, and support should be made available to assist homeowners who are at risk of falling behind on their mortgage. This should include opportunities to refinance loans.
Better support and information on available funding options (e.g. NDIS, Respite and In-Home Aged Care Services) must be made available to carers of older relatives or relatives with a disability or chronic illness, and new funding options considered (i.e. carer credits to superannuation accounts) to mitigate the impacts of family care on employment, incomes, retirement incomes and wellbeing.
Advocates should be in place within the aged care system to provide support for older people who do not have informal support networks. Various forms of providing free advocacy and support are currently being trialed on a national scale through the Aged Care Navigator Trials and these are likely to be a highly useful resource for older SWWC.
Government policy should recognise co-dependency in the aged care means test if one member of a household moves into a residential aged care facility and the other resident is not a spouse or child.
The ASIC Financial Capability unit should develop programs that provide advice at particular trigger points, including separation or divorce, pre-retirement and at retirement, and this should be backed up by access to more affordable formal financial advice where needed.
How can financial advisors support SWWC to navigate these systems? The research identified a number of limitations on the financial capabilities and resources of some older SWWC, such as a lack of knowledge and information about superannuation, financial challenges after a relationship breakdown, smaller kinship networks that offer fewer opportunities to pool financial capabilities, and limitations associated with being a sole-earner household. These limitations suggest that many older SWWC would benefit from access to tailored financial advice. Most participants identified the value in good financial advice, but there are some important barriers to accessing financial advice among this cohort. These include lack of trust, lack of tailored services, inaccessible formats (e.g. digital, which only works for some), unaffordability of services, and gender norms imbued in some services, which can be off-putting for women.
Recommendations Based on the findings above, we propose the following recommendations for the financial services sector:
Financial advice for women needs to be targeted and delivered in a way that recognises different communication styles and approaches to decision making. For example, some women respond to one-to-one support or coaching whereas others prefer participating in a support network where they can share experiences
Education and training programs should be developed within the industry to improve understanding of gender inequality, challenge gender stereotypes and make financial service providers more aware of personal biases.
Financial advisors should work with other organisations providing services to older women to develop a warm referral network.

9
Services should be delivered through multiple access points and formats, including digital, but also hard copy and face-to-face. The formal documentation required in financial advice should be translatable to a user-friendly, accessible format.
Access to financial services for lower income, and low net wealth women should be improved and affordable.
Financial advisers should be educated to recognise and understand who may be vulnerable to financial abuse and implement protocols similar to those applied where elder abuse is suspected, for example providing opportunities for the client to speak privately and ensuring that consent is fully informed and freely given.
This cohort would benefit from tailored financial advice during the following life stages or events:
early in their career – more education about superannuation during and after separation and divorce—advice needs to be sensitive to financial and emotional
vulnerabilities, including advice about accessing or maintaining lines of credit during a relationship breakdown. Financial advisers should recognise that financial abuse may be a feature of a domestic relationship breakdown.
buying, financing and maintaining a home on a single income; including refinancing when circumstances change
during housing transitions in later life, i.e. downsizing, remortgaging, transitioning into retirement facilities
managing care responsibilities, e.g. access to resources, including assistance available through in-home Aged Care (i.e. the Commonwealth Home Support Program and Home Care Packages), the Carer Gateway and respite services, and the NDIS - both as a carer and as a user of care services
managing transitions into residential aged care, including ensuring that appropriate financial arrangements are in place to protect against financial abuse.

10
1. Introduction Australia's population is ageing, with women, especially single women, much more likely than men to live in poverty in old age (AHRC, 2009). Improving the economic security of single older women is therefore a policy priority and supporting single older women to prepare for and live comfortably in retirement1is an important objective for financial advisors. Most research into the reasons behind single older women’s economic insecurity focuses on the effects of childbearing and childrearing on financial outcomes in later life. However, little is known about the financial circumstances of single older women who do not have children (whom for the purposes of this project we will call older ‘single women without children’ (SWWC)). With the proportion of SWWC in the Australian population growing, research on barriers to their security in old age is pressing.
There is now a body of work exploring the impact of the ‘motherhood penalty’ on retirement incomes, that is, the effects of having children on labour market participation, careers, incomes and retirement incomes. However, little is known about how SWWC are faring leading up to and after retirement and whether, if children are removed from the equation, gender inequalities persist in security in old age. According to an international comparative study on the prevalence of not having children, compared to other OECD countries, Australia has an “intermediate” level of people without children, at 16 per cent for women and 11 per cent for men (compared with the “high” level of 20-25 per cent found in the United Kingdom and Germany) (Koropeckyj-Cox & Call 2007:1371). This proportion is likely to have increased as Australia’s fertility rate has continued to decline, from 2.02 babies per woman in 2008 to 1.74 babies per woman in 2018 (Australian Bureau of Statistics 2018, 3301.0 Births, p 43). To fill this knowledge gap, this project will provide an original detailed picture of the financial circumstances of older SWWC. The project sets out to explore the factors shaping the capacity of SWWC to accumulate savings and assets over time, something that is essential for financial security and wellbeing in retirement (Hetherington and Smith, 2017). It will take a life-course approach, exploring the way in which factors at the individual and wider social and policy levels interact over time (Muir et al., 2017).
This project, funded by CPA Australia, will answer the following key questions:
How are older SWWC faring in employment, superannuation, housing and aged care? How does this compare with other gender and relationship groups?
How can public policies support SWWC to obtain financial security in later life? How can accountants/financial advisors support SWWC to navigate these systems?
The project aims to generate direct and indirect benefits for governments, the financial services sector, the research community and older SWWC. While a small body of research suggests that women and men have different approaches to financial planning and advice (Hermansson, 2017), information on SWWC’s approaches is limited. The project aims to provide new evidence that can inform policy and practice to promote secure retirements, including informing the work of the accounting profession by providing a deeper understanding of the circumstances, trajectories and perspectives of this growing group of potential clients. It aims to provide new insights into the factors and policy settings shaping the financial security of SWWC, a new evidence base that can contribute to the Australian Government’s
1 In this paper, we use the term ‘retirement’ broadly to capture the permanent exit from the labour market later in life, voluntarily or involuntarily. In many cases, the timing of retirement will coincide with reaching the age at which one becomes eligible for the age pension (currently age 66 for women). However in many other cases, a person will permanently exit the labour market before the pension eligibility age and will rely for income on some combination of savings, superannuation and other forms of income support such as Newstart Allowance, the Disability Support Pension, or Carer Payment. Some will continue undertaking a small amount of paid work and combine income from work with the age pension or superannuation.

11
current policy focus on closing the gender retirement income gap and improving women’s economic security in older age (Senate Standing Committee on Economics, 2016).
12
2. Method The project combines an analysis of national data that enables us to compare older SWWC and other groups of older women and men, and an online community of SWWC to provide a rich picture of the factors contributing to their financial security over time, and how they navigate the tax/transfer, housing and superannuation policy contexts. The project also includes a policy review and interviews with financial advisors and other stakeholders to provide a comprehensive picture of the policy and financial services context.
The project took place in four phases: a literature and policy review providing the first holistic review of SWWC vis-à-vis tax/transfer, housing and superannuation policy; an analysis using the national Household Income and Labour Dynamics in Australia (HILDA) survey, comparing economic and other outcomes for SWWC and other demographic groups distinguished by their current marital status, whether they have ever had children, and gender; an online research community with 45 SWWC aged 45 years and above with diverse socio-economic circumstances and relationship histories; and 10 phone interviews with accountants/financial planners about support provided to SWWC. The HILDA data and online community data were collected prior to COVID-19, and the interviews with financial stakeholders began in March 2020, just before the start of the nation-wide lockdown, and continued through the national lockdown period, finishing at the end of April. At that stage, little analysis had emerged on the impacts of COVID-19 on lives and livelihoods, and it was not discussed in detail by participants.
Phase 1: Literature and policy review The first phase of the project included a literature and policy review. The literature review aimed to examine what is known about the financial security of older SWWC and the possible impacts of policy settings on their financial security. Second, the policy review examined legislation and selected policy documents across three areas: income and wealth accumulation (including income taxation, social security and superannuation), housing and aged care to identify policy gaps and design issues affecting SWWC’s ability to acquire economic security in retirement.
Literature review The first stage of Phase 1 was to undertake a literature review to identify the ways in which these three policy areas (income and wealth, housing and aged care) interact with other external drivers of economic wellbeing, including employment and household size/costs.
The review was conducted by searching for academic literature in four electronic databases: ProQuest Social Science Journals, APA-FT: Australian Public Affairs Full Text (1978 – present), Humanities and Social Sciences Collection via Informit Online and Google Scholar. The databases were selected to cover a range of disciplines and subject areas related to the research topic and to ensure access to Australian content. The search terms consisted of keywords related to the demographic profile (“older single women”, “older childless women”, “never-married women”) and the different aspects of economic security (“financial security”, “economic wellbeing”, “superannuation”, “housing”, “income/pay-gap”, “wealth” and “aged care”).

13
In addition, a variety of ‘grey’ literature was identified through a web search using Google Scholar and a manual search of government and non-government organisation websites.2 Additional sources were located by reviewing the reference lists of these publications and conducting further manual searches. The literature was analysed thematically to identify the multiple and intersecting factors SWWC’s financial security in older age. In particular, the review sought evidence on the differences in economic outcomes amongst older Australians disaggregated by gender, parental status and partnership status. The evidence was analysed according to themes considered by the authors to be of relevance to SWWC’s economic wellbeing in later life, spanning the three areas of income and wealth accumulation, housing and aged care.
Policy Review The second stage of Phase 1 was a policy and legislative review to identify policy gaps and design issues that may affect SWWC’s ability to acquire economic security in retirement. It focuses on the ‘four pillars’ of retirement, or the four forms of income and assets that contribute to a secure retirement: the age pension; compulsory superannuation contributions; voluntary savings, within and outside the superannuation environment; and home ownership. Aged care policy was also included in the review. The policy review provides the first holistic review of the treatment of SWWC in tax/transfer, housing, superannuation and aged care policy.
These policies are primarily governed by Federal legislation, with the exception of housing which crosses into state jurisdiction through state tax policies and subsidies. The purpose of the policy review was to identify whether there are differences in the effects of policy settings in each of these areas on SWWC. To do this, we undertook an analysis of whether formal policy settings were different in relation to three intersecting issues: between males and females, between single persons and partnered persons, and based on whether or not there were children in the household.
Phase 2: HILDA analysis The HILDA survey is a longitudinal panel study currently covering the period 2001 to 2018. As well as following people over time, the sample is also designed to include a representative cross-section of the population in each year.
For our comparison, we group the population of people aged 45 and older along three dimensions: gender, whether or not they have ever been a parent, and whether or not they are currently partnered. The intersection of these categories produces eight demographic groups: Single women without children; Single men without children; Single women with children; Single men with children; Partnered women without children; Partnered men without children; Partnered women with children; Partnered men with children.
Our main focus is on the comparison of SWWC with groups 2, 3 and 5 (in bold above). Each of these groups differs from SWWC in only one respect – gender, past parenting and current partnered status
2 The following websites were searched manually: Household, Income and Labour Dynamics in Australia (HILDA) of the University of Melbourne (https://melbourneinstitute.unimelb.edu.au/hilda), The Australian Housing and Urban Research Institute (AHURI) (www.ahuri.edu.au), Economic Security4Women (Women’s alliance) (www.security4women.org.au), Workplace Gender Equality Agency (www.wgea.gov.au), The Australian Productivity Commission (https://www.pc.gov.au/) and the Economic security for women in retirement inquiry website (https://www.aph.gov.au/Parliamentary_Business/Committees/Senate/Economics/Economic_security_for_women_in_retirement).
14
respectively. Results for the other groups are available in Appendix A, along with more technical information about the estimation and some alternative estimation results.
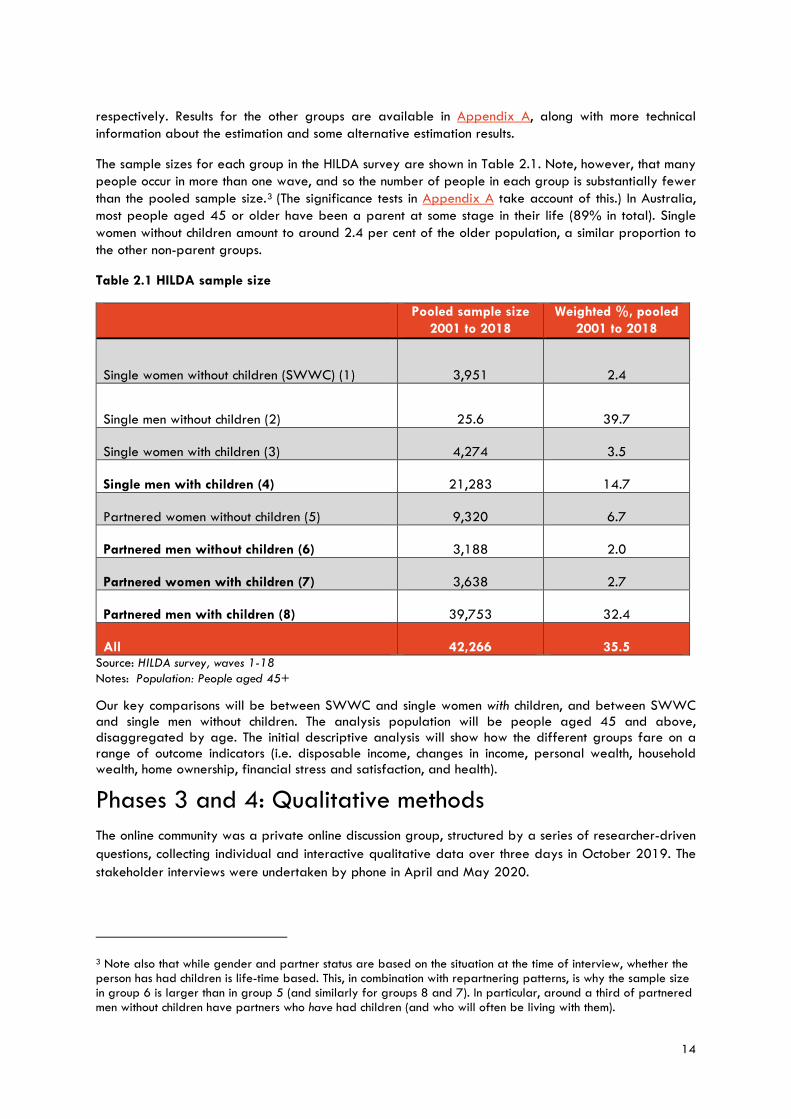
The sample sizes for each group in the HILDA survey are shown in Table 2.1. Note, however, that many people occur in more than one wave, and so the number of people in each group is substantially fewer than the pooled sample size.3 (The significance tests in Appendix A take account of this.) In Australia, most people aged 45 or older have been a parent at some stage in their life (89% in total). Single women without children amount to around 2.4 per cent of the older population, a similar proportion to the other non-parent groups.
Table 2.1 HILDA sample size
Source: HILDA survey, waves 1-18 Notes: Population: People aged 45+
Our key comparisons will be between SWWC and single women with children, and between SWWC and single men without children. The analysis population will be people aged 45 and above, disaggregated by age. The initial descriptive analysis will show how the different groups fare on a range of outcome indicators (i.e. disposable income, changes in income, personal wealth, household wealth, home ownership, financial stress and satisfaction, and health).
Phases 3 and 4: Qualitative methods The online community was a private online discussion group, structured by a series of researcher-driven questions, collecting individual and interactive qualitative data over three days in October 2019. The stakeholder interviews were undertaken by phone in April and May 2020.
3 Note also that while gender and partner status are based on the situation at the time of interview, whether the person has had children is life-time based. This, in combination with repartnering patterns, is why the sample size in group 6 is larger than in group 5 (and similarly for groups 8 and 7). In particular, around a third of partnered men without children have partners who have had children (and who will often be living with them).
Pooled sample size 2001 to 2018
Weighted %, pooled 2001 to 2018
Single women without children (SWWC) (1) 3,951 2.4
Single men without children (2) 25.6 39.7 Single women with children (3) 4,274 3.5 Single men with children (4) 21,283 14.7 Partnered women without children (5) 9,320 6.7 Partnered men without children (6) 3,188 2.0 Partnered women with children (7) 3,638 2.7 Partnered men with children (8) 39,753 32.4 All 42,266 35.5

15
Online community Participants in the online community (n = 45) logged on between one and three times a day for three days. On Day 1, they were able to view and respond to a set of questions (using a pseudonym drawn from a colour chart). Once they had posted their own responses, they were able to see the ‘wall’ with all other participants’ responses and were able to respond to comments made by others. On Day 2, they were able to continue viewing and responding to the comments from Day 1, and a second set of questions were posted by the research team for them to respond to, with the same process of viewing and responding ensuing. On Day 3, a third set of questions was posted. The online community was facilitated by research team member Myra Hamilton, who was able to ask additional prompts in response to emerging themes in the data. The questions and prompts are set out in Appendix B.
The online community was set up and recruited by recruitment company Stable Research, who drew on their national panel of over 100,000 people to provide a sample of 45 SWWC aged 45+ years with diverse socio-economic circumstances and relationship histories. Participants also had the capacity to send private messages to the facilitator (i.e. without the group seeing). This format allowed the researchers to explore both shared experiences and interpretations among the group and important contextual differences and unique experiences.
Stakeholder interviews The aim of the stakeholder interviews was to better understand the support provided to SWWC navigating the tax/transfer system. While the stakeholder interviews were originally intended to include only accredited financial planners and accountants, informed by the findings from the online community, the research team decided that it was important to talk to other key stakeholders with knowledge of the financial security issues experienced by this cohort of women. The scope for inclusion of the key stakeholder interviews was therefore widened. In particular, given the importance placed on housing by the participants, the decision was made to interview stakeholders in the housing industry. Of the ten stakeholder interviews undertaken, two were with stakeholders and experts in the housing industry – one was in social housing for women (with older single women as a target group) and one was a mortgage broker focused on women.
This sample was selected purposively so that all participants had experience specific to older single women. Stakeholders were recruited through existing organisational networks of the research team and in consultation with CPA and the Project Steering Group. They were identified based on their expertise of working specifically with women/older women, and where possible, single women without children. The research team invited each individual/organisation through an invitation email and the Participant Information and Consent Form. Participants were then asked to register their interest with the research team. The recruitment and interviews took place during the peak of the COVID-19 pandemic. This potentially impacted the availability and capacity of some stakeholders to participate and, in some instances, the content of the data collected. However, the research team still conducted the target number of interviews. In total, 17 individuals or organisations were invited, and of these, 10 participated in an interview: 8 financial advisors or financial planning professionals and 2 housing specialists. All interviews were conducted by phone and lasted between 30 and 50 minutes. The questions were based on a semi-structured schedule (see Appendix C), which was adapted to focus on the expertise of individual participants.
Written texts from phase three and voice files from phase four, which had been transcribed, were coded and analysed thematically using NVivo. The analytical framework combined axial and open codes in order to allow analysis of the project’s research areas and the emergence of other themes (Grbich, 1999).

16
3. Literature and policy review This section presents the findings of the literature review and policy review on four elements of security in older age: income, wealth accumulation, housing and aged care. The findings of the two reviews are integrated to provide a holistic account of the policy and legislative settings that contribute to the gendered outcomes identified in the literature. There is no literature to date that studies this specific group of women; however, the review has examined three axes for analysis: gender, relationship status, and having children. The women that are the subject of this study are at the intersection of these three axes. These axes influence the four elements identified above as relevant to security in older age.
3.1 Employment, income and savings Paid employment underpins financial security in so far as the capacity to meet expenses, to save and accumulate wealth over the life course is generally predicated on income from employment. Low lifetime earnings are a key predictor of low income and wealth at the time of retirement and at the end of life (Poterba et al. 2018). Gender has a strong effect on employment trajectories, income from work, and consequently, savings. Research shows that women’s employment trajectories are more likely to be characterised by poorly remunerated work in feminised industries (such as health care and social assistance, education and training, and retail), part-time and casual work, and/or time spent out of the paid work force caring for children and other family members (Austen et al. 2015). Recent work done by KPMG with the Workplace Gender Equality Agency shows that interruptions to employment resulting from care of children and other family members accounts for 39 per cent of the gender pay gap; gender discrimination accounts for another 39 per cent and occupational segregation another 17 per cent (KPMG, 2019). While SWWC do not have childcare responsibilities, women are more likely than men to provide care for a family member with a disability, chronic illness or frailty due to old age, and are also more likely to be providing more intense levels of care than men (AHRC, 2013). Women are also more likely to experience discrimination and bias in hiring and promotion decisions (KPMG, 2019). These factors combine to create a gender pay gap in Australia, whereby the average weekly earnings of women are 14 per cent lower than the average weekly earnings of men (KPMG, 2019; WGEA 2018).
In terms of employment outcomes, research suggests that marital status and parental status intersect in ways that place single women without children at a relative advantage above married women with and without children. Never married women are more likely than women who are or have been married to have post-secondary qualifications, continuous employment and to have progressed in their careers (Cwikel et al 2006; Koropeckyj-Cox and Call, 2007). Both being married and having children reduce labour force participation and incomes. Single, divorced or separated women also have higher rates of labour market participation than married or remarried women (Wood et al 2008:14; Brown, L & Li, J 2016). This suggests that being partnered, regardless of whether a woman has had children, can result in lower levels of labour market participation, but that having children has a much greater impact.
However, while SWWC may have higher employment participation than partnered women and women with children, they still have poorer outcomes than men. However, while women without children have higher labour market participation than women with children, women without children are still less likely than men with and without children to work full time (Hetherington and Smith, 2017). While Australia’s full-time gender pay gap is smaller for women without children (Workplace Gender Equality Agency 2019), a gap persists. While women without children have higher average weekly full-time earnings than women with children, they earn less than men without children (Hetherington and Smith, 2017) and are roughly equal to men with children (Koukoulas 2018). Although there are policies designed to address gender segregation by industry and occupation, discrimination in career progression, and

17
gender inequalities, for example, persist for women both with and without children.
There is little research on how single women without children as a cohort age in Australia. However, we do know that older women experience additional disadvantages in labour force participation. They have higher rates of unemployment than older men and younger women, with women aged 55 to 64 having a workforce participation rate of just 58.8 per cent, compared with 71.9 per cent for men (PM&C 2017). Women’s different employment trajectories and the gender pay gap contribute to a range of outcomes, including lower occupational status at retirement and lower superannuation balances (relative to men), and these relative disadvantages accumulate over time, such that older women are more vulnerable to economic insecurity than younger women and older men (Wood et al, 2008). While the Federal Government has established a strategy to assist older women (PM&C, 2017) to increase their participation in employment, older women still have considerably lower levels of labour market participation than older men (Hamilton and Suthersan, 2020), and experience greater levels of age discrimination than older men (McGann et al, 2016). Older single women more generally are one of the fastest growing cohorts of people experiencing poverty in Australia, with 38.7 per cent of older single females living below the poverty line (Senate Economics References Committee 2016:13). Data released by the Parliamentary Budget Office in September 2020 highlights that women over 45 are the fastest growing group of JobSeeker (Newstart Allowance) clients, and single women are likely to be overrepresented in these numbers given the structure of JobSeeker, which includes the income and assets of a partner (PBO, 2020).
Tax and Transfer Measures The tax and transfer system consists of a range of income support measures (transfers) that may be targeted at people in specific circumstances, whereas the tax system includes considerations around the structure of the tax system, including tax rate structures, the Medicare levy and tax offsets. The main complexity in the tax and transfer system is that the tax system is individualised whereas the transfer system is based on the family unit (Hodgson, 2008a).
Unlike some other tax jurisdictions, including France and the USA, the Australian tax system is individualised, with each person being assessed separately on their income (Hodgson, 2008b). An individualised and progressive tax system better supports lower income earners as they pay a lower proportion of their income as tax, and, as noted previously, SWWC are likely to fall into this category. A progressive personal tax system will encourage employment and improve equity by removing tax disincentives, whereas moves to flatten the tax scales for higher income earners will favour men. The structure of the tax offsets to support low- and middle-income earners (LITO and LMITO) raise some particular complexities around the taper rates and cut off points that may impact on work incentives. It is worth noting that SWWC do not face the work disincentives from the interaction of tax and transfer systems faced by second earners in dual income households with children (Hodgson, 2008b).
However, in an individualised and progressive personal tax system, couples can minimise tax by structuring businesses and investments to ensure that passive or business income is taxed to the lower earning partner. In particular, the use of family trust structures can share income to reduce tax liabilities. These opportunities are not available to SWWC unless through other close relationships, for example as a member of an extended family trust.
Generally, the transfer system is based on family status with partners and children relevant in determining eligibility for and the amount of specific entitlements. For example, JobSeeker and the age pension take into account family assets and income but are paid individually. Although payments are made to each member of a couple, when assessing eligibility for the age pension, income and assets are assessed jointly, with the resulting entitlement divided evenly between the couple, reflecting economies

18
of scale. This could be seen to favour single women who do not need to report partner assets and income; however, the payment rates and thresholds are correspondingly lower. Single women in receipt of income support payments who do not own their home are also more likely to be reliant on Commonwealth Rent Assistance, as discussed later in this report.
In respect of older women, as a result of the gender imbalances in superannuation and retirement savings, women – particularly single women – are much more likely to rely solely on the age pension for income in later life (Senate Economics References Committee 2016:13). This is compounded by women’s longer life expectancies. According to the Australian Human Rights Commission, 73 per cent of those receiving the single rate of age pension are women, and “of all retired households, single women are most likely to be reliant on the full age pension as their main source of income” (AHRC, 2009). In addition to the age pension, all taxpayers over pension age are entitled to the Seniors and Pensioners Tax Offset that effectively increases the income tax threshold. While entitlement is individualised, a partnered taxpayer can transfer any unused tax offset to offset any tax liability of a spouse.
Superannuation The superannuation system is linked to earnings, with the superannuation guarantee based on a proportion of an employee’s income. Therefore, the gender pay gap is reflected in the superannuation system. Because men’s contributions are on average higher than women’s, superannuation tax concessions have worked in favour of men, with men receiving in aggregate double the superannuation tax concessions as women (Senate Economics References Committee 2016: 1-2). This imbalance has a compounding effect over time, meaning that by the time women reach retirement, they are significantly worse off. In 2017, the median superannuation balance for men aged 60-64 was 20% higher than that of women (Clare, 2019). There is growing evidence that the gender gap in the superannuation gap is larger for single women (Hetherington & Smith 2017:7). This is consistent with research into the rate of wealth accumulation by single women compared to single men, which reveals a stark and growing gap. Between 2002 and 2010, for example, the gender wealth gap among single men and women “more than doubled from 10.4 per cent to 22.8 per cent” (Senate Economics References Committee 2016: 12). Consequently, single women are at greater risk of poverty in retirement (Senate Economics References Committee 2016:1).
The gender superannuation gap also increases with age. As compulsory superannuation was introduced in 1992, older generations have not had the full benefit of compounding savings growth over the course of their working lives. As the mandatory superannuation scheme matures, recent cohorts of older Australians are holding relatively larger shares of their wealth in the form of superannuation assets. In the context of SWWC, being a sole income household with the lack of a financial buffer offered by a second income, they may run the risk of being unliquidated asset rich, income poor, and depend heavily on welfare system in their later-life.
While single women have lower superannuation balances than partnered women, women without children – married or divorced – have superannuation balances about 50 per cent higher than women with children (Brown, L & Li, J 2016). Thus, for single women without children, their relationship status is associated with lower superannuation balances, but not having children is associated with higher balances. Koropeckyj-Cox & Call (2007:1396) find that “the lowest incomes are found among single women, whether never or formerly married, regardless of parental status”. They conclude that “marital history rather than parenthood appears to be an important predictor of income in old age” (Koropeckyj-Cox & Call 2007:1396-9). This suggests that single women are particularly vulnerable to economic insecurity in old age, whether they have children or not. The literature offers little in the way of explanation for why single women, in particular, experience poorer economic outcomes in later life. One reason may be that single women do not enjoy the same economies of scale as married women, who

19
may earn less during their working life, but who reap the benefits of two incomes and the sharing of expenses as they age. Another is the possibility that a proportion of those single women is divorced or separated, and research clearly suggests that women do more poorly than men in terms of superannuation and wealth after a divorce (Wood et al 2008). Indeed, the superannuation balances of divorced women are 70 per cent less than those of married women (Brown, L & Li, J 2016). As discussed in the next section, it may also be because single women have high rates of care provision for other relatives.
Although the superannuation system is individualised, there are some measures that benefit couples. Contributions can be made into a person’s account by a spouse, and these may attract tax concessions. Spouse contributions cannot be claimed as a tax deduction, but there may be a tax offset available on the first $3,000 paid into the account of a spouse who earns less than $40,000 in the year (ITAA974 s.290-230), and the contribution does not attract the contributions tax paid by the superannuation fund (ITAA97, s.295-165). There are also opportunities for couples to benefit by splitting the superannuation between spouses. The contribution caps limit the amount that a person can contribute to their superannuation to $25,000 per year for a concessional contribution (tax deductible) (ITAA97 s.291-20) and $300,000 over three years for a non-concessional contribution (not tax deductible) (ITAA97 s.292-85). These caps are individualised, but where a couple makes financial decisions jointly, superannuation concessions can be maximised by making decisions to make contributions to one partner over the other; for example to the account of the partner with the higher marginal tax rate, or to the spouse who is not close to the $1.6m Transfer Balance Cap (ITAA97 Div 294). Another mechanism allows a spouse to transfer concessional contributions made in the previous year into the account of their spouse (SIS Regulations Reg 6.40 – 6.46). These various benefits and concessions are not available to single women.
In a divorce, superannuation held by both parties, including any amount that has been salary sacrificed as discussed above, is included as assets of the marriage, and may be split in a property settlement. While this is a welcome measure in family law, evidence still shows that it takes longer for women to recover economically from a divorce (de Vaus et al; 2014).
The estate planning requirements of a single person with superannuation will be different from a person who has a spouse and/or children. Following the death of a person with a superannuation account, the balance is not taxed as long as it is paid to a dependant, i.e. the spouse, children or another person with whom the person has an interdependent relationship (SIS Act s.10, 10A). If a person does not have a dependant as defined under the SIS Act, the benefit will be distributed with the other assets of the estate either in accordance with a will or as an intestate estate, and will face higher tax rates (ITAA97 Div.302). This may discourage SWWC from investing in superannuation in favour of a more diverse investment strategy that does not attract the same tax concessions.
In sum, superannuation policies are gender neutral and individualised systems. The complexities for SWWC will arise as a consequence of the gender pay gap, which is reflected in superannuation contributions, and when distributing benefits to the member’s dependants. As SWWC, by definition, do not have a spouse or children, additional tax may be applicable on distribution of death benefits. This could discourage SWWC from saving in the tax-preferred superannuation environment.
4 ITAA97 refers to the Income Tax Assessment Act 1997.

20
3.2 Housing5 Home ownership and access to affordable housing are key elements of economic security in older age (Senate Economics References Committee 2016). Being single is associated with greater housing insecurity. The literature on housing reveals “large differences in the housing tenure profiles of women and men by marital status” (Wood et al. 2008:14). In Australia, separated and divorced women are much more likely than their married (and male) counterparts to rent privately or live in public housing (Wood et al. 2008:16; AMP-NATSEM 2016:7). Continuously married people overall are 20 per cent more likely to own their own home (Wood et al. 2008). Single older women face unique challenges in relation to housing, and there is now a large body of research suggesting that they are at high risk of housing stress and poverty in later life (Tually et al. 2007; Senate Economics References Committee 2016:119). Older single women are less likely to own their own home and women lack a “family safety net”, which can be a buffer against poverty and homelessness in old age (McFerran 2010). Older single women in receipt of the age pension, and older single women who are not homeowners are particularly at risk (Senate Economics References Committee 2016:119). This is due in part to a lack of affordable housing for private renters (Tually et al. 2007; Senate Economics References Committee 2016:120). Tually et al. (2007) suggest that the number of older women in private rental housing is likely to increase over the next 20 years. Lower rates of outright home ownership at retirement, reduced access to both affordable private rental housing and public and social housing, and the inadequacy in rent assistance all contribute to housing stress and homelessness amongst older single women. There is no evidence of any positive or negative impact of not having children on housing security in later life, though there is evidence that some older single women utilise the option of moving in with their adult children (de Vaus and Qu, 2015), which is a ‘buffer’ not available to older single women without children
Home ownership According to the Australian Institute of Health and Welfare, outright home ownership between 1994-95 and 2015-16 declined from 41.8% to 30.4% respectively, whereas home ownership with a mortgage increased from 29.6% to 37.1% over the same period (AIHW 2018). It is anticipated that there will be a large population of Australians entering retirement without owning their house outright (Eslake 2017). There are several government incentives and schemes to support people to enter the housing market and older SWWC may benefit from some of these. For example, policies are available to support first home buyers, including stamp duty concessions and a first homeowner grant (state), and the First Home Super Savers Scheme (federal) that allows first homeowners to withdraw savings from their superannuation under specified circumstances (ITAA97 Div 313). These schemes have the potential to support single women without children, as they are generally limited to first homeowners of limited means to assist with the deposit, and there is frequently a ceiling on the value of the property. There are also incentives for home ownership built into the retirement income system. As noted previously, eligibility for the age pension is subject to two means tests: an assets test which exempts one’s principal residence from assessment, and an income test. The differential treatment between homeowners and non-homeowners provides significant incentives to the latter to transfer other assets into a home for maximizing or qualifying for a pension (Sane and Piggott 2008). However, there are also systemic barriers to home ownership for older SWWC. In particular, single income earners may find it difficult to obtain finance to finalise the purchase of a home, particularly as they approach retirement age. The Australian Prudential Regulation Authority requires lenders in the residential mortgage market to apply prudent risk management practices when calculating the serviceability of a loan, which will include consideration of
5 The legislation we examined included government tax/fiscal/welfare policy (e.g. capital gains tax and negative gearing).

21
whether an older borrower can repay the loan before, or maintain payments after, retirement (APRA, 2017; 2019).
Private renting Obstacles to home ownership for older single women mean this group disproportionately relies on the private rental market. According to one source, between 2006 and 2016, the number of older women renting in the private market increased by 97% (National Older Women’s Housing and Homelessness Working Group, 2018). Non-homeowners who are in receipt of income support, including the age pension, are eligible for rent assistance. Commonwealth Rent Assistance (CRA) is 75 per cent of the rent payable, subject to the fortnightly thresholds and caps. The structure of CRA requires that there is a gap between the rent paid and the support received, and single women have only a single pension with which to make up the difference. A single person is entitled to a maximum of $139.60 per fortnight, based on a fortnightly rent of $310. This reduces to $93.07 on a rent of $249 per fortnight in shared accommodation. There have been ongoing calls to increase the rates since the Henry Review6 (2010).
The CRA is guided by the Consumer Price Index and has been criticised for not keeping track with rising private market rents in inner and middle suburbs of major cities (Jacobs et al. 2015). In a rising housing market, increases in house prices are expected to increase rents at a rate greater than increases in the pension (Stone et al., 2016: 45). This is particularly problematic for single pensioners. The annual Anglicare survey shows that on 21 March 2020, less than one percent of available rentals from 69,960 properties listed across Australia were affordable for a single pensioner7 (Anglicare 2020). When rents exceed the maximum subsidised amount, the renter must fund the difference from their pension or another source of income. Single people without children comprise 53.9 per cent of CRA recipients, and there is evidence that older single women are the fastest growing group of low-income renters (AHRC, 2019). Even though some older women are not reliant on the age pension, over half of them use more than 30% to 50% of their salary for rental payments (AHRC, 2019: 15), and in 2017 there were 266,109 single women who received maximum CRA but still remained in rental stress (NFAW 2017).
In addition to CRA, states and territories offer financial assistance for people to access or remain in the private rental sector, generally as one-off specific purpose grants or loans, or short-term assistance. Eligibility is restricted, with applicants required to meet similar assessment requirements as those required for eligibility for social housing, such as a moderate income, experience of financial shock due to job loss or illness, domestic or family violence, and homeless or risk of homelessness. In some cases, extra conditions apply: for example, a cash assets cap at $3000 for the Rentstart Bond Loan; and showing capacity to restore financial independence and remain in the private rental market at the end of the subsidy period for Rent Choice Assist. In view of these tight eligibility requirements, some older SWWC are likely to be marginalised and miss out the housing assistance even though they have genuine need.
While government assistance to some extent addresses the financial circumstances of older single women who are renting, tenure is also a significant concern for older tenants (Hodgson, James and Webb, 2018), and the legislation protecting security of tenure is lacking. State and territory residential tenancy laws do not currently incentivise longer lease periods, and grounds for termination of tenancy are broad. For
6 In 2008, the Rudd Labor Government established the Australia's Future Tax System Review to examine Australia's tax and transfer system and make recommendations to position Australia to deal with the demographic, social, economic and environmental challenges of the 21st century. The Review Panel was chaired by Dr Ken Henry AC (Secretary to the Treasury), and is therefore colloquially known as ‘The Henry Review’. 7 This disregards the Coronavirus supplement. When including the supplement, the number rose to 743, or 1.07% of properties.

22
example, the current NSW Residential Tenancies Act 2010 does not provide appropriate protection for tenure security, such as ‘no ground eviction’, and rental increment with notice. Recent tenancy law reforms in Victoria have improved security of tenure for residential renters, and reviews are underway in NSW and WA (Hodgson, James and Webb, 2018).
Social housing and housing assistance The Australian Government has acknowledged that social housing stock has fallen behind demand (AIHW, 2018: 4). Social housing includes public rental housing, community housing, state- or territory-owned and managed indigenous housing, which have their own access requirements and allocation is on a priority or a waitlist basis. Despite yearly social housing stock increases, the rate of growth is not fast enough to meet the demand. As at 30 June 2017, 189,400 households were on the waitlists for social housing allocation (AIHW, 2018: 1). On the whole, social housing support focuses on those who have experienced an adverse critical life event, such as family breakdown, loss of employment or reduction of income, ill health, loss of loved ones or homelessness (Stone et al, 2016). According to AIHW, in 2018, 72.9 per cent of tenants of social housing programs (comprised of public housing, state owned and managed Indigenous housing, and community housing) were aged 45 and over; 61.7 per cent were women, and 55.4 per cent were single adult households (AIHW, 2018).8
To be eligible for social housing, applicants need to satisfy an income test. For example, in NSW the single household gross weekly income allowance is currently $625. Older SWWC with moderate incomes, but living in insecure private dwellings, are unlikely to meet the income or priority criteria for social housing assistance, even though being single and living alone are regarded as risk factors for women’s homelessness (AHRC, 2019: 10). The National Rental Affordability Scheme (NRAS) provides affordable housing for renters earning less than $51,398 per year (2019-20 year), but this scheme is phasing out over the next few years (Rowley et al., 2016).
In sum, SWWC who enter retirement in a position of home ownership are financially more secure as they do not have the additional cost burden of rent or mortgage repayments. Older SWWC have to be in crisis or living with very minimal means in order to meet the eligibility criteria for social housing assistance, despite the fact that living alone and being single are recognised risk factors for homelessness. As tenants, these women are subject to the vagaries of landlords and private rental markets. Even older single women receiving CRA experience high levels of housing stress due to housing unaffordability. Accordingly, home ownership is a significant factor in the economic security of older SWWC.
3.3 Aged care9 The housing outcomes of older single women without children are closely tied to the need for aged care. SWWC do not enjoy economies of scale when it comes to housing and thus face additional financial and practical challenges living alone. Older people with children, on the other hand, are more likely to utilise informal care provided by co-resident relatives in the home, delaying the need for residential or other paid, formal care. Koropeckyj-Cox and Call found that “[c]ompared to their peers who have had children, childless elders are more likely to live alone, have few face-to-face contacts with others, or live
8 Data source: https://www.aihw.gov.au/reports/housing-assistance/housing-assistance-in-australia-2019/contents/summary 9 The relevant legislation that was reviewed include the Aged Care Act 1997, as amended to March 2019 and the legislation and policies are available at https://agedcare.health.gov.au/publications-and-articles/legislation. There is currently an Aged Care Royal Commission underway. The interim report, titled “Neglect”, focusses on conditions in the Aged Care system and was tabled in Parliament on 31 October 2019.

23
in an institution… and they are less likely to report having a potential caregiver who could assist in an emergency or with long-term assistance” (2007:1368). For older people generally, the likelihood of living in an institution increases with age and is highest amongst unmarried women without children (Koropeckyj-Cox & Call 2007). Interestingly, the “risk of nursing home use” is positively correlated with childlessness for women, but not for men (Aykan, 2003, quoted in Plotnick 2009:768). One of the few Australian studies of childlessness in later life showed, using ABS data from 1986, that 18% of women without children were living in institutions, compared to 9% of mothers (Rowland 1998). In Australia in 1996, 22% of women without children aged 75 and over were living in long-term care, compared with 14% of women who had children (Australian Bureau of Statistics, 1996). Though dated, these findings suggest that the absence of children, partners and other co-residents results in a significantly greater need for formal aged care amongst women.
The Federal Department of Health administers two forms of aged care subsidies: home care packages designed to assist an older person to stay in their home, and residential aged care. The cost of care can be significant and is based on income and assets testing. Residential aged care providers charge a refundable accommodation deposit of up to $550,00010 in addition to daily fees, although all fees can be calculated on a daily basis and are subsidised for low income/asset residents, including non-homeowners. There is an assumption that home ownership will support aged care accommodation fees through sale of the home, reverse mortgage products or renting it out to provide an income stream (Productivity Commission, 2015). Notably, a home owned by the resident is exempt from the means tests if it will continue to be occupied by a protected person: a spouse, or a carer relative who is receiving an income support payment and has lived with you for two or five years respectively. SWWC are less likely to be able to meet these criteria than women with a spouse or child. The allocation of places depends on the outcome of an assessment by an Aged Care Assessment Team (ACAT), which determines whether a person is in need of care and assesses the extent of the care needed. Aged care providers encourage participation by informal carers to ensure that they have an accurate understanding of the older person’s needs (Aged Care Act P. 6(2)(d)(i)).11 Home care is available to recipients who have been assessed as being capable of functioning in the community with appropriate support (Principle 7, Approval of Care Recipient Principles), and support by family carers is taken into account in determining whether a person has adequate support to be able to continue to live in the community. Residential care is available to a person assessed as having a condition of frailty or disability such that they are incapable of living in the community without support (Principle 6, Approval of Care Recipients Principles). Single women without children may find they need to resort to home care packages earlier, or at a higher level, or to enter a residential aged care facility earlier due to the absence of a family carer (in the form of a spouse, children or grandchildren).
3.4 Summary Research suggests that gender, marital and parental status intersect in the lives of women in ways that potentially disadvantage single women without children as they age (Koropeckyj-Cox & Call 2007). While the gender pay gap is smaller among women and men without children, women still have lower average earnings, and therefore lower average superannuation balances, than men. Women without children achieve higher levels of education and occupational status, and have higher rates of labour
10 The maximum accommodation fee may be higher if the aged care provider seeks permission from the Aged Care Pricing Commissioner. 11 The relevant legislation here that was reviewed was the Aged Care Act 1997, as amended to March 2019 and the Legislation and policies available at https://agedcare.health.gov.au/publications-and-articles/legislation.

24
market participation and earnings, relative to women with children (Koropeckyj-Cox & Call 2007:1400; Plotnick 2009; Hank & Wagner 2013:649). Yet, the advantages of not having children, in terms of career progression and time spent in the workforce, does not necessarily enhance women’s economic security in older age. The areas in which older women without children appear to fare worse, relative to older women with children, is housing and aged care. As women without children are more likely to live alone, their access to care and ‘instrumental’ support provided by informal carers is more limited (Plotnick 2009: 768). As a result, older women without children are twice as likely as mothers to need institutional aged care (Koropeckyj-Cox & Call 2007).
The more important predictor of economic security in older age for women without children appears to be partnership status (Cwikel et al 2006; Plotnick 2009). While being single is associated with higher levels of full-time employment than being partnered, it is also associated with lower superannuation balances, lower levels of home ownership and higher levels of housing insecurity and housing stress, especially into older age. (Koropeckyj-Cox & Call 2007; Senate Economics References Committee 2016; Atalay et al. 2016; Wood et al. 2008). Being single is also positively associated with poverty and homelessness. Home ownership is a buffer against poverty in old age, and single women *are more likely than single men or couples to be renting or still paying off their mortgage in retirement. Consequently, they are significantly more at risk of homelessness and housing stress in later life (Senate Economics References Committee 2016). Single women (and men) do not enjoy economies of scale when it comes to housing and thus face additional out of pocket expenses as a result of being single (Koropeckyj-Cox & Call 2007). As older single women without children are even more likely to live alone than older single women with children, they are even less likely to enjoy economies of scale in housing in older age. Legislative provisions that refer to relationship or family status are generally intended to either acknowledge the pooling of resources that occurs in a relationship, or to assist people with children by providing support with the costs associated with children. They do not ameliorate disadvantages associated with partnership status. In fact, some provisions may even deepen these inequalities, such as the measures in the superannuation system that require a spouse in order to benefit from them, meaning that partnered people may enjoy greater concessions in the superannuation system than single people.
In sum, policies on the age pension, superannuation and housing do not discriminate between men and women but they do not address the underlying inequalities either, evidenced by the income and superannuation gap that lead to poorer outcomes for women. Being childless does not exacerbate these issues (in fact it has benefits) but being single places women at a greater risk of economic insecurity in later life, especially those women who have never owned a home or lost a home through divorce. For these women, the safety net is currently not meeting their needs. There seems to be a significant cohort of older single women facing homelessness and poverty, children or no children. When the need for care arises, the absence of informal care networks means that SWWC have few options but to enter residential care.

25
4. Comparing the circumstances of older SWWC to others using HILDA
How do the economic, health and social circumstances of older SWWC compare with those of other people in the same age range? In this section, we use data from the Household, Income and Labour Dynamics in Australia (HILDA) study to compare a wide range of economic and social outcomes. For our comparison, we group the population of people aged 45 and older along three dimensions: gender, whether or not they have ever been a parent, and whether or not they are currently partnered. The intersection of these categories produces eight groups.
1. SWWC. Single women without children—women who are currently not partnered, and who have never had a child
2. Single men without children—men who are currently not partnered and who have never had a child.
3. Single women with children—women who are currently not partnered, but who have had a child.
4. Single men with children—men who are currently not partnered, but who have had a child. 5. Partnered women without children—women who are currently partnered and who have never
had a child. 6. Partnered men without children—men who are currently partnered and who have never had a
child. 7. Partnered women with children—women who are currently partnered and who have had a child. 8. Partnered men with children—men who are currently partnered and who have had a child.
Our main focus is on the comparison of SWWC with groups 2, 3 and 5 (in bold above). Each of these groups differs from SWWC in only one respect – gender, past parenting and current partnered status respectively. Results for the other groups are available in Appendix A, along with more technical information about the estimation and some alternative estimation results.
A comparison of SWWC with single men without children, single women with children, and partnered women with children provides a simple way of describing the relationship of gender, parenting, and partnering respectively with various economic and social outcomes. However, it is important to note that these demographic groups also differ in other respects.
Of particular importance are differences in education levels, summarised in Figure 4.1 (with more details in Table A.1, Appendix A). SWWC are much more likely to have a university degree than the average person aged over 45, as are partnered women without children. Single men without children and single women with children, on the other hand have lower education levels. This partly reflects the impact of marital sorting (men with less education have lower marriage rates) and the impact of education on women’s fertility.

26
Source: HILDA survey, waves 1-18 Notes: Population: People aged 45+. The black ‘All’ bar in each column includes the other demographic categories.
Irrespective of the determinants of these patterns, however, it does mean that we might be expecting quite different outcomes between these groups simply because of their different educational characteristics. Consequently, when considering economic and social outcomes, we present two sets of results: the mean values for each group and estimates that control for education level.12 The latter show how the outcomes vary between the groups when the people have the same education level.
We begin by looking at economic indicators. Figure 4.2 shows personal disposable (after-tax) income (all estimates involving dollar values are adjusted to 2017-18 dollars using the CPI). Generally, SWWC have the same or higher mean personal incomes than the three comparison groups (partnered women without children are not significantly different – Table A.2, Appendix A). This difference is significantly different for single women with children, who in the two older groups have incomes around $5,000 per annum less than SWWC.
When we hold education level constant, however, the pattern changes (the right-hand half of the figure). When they have the same education, SWWC aged 45-54 have significantly lower personal incomes than single men without children and single women with children.
12 All estimates also control for survey year (at 2018). See Appendix A for details.
05
101520253035404550
45-54 55-64 65+ All
Figure 4.1 Percentage with bachelor degree or higher
All Single women without children
Single men without children Single women with children
Partnered women without children

27
Source: HILDA survey, waves 1-18 Notes: All estimates control for year of observation. Estimates controlling for education are shown for less than year 12 education. See Appendix A Table A.2 (models 4 and 7) for tests of significant differences and for other family types.
These patterns of personal income are largely a reflection of outcomes in the labour market, particularly employment and wage rates. Another labour market indicator is shown in Figure 4.3 – an indicator of perceived job security (only asked of employed people). Here, SWWC generally report greater job security, though Table A.3 (Appendix A) shows that this difference is generally not statistically significant (the gap with single men without children in the youngest age group is marginally significant).
0
10000
20000
30000
40000
50000
60000
45-54 55-64 65+ 45-54 55-64 65+
Mean value Controlling for education
Figure 4.2 Personal income by family status ($2017-18)
Single women without children Single men without children
Single women with children Partnered women without children

28
Source: HILDA survey, waves 1-18 Notes: For people with jobs. Not shown for 65+. All estimates control for year of observation. Estimates controlling for education are shown for less than year 12 education. See Appendix A Table A.3 (models 4 and 7) for tests of significant differences.
Figure 4.4 reports the levels of household income for people in the four demographic categories. This income measure is total household after-tax income, divided by the modified OECD equivalence scale (to take account of the income needs of different sized households). Here, partnered women stand out as having higher incomes, particularly in the younger age groups. Single women with children aged 45-54 have a significantly lower income, which is still the case when controlling for education. As for personal income, single men without children have a significantly higher income than SWWC when controlling for education.
77.17.27.37.47.57.67.77.87.9
8
45-54 55-64 65+ 45-54 55-64 65+
Mean value Controlling for education
Figure 4.3 Job security index (0-10)
Single women without children Single men without children
Single women with children Partnered women without children
0
10000
20000
30000
40000
50000
60000
70000
80000
90000
45-54 55-64 65+ 45-54 55-64 65+
Mean value Controlling for education
Figure 4.4 Equivalised household income by family status ($2017-18)
Single women without children Single men without children
Single women with children Partnered women without children

29
Source: HILDA survey, waves 1-18 Notes: All estimates control for year of observation. Estimates controlling for education are shown for less than year 12 education. See Appendix A Table A.4 (models 4 and 7) for tests of significant differences.
Figure 4.5 reports the person’s superannuation balance. The wealth data was only recorded in 2002, 2006, 2011, 2014 and 2018. On average, SWWC had balances of around $260,000 for those aged 45-54, $340,000 for those aged 55-64 but only $200,000 for those aged 65+. This was higher than for single women with children, but much lower than for partnered women without children.
Source: HILDA survey, waves 1-18 Notes: All estimates control for year of observation. Estimates controlling for education are shown for less than year 12 education. See Appendix A Table A.5 (models 4 and 7) for tests of significant differences.
A similar pattern applies to total household wealth (minus debts), as shown in Figure 4.6. Partnered women had significantly higher wealth levels. The younger groups of single women with children had a significantly lower household wealth than SWWC, but this disappears when controlling for education. Similarly, when controlling for education, SWWC have lower household wealth than single men without children in the youngest and oldest age groups.
0
100000
200000
300000
400000
500000
600000
45-54 55-64 65+ 45-54 55-64 65+
Mean value Controlling for education
Figure 4.5 Personal superannuation wealth
Single women without children Single men without children
Single women with children Partnered women without children

30
Source: HILDA survey, waves 1-18 Notes: All estimates control for year of observation. Estimates controlling for education are shown for less than year 12 education. See Appendix A Table A.6 (models 4 and 7) for tests of significant differences.
Self-rated prosperity is shown in Figure 4.7. This also has a similar pattern to personal and household wealth. Partnered women without children had much higher levels of prosperity. SWWC had higher prosperity than single men without children and single women with children, but the gap with the former group disappears when controlling for education.
Source: HILDA survey, waves 1-18 Notes: All estimates control for year of observation. Estimates controlling for education are shown for less than year 12 education. See Appendix A Table A.7 (models 4 and 7) for tests of significant differences.
0
200000
400000
600000
800000
1000000
1200000
1400000
1600000
1800000
45-54 55-64 65+ 45-54 55-64 65+
Mean value Controlling for education
Figure 4.6 Household net wealth
Single women without children Single men without children
Single women with children Partnered women without children
2
2.2
2.4
2.6
2.8
3
3.2
45-54 55-64 65+ 45-54 55-64 65+
Mean value Controlling for education
Figure 4.7 Self-rated prosperity (0=very poor to 5=prosperous)
Single women without children Single men without children
Single women with children Partnered women without children

31
The percentage of people who are homeowners (including those paying off a mortgage) is shown in Figure 4.8. As for the other wealth indicators, being partnered is associated with higher home ownership. Compared to the other groups, SWWC generally have higher home ownership rates.
Source: HILDA survey, waves 1-18 Notes: All estimates control for year of observation. Estimates controlling for education are shown for less than year 12 education. See Appendix A Table A.8 (models 4 and 7) for tests of significant differences.
Total annual household housing costs (rent plus mortgage repayments) are shown in Figure 4.9. Housing costs fall substantially with age, as homeowner are more likely to pay off their homes. This fall is greater for partnered women without children, who are more likely to be homeowners.
Source: HILDA survey, waves 1-18 Notes: All estimates control for year of observation. Estimates controlling for education are shown for less than year 12 education. See Appendix A Table A.9 (models 4 and 7) for tests of significant differences.
0102030405060708090
100
45-54 55-64 65+ 45-54 55-64 65+
Mean value Controlling for education
Figure 4.8 Home ownership - both with and without mortgage (%)
Single women without children Single men without children
Single women with children Partnered women without children
0
5000
10000
15000
20000
25000
45-54 55-64 65+ 45-54 55-64 65+
Mean value Controlling for education
Figure 4.9 Housing costs by family status ($2017-18)
Single women without children Single men without children
Single women with children Partnered women without children

32
HILDA respondents were asked whether, over the last 12 months, they were ever unable to pay their electricity, gas or telephone bill on time (Figure 4.10) and whether they had asked for financial help from friends or family (Figure 4.11) or welfare organisations (Figure 4.12).
Single women with children stand out as having more hardship than SWWC, particularly for the younger groups, and partnered women without children exhibit lower levels of hardship than SWWC. The responses mirror those for income and wealth. Younger single men without children were less likely than single women without children to ask for financial help from friends or family.
0
5
10
15
20
25
30
35
45-54 55-64 65+ 45-54 55-64 65+
Mean value Controlling for education
Figure 4.10 Could not pay utility bills on time (%)
Single women without children Single men without children
Single women with children Partnered women without children
0
5
10
15
20
25
30
45-54 55-64 65+ 45-54 55-64 65+
Mean value Controlling for education
Figure 4.11 Asked for financial help from friends or family (%)
Single women without children Single men without children
Single women with children Partnered women without children

33
Source: HILDA survey, waves 1-18 Notes: All estimates control for year of observation. Estimates controlling for education are shown for less than year 12 education. See Appendix A Tables A.10-12 (models 4 and 7) for tests of significant differences.
The ABS calculates scores of advantage and disadvantage for each locality in Australia. Figure 4.13 shows the decile of advantage/disadvantage score in which the person lives (10=most advantaged). Partnered women without children tend to live in more advantaged regions. Most of the other differences are not statistically significant (except for the 55-64 group, not controlling for education).
Source: HILDA survey, waves 1-18 Notes: All estimates control for year of observation. Estimates controlling for education are shown for less than year 12 education. See Appendix A Table A.13 (models 4 and 7) for tests of significant differences.
0
2
4
6
8
10
12
45-54 55-64 65+ 45-54 55-64 65+
Mean value Controlling for education
Figure 4.12 Asked for financial help from welfare organisations (%)
Single women without children Single men without children
Single women with children Partnered women without children
3
3.5
4
4.5
5
5.5
6
6.5
7
45-54 55-64 65+ 45-54 55-64 65+
Mean value Controlling for education
Figure 4.13 SEIFA 2011 advantage/disadvantage decile (10=highest)
Single women without children Single men without children
Single women with children Partnered women without children

34
The HILDA survey also collects a number of self-reported health indicators. The SF-36 general health score is shown in Figure 4.14 and the mental health score is shown in Figure 4.15. Patterns are variable across the different age groups.
Source: HILDA survey, waves 1-18 Notes: All estimates control for year of observation. Estimates controlling for education are shown for less than year 12 education. See Appendix A Tables A.14-15 (models 4 and 7) for tests of significant differences.
Finally, we show two indicators of non-labour market time commitments. Figure 4.16 shows patterns of time spent caring for others. This shows quite a different pattern to the previous indicators. SWWC aged 55-64 are much more likely to be spending time caring for relatives. Being female and not having children tends to be associated with having additional caring responsibilities.
40
45
50
55
60
65
70
75
45-54 55-64 65+ 45-54 55-64 65+
Mean value Controlling for education
Figure 4.14 SF-36 General health score
Single women without children Single men without children
Single women with children Partnered women without children
55
60
65
70
75
80
45-54 55-64 65+ 45-54 55-64 65+
Mean value Controlling for education
Figure 4.15 SF-36 Mental health score
Single women without children Single men without children
Single women with children Partnered women without children

35
Source: HILDA survey, waves 1-18 Notes: All estimates control for year of observation. Estimates controlling for education are shown for less than year 12 education. See Appendix A Tables A.16 (models 4 and 7) for tests of significant differences.
Figure 4.17 takes a longer view and relies on retrospective questions on how many years the respondent has spent in the workforce since finishing full-time education. Being a mother has a strong impact, as we would expect. Among the younger groups without children the percentage of time working is very similar (except for mothers). However, among the oldest group, single women without children have around 10-12 percentage points less workforce time than single men and around 4-5 percentage points less than partnered women.
0
2
4
6
8
10
12
14
45-54 55-64 65+ 45-54 55-64 65+
Mean value Controlling for education
Figure 4.16 Hours/week caring for a disabled/elderly relative
Single women without children Single men without children
Single women with children Partnered women without children
40%
50%
60%
70%
80%
90%
100%
45-54 55-64 65+ 45-54 55-64 65+
Mean value Controlling for education
Figure 4.17 Percentage of years working (after full-time education)
Single women without children Single men without children
Single women with children Partnered women without children

36
Source: HILDA survey, waves 1-18 Notes: All estimates control for year of observation. Estimates controlling for education are shown for less than year 12 education. See Appendix A Table A.17 (models 4 and 7) for tests of significant differences.
As set out in Table A.17 (Appendix A), in the oldest cohort, all groups of men (partnered, not partnered, children, no children) have longer working lives than all groups of women (the four groups of men sit at between 73 and 78 per cent workforce time), with partnered men (children or no children) having longer working lives than single men. Next is women without children, with partnered women without children (65%) having longer working lives than SWWC (61%) and finally women with children, with partnered women with children (45%) having longer working lives than single women with children (42%). This suggests that SWWC, in spite of not having children, also experience career interruptions/disruptions, and that these are concentrated late in their working lives. On average, their working lives are shorter than those of men with and without children, and of partnered women without children, suggesting that even though not having children is associated with longer working lives, gender and being single are associated with shorter working lives. This could reflect earlier retirement among women, challenges faced by older women in maintaining or seeking work in later life, or interruptions to the labour market participation of SWWC later in life due to care responsibilities for ageing relatives.
4.1Summary In this section, we used data from the HILDA survey to look at a range of economic, health and social outcomes for different groups of people aged 45 and older. As well as looking at different age sub-groups, the analysis looked at the role of three key demographic factors: gender, whether the person had ever been a parent (described here as ‘with children’/’without children’), and whether the person is currently partnered. Comparing SWWC with single men without children, single women with children and partnered women without children thus allows the analysis to look at the independent association with gender, parenting and partnering. (Comparisons with other groups, significance tests, and other ways of controlling for age and year of observation are included in Appendix A.)
SWWC have relatively high education levels compared to single men without children and single women with children. Because education levels are associated with these demographic outcomes, we also compared these groups while holding education levels constant.
Using these comparison groups, we can use the following short-hand to describe these demographic impacts
Comparison of SWWC with single men without children Impact of being female Comparison of SWWC with single women with children Impact of not being a parent Comparison of SWWC with partnered women without children Impact of not having a partner
However, it should be noted that we do not have definitive information about the causal direction. For example, it might be the case that someone with a high potential wage is seen as a better marriage partner and so more likely to become, and stay, married. In this case, the ‘impact of partnering’ on personal income also partly reflects the impact of wage rates on partnering. Controlling for education partly addresses this, but there might still be a reverse causal link beyond the impact of education.

37
Key findings from the comparison with these three groups include:
SWWC have the same or higher personal incomes than the other three groups. When controlling for education, however, the pattern changes for 45-54-year-olds. For this age group, being female and not being a parent is associated with lower incomes. (That is, they have lower incomes than single men without children and single women with children).
For most economic variables measured at the household level, the most obvious impact is that of being currently partnered – which is associated with favourable economic outcomes. Partnered women without children had higher levels of equivalized household income, household wealth (and also personal superannuation wealth), self-rated prosperity, home ownership and living in advantaged regions.
In the opposite direction, being a single woman with children (i.e. the impact of being a parent) is associated with less favourable outcomes. Those aged 45-54 have lower household incomes, less superannuation and household wealth, lower self-rated prosperity, lower home ownership and higher housing costs and are more likely to suffer hardship.
Single men without children (i.e. the impact of gender) have higher personal incomes if we control for education levels and higher household wealth.
Finally, being female and not having children is associated with spending more time caring for a disabled or elderly relative.
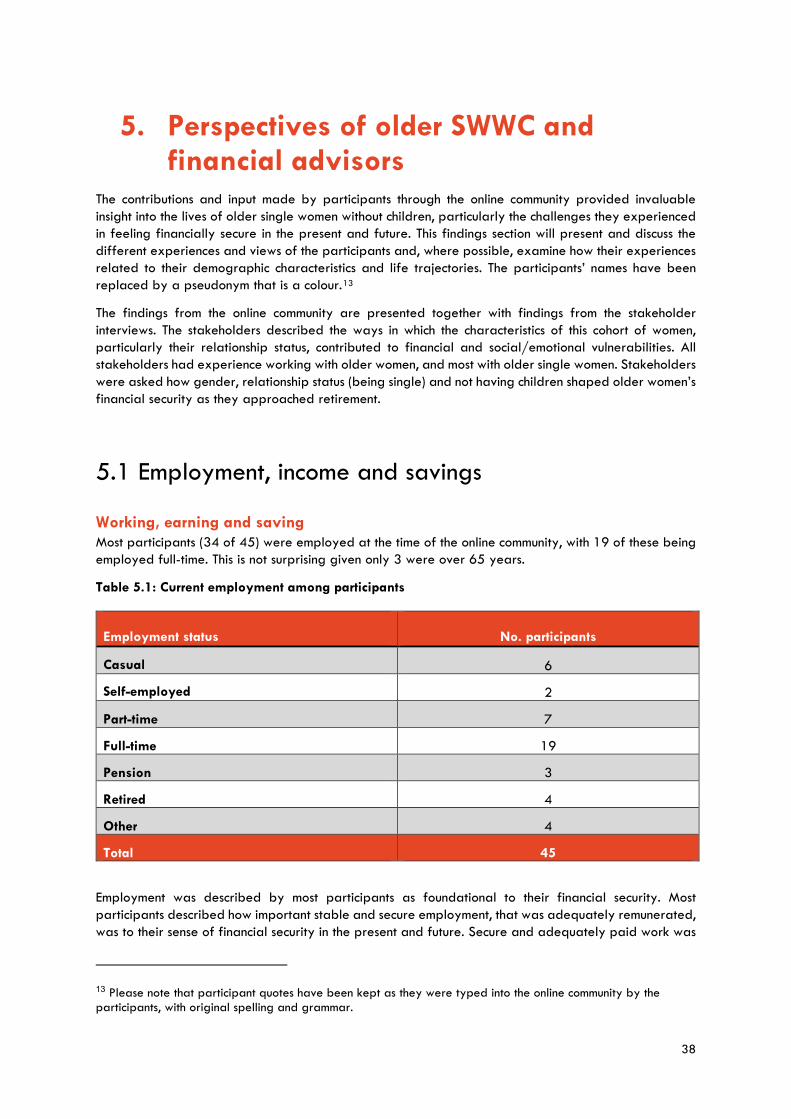
38
5. Perspectives of older SWWC and financial advisors
The contributions and input made by participants through the online community provided invaluable insight into the lives of older single women without children, particularly the challenges they experienced in feeling financially secure in the present and future. This findings section will present and discuss the different experiences and views of the participants and, where possible, examine how their experiences related to their demographic characteristics and life trajectories. The participants’ names have been replaced by a pseudonym that is a colour.13
The findings from the online community are presented together with findings from the stakeholder interviews. The stakeholders described the ways in which the characteristics of this cohort of women, particularly their relationship status, contributed to financial and social/emotional vulnerabilities. All stakeholders had experience working with older women, and most with older single women. Stakeholders were asked how gender, relationship status (being single) and not having children shaped older women’s financial security as they approached retirement.
5.1 Employment, income and savings
Working, earning and saving Most participants (34 of 45) were employed at the time of the online community, with 19 of these being employed full-time. This is not surprising given only 3 were over 65 years.
Table 5.1: Current employment among participants
Employment status
No. participants
Casual 6
Self-employed 2
Part-time 7
Full-time 19
Pension 3
Retired 4
Other 4
Total 45
Employment was described by most participants as foundational to their financial security. Most participants described how important stable and secure employment, that was adequately remunerated, was to their sense of financial security in the present and future. Secure and adequately paid work was
13 Please note that participant quotes have been kept as they were typed into the online community by the participants, with original spelling and grammar.

39
essential both for enabling them to cover expenses and to save for the future. For some, concerns about not having enough savings prompted them to find additional sources of income through extra seasonal jobs, working during elections, dog sitting/house sitting, or renting out spare rooms. When asked about the most important contributor to financial security, security of employment was a common response across the sample. One participant phrased it this way:
Having a steady, reliable income from a permanent position (ie not casual or short-term contract) to enable a person to not only keep up with usual cost of living but be able to set
aside funds for the future (Nyanza).
Stakeholders also emphasised the importance of security of employment to the financial security of single older women (without children) as they reach later life. Overwhelmingly, stakeholders responded that security and permanency were more important than wages, flexibility, and other conditions or benefits. This was because security of employment offered the cohort, who were all relying on one income and were without the ‘safety net’ offered by a second income, predictability and stability to cover expenses in the present but also to build financial security in the longer term. In particular, stability of employment was fundamental to this cohort’s opportunities to buy a house.
[Y]ou can have an income of $150,000 a year or $200,000 a year and still be really scared about how that’s going to be threatened and if you’re on a rolling contract, the
bank is not going to lend to you (Wealth Management Advisor).
Consistency, and permanency. That’s very key, and I think in a world where we’re moving towards casual and contract work, this is a bit of an issue. Consistency, permanency – it’s finding employment. I think finding employment, as you’re older, is more challenging for
everybody (Mortgage Broker).
Consequently, those women who experience challenges finding secure work, particularly those in precarious or casual employment, had a much lower sense of financial security in the present and future. The irregular or insecure income also made it more difficult to save for the future.
Intersectional disadvantage and advantage? Among the cohort, their employment opportunities and trajectories were shaped by their demographic characteristics and relationship and family status in different ways. More than half of the women in the sample reported that their gender had limited their labour market experiences and opportunities, or their incomes. For some, this was associated with working in a female-dominated industry or occupation where wages were lower, whereas for others, it was a result of broader inequalities in wages and in gendered social norms and expectations. Grullo and Old Burgundy described it like this:
I was never a high-income earner and I never earned what men doing the same work earned. I was never the type to fight for more money in the workplace (Grullo).
I think being female I have not had the confidence to be more ambitious in my career, certainly when faced with male managers. I have always felt as though I've had to be
polite and grateful when daring to ask for a raise (although perhaps this is a personality trait and nothing really to do with my gender), even when raise given turned out to be a
tad insulting I've not had the confidence to push back (Old Burgundy)!

40
Several recounted how this had changed over their careers, and that while there had been improvements and the gender disparity had narrowed, they were still feeling the legacy of inadequate remuneration in their younger years, particularly when it came to their savings.
Superannuation was also closely linked to participants’ capacity to find and maintain secure employment, and those in the sample who identified limitations on employment opportunities associated with gender also described the flow on effect on earnings and savings. All of the stakeholders interviewed identified the effects of gender on this cohort’s opportunities to accumulate adequate retirement incomes. For example, several noted the concentration of women in casualised workforces or part-time work, with lower or more limited superannuation entitlements:
it goes along with tenure and your employment contract, that you do get your super paid for you. So, if you're employed using an ABN, under short-term contracts, a lot of
employers are not paying super, and they should be, but they’re not... (Financial Advisor 2).
The historical gender factor plays an enormous impact. The facts that these women have often worked in the workforce in maybe casual jobs, part time works. Lower paid work
where either no superannuation was required to be paid or a minimal amount of superannuation was required to be paid. So that absolutely impacts their financial security
(Housing Specialist).
Many expressed a sense of injustice about their weaker opportunities to accumulate strong superannuation balances and expressed deep anxiety about this. At the same time, several participants identified circumstances during their life where they would have liked to access their superannuation funds, and believed the current system was limiting, and some of these were linked to their relationship status. In particular, several described a desire to access funds to put down a deposit on a house, something that had been more difficult to do on a single income.
For a smaller proportion of the sample, however, gender was not viewed as a factor that had shaped their employment opportunities and financial security. For example, Catawba:
Many people say it's otherwise but I believe that if a woman is capable of doing the same job performed by a man, she can negotiate to receive the same salary. She just has to be
assertive about what she wants (Catawba).
About a quarter of the sample reported that their age was a much stronger factor shaping their labour market opportunities than their gender, particularly as they passed age 50. Some had experienced retrenchment or redundancy and had subsequently experienced difficulties finding work and believed this was because of their age. Others who were in work reported differential treatment because of their age, such as fewer or less desirable shifts, and some said their declining health limited their employment experience and opportunities. Some of those in work reported feeling more vulnerable to redundancy or retrenchment because of their age. The effects of age on employment opportunities was a source of considerable anxiety for this group of participants. Several described these challenges in the following way:

41
Now at 61 years of age, my seasonal employers tend to give the long shifts to the young people and give those of us over 40 years really inconvenient shifts that are much shorter. As a rule, I have more get up and go than the younger people around me but repeatedly
that gets overlooked and then they winge they can’t get people to work (Deep Ruby).
Fear of loss of employment due to current age, 64 yo. current role is physically hard and the body is wearing out, on workcover due to shoulder [injury] currently. Live in rural city
with little to no chance of gaining new employment due to age/skill set (Eggshell).
I worry about being retrenched. And how would I get another job at 51+ (Maximum Green).
Hence, about a quarter of the sample described ways in which their age limited their employment opportunities and experiences, and around half of the sample described ways in which their employment opportunities or financial security were limited by their gender. None described gender and age as of benefit to their employment and earning prospects.
In contrast to demographic factors such as gender and age, which were broadly conceived as limiting their employment opportunities, almost all participants reported that their relationship and family status (i.e. being single without children), for the most part, increased the opportunities available to them in the workplace. Most suggested that being single and not having children meant that they were in a position to be more flexible in their career decisions and their daily work patterns, and that this was often viewed by employers as a positive attribute. They described the ways in which this enabled them to more flexibly meet their employers’ needs, to more easily participate in networking opportunities outside of working hours and even to build closer relationships with their colleagues and employers. Several participants described this in the following way:
If anything it [being single] has been an advantage as I have been inappropriately asked at job interviews if I have children or are married and I believe if I had been married with
kids some roles would not have been offered (Taupe Gray).
I am working in a traditionally female role (Secretary/PA) so being single and without other calls on my time and attention has been an advantage for employers who don't want
too much competition for my time (Jonquil).
I work in finance, if anything it [not having children] gives me more flexibility as sometimes we do need to travel, attend functions after hours. My colleagues with children are unable
to do this (Golden Poppy).
Notably, they did not differentiate between the impacts of being single and the impacts of not having children on their employment opportunities and experiences. For them, both being single and not having children were intertwined and together reduced the time commitment they had to immediate family, and their discussion of their ‘single status’ was not in any case independent of their discussion about not having children.
The participants suggested that this was an advantage for their own availability to participate in activities as requested, but a large part of this advantage arose from the way in which their relationship and family status shaped their employers’ attitudes and expectations about their value and capacities as an employee. This provided them with what they perceived to be a competitive advantage in the

42
hiring process and additional opportunities in the workplace that would in turn contribute to greater earnings, savings and future financial security.
Some women reported that, while employer attitudes and expectations worked in their favour in hiring practices and opportunities in the workplace, the perception that they were an ‘unencumbered worker’ could also lead to additional pressures by employers on their personal and non-work time. For example, several participants noted that they were regularly asked to stay back late to finish work when other employees had to leave to collect children from school, or were told they could not take annual leave over certain holiday periods because parents had priority in taking leave during school holidays.
One of my bosses once told me she expected her single staff members to do more and be more available after hours (Engineering Orange).
I don't think being single affects my employment opportunities. But at times at work I feel like I have to step up more to cover staff who need time off for family reasons (eg attend a child's school assembly performance, doctor's appointments etc) but this is never an option for me. I feel as I don't have family responsibilities more is expected of me in my own time
(Pistachio).
Well for starters, if you’re single without kids as I am, the parents who are working still seem to get priority when being allocated annual leave eg they get the school holidays
and we singles have to fit in around their needs (Sunray).
Cost of living While being single could be an advantage for employment and earning opportunities, participants reported that this did not translate into opportunities to accumulate superannuation and wealth. Both older women and financial stakeholders described the financial benefits of being in a couple and the pressures associated with meeting expenses on a single income.
Most participants reported that being single increases the cost of living because they do not have access to the same economies of scale that couples do. Most participants referred in some way to the challenges associated with not being able to pool resources, and the added expense of paying utility and other bills, and buying groceries as a single person.
Yes it is expensive to maintain and run a house. The costs of living (eg electricity, insurance etc) are continually rising but my pay isn't keeping up as readily. Two incomes would make
life much more comfortable and I would [not] have to budget as carefully as I do now (Pistachio).
Several also discussed groceries because “many grocery items are cheaper if you buy in bulk, but they either go off before I can use them, or cant afford the extra initially to benefit from the 'specials'” (Tropical Violet). Stakeholders also identified the greater challenges with meeting costs of living for singles who live alone compared with couples due to their lack of access to economies of scale and reliance on a sole income. Stakeholders observed that this was a particular challenge as older single women aged and their income from work diminished.
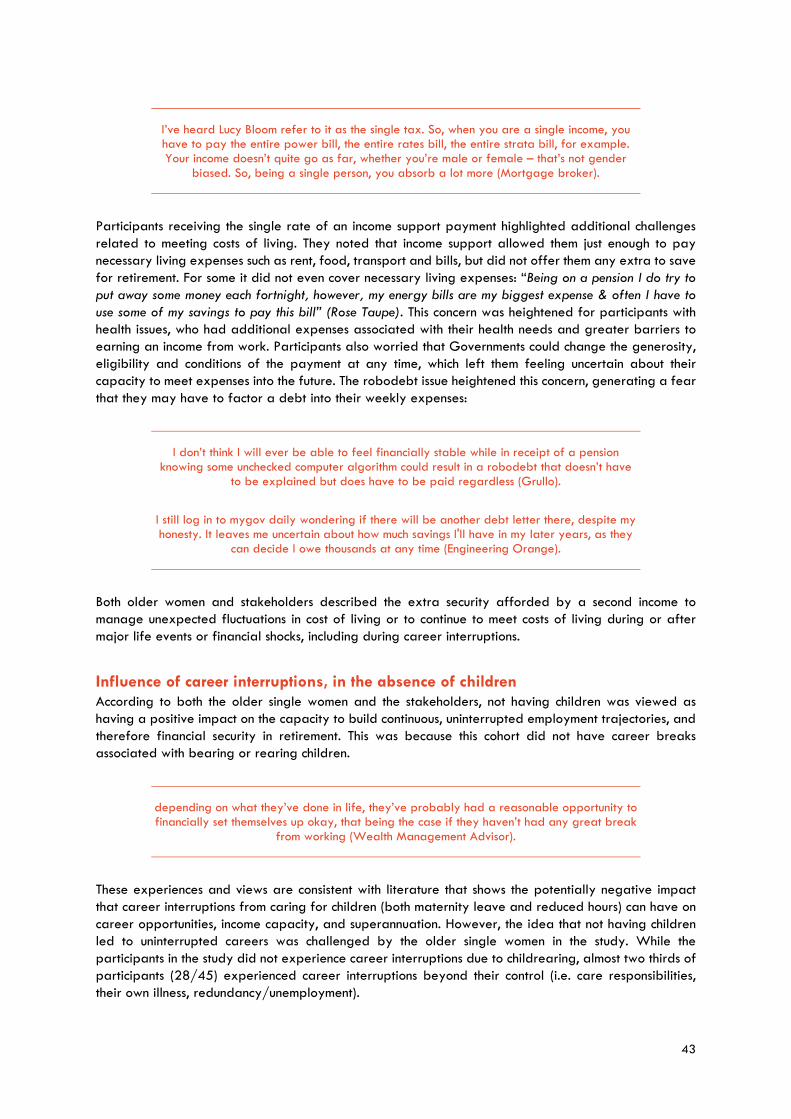
43
I’ve heard Lucy Bloom refer to it as the single tax. So, when you are a single income, you have to pay the entire power bill, the entire rates bill, the entire strata bill, for example. Your income doesn’t quite go as far, whether you’re male or female – that’s not gender
biased. So, being a single person, you absorb a lot more (Mortgage broker).
Participants receiving the single rate of an income support payment highlighted additional challenges related to meeting costs of living. They noted that income support allowed them just enough to pay necessary living expenses such as rent, food, transport and bills, but did not offer them any extra to save for retirement. For some it did not even cover necessary living expenses: “Being on a pension I do try to put away some money each fortnight, however, my energy bills are my biggest expense & often I have to use some of my savings to pay this bill” (Rose Taupe). This concern was heightened for participants with health issues, who had additional expenses associated with their health needs and greater barriers to earning an income from work. Participants also worried that Governments could change the generosity, eligibility and conditions of the payment at any time, which left them feeling uncertain about their capacity to meet expenses into the future. The robodebt issue heightened this concern, generating a fear that they may have to factor a debt into their weekly expenses:
I don’t think I will ever be able to feel financially stable while in receipt of a pension knowing some unchecked computer algorithm could result in a robodebt that doesn’t have
to be explained but does have to be paid regardless (Grullo).
I still log in to mygov daily wondering if there will be another debt letter there, despite my honesty. It leaves me uncertain about how much savings I'll have in my later years, as they
can decide I owe thousands at any time (Engineering Orange).
Both older women and stakeholders described the extra security afforded by a second income to manage unexpected fluctuations in cost of living or to continue to meet costs of living during or after major life events or financial shocks, including during career interruptions.
Influence of career interruptions, in the absence of children According to both the older single women and the stakeholders, not having children was viewed as having a positive impact on the capacity to build continuous, uninterrupted employment trajectories, and therefore financial security in retirement. This was because this cohort did not have career breaks associated with bearing or rearing children.
depending on what they’ve done in life, they’ve probably had a reasonable opportunity to financially set themselves up okay, that being the case if they haven’t had any great break
from working (Wealth Management Advisor).
These experiences and views are consistent with literature that shows the potentially negative impact that career interruptions from caring for children (both maternity leave and reduced hours) can have on career opportunities, income capacity, and superannuation. However, the idea that not having children led to uninterrupted careers was challenged by the older single women in the study. While the participants in the study did not experience career interruptions due to childrearing, almost two thirds of participants (28/45) experienced career interruptions beyond their control (i.e. care responsibilities, their own illness, redundancy/unemployment).

44
Table 5.2: Career interruptions among participants, and reason
Career interruption
No. participants
No 9
Yes, by choice 2
Yes, illness 11
Yes, caring for parents 4
Yes, redundancy 4 Yes, multiple reasons (incl. redundancy, illness, caring for family) 9
Other 2
Unassigned 4
Total 45
As noted in Table 5.2, participants reported having had career interruptions due to their own illness (11); caring for parents (4); or a combination of reasons, often illness, care and other reasons (9). Another 4 participants had career interruptions primarily due to redundancies. Only 9 participants had not experienced any career interruptions, indicating they had only had very short breaks between jobs.
Some career breaks involved periods of time outside of the paid labour market; others were periods of time during which participants reduced their labour market participation but maintained attachment to the labour market. While many withdrew from the labour market for periods of time or suddenly lost work and spent time seeking employment again, a number of participants worked part-time jobs to accommodate their own health needs, caring for ageing parents, or because they were unable to find full-time work. Often, career breaks were a combination of periods completely outside of paid work and periods of part-time work. For those experiencing periods outside of paid work, a number found it difficult to return to full-time employment either because of ongoing health or care responsibilities or because of barriers in the labour market. This meant returning to part-time or casual work. Re-entry into the labour market was particularly difficult for those who had experienced a career break later in their lives. As one participant recalled:
I’ve been through forced redundancy at a bad time to get re-employed (over Christmas) and unfortunately didn’t get to invest much of my payout. Because of my age (nearly 50 at the time) I found myself competing against young uni grads & hard to get back. Eventually
found a temp role which progressed to permanent work (Raspberry Glace).
Hence, while participants had not experienced interruptions to their career associated with children, a large proportion had experienced career interruptions beyond their control, particularly those associated with mental and physical ill health. However, unlike partnered people, for whom there is often a second earner that can cushion some of the effects of an involuntary career interruption on income and wealth, this cohort did not have access to this cushioning effect.

45
5.2 Housing Of the 45 participants in the online community, over half (24) had a mortgage and 6 owned their house outright. A further 9 were renting. Two were in social housing. Two participants were living in the family home with their parents and had made the decision to do so for a combination of financial reasons, caring responsibilities, and their own health care needs.
Table 5.3: Housing status of participants
Career interruption
No. participants
Renting 9
Mortgage 24
Own outright 6
Family home 2
Public/social housing 2
Unassigned 2 Total
45
Owners and renters Stable and affordable housing was identified as a critical factor affecting participants’ capacity to be financially secure. Where home ownership was not possible, opportunities for stable, long term renting were important. The stakeholders strongly shared this view, focusing on the importance of stable affordable housing for financial security and wellbeing among both homeowners and renters, but especially among renters.
I don’t own my home but just being able to rent long term gives me emotional security (Sunray).
It’s always been a huge struggle, from both a physical and monetary perspective. The only times have Ive been genuinely 'secure' has been when I had housing I could easily afford. If
you have no family to fall back on in hard times it's really difficult. (Deep Ruby).
So one of the biggest predictors of someone feeling financially secure is being able to get a home and have a regular income and you can know you’re paying it off. If that’s
threatened, then that’s a real problem, because thinking about the single women that I know that have had to move three or four times in the space of five years. That’s incredibly
expensive, disruptive, destabilising and that’s an issue (Financial Advisor 3).
It was evident from the data that women who owned their home (had a mortgage or owned outright) felt more financially stable in the present and future. This was variously described by participants as ‘financial security’, ‘financial freedom’, ‘safety’, and ‘peace of mind’. Those who owned their homes believed they were in a much better position as they got older, and as their earning capacity reduced. Most described being ‘lucky’ or fortunate to own their home, and attributed their fortunate circumstances

46
to having entered the real estate market earlier in their lives, when it was more affordable, or talked about the support they received from family members (usually parents) to purchase their own property.
Owning your own home represents financial freedom... The thought of Owning my home Makes me feel safe (Bright Lilac).
I only owe around $100 on my mortgage. I'm not earning much at the moment and it gives me piece of mind to know that even if things get dire in the future, I have somewhere to live
(Engineering Orange).
A small number of participants owned property for investment purposes but did not currently live in the property they owned, renting instead. A few had intentions to live there in the future (e.g. move out of the city), while for others it was simply not affordable to own property in city centres where they lived but they believed investment elsewhere was beneficial to their future financial security.
Conversely, those who did not own a home (and were renting or living with family) had a much lower sense of financial security. Some aspired to home ownership, and others did not believe it would ever be possible for them, but all believed that if they entered the property market it would increase their financial prospects, especially as they aged. One participant put it this way:
I don't own my own home - I am a renter. I do feel that owning my own apartment would help me to feel more secure (Han Blue).
Given they are now one of the fastest growing groups among the homeless population, the circumstances of older single women renters have become a topic of interest and concern among policymakers and people working in the not for profit sector in recent years (AHRC, 2019; Power, 2020). This was recognised by the stakeholders, who reported observing the vulnerabilities facing older single women clients in the rental market:
I think the home ownership thing can't be considered enough in this cohort (the single women without children), because that is the real, like once you start to remove homeownership
from the equation that’s when you can start to see real vulnerability (Financial Advice Policy Strategist).
All stakeholders stressed the importance of home ownership for financial security among this cohort.
Securing a home loan However, while a large proportion of participants were already homeowners, some of the owners and most of the private renters reported challenges associated with securing a home loan on a single income. Among homeowners, several reported that for them, the process was ‘smooth’ or ‘simple’, and these participants all indicated they had a personal connection to the bank, or had been with the bank for a long time. Four reported that they had successfully navigated the process of securing a mortgage by drawing on the financial and emotional support of their parents or siblings:

47
If my father wasn't in a position to help me financially in the very generous way in which he did, I would never be able to afford my own home alone (Electric Lime).
I would not have been able to purchase a home or buy investment property without going in with my siblings (Vivid Mulberry).
However, some homeowners and most of the renters described the way in which their relationship status (being single) made securing a home loan very difficult. Some described times in the past when they had approached banks and been unsuccessful in securing a loan because they were on a single income. Other participants simply didn’t try as they believed they would not be approved because they were on a single income.
I remember quite clearly when I was saving for a deposit that one or two lenders mentioned that because I was single they didn't think the loan would be approved (Old
Burgundy).
For several, the barriers to securing a home loan intensified as they got older, preventing some renters from ever entering the housing market, and preventing some homeowners from re-mortgaging their properties, even to downsize to a smaller place.
Being an older woman now with no children, have retired to the fact that I will rent forever. Price of real estate is too high and banks would not consider a loan (Pastel Pink).
I went to another lender to see what other options I have. Ideally I would have transferred the loan to reduce my interest rate. I found out I would have to apply for a new loan in this
case, which wouldn't be approved given I am on a pension and over 50, and despite having high equity on my current home. So, I am stuck on a higher interest and there is
nothing I can do that I am aware of. Doesn't seem fair. This is definitely having an impact financially now and in the future (Tropical Violet).
Several stakeholders also described the challenges for a single person trying to secure a home loan with a bank because “everybody is expected to have a double income in a household” (Financial Advice Program Manager 2), and the lack of support for older single women – and single women of all ages – for navigating this process.
When it comes to borrowing, banks are really tough. There’s not a lot of good quality help out there for women trying to work out whether they can afford to buy a home. The rules are pretty tough on lending criteria which I understand the need for it and we can’t lend
inappropriately, but I think this turns a lot of women off being able. They are just not able to access the property market (Financial advisor 3).

48
Housing precarity In spite of the much greater sense of financial security offered by home ownership, a sense of precarity when it came to housing was widely expressed across the sample, both among renters and owners. However, the nature of that precarity took different forms for owners and renters.
Those who had never been in a financial position to purchase their own home generally experienced greater barriers to stable housing than homeowners, and a greater sense of housing insecurity. Some of these challenges were associated with not having the second income offered through a partner. They described the high cost of finding their own rental property given the fact that they did not have access to the economies of scale that couples do: “it's impossible unless you're earning big dollars to find suitable accommodation for under 50% of your earnings” (Deep Ruby). In response to the high costs, participants reported strategies such as share-housing, seeking social and affordable housing, and living with family. However, they experienced challenges with each of these.
Several had tried share housing. While some enjoyed the company, others found share-housing later in life to be challenging: “Having been ill and only working casual saw me behind in rent and was evicted from unit. Since then rental accommodation in a room only has been challenging in a shared environment with strangers” (Pastel Pink). Two others had obtained places in social or community housing and described the large difference this made to their financial wellbeing and sense of security, and several others described challenges that they had faced in seeking public or affordable housing. One participant described her experience in the following way:
Because I have casual work and don’t rely solely on DSP, I never qualified for Public Housing. That was fine, I stated from the start that I was looking for affordable housing. At
the time there was no affordable housing [in] the area where I needed to be due to my caring responsibilities for aged parents (one was in care and one lived alone). However, when affordable apartments were built in our area, I did not qualify as a) I didn’t earn
enough and b) they were only considering COUPLES who were low income earners!!! That was hard (Dark Tan).
One stakeholder described the limitations of social housing when it came to single women, referring to the strict asset test for social housing and its implications for single women with some income and assets but inadequate means to enter the housing market, forcing them into the private rental market:
To not be eligible for social housing you only need to have $35,000, so it’s not a great deal. So they were living in the private rental market and basically depleting any savings
that they had (Housing Specialist).
In spite of reducing their housing costs, those living with family also experienced a sense of insecurity about the future. For example, Debian Red described this in the following way:
My sister has made it very clear that as soon as my mother dies her house will be put on the market. Given that I am living with her as her carer that means I'm on the streets again. My mother has consistently shared her fear that I will end up as one of those single pensioner ladies living in her car. I've told her that's why I'm trying to find a way to work from home.
That way I can go and live in a country town with cheaper rent and share house with a couple of other single pensioner ladies (Debian Red)!

49
For those in the private rental market, not having children was almost always viewed as a benefit because it offered more flexibility in seeking accommodation, and one noted that she felt being single on a good income was an advantage in the rental market. However, more renters described circumstances in which they felt that landlords had selected couples or families with children over them due to the perception that these groups would have more reliable incomes or would be more likely to want long-term rentals. As one stakeholder said: “yes landlords are not allowed to discriminate but they still choose” (Housing Specialist). Several participants described their experience as follows:
Not having children has given me more flexibility and greater choice when I have had to find places a new place to live. [But] Sometimes landlords are not keen on single people of
any age in their properties as they feel they are less likely to be a reliable long-term tenant. Sometimes the thought process is that if they put a family in, they're going to want
to stay in one spot for as long as they can (Debian Red).
I think some landlords and agents see that I'm on my own, so if I fall sick or become unemployed, there's no-one else in the household to continue paying rent (ie no back up)
(Nyanza).
Owning pets also sometimes created a barrier to finding suitable housing in the private rental market, with several participants reporting challenges with finding landlords or share houses that would allow pets. Their pets were their significant others, who provided them with friendship and companionship, and the challenges of finding a pet-friendly rental property or share house limited their housing options. For example:
At times I spent an entire year going house hunting every single Saturday by taxi and spending $200 - $300 just looking. I have a cat now and in the past had cats but that’s an
issue too as they need a garden to do cat things in. I could never find a share house that would have me and a cat. Not once ever. Often units and apartments don’t allow pets too
so I often had to rent a house to facilitate my pets. I have often been made to pay an extra $20 a week to cover the cost of a pet clean on leaving. My cats even had to have
been mentioned on my references (Deep Ruby).
Being a poorly paid, ill, unemployed single with a pet doesn’t present as great catch in the super competitive rental market. It was the worst feeling ever realising that no matter how
perfect my rental history, that I had a rented rental property of my own I still found it counted for nothing against other better earning singles or couples every single time and
for the first time ever I realised how easy homelessness can occur (Silver Lake Blue).
Those in the private rental market described a deep sense of insecurity about the future. This concern was particularly acute once they left the workforce.
What concerns me most is having access to affordable housing when I am retired. I will never be able to purchase my own home and worry that I won’t be able to continue renting
in the private market in my twilight years. The Government could look into long term housing options for people like me (Pale Silver).
In order to overcome some of the challenges of an unaffordable housing market, three participants described plans to live with other single friends when they retired.
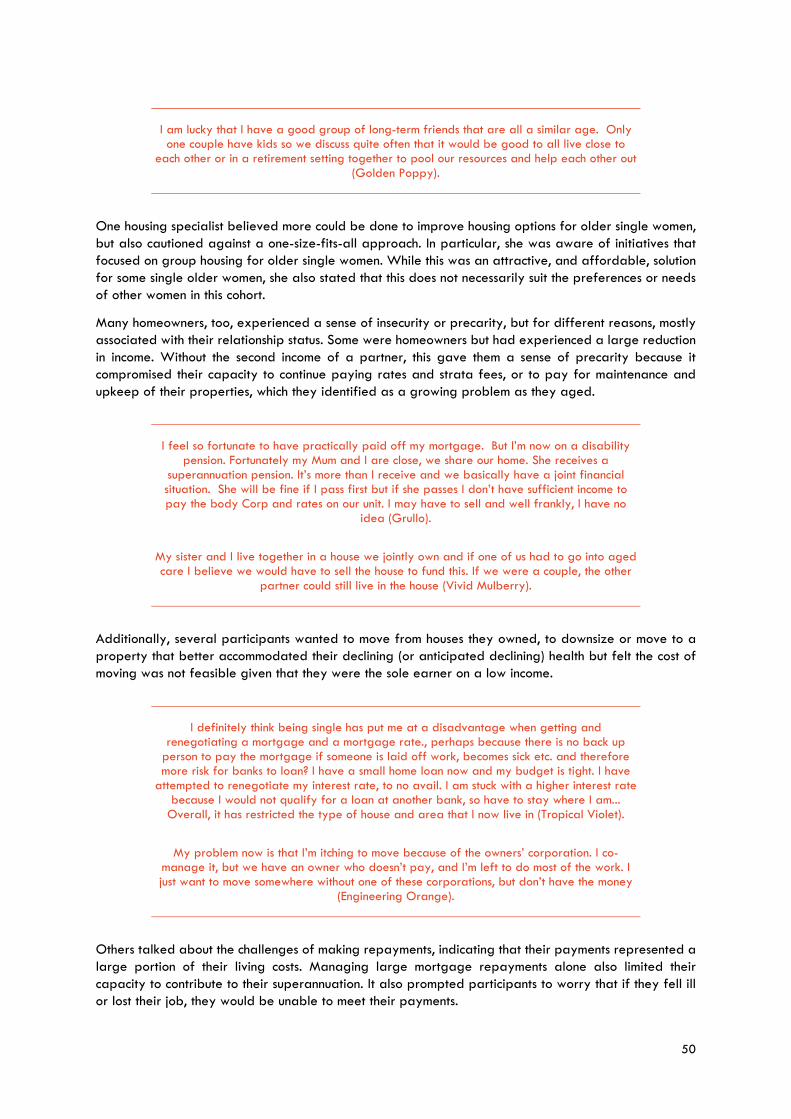
50
I am lucky that I have a good group of long-term friends that are all a similar age. Only one couple have kids so we discuss quite often that it would be good to all live close to
each other or in a retirement setting together to pool our resources and help each other out (Golden Poppy).
One housing specialist believed more could be done to improve housing options for older single women, but also cautioned against a one-size-fits-all approach. In particular, she was aware of initiatives that focused on group housing for older single women. While this was an attractive, and affordable, solution for some single older women, she also stated that this does not necessarily suit the preferences or needs of other women in this cohort.
Many homeowners, too, experienced a sense of insecurity or precarity, but for different reasons, mostly associated with their relationship status. Some were homeowners but had experienced a large reduction in income. Without the second income of a partner, this gave them a sense of precarity because it compromised their capacity to continue paying rates and strata fees, or to pay for maintenance and upkeep of their properties, which they identified as a growing problem as they aged.
I feel so fortunate to have practically paid off my mortgage. But I’m now on a disability pension. Fortunately my Mum and I are close, we share our home. She receives a
superannuation pension. It’s more than I receive and we basically have a joint financial situation. She will be fine if I pass first but if she passes I don’t have sufficient income to pay the body Corp and rates on our unit. I may have to sell and well frankly, I have no
idea (Grullo).
My sister and I live together in a house we jointly own and if one of us had to go into aged care I believe we would have to sell the house to fund this. If we were a couple, the other
partner could still live in the house (Vivid Mulberry).
Additionally, several participants wanted to move from houses they owned, to downsize or move to a property that better accommodated their declining (or anticipated declining) health but felt the cost of moving was not feasible given that they were the sole earner on a low income.
I definitely think being single has put me at a disadvantage when getting and renegotiating a mortgage and a mortgage rate., perhaps because there is no back up
person to pay the mortgage if someone is laid off work, becomes sick etc. and therefore more risk for banks to loan? I have a small home loan now and my budget is tight. I have
attempted to renegotiate my interest rate, to no avail. I am stuck with a higher interest rate because I would not qualify for a loan at another bank, so have to stay where I am...
Overall, it has restricted the type of house and area that I now live in (Tropical Violet).
My problem now is that I’m itching to move because of the owners’ corporation. I co-manage it, but we have an owner who doesn’t pay, and I’m left to do most of the work. I just want to move somewhere without one of these corporations, but don’t have the money
(Engineering Orange).
Others talked about the challenges of making repayments, indicating that their payments represented a large portion of their living costs. Managing large mortgage repayments alone also limited their capacity to contribute to their superannuation. It also prompted participants to worry that if they fell ill or lost their job, they would be unable to meet their payments.

51
On a single income it’s hard to save. Once you’ve paid you’re mortgage and bills, there’s not much left over (Bright Lilac).
I bought a house at that point. 5 years later my health failed me and I left work. Thankfully I did not have a huge mortgage but it was a struggle and very stressful trying to make
payments. I got behind and at one point looked like I might lose the house. Thankfully I was eventually able to access my Super and pay off the balance so that I have the security of
now owning my own home. It is a huge relief (Sandy Tan).
I don’t have any help or support I can call on should I for whatever reason, not be able to sustain housing. That scares me. I’ve always wondered why someone who pays a mortgage
and is unable to work to sustain their payments, is not entitled to rent assistance to keep their home (Tropical Violet).
Homeowners described a number of strategies they drew on to support them with the expenses of mortgage repayments and other costs associated with owning their own homes. About 1 in 5 participants who were homeowners reported renting out a room of their house to a housemate or placing a room on Airbnb. Old Burgundy put it this way: “I really would have preferred not to live with perfect strangers for all of these years in order to pay the mortgage, but it was necessary. I can’t complain too much though, many of the people I have met were lovely (apart from those few dodgy ones …” (Old Burgundy).
Most of the insecurity was concentrated around the importance of a second income in protecting housing security and stability among both renters and some owners. This was both about their capacity on a single income to meet the high expenses associated with housing, particularly if circumstances arise that reduce their income, and about the perceptions of landlords and perceptions or rules of banks about the potential risks of offering a rental property or a loan to a sole income earner. This gave many a sense of having limited housing choices available to them because of their relationship status, even when they had reasonable means.
Hence, when it came to housing, the challenges experienced by older SWWC were closely associated with their relationship status, whereby being on a single income played a strong role in shaping the housing opportunities of many.
5.3 Family care
Caring for others Many older women in the online community provided considerable amounts of care and support to their own families, particularly their ageing parents but at times also other family members with health conditions. As mentioned earlier, about 1 in 4 participants had experienced interruptions to their career due to care responsibilities, and more reported providing care for a family member that did not result in a career interruption.
Those with care responsibilities described the family assumptions and decision-making processes behind the distribution of care in their families. For these participants, it was both their gender and their family circumstances (not having children) that contributed to their assumption of a caring role, or to the ways they carried out their caring role. Many stakeholders also acknowledged that women are more likely to provide unpaid care for other relatives, and this is supported by the research evidence (Hamilton and Thomson, 2017; AHRC, 2013). However, in addition to this, many participants with care responsibilities reported that they had agreed to take on more substantial care responsibilities for their ageing parents

52
than their siblings with children because they did not have the responsibility for caring for their own children.
Some reported that this was because they were more flexible in their commitments. Others talked more explicitly about the way in which their status as ‘unencumbered’ by childcare shaped family expectations or arrangements concerning their role in the care of older family members.
I did find though that because I was single and had part time work it was assumed (by many people, not just my brother) that I would be the main carer. Of course I wanted to- it
was my mum, but my health and energy were not even considered. It was hard, but I wouldn’t have had it any other way (Dark Tan).
I provided live in support to my grandmother. As the only single relative it seemed logical but there was no expectation that I would do this. It had a positive impact as I rented out
my place and lived with her rent free (Jonquil).
One participant whose parents did not yet require care and support was anticipating that she would be the primary carer should care be required in the future, because she did not have children of her own.
My sister has (albeit grown) children, and as the only one without children, imagine this responsibility will fall to me (Electric Lime).
Some participants did feel that caring for their ageing parents affected their ability to work, earn and save. This is consistent with the evidence on carers, which consistently reveals lower levels of labour market participation and incomes among carers (Hamilton and Thomson, 2017). Older women with care responsibilities in this study reported that, to accommodate their care responsibilities they had withdrawn from work temporarily, reduced from full-time to part-time or casual work, taken leave without pay, or used their paid leave: “I also had to use all of my long service, annual leave, sick leave and ADO's so I would still get paid, but this meant that there was nothing left for me if I got sick.” (Maximum Green). For six participants, their care responsibilities and own illness interacted to produce prolonged periods outside of or loosely attached to paid employment.
I stopped working in 2013 for my mental health. 6 months later I became carer to my father, as his health was failing. After his death at the end of 2015, I then took on the role of carer for my mother. As a carer I now have an income that is slightly less than a quarter of I my former pay… I'm currently not capable of returning to a workplace environment but
[a]m investigating options for freelance-style working from home roles that enable me to work in my good periods and also to be readily available to my mother when she needs
help (Debian Red).
It is important to note that there were other participants who were caring for their ageing parents but did not indicate it contributed to a career interruption.
As with findings from the online community, the stakeholders agreed that single women without children could be subject to different structures of obligation and responsibility within families. Most noted that women without children were more likely to be the family caregivers for an ageing parent within an extended family, compared with siblings with children.

53
From what I’ve seen in cases of people who do care for other members of their family, it is often a single female sibling that will be the carer for parents, or that will take it on for
other family members as well, which whilst it might provide them with accommodation while they’re caring for the people, it will often mean that they’re not able to work full-time,
depending on what level of care they’re giving. It might mean they can keep working, but it may mean they can’t take on more responsibilities in their job, and it also can leave them, when their parents pass away, often they won’t get any favourable treatment out of the
division of property (Financial Advisor 2).
I would say that there are quite a few of my clients who were caring quite heavily whether it was for elderly parents. Whether they were the sole child of them or whether they were one of a number of siblings. But if they don’t have children themselves they were, I guess,
allocated the task of, oh well you’ve got capacity for that (Financial Advisor 3).
In another example of the way in which not having children shaped the sibling and extended family dynamics and pressures, one financial advisor gave an example of an older single woman without children who felt pressured to support her brother’s children (nieces and nephews) when he was in financial trouble, as it was viewed that she had more expendable income since she did not have her own children to support.
Because she didn’t have kids, she felt as though she didn’t have a right to – that if she didn’t continually help out her siblings, she was being selfish (Financial Advisor 3).
The key stakeholders also identified the impacts of care responsibilities on employment and financial circumstances. For the most part, caring responsibilities were viewed to have a negative financial impact because they were often accompanied by disruption to employment and earnings in the present, which also affects their capacity to save for later life. Yet, for these stakeholders, the career interruptions and financial impacts associated with care responsibilities for ageing parents and relatives with disabilities were not given the same recognition and support as those career interruptions arising from care of young children.
If you’re talking about women without children, well you might say well they haven’t had to take time out of the workforce. In fact there’s still women who take time out of the workforce, whether it be to care for their elderly parents, whether it be to take for somebody else in the community. […] Well that’s taking time out of the workforce or
working part time so that they can undertake those roles (Housing Specialist).
But all of a sudden you look at someone who doesn't have children but they're caring for their elderly parents, they're also spending time out of work and compromising earnings but they're not necessarily getting compensated for that caring role in any way shape or form
[…] And that, you know that time out of work has an impact on then what you can save and what goes into your superannuation and what you can retire on. I see that as a really big
issue for this particular cohort (Financial Advice Policy Strategist).
This second stakeholder suggested that further consideration needed to be given to the “philosophical and structural issues” associated with the current familialisation of the system. By this she meant that single people, specifically those without children, were often overlooked in the system compared with (nuclear) family units with children. She explained:

54
So I think that's really important for this cohort because our policy settings, a lot of that current policy work comes out of that nuclear family structures... But you start to look at how
that affects the life of someone who's a carer but not a parent (Financial Advice Policy Strategist).
While, in section 5.1, job security was noted as the most important aspect of employment for financial security (especially in relation to access to the housing market), it is important to note that flexible employment was identified by stakeholders as a key factor for older single women with caring responsibilities. Secure and predictable jobs combined with access to flexibility enabled access to employment that women with care responsibilities may otherwise not have.
At the same time as identifying the opportunity costs of providing care and the indirect costs such as reduced employment and therefore earnings, the stakeholders also identified the direct costs of care, such as paying for additional food and travel, or increased housing costs associated with care responsibilities, such as the cost of having a dwelling large enough to accommodate the care recipient, or the cost of moving closer to the care recipient. This all has consequences for older single women’s future financial security.
And you’re taking in someone like your elderly father or whatever, like you’re putting extra food on the table. So it’s the cost of, it can be the cost of looking after the person as well
that can have an impact. As well as the time you're spending not being paid to care (Financial Advice Policy Strategist).
I’ve had women who find the costs quite a bit, it becomes quite expensive to do that, depending on where you are doing the caring. So women who are having to travel 100 kilometers to go and look after a brother who was failing physically, so that can be quite
expensive (Financial Advisor 3).
In fact, it can also impact their property style, the choice of property style that they ultimately end up with. I need to have this, because I need a room for mum, or – yeah, and
that adds a cost burden as well, doesn’t it (Mortgage broker)?
When asked whether there was any advice or support to mitigate the costs of caring, few stakeholders could identify anything tangible. Most stakeholders acknowledged that while care responsibilities often incurred substantial direct or indirect financial costs, it was often emotional or moral obligation that was more central to individual decision-making, rather than financial considerations. One stakeholder believed there needed to be more education and awareness about the significant caring responsibilities that females often assume:
I guess, I think it’s about educating women, and educating everyone about the role of carers, because I do think that it’s still a societal expectation that certain people would be
the carers, and that even if it’s not a single woman, it might be the female sibling that has a family, but they’re the ones that do – there’s generally one person that does the bulk of the
care, and it’s generally a female (Financial Advisor 2).
Hence, for this cohort, while the challenges in employment and earnings were associated with their gender, and the challenges in housing and cost of living were associated with their relationship status, when it came to family care, the additional obligations to provide care derived from both their gender and their lack of children/childcare responsibilities.

55
Health and aged care needs and plans While participants provided considerable amounts of care and support to their own families, particularly their ageing parents but at times other family members with health conditions, the support they received for their own health needs was limited and they were uncertain about whether they would receive any support in their old age from their family networks in the future.
As discussed in section 5.1, approximately a third of the sample reported having chronic health conditions that affected their capacities to work, to earn and to save. This had very large impacts on their financial security throughout their working lives. Participants identified challenges associated with managing a chronic health condition as a single person without children. Some received care and support from parents and siblings during times of ill health, and two reported co-residing with their parents to support their parents but a result was that their co-resident parents could support them with their own health needs where possible. However, for most participants, living alone (or with roommates) during periods of ill health meant that they had limited access to day-to-day care and support with recovery, treatment, transport, and household tasks, and some reported that this prolonged their absence from the labour market. One participant described the need to pay for a cleaner and other domestic help to do tasks she could not do on her own. This was compounded by the lack of a second household income to cushion the costs of illness. Others talked about how having a partner would ease the burden of living alone with an illness:
I don’t think so but I must admit I often wonder what it would be like to have a partner that would step in and research stuff or whatever when things get overwhelming. I self-
supported for over 2 years before I applied for DSP, the paperwork and having to hassle the doctors continually to provide information to Centrelink was so hard when I was not
very well (Grullo).
Most participants were especially concerned about the manner in which they would have their care needs met in the future as they aged and their health deteriorated. Many expressed a strong fear about growing older and not knowing who would be there to support and care for them:
Being single and aging is scary. I look around me and my siblings and friends who have children have a network around them as they get older. Who will be the young people in my life to lift me up and support me? Sure I’ll have friends, but they’ll all be old like me
(Bright Lilac).
Having seen and experienced what was required of my mother and I in order to care for my father with Parkinson's, I can't imagine how anybody would cope not having support. Whilst I have a sister and nieces and nephews etc none of them are the kinds of people who would take me in or take on my care, if that was what I needed. in order to have a
good standard of care available to you, you need to have good financial backing to pay for it (Debian Red).
I’m not likely going to make it to old age but yes I do have concerns about having Care needs met down the track. Hospital was wanting to discharge me a while back and I was terrified because I couldn’t stand upright and knew my 80 year old mum wouldn’t be able
to get me to the loo and such. It was a very confronting time and I felt extremely vulnerable. I’m not sure what’s going to happen if I deteriorate a lot prior to death. I
suspect we may have to pay for extra help (Grullo).

56
This is really confronting question for me because I've no idea how this will go. I just want to stay well and healthy for as long possible so I can live independently, this may be a tad
unrealistic (Old Burgundy).
This concern was exacerbated for those who already had chronic health issues, or those who had watched a close family member’s health deteriorate.
Stakeholders also raised concerns about the way in which the cohort’s care needs were met as they aged. According to one stakeholder, this cohort had different challenges because they “had not obvious people to care for them as they got older, and to deal with all the issues that come with that, as far as evolving into nursing homes and high care” (Wealth Management Advisor). This financial advisor pointed out this is “the Achilles” in the aged care system, which relies heavily on family care to underpin formal care services in the community:
The women that I know that don’t have children worry more about who is going to look after them when they get older. Look, people with children worry about that too, but they
feel like they’ve got a bit of a safety net (Financial Advisor 1).
There is that lingering concern as women get older about who is going to be able to help me from that perspective. But I think on a financial security perspective I would say women without children were more financially secure than those with children at the same age. I guess, there are downsides not having, apart from, you know, who’s going to help me do the shopping if I can’t do it when I get a bit older. Who’s going to help me make financial
decisions or support me in those (Financial Advisor 3).
The participants raised a number of concerns about the manner in which their needs would be met. Most were cognisant of the range of support needs that would be likely to arise as they aged. Those who had provided care and support for their own ageing parents were particularly cognisant of these needs. These included ongoing support with physical care tasks such as mobility, support with maintaining a home, and support with navigating services. They knew that in order to continue living independently in the community as long as possible, as all of them desired, they would need some support with the above activities, and were concerned that without a spouse or children of their own, they would not have any informal or family support with these needs.
They had considered varied approaches to meeting these needs in the absence of immediate family. Some talked about close relationships with nieces and nephews, indicating that they hoped they would provide support as they got older.
I feel as though the answer to having your future elderly care needs met lies in having your finances in order and in advocacy. In short, I’m really nice to my nieces (Old Burgundy).
Some were planning to pay for formal support to enable them to continue living in the community as they aged, while others were not in a financial position to purchase additional support in the home and were concerned that consequently they may have to give up on their desire to continue living independently

57
in the community and move into a residential aged care facility.14 More than half of the sample were concerned that they would not be able to have their care needs met in the way that they would like.
Yes, [getting older] definitely [worries me]. When it comes time to move into aged care, I do not have a house to sell, savings or superannuation to pay for an aged care facility. I will be completely reliant on a government run facility, if they exist. This does worry me, however, there is nothing I can do about it & it is always in the back of my mind (Rose
Taupe)!
If I need full time care, I may not be able to afford what I really need. Or, if I’m living independently but extremely unwell I may not be able to afford care coming in? It is a concern, particularly with my medical & family history (Dark Tan).
I doubt I'll have enough money to have my needs met in the way I'd like them to be, particularly if I'm in poor health (Medium Taupe).
There was also concern among many about who would support them in making decisions about their health care needs when they were no longer cognitively capable of doing so for themselves. While a small number recognised this and had explored or set up Advanced Care Directives and had identified the steps they may need and want to take, most who held concerns about this were unsure of how to address their concerns, and several said they dealt with this by trying not to think about it: “I don't like thinking about the future and don't have any plans as to what I will do (Tropical Violet).
Being able to identify when I need a higher level of care and arrange this, as I don't have children to do this for me (Charm Pink).
Also not having any family/children of my own I'm not sure who will be in charge if I'm not able to do it myself (Maximum Green).
Living alone means that I am unable to accurately judge how mentally competent I am so I will have to rely on how physically I am to judge what level of 'looking after' I require
(Jonquil).
Hence, for this cohort, while the challenges in employment and earnings were associated with their gender, and the challenges in housing and cost of living were associated with their relationship status, the challenges in having their own care needs met were associated with not having children. The challenges in having their own care needs met was in spite of what could be additional obligations to provide care for their own parents, derived from gendered family expectations associated with their not having children/childcare responsibilities.
14 As the online community with older SWWC was conducted in October 2019, it pre-dated the release of the Interim Report of the Royal Commission into Aged Care Quality and Safety and COVID-19, so we were not able to collect data on how these events may have shaped participants’ views and expectations about residential aged care.
58
5.4 Financial capability and financial advice
Financial capability Financial capability has been defined as “a combination of financial knowledge, skills, attitudes and behaviours necessary to make sound financial decisions, based on personal circumstances, to improve financial wellbeing” (ASIC, 2015). It is important in underpinning financial resilience and wellbeing throughout the life course and into old age (Muir et al., 2017; Salignac et al, 2019). In this project, we asked participants about some aspects of financial capability including how they were planning financially for later life, and the activities they engaged in to build their financial security in the future.
There was wide variation in the approaches of the participants to planning for their financial futures. All were cognisant of the value of financial planning, and all expressed a desire or commitment to save for the future, mostly through channels such as day-to-day budgeting so that they could save some of their earnings, purchasing or working towards purchasing their own home, maximising their contributions towards superannuation, and less commonly, other forms of investment.
However, while all valued saving behaviours, access to the financial knowledge and the financial resources to execute these behaviours appropriately was much more varied across the sample. Participants explained their lack of planning in terms of limited knowledge and information, either currently or earlier in their life. This lack of information was particularly acute when it came to superannuation. Many reported that they wished they knew more about how the superannuation system worked so they could make more informed choices. In some cases, this was wishing they had known more earlier in life, while others still did not feel they understood how to best navigate the system to provide the most benefit to them as they approach retirement. Others found navigating superannuation and its interaction with the broader industry of financial products and services overwhelming. As a result, some participants believed there should be more education opportunities about superannuation earlier in life, as well as more government-sponsored information available online for specific demographics such as their cohort of single women without children.
I've found myself in my late fifties with much less super than I would have anticipated. I'm running out of earning years so might not be able to build it up much more. This shapes how
I feel: it is a cause of stress, but also something I can only do so much to address at the moment. I guess these points boil down to my earning capacity, which may or may not
improve as I get older (Engineering Orange).
[I] know I was missing opportunities. The last job I held offered salary sacrifice but I had no idea how that worked and didn’t even take advantage of that. A couple of my super
policies had insurance policies. One was a small income protection and there were also a couple of small death and disablement ones. I started the process to claim on them. So much paperwork, so many hoops, so much expense trying to get extra appointments to get docs to fill out stuff only to have the insurance companies come back asking for more. I simply
gave up. It was too hard (Grullo).
The main challenges I have is where to invest. I set up my own SMSF a couple of years ago and I must say it is a bit harder to manage than I anticipated. Keeping yourself informed, making decisions etc is quite a responsibility. thankfully I have some good support around me i.e. financial planner, friends, accountant and most of all I'm interested in finance and
investments so its' not so much of a chore. I can imagine it would be quite difficult if you had no financial background (Golden Poppy).
Those participants with the most confidence about their financial future were those with more financial knowledge – they had engaged actively from a younger age in the accumulation of superannuation and

59
were more actively managing their superannuation savings, sometimes in consultation with a financial advisor.
However, the reality for many participants is that their lack of financial resources to save (often due to insecure employment, low income, or health issues) meant that more information would not necessarily have given them the tools and resources required to plan for the future. Some explicitly described the way in which being on a sole income - and the consequent challenges entering the housing market and meeting expenses without the benefits of economies of scale – inhibited their opportunities to save in the manner in which they would like. This was a cause of considerable anxiety. Those who relied on income support tended to be more fatalistic about the future, expressing the view that because they did not have much capacity to save, they lacked control over their future finances. For these participants, they hoped they would be healthy as long as possible and that government assistance would be available when they needed it. For some, what they perceived as the dire realities of what this might look like meant they wanted to live in the present. For example, Taupe Grey put it like this:
I have no plans. I will work as long as I can. If I develop dementia or alzheimers etc I presume I will be put in some govt home. It is somewhat out of my control. I live for now
(Taupe Gray).
Notably, participants also linked their capacities and opportunities to save with their physical and mental health. Not only did good health improve their opportunities for participation in paid work and resulting financial resources that could facilitate saving, but good health afforded them the physical and emotional resources for managing their finances and the investments of time and energy that management entailed. One participant put it this way:
Primarily I think at a large portion of how secure I feel is psychological. If I don't have a belief in myself and my ability to handle money, then it doesn't matter how much income or
savings or benefits I may have. Close behind that would follow health. Having a good standard of health and proactively managing whatever conditions I may have means I am more capable of managing my money and having faith that I can address any issues that
arise (Debian Red).
The capacity to save was therefore contingent on a combination of the necessary financial knowledge, financial resources, and physical and emotional resources.
Effects of relationship breakdown Approximately 40 per cent of the participants had been married or partnered previously in their life, while over 60 per cent had never been married or partnered.15 Many participants and stakeholders reflected on the challenges single older women face in relation to the financial and other impacts associated with a relationship breakdown. The challenges to financial wellbeing posed by relationship breakdown for both women and men, such as the costs associated with splitting assets, the costs of separation and divorce proceedings, and of establishing two separate dwellings have been widely documented (Wood et al. 2008; Brown and Li, 2016). In this study, participants identified direct and indirect effects of separation on their financial security. Direct impacts included legal fees and loss of
15 In the HILDA data, only 15 per cent of single women without children reported their marital status as separated or divorced. However, this does not include women who had previously been in a de facto relationship.
60
real estate or shared resources while indirect effects mostly related to impacts on their mental health and, ultimately, inability to participate in employment for a period of time after their separation. For others, separation or divorce has taken place earlier in their life and they viewed it as a neutral, or even positive, event for their longer term financial security.
After my divorce I pretty much started from scratch financially. … If anything I was able to build financial security better as I didn't have the burden of a toxic relationship with me…
(Tangelo).
Speaking specifically about older single women without children, key stakeholders identified relationship breakdown as a contributor to housing instability and insecurity, both in circumstances where the female partner may have lost access to secure housing through the separation, or kept the shared property, but this then had impacts on other aspects of their financial security (e.g. access to the age pension). Some described the close relationship between financial vulnerability and emotional vulnerability:
Whether single women without children get what they should out of that often depends on a power imbalance, or there’s a chance that there could be a power imbalance in
negotiating for those things, and also a sense of whether or not you’re entitled to certain – to a level of assets. Sometimes, it’s emotionally – I’ve heard, you know, several people say
emotionally, I just want it to be over and done with, and so they don’t actually fight for what they should (Financial Advisor 2).
so far we’ve always thought of domestic violence and family relationships as a social issue but it is actually an economic issue as well […] So definitely you know the nexus between
relationship breakdown and healthy relationships and healthy managing of finances is definitely an area that needs a lot more attention (Financial Advice Program Manager 1).
Several stakeholders noted the way in which, in many circumstances, women who become single after a relationship breakdown are unable to access some financial products and services, such as credit. These stakeholders argued that it is important to keep this cash flow available to women not only during the separation period but also post separation:
Then access to low interest loans will probably be another aspect to it. Because a lot of women suddenly single find they are cut off from forms of credit, particularly if they’re
older. They can’t get a credit card anymore (Financial Advisor 3).
Everyone needs to have some sort of access to say an affordable finance. So this group of women are the least likely to have that kind of access. In many cases because of the
gender again. So you know women are less likely to have a credit history. They’re less likely to have applied for finance in their own name (Financial Advice Program Manager
1).
While the stakeholders acknowledged the large variation in outcomes from a relationship breakdown, they identified financial capability as an area of inequality and concern for this cohort. Several suggested that women who had been partnered may have been earning less than their partner and are less likely to have a secure attachment to the labour market post separation. This meant that they found it more difficult to achieve financial security and wellbeing after separation. Several reflected on circumstances in which female clients emerged with low levels of financial literacy from relationships in

61
which their partner managed the finances, and therefore when relationships broke down, they were less likely to have the knowledge and tools to manage their own finances, both throughout the separation and into the future, making them financially vulnerable at a time of great emotional vulnerability.
I think women who have always been single probably end up doing it better than women who are suddenly single. Because, they have more time to get used to it, they’ve had more time to get confidence in their own decision making. They are used to having to provide for themselves and it’s a huge shock for women who are suddenly single (Financial Advisor 3).
I think much like when – well, I’ve had clients who have lost their partners, who took over all the financial decisions. It’s very overwhelming to then step into that role, that you’re making
the decisions on your own (Financial Advisor 1).
Access to good financial (and other) advice during and after a relationship breakdown is critical for supporting this cohort to make informed decisions about their financial circumstances, rights and decisions. Where financial abuse is suspected in a relationship breakdown, financial advisors could adopt protocols similar to those currently being implemented where elder abuse is suspected, for example providing opportunities for the client to speak privately and ensuring that consent is fully informed and freely given.
Family and friends as a financial resource While the participants did not have spouses or children, for most, family was integral to providing financial support and advice. Family was central to their sense of financial security in an emergency in the present and future. Around a quarter described times that they had leant on parents or siblings in times of financial need, for material resources such as temporary accommodation, groceries or even some financial support through a loan or some paid odd jobs, and at other times it was in the form of emotional support when financial challenges arose. Among most participants, while financial or material support from family (mostly parents and siblings) was important at times, it was the knowledge that it was there if they needed it that was most important to their sense of financial security. In the absence of a spouse or adult children, support from parents and siblings provided a notional safety net that could support them in times of emergency or need. This safety net became more important as they grew older and had more medical expenses, or unexpected additional expenses, and siblings became more important as the parents of many passed away.
Friends and family are very important to my sense of security - financial and otherwise. They are back-up in place of having a partner. There is a distinction to be made between being single and being alone. I am single but am not alone as I have a wide network of
family and friends I can call on for help if I need it (Jonquil).
Yes family (particularly my parents) are important but not crucial to my sense of financial security. It's good to know they are there for support if things go pear-shaped. When they
are no longer around, the thought has crossed my mind often, who would I turn to in a major financial crisis. Perhaps my brothers. Possibly friends if I was desperate but would prefer
not to involve them in financial issues (Pistachio).
With the exception of a few, participants generally indicated they would only ask friends for financial support as a last resort. Rather, they viewed friends as important sources of information, for talking through decisions and future plans (including housing, superannuation and health care needs), and as general sources of emotional support: “Friends are very pivotal in my life. I am alone but not lonely.” (Pastel

62
Pink). It should also be noted that not all participants had, or felt it important to have, close relationships with family and friends, and several reported deriving a sense of satisfaction from their independence.
Beyond the material support offered by family and friends, therefore, many participants also identified the importance of financial advice from friends and family as an important financial (and emotional) resource. This could be formal financial advice from family members in the financial services, or the less formal sharing of ideas with family members and friends with different experiences. The key stakeholders also strongly emphasised the importance of family and friends as a source of financial information and guidance, and reflected on the implications of being single and without adult children as they age for the cohort’s access to this important informal resource. According to the stakeholders, family and friends could provide access to informal financial information and support, and in some instances, to financial products and services (e.g. in the case of the pooling of resources). According to several stakeholders, while women who had not partnered sometimes had better control and understanding of their finances because they had always had sole responsibility for them, this benefit could become a challenge as they aged. Many stakeholders described what they perceived to be the social and emotional challenges for older single women associated with managing finances alone.
It’s a space where we're looking at social isolation when we're talking about single women without kids because their network is smaller so those conversations that we have about
money in life where we learn from other people, this is a vulnerable group because they don’t necessarily have those connections (Financial Advice Policy Strategist).
There’s also the decision-making process. You’re the only one, it’s quite a lonely experience and a difficult burden of responsibility that many women find when doing it alone. So I
would say that from a single perspective that would be a big thing (Financial Advisor 3).
Hence, in the stakeholder interviews and in the online community, emphasis was placed on the value of having close kin for financial knowledge, financial resilience and financial decision-making. This is separate to the benefits of pooling income and assets. In contrast, the focus here is on pooling financial capabilities. Some identified the way in which marriage and partnerships in which one member takes full control of the finances can leave the other member lacking in financial capability and vulnerable both inside the relationship and if the relationship broke down. Most, however, spoke of the value of pooling financial capabilities within nuclear families and kin networks. This included both the value of sharing financial knowledge, and the benefits of shared or supported financial decision-making. Older single women without children, without partners or adult children to pool financial capabilities and support them with financial decisions as they age, can experience a shortage of this kind of essential financial resource, exposing them to vulnerability as they age. While some may find these resources in their own parents or siblings, some do not have access to any such resources. It is among this group that the need for trusted, affordable financial advice can be particularly important.
Financial advice Participants and stakeholders noted that financial advice had the potential to mitigate some of the challenges this cohort of women face as they approach later life, in financial security generally and in specific areas such as housing, relationship breakdown, and superannuation. The strongest themes emerging were the importance of supporting women to engage early in life with their financial circumstances in order to achieve financial security in later life, and the importance of providing financial advice that is tailored to the circumstances of the cohort.
More than half of the older women reported that they wished that they had started to focus more closely on contributing to superannuation earlier in their working lives and emphasised the need for more accessible advice available to women of younger ages. Given that compulsory superannuation was only

63
introduced in 1992, the lack of readily available advice on superannuation when they were young was a common experience among this cohort, and the volume of publicly available advice has increased considerably since that time. Stakeholders also emphasised the value of advice to ‘start early’ when it came to contributing to and engaging with superannuation and finances more broadly.
Women’s financial education and empowerment needs to start early with healthy financial relationships, what they are, what they aren’t, and to debunk some of the myths early
(Financial Advice Program Manager 2).
So just as we manage our health, that's how we need to manage our finances, if that makes sense. Constantly checking it rather than just going oh wow I'm 55 I really better have my
retirement plan in place now. I think that's the kind of, and that's the collision point of all the policy, all the settings and all the issues and the role of building financial capability is
getting people engaged (Financial Advice Policy Strategist).
However, ‘starting early’ requires access to resources, such as an adequate income or secure employment, access to financial products and services, and access to affordable financial advice. One stakeholder described the ingredients for financial security in later life in the following way:
they have access to products and services, they have a decent amount of capability. They have you know the economic resources that they need which is what is making them secure
and they have the networks in place so that they have the social capital and know where to go for help (Financial Advice Program Manager 1).
In spite of being broadly in agreement on its value or potential value (with the exception of a small number of older women), the older women and stakeholders identified some barriers to engaging with financial advice services and the need to find creative or tailored ways to engage with this cohort. More specific barriers to engagement focused on four issues: gender norms and stereotypes about women and financial literacy, digitisation of financial advice services, trust, and affordability. The older women and stakeholders described each of these barriers and how to overcome them to better meet the financial advice needs of older single women without children.
Gender norms and stereotypes
All stakeholders identified the need for financial advice that is more accessible to older women and responsive to different modes of engagement. One stakeholder, for example, noted that it is essential that this cohort (and all individuals) have “permission to ask questions” when it comes to their own finances and the financial services available to them (Financial Advisor 3). However, according to most of the stakeholders, at least in some parts of the financial services sector, services were not set up in a way that older women felt comfortable approaching them. According to one stakeholder, services need to be provided in such a way that they provide a ‘safe’ context for women to talk about money:
But the number one thing is being able to talk about money and to understand that all the gendered myths and judgements that prevent women, that silence women talking about money and then feeling that they can actually have the right to have money, and it’s not because there’s something wrong with them, they’re not a real woman, because they’re
interested in money, but also that the idea that it’s part of everyday life (Financial Advice Program Manager 2).

64
Others described gender stereotypes in the financial services sector that formed systemic barriers to women’s engagement with the sector. One stakeholder explained that there was a gendered assumption among some practitioners that women are less competent with finances, and that this assumption affects both the advice women receive and their trust in financial services. For example,
there’s a lot of shame and judgement and a lack of respect provided to women when it comes to financial services. So I’ll give you an example of a lady […] She went to a
mortgage broker for a loan and the mortgage broker, a male, spoke down to her, to the extent that she felt really humiliated. She didn’t understand the basic principles of how the loans worked. Not because she was stupid, not illiterate, but because this was not her area of specialty. So even with someone who has the capacity and the background to be able to understand it, women disproportionately get a really shitty customer service when it comes
to those things (Financial Advisor 3).
At the same time, stakeholders commented that financial advice does not always cater to women’s modes of engagement. This can be mistaken for women being less knowledgeable or competent about their finances, but often reflects the need for different approaches to working with female clients:
I’m looking at it from the giving the advice perspective, but I think that the way the financial services industry of Australia communicate […] it’s a male-dominated communication style
[…] I think that if you don’t feel like, as a woman, or as any person, that someone is communicating with you in a way that you understand, and recognises that they understand you, then it’s very hard to build trust and rapport with that person, and it’s also very hard
to educate, or to be educated by that person, as well. So, I think that as a woman, that can be a barrier to seeking advice, and enhancing their financial situation (Financial Advisor 1).
One stakeholder described a program they had developed, focused on women, that aimed to be tailored to their patterns of engagement with support:
So, one of the things that we really like to do at [organisation], you know, we’ve really studied closely how women like to talk about money and learn about money, they like it in small groups, small intimate informal groups where they can share tips […] As long as there is a safe space and that’s where the skill comes in and in order to create a safe, a space to
talk about money (Financial Advice Program Manager 2).
While modes of engagement are likely to be diverse across different groups of women, an emphasis on tailoring services to different groups was deemed valuable by the stakeholders.
Digitisation of financial services
Several participants and stakeholders discussed a lack of digital literacy in this cohort as a barrier to accessing advice. There is diversity in the digital literacy of older SWWC. Some have high digital literacy and value digital forms of advice. For example, one participant made suggestions about how the Moneysmart platform offered by ASIC could improve the way it provides services through a chat function: “I love the Money Smart website but it would be so much better if you could have an online blog spot or discussion group offering free advice about all manner of things financial. That's just not available anywhere now” (Deep Ruby). However, research also suggests that older women have lower levels of digital literacy than older men, younger women and younger men (Tirado-Morueta et al., 2018). Digital forms of financial advice, therefore, are not likely to be accessible by all older women. As financial products and

65
services, including opportunities for affordable financial advice, are increasingly delivered digitally, some older women (who) may not have access to financial benefits and support:
And a lot of this information is going digital. So again, you know, my experience would be that the groups which are less likely to have digital literacy or access to digital resources or
the ability to know where to go online to acquire these, I would say that single, older women would definitely fall in that bracket and if they don’t have children, I would say that
again that would be a triple threat (Financial Advice Program Manager 1).
According to this stakeholder, not only had this cohort in the demographic lower digital literacy (older women) but they were further disadvantaged because they did not have children (or partners) who are more likely to have better digital literacy skills. The digitisation of the most basic financial services, such as completing a tax return, was identified as a barrier among several of the participants. One put it like this:
… I like to maintain my knowledge by doing my own tax return. The most difficult aspect of this is their technology push as I don't have a computer and it’s very hard with all
government departments to do things if you are not online. I think this is one of the major discriminations at the moment (Vivid Mulberry).
A lack of digital literacy was also identified as a potential source of financial vulnerability. In particular, some stakeholders identified vulnerability to potential financial abuse, either from previous partners or in circumstances where they received care from others in their families:
I’ve done some work on elder financial abuse, and I think they are a particularly vulnerable group for elder financial abuse. That might mean, you know, having someone sort of have undue influence on them about making a power of attorney, or you know, people helping
them, but you know, they end up actually financially abusing them. If you’re alone, if you’re single and alone, and you need help and someone is offering to help, you’ll probably take it, and we’re certainly seeing cases of financial abuse happening there (Financial Advisor
2).
Trust
Both the older women and the stakeholders reported that a lack of trust in the financial advice industry was a barrier to access by older single women. This lack of trust could lead older women to avoid seeking advice. This theme emerged in the online community, in which older women reported that they had not accessed financial advice services, or had accessed them in the past and decided not to access them again, because in their view financial advisors had vested interests and were not committed to helping their clients. Several reported wanting independent advice. A few kept trying until they found someone they trusted:
Over the last 20 years approx I have used 3 different financial advisors. The first just put me into managed funds to obtain the highest payoff for themselves. The second was a stockbroker who just wanted to make money out of trades. I have now found one in my
accounting firm that I pay each year for their advice, they receive no kickbacks from funds, stockbrokers etc and have found them to be much better (Golden Poppy).

66
This theme also emerged strongly from the interviews with the stakeholders. Where older single women were able to find a source of financial advice that they trusted, the outcomes were very positive:
I think the barrier that I see, that stops them putting themselves in those positions themselves, is a fear of trust, of getting screwed over, because I am a single, vulnerable woman or
whatever. They’re a little bit gun shy on forming those relationships themselves, unless it’s family, or unless they’ve been referred to someone […] The solution for that, really, is to try
and find someone that they can trust, and with integrity, like I said before, that will make them feel at ease with that fact, rather than uneasy, and give them the confidence to let them take the lead, and advice on what to do, and follow that advice and off they go
(Wealth Management Advisor).
So it is difficult to find someone you trust because there’s so much – you know, all of the banking commission and all of the inquiries have always shown that there’s potentially a
conflict of interest when you speak to an adviser who is being remunerated to sell particular products (Financial Advice Program Manager 1).
The stakeholders reported that, because of a lack of trust in formal services, many older single women turned to informal sources of financial advice. This ‘trusted’ advice came from family or friends with the capacity to talk through financial decisions. Sometimes this financial advice played an important role in supporting the cohort with their financial security. Others, however, noted that it was important for this group to rely on the ‘right’ sources of informal advice, or to supplement informal advice with formal advice.
[We need] to encourage women to get appropriate advice early on. You know, I think it’s really important to not just listen to whoever, you know – your father, or your brother, or
your best friend’s husband, or someone else that might think they know best for you, but to get independent advice early on, and to plan early on (Financial Advisor 2).
This is an important finding, and one that some stakeholders reported trying to address through innovative solutions, specifically trying to support this cohort of women through services they already access and trust.
So if you can find ways that provide the information at the point that the person needs to make the financial decision, that in a nutshell, is the best way to make that information
available to them. If so, where are single, older women likely to go? What are the financial decisions they normally make? Those are the providers you need to go to. So you know the
older single women are not you know walking on the streets looking for someone to give them a loan […] So it is at that point of decision which we call ‘just in time’ where they’re making that decision. That’s when they’re most likely to look for information. (Financial
Advice Program Manager 1).
For example, this stakeholder suggested that options for post-separation financial advice could be made available through other services that women may be accessing at this time, such as relationship counselling or family mediation, to ensure that they do not miss out on opportunities to access important financial advice. Many other stakeholders described the importance of making fit-for-purpose financial advice available during life’s contingencies or during important financial transitions.

67
I think what we’re learning to apply in that financial decision making lens, about being really human centred in the approach to designing our work in this space, is that we’re
starting to identify things like, channels that could be better utilized (Financial Advice Policy Strategist).
For those without family and friends who (presumably) offer free advice and support, there was concern among some stakeholders that sometimes professional advice is not affordable or accessible to this cohort. This area was identified as an area in need of policy attention.
Affordability
Some of the older women and all of the stakeholders identified affordability as a major barrier to the use of financial advice for this cohort. While some older women reported not using financial advice services because they were too expensive, stakeholders described in much more detail the limitations in the affordability of financial advice. In part, this concerned a tension between affordability and personalisation of services. Many of the publicly available and free sources of financial information and advice were generic in nature and not adequately tailored to the specific needs of the cohort. However, as services became more personalised, they became more expensive. The most useful financial advice, and the advice that meets the specific needs of this (or any other) cohort is therefore often the most expensive and, as a result, precludes some of those most in need from using it. As one stakeholder commented: “people are realising that the people who actually need the advice most are the ones who are least able to afford it” (Financial Resilience). To overcome this barrier, several stakeholders advocated for government-funded access to financial advice, additional free resources with specific advice to particular cohorts, tax incentives for women to use financial advisors, or incentives for providers to offer affordable services to women. For example:
Look, I think all Australians deserve financial advice, but the way that it’s structured at the moment is too expensive to give it to all Australians, so only a small portion of the
population actually can access it (Dixon).
There’s always a barrier around that. But if there was some sort of tax deductibility for it, so that you know, they could claim it on their tax return, it makes it a lot cheaper and
easier, we would see a lot more proactive seeking of advice, if there was some financial incentive to do so (MGD).
Yeah, I think there definitely should be something that encourages or provides access to affordable advice for women (SEIVA).
5.5 Summary In the labour market, while gender can be a disadvantage because women receive on average lower earnings than men (and consequently, have lower superannuation savings), not having children can be an advantage. This advantage is both overt and latent. Women without children do not have the career interruptions associated with having children that women with children do. This provides greater opportunities to work full-time uninterrupted by career breaks and participate in work-based training and networking, which may facilitate more opportunities for career progression, and this is all likely to lead to higher earnings and savings. Notably, though, involuntary career breaks for reasons other than having children – e.g. ill health, redundancy, or other care responsibilities – were common among our

68
qualitative sample. At the more subterranean level, while Australia has laws to prevent discrimination on the basis of family responsibilities, the women without children described times when they thought that not having children had worked in their favour when it came to employer decisions about how they distributed employment opportunities. This, however, could be a double-edged sword. SWWC reported times in which they felt employers placed greater pressures on them than they did on parents to work longer or less social hours and to be flexible and accommodating about when to take their leave. While gender provided potential constraints and not having children provided opportunities for employment, earning and saving, as the women became older, they described new constraints on their opportunities associated with their age.
In housing, gender was not a factor except insofar as women on average have lower incomes and savings than men and housing is a major expense. Not having children was not a factor except among some in the private rental market. Some renters believed that not having children could be an advantage because of the perception among landlords that they may be more careful with the property than families with children, whereas other renters believed that not having children could be a disadvantage because children were a sign of a more long-term committed tenant. While not having children is associated with higher levels of employment participation and therefore higher individual incomes, relationship status was identified as the most important factor in limiting housing opportunities. This was largely because household income becomes important in housing opportunities, and being a member of a couple provides several benefits: in most cases, a second income (and if not a second income the potential for a second income) which opens up many more opportunities in the housing market; and the opportunity to pool costs of living and benefit from economies of scale, increasing the disposable income that can be used to cover housing costs or to save. Being on a single income could be a considerable barrier to obtaining a home loan. It could also be a barrier to obtaining a rental property, because the income of a single earner is often lower than in a dual-earner household and could be perceived by landlords as less secure without the safety net of a second income. People without children are also less likely to be placed in a priority category for social or subsidised housing. While homeowners clearly felt more financially secure than renters, both homeowners and renters experienced high levels of housing precarity associated with the fact that they were on one income, which created challenges meeting high costs of housing and created anxiety about what would happen if their income dropped and there was no second income to cushion the impact. Again, housing opportunities narrow further as they age, with both remortgaging and seeking new rentals becoming more difficult as they get older, particularly towards the end of their working lives.
In families, a significant proportion of the participants provided care for a family member – mostly ageing parents. This had a considerable impact on their labour market participation and earnings. According to participants, their gender and their not having had children shaped their families’ expectations about their role in care of ageing parents. Gendered assumptions about appropriate providers of care meant that they as women were more likely than their brothers or brothers-in-law to assume these responsibilities, and this was overlaid with the perception in some families that this cohort was more flexible and freer with their time because they did not have care responsibilities for young children. The HILDA data supported this finding, suggesting that older SWWC were more likely than any other group to take on care responsibilities for ageing parents and family members with a disability or illness. This suggests that the idea that not having children results in a career ‘uninterrupted by care’ is a misnomer. While around a third of the participants provided care for ageing parents and others, they were limited in the extent to which they had their own care needs met, and in how they expected to have their care needs met in future. As they did not have spouses or children, they were particularly concerned about how their care needs would be met as they aged. Many were concerned that this lack of informal support may preclude them from ageing in the community as they hoped, and that they would have no choice but to move into a residential aged care facility.
The online community and stakeholder interviews identified a number of limitations on financial capabilities and resources of older single women without children, such as a lack of knowledge and information about superannuation, financial challenges after a relationship breakdown, smaller kinship

69
networks that offer fewer opportunities to pool financial capabilities, and limitations associated with being a sole earner household. These limitations suggest that older single women without children would benefit from financial advice; indeed, most women identify the value in good financial advice. However, the research suggests some important barriers to accessing financial advice among this cohort. These include lack of trust; lack of tailored services; inaccessible forms of services (i.e. digital, which are only accessible for some); unaffordability of services; and gender stereotypes imbued in some services, which can be off-putting for women.

70
6. Conclusions and recommendations Employment, earnings and superannuation The HILDA data suggests that single women without children have higher personal incomes than partnered and single women with children. They have lower personal incomes than partnered women without children and partnered men with and without children. However, single women without children have lower equivalised household incomes, personal superannuation wealth, and household net wealth than partnered women and men with and without children. Single women with children have even lower income and wealth across these three measures. There is no statistically significant difference in the incomes and wealth of single women without children and single men without children. Ostensibly then, gender is only significantly associated with income and wealth in couple households with or without children. However, when you control for education, gender differences emerge: single women without children have lower incomes and wealth than single men without children.
The qualitative phases shed more light on possible reasons for this. Gender was broadly conceived as limiting earnings due to the gender pay gap. However, almost all participants reported that their relationship and family status (i.e. being single without children) exerted a stronger impact on their employment opportunities. For the most part, older women and stakeholders believed that being single and in particular, not having children, increased employment opportunities and earnings. Most older women suggested that being single and not having children meant that they were in a position to be more flexible in their career decisions and daily work patterns, and that this was often viewed by employers as a positive attribute. Some women reported that while employer attitudes and expectations worked in their favour in hiring practices and opportunities in the workplace, the perception that they were an ‘unencumbered worker’ could also lead to additional pressures by employers on their personal and non-work time. Opportunities for employment also became more limited and less secure as they aged.
While the older women felt that it was a combination of their single status and not having children that opened opportunities (i.e. because being single gave them more flexibility), the HILDA data suggests that while not having children was an advantage when it came to incomes and wealth, being single was not associated with higher earnings. In fact, partnered women without children tended to have higher personal (as well as household) income and wealth than single women without children. According to the older women, while they did not have the career interruptions associated with caring for children, when they did have an involuntary career interruption, the impacts were hard as there was no second income to cushion the financial shock.
According to the analysis of HILDA, having a spouse/partner is also a protective factor when it comes to financial hardship associated with costs of living. Partnered people with and without children are less likely than single people with or without children to be unable to pay a utility bill on time, and single women without children were more likely than partnered people with or without children to ask for financial help from friends or family. Both older women and stakeholders described the extra security afforded by a second income to manage unexpected fluctuations in cost of living or to continue to meet costs of living during or after major life events or financial shocks. In short, in earnings and wealth, while not having children was certainly associated with better outcomes, among those without children, being single and being a woman were associated with poorer outcomes than being partnered and male, and these outcomes worsened as they aged.

71
Policy recommendation: Education and training opportunities should be developed to support employment prospects for single women in later life. This is especially important for women who may have lost their job, taken career breaks for ill health or caring responsibilities, or experienced relationship breakdown that affected their career trajectory.
Housing The HILDA data suggests that being single is associated with lower home ownership. Single women without children have lower levels of home ownership than partnered people with and without children. Single women with children have even lower home ownership rates than single women without children. Having children was associated with higher home ownership rates among couples, and lower home ownership rates among singles, suggesting that partnership status is a more important factor shaping home ownership than whether or not a person has children.
The qualitative phase shed more light on this. Not having children results in a higher earning potential than those with children, and a higher income opens more housing opportunities. However, according to older women and stakeholders, it was relationship status that was identified as the most important factor in shaping housing opportunities because a second income (and if not a second income the potential for a second income) opens both more opportunities in the housing market, and the opportunity to pool costs of living and benefit from economies of scale, increasing the disposable income that can be used to cover housing costs or to save. According to older women and stakeholders, being on a single income could be a considerable barrier to obtaining a home loan. It could also be a barrier to obtaining a rental property, because the income of a single earner is often lower than in a dual-earner household and could be perceived by landlords as less secure without the safety net of a second income. While homeowners clearly felt more financially secure than renters, both homeowners and renters experienced high levels of housing precarity associated with the fact that they were on one income. Hence, being on a single income played a strong role in shaping the housing opportunities of many. In short, in housing, being single was associated with poorer outcomes, and these worsened as they aged.
Policy recommendation: Housing options should be developed to meet the needs of older women (i.e. affordable housing, social housing, and co-housing) and more funding should be directed to organisations that provide housing advice and services to older women.
Policy recommendation: Commonwealth Rent Assistance should be reviewed, with the rates increased, and support should be made available to assist homeowners who are at risk of falling behind on their mortgage. This should include opportunities to refinance loans.
Family care According to HILDA, SWWC aged 55-64 are much more likely than any of the other cohorts to be spending time caring for older relatives or relatives with a disability or chronic illness. The qualitative work shed further light on the factors contributing to these numbers. Those with care responsibilities reported that their gender and not having children combined to shape expectations in their families about their role in the care of ageing parents. This was a combination of gendered assumptions about care as women’s work, and the perception that not having children meant that they were more flexible and freer with their time. As a consequence, they described taking on these care responsibilities, often with considerable impacts on their employment and earnings. They also reported being limited in the extent to which they had their own care needs met when they experienced disability or illness, and in how they expected to have their care needs met in future. As they did not have spouses or children, many were very anxious about how their care needs would be met as they aged. Many were concerned that this lack of informal support may preclude them from ageing in the community as they hoped, and that they would have no choice but to move into a residential aged care facility.

72
Hence, for this cohort, when it came to family care, the additional obligations to provide care derived from both their gender and their lack of children/childcare responsibilities. However, not having children also meant that they were concerned about having their own care needs met in future.
Policy recommendation: Better support and information on available funding options (e.g. NDIS, Respite, In-Home Aged Care Services) must be made available to carers of older relatives or relatives with a disability or chronic illness, and new funding options considered (e.g. carer credits to superannuation accounts) to mitigate the impacts of family care on employment, incomes, retirement incomes, and wellbeing.
Policy recommendation: Advocates should be in place within the aged care system to provide support for older people who do not have informal support networks. Various forms of providing free advocacy and support are currently being trialed on a national scale through the Aged Care Navigator Trials, and these are likely to be a highly useful resource for older SWWC.
Policy recommendation: Government policy should recognise co-dependency in the aged care means test if one member of a household moves into a residential aged care facility and the other resident is not a spouse or child.
Intersectional inequality Opportunities for financial security and wellbeing among older SWWC emerge from the intersection of four axes of inequality: being female, being single, not having children, and being mature aged. These axes intersect in different ways in the domains of employment, income and wealth, housing and family. Overall, gender is associated with poorer outcomes across all three domains, as lower earnings resulting from the gender pay gap result in lower superannuation and wealth, and lower earnings result in more restricted housing opportunities. Gender is also associated with higher levels of care provision for older relatives and relatives with a disability or chronic illness. Being single is also associated with poorer outcomes when it comes to household income and wealth, and housing stress. Not having children is associated with better incomes than those of single and partnered mothers, though this does not translate into higher home ownership than partnered mothers because they are pooling income with a partner. As SWWC age, the disadvantage experienced by single women in incomes and housing deepens, and this is exacerbated by the absence of children as they begin to develop care needs of their own. Hence, while it would be tempting to assume older single women without children are a relatively advantaged group – free of the high expense of bearing and rearing children for incomes and retirement incomes and the career interruptions this entails – this conceals the challenges at the intersections of gender, relationship status, not having children, and age experienced by many in this cohort as they navigate employment, housing, and their ageing futures.
Single and precarious Across the domains, being single is associated with poorer outcomes and greater precarity. This is most obvious in housing, whereby single women have lower levels of home ownership than partnered women, and single renters face among the highest levels of housing stress (Power 2020). Both homeowners and renters experienced high levels of housing precarity associated with the fact that they were on one income, which created challenges meeting high costs of housing and created anxiety about what would happen if their income dropped and there was no second income to cushion the impact. The same precarity could be seen in employment and earnings. SWWC have lower equivalised household incomes, personal superannuation wealth, and household net wealth than partnered women and men with and without children. While they do not experience interruptions to their career associated with children, when they do experience career interruptions beyond their control, particularly those associated with mental and physical ill health, they do not have the security of a second income to cushion some of the

73
effects of an involuntary career interruption on income and wealth. Consequently, the effects of a relatively small financial shock can be catastrophic. While not having children can result in better outcomes for single women in the areas of employment and housing, when it comes to care on old age, not having children deepens the precarity experienced by single women as they navigate formal care and support systems alone.
The ‘unencumbered worker’ and the ‘unencumbered carer’ Older single women without children can observe benefits for their employment and housing associated with not having children. However, it is the very absence of children that can see them treated differently in workplaces and families. In workplaces, the view that they are ‘unencumbered’ by childcare responsibilities means that employers sometimes expect more of them at work than parents with children. Older women reported that this could lead to additional pressures by employers on their personal and non-work time, such as being asked to stay back late to finish work when other employees had to leave to pick up children from school, or being told they could not take annual leave over certain holiday periods because parents had priority in taking leave during school holidays. At the same time, in families, the view that they are ‘unencumbered’ by childcare responsibilities means that families sometimes expect more involvement from them in the care of ageing parents compared with siblings who have childcare responsibilities. Some older single women without children are therefore being squeezed from both angles, as both employers and families view them as more flexible and freer with their time. Consequently, while some employers view single women without children as unencumbered by childcare, they are the most likely cohort to have other care responsibilities, such as those for ageing parents. This can set up circumstances in which older single women without children face excessive pressure that affects their work-life balance as well as their health and wellbeing.
Policy recommendation: Antidiscrimination legislation should be amended to make clear that discrimination on the basis of having family responsibilities or not having family responsibilities is unlawful. Better education for employers should include information about discrimination on the basis of not having family responsibilities, as well as on the basis of gender and age.
Older single women without children and COVID-19 The data used in this project, with the exception of a portion of the financial stakeholder interviews, was collected prior to COVID-19. As a result, the data does not shed light on the impacts of COVID-19 on this cohort of women. However, early analysis on the impacts of COVID-19 suggests that many of the challenges experienced by older SWWC are likely to be exacerbated by COVID-19. For example, women are more likely than men to have lost their jobs or to have had their work hours reduced (Grudnoff, 2020). Single women who have lost their jobs during the pandemic do not have the safety net of a second income to cushion the financial impacts, and the effects are therefore likely to be greater.
The Federal Government has introduced the Early Release Super Scheme that allows Australians to withdraw up to $10,000 from their superannuation accounts in the financial years 2019-20 and 2020-21. The data on who is using this scheme is limited, but early data from some superannuation funds suggests that while more men are using the scheme than women, women who are using it are withdrawing a higher proportion of their savings (HESTA, 2020). Younger women will be particularly adversely affected as they lose the benefit of accrued growth over the period to retirement; however, the effect will not be felt until they reach retirement age. Older people using the scheme are doing so at a time in their working lives when it will be more difficult to replace the withdrawn superannuation by the time they exit the labour market permanently, reducing the buffer available to pay off debt or obtain secure accommodation There is no publicly available data on the scheme’s usage by relationship status, but this will be important to examine into the future.

74
Older single women are also highly vulnerable to housing stress. A combination of extra income support payments, a ban on evictions and opportunities for ‘holidays’ from mortgage repayments have limited the impacts of COVID-19-generated financial shocks on housing. However, over the coming months, all three of these measures will be substantially wound back and this is likely to see widespread housing stress and insecurity as renters in arrears are evicted and homeowners in financial hardship are forced to begin repayments again, facing the possibility of defaulting on their loans. Older SWWC homeowners, already precarious as being partnered is an important protective factor against housing stress, are likely to be affected by these major changes and disruptions to the supports that have been propping up the housing market since the beginning of the pandemic.
People living alone are also more likely to be experiencing loneliness and its negative effects on health and wellbeing (Lim et al., 2020). Finally, our research suggests that older SWWC are more likely than other groups to be providing care for an ageing parent or family member with a disability. Emerging research suggests that carers are experiencing greater pressures associated with their care responsibilities, such as greater health vulnerabilities and care needs among their cared for relatives, and greater barriers in accessing services such as aged care services in the community and respite care.
The role of financial services The online community and stakeholder interviews identified a number of limitations on financial capabilities and resources of older single women without children, such as a lack of knowledge and information about superannuation, financial challenges after a relationship breakdown, smaller kinship networks that offer fewer opportunities to pool financial capabilities, and limitations associated with being a sole earner household. These limitations suggest that many older single women without children would benefit from financial advice; indeed, most women identify the value in good financial advice. However, this research suggests some important barriers to accessing financial advice among this cohort. These include lack of trust, lack of tailored services, inaccessible forms of services (i.e. digital, which only work for some), unaffordability of services, and gender norms imbued in some services, which can be off-putting for women.
Policy recommendation: The ASIC Financial Capability unit should develop programs that provide advice at particular trigger points including separation or divorce, pre-retirement and at retirement; and this should be backed up by access to more affordable formal financial advice where needed.
Recommendations for accountants and financial advisors Based on the findings above, we propose the following recommendations for the financial services sector:
Financial advice for women needs to be targeted and delivered in a way that recognises different communication styles and approaches to decision making. For example, some women respond to one-to-one support or coaching whereas others prefer participating in a support network where they can share experiences.
Education and training programs should be developed within the industry to improve understanding of gender inequality, challenge gender stereotypes and make financial service providers more aware of personal biases.
Financial advisors should work with other organisations providing services to older women to develop a warm referral network.
Services should be delivered through multiple access points and formats, including digital but also hard copy and face-to-face. The formal documentation required in financial advice should be translatable to a user-friendly, accessible format.
Access to financial services for lower income, and low net wealth women should be improved and affordable.

75
Financial advisers should be educated to recognise and understand who may be vulnerable to financial abuse, and implement protocols similar to those applied where elder abuse is suspected, for example providing opportunities for the client to speak privately and ensuring that consent is fully informed and freely given.
This cohort would benefit from tailored financial advice during the following life stages or events:
early in their career – more education about superannuation during and after separation and divorce—advice needs to be sensitive to financial and emotional
vulnerabilities, including advice about accessing or maintaining lines of credit during a relationship breakdown. Financial advisers should recognise that financial abuse may be a feature of a domestic relationship breakdown.
buying, financing and maintaining a home on a single income; including refinancing when circumstances change
during housing transitions in later life, i.e. downsizing, remortgaging, transitioning into retirement facilities
managing care responsibilities, e.g. access to resources, including assistance available through in-home Aged Care (i.e. the Commonwealth Home Support Program and Home Care Packages), the Carer Gateway and respite services, and the NDIS - both as a carer and as a user of care services
managing transitions into residential aged care, including ensuring that appropriate financial arrangements are in place to protect against financial abuse.
In conclusion, currently policies on taxation, the age pension, superannuation, and housing do not discriminate between men and women, but they also do not address the underlying inequalities that lead to poorer income and superannuation outcomes for women. Being childless does not exacerbate these issues (in fact it has benefits) but being single places women at a greater risk of economic insecurity in later life, especially those women who have never owned a home or lost a home through divorce. For these women, the safety net is currently not meeting their needs, leaving a cohort of older single women facing homelessness and poverty, children or no children. When the need for care arises, the absence of informal care networks – especially children – means that SWWC have limited access to informal care. In an aged care system in which living in the community relies heavily on care and support from informal networks, many older women are concerned that they will have few options but to enter residential care. Single women without children need well-designed policy and access to financial information and advice that takes into account the specific issues that they face. The above recommendations suggest policy changes and changes to financial services that would make a start at mitigating some of the insecurities faced by this cohort of women.

76
References Aged Care Quality and Safety Commission 2019, Charter of Aged Care Rights, Australian
Government Department of Health, viewed 29 April 2020. <https://www.agedcarequality.gov.au/sites/default/files/media/Charter%20of%20Aged%20Care%20Rights%20-%20Template%20for%20Signing.pdf>
Aged Care Quality and Safety Commission 2019a, Guidance and Resources for Providers to support the Aged Care Quality Standards, Australian Government Department of Health, viewed 29 April 2020. <https://www.agedcarequality.gov.au/sites/default/files/media/Guidance_%26_Resource_V8.pdf>
Anglicare Australia 2020, Rental Affordability Snapshot: National Report, Anglicare Australia, viewed 03 August 2020. <https://www.anglicare.asn.au/docs/default-source/default-document-library/rental-affordability-snapshot-2020.pdf?sfvrsn=4>
Asher, A. & De Ravin, J. 2018, The Age Pension means tests: contorting Australian retirement, Actuaries Institute, viewed 07 July 2019. <https://www.actuaries.asn.au/Library/Events/FSF/2018/TheAgePensionMeansTestsPaper.pdf?utm_medium=email&utm_campaign=FSF%20NEWSLETTER%20-%20Number%201%20-%20SPECIAL%20MAJOR%20EVENT%20EMAIL&utm_content=FSF%20NEWSLETTER%20-%20Number%201%20-%20SPECIAL%20MAJOR%20EVENT%20EMAIL+Preview+CID_598e314d0ccd589a172d4309468e15c9&utm_source=Campaign%20Monitor&utm_term=The%20Age%20Pension%20means%20tests%20contorting%20Australian%20retirement t>
Atalay, K., Barrett, G. & Edwards, R. 2016, House prices, household debt and labour supply in Australia, AHURI Final Report No. 266, Australian Housing and Urban Research Institute, viewed 20 May 2019. <https://www.ahuri.edu.au/__data/assets/pdf_file/0021/8553/AHURI_Final_Report_No266_House-prices,-household-debt-and-labour-supply-in-Australia.pdf>
Austen, S., Jefferson, T., Lewin, G., Ong, R. & Sharp, R. 2015, ‘Care roles and employment decision-making: The effect of economic circumstance’, Journal of Industrial Relations, vol. 57, no. 5, pp. 665-685.
Australian Bureau of Statistics (ABS) 1996, Census of population and housing: ABS views on content and procedures, ABS Cat. 2007.0, ABS, Canberra.
Australian Human Rights Commission (AHRC) 2009, Accumulating Poverty? Women’s experiences of inequality over the lifecycle, viewed 03 June 2019. <https://www.humanrights.gov.au/sites/default/files/document/publication/accumulating_poverty.pdf>
Australian Human Rights Commission (AHRC) 2013, Investing in care: Recognising and valuing those who care, Volume 1 Research Report, Sydney. <https://humanrights.gov.au/sites/default/files/UnpaidCaringVolume1_2013.pdf?_ga=2.179598176.515370571.1604749343-2011856935.1583888694>
Australian Human Rights Commission (AHRC) 2013, Investing in care: Recognising and Valuing those who care, Volume 2 AHRC, viewed 22 July 2020. <https://humanrights.gov.au/our-work/sex-discrimination/publications/investing-care-recognising-and-valuing-those-who-care>.

77
Australian Human Rights Commission (AHRC) 2019, Older Women’s Risk of Homelessness: Background Paper Exploring a growing problem, Australian Human Rights Commission, viewed 03 June 2019. <https://www.humanrights.gov.au/sites/default/files/document/publication/ahrc_ow_homelessness2019.pdf>
Australian Institute of Health and Welfare (AIHW) 2018, Housing Assistance in Australia, AHURI, viewed 23 July 2019. <https://www.aihw.gov.au/reports/housing-assistance/housing-assistance-in-australia-2018/contents/housing-in-australia>
Australian Prudential Regulation Authority (APRA) 2019, Annual Superannuation Bulletin June 2018, viewed 06 May 2019. <https://www.apra.gov.au/sites/default/files/annual_superannuation_bulletin_june_2018_reissued_3_july_2019.pdf>
Australian Prudential Regulation Authority (APRA) 2017, Prudential Practice Guide APG 223-Residential Mortgage Lending, viewed 03 August 2020. <https://www.apra.gov.au/sites/default/files/APG-223_0.pdf>
Australian Securities and Investments Commission 2015, Financial Literacy Strategy: Australia's National Financial Literacy Strategy <http://www.financialliteracy.gov.au/strategy-and-action-plan/financial-literacy-strategy>
Brown, L. & Li, J. 2016, For richer, For Poorer; divorce in Australia, Income and Wealth Report Issue 39, AMP-NATSEM, viewed 20 May 2019. <https://natsem.canberra.edu.au/files/download?id=1273>
Choi, N. 2002, ‘Self-Defined Retirement Status and Engagement in Paid Work among Older Working-Age Women: Comparison between Childless Women and Mothers’, Sociological Inquiry, vol. 72, no. 1, pp. 43–71.
Clare, R. 2019, Better Retirement Outcomes: a snapshot of account balances in Australia, The Association of Superannuation Funds of Australia Limited, viewed 21 August 2020. <https://www.superannuation.asn.au/ArticleDocuments/359/1907-Better-Retirement-Outcomes-a-snapshot-of-account-balances-in-Australia.pdf.aspx?Embed=Y>
Cwikel, J., Gramotnev, H. & Lee, C. 2006, ‘Never-married childless women in Australia: health and social circumstances in older age’, Social Sciences and Medicine, vol. 62, pp. 1991-2001.
Department of Health 2017, User Guide: Aged Care Assessment Team Guidance Framework for Home Care Package Level, viewed 28 May 2019. <https://agedcare.health.gov.au/sites/g/files/net1426/f/documents/02_2017/user_guide_for_the_guidance_framework.pdf>
Department of Human Services 2019, Rent assistance – how much you can get, viewed 20 June 2019. <https://www.humanservices.gov.au/individuals/services/centrelink/rent-assistance/eligibility-payment-rates/how-much-you-can-get>
Department of Social Services 2016, Family Tax Benefit Payment Trends and Profile Report Accessibility Version 2016, Australian Government, viewed 26 June 2019. <https://data.gov.au/dataset/4ccff587-4a46-4ab9-8833-76dadaa10ebe/resource/69049918-3b00-4243-9ef9-64103239e4ae/download/family-tax-benefit-payment-trends-and-profile-report-accessibility-version-june-2016.docx>
78
Department of Social Services 2019a, Commonwealth Rent Assistance, viewed 29 March 2019. <https://www.dss.gov.au/housing-support/programmes-services/commonwealth-rent-assistance>
Department of Social Services 2019b, National Rental Affordability Scheme – Household Income, viewed 29 March 2019. <https://www.dss.gov.au/sites/default/files/documents/03_2019/nras-household-income-indexation-2019-20-information-sheet_0_1.pdf>
Department of Social Services 2020, Demographics March 2020, Department of Social Services, Canberra, Dataset, viewed 3 August 2020. <https://data.gov.au/dataset/dss-payment-demographic-data>
Department of Treasury 2008, Architecture of Australia's tax and transfer system, Australian Government, Canberra.
De Vaus, D., Gray, M., Qu, L. & Stanton, D. 2014, ‘The Economic Consequences of Divorce in Australia’, International Journal of Law, Policy and the Family, Volume 28, Issue 1, pp. 26–47.
De Vaus, D. & Qu, L. 2015, The nature of living alone in Australia, Australian Family Trends No. 9, Australian Institute of Family Studies.
Dockery, A.M. & Buchler, S. 2015, Occupational segregation and women’s job satisfaction, Working Paper 15/10, Bankwest Curtin Economics Centre, Curtin University, Perth.
Economic S4W 2016, Women’s financial marathon to $urvival – women’s income in later life, viewed 10 November 2020. < https://www.security4women.org.au/wp-content/uploads/2020/07/eS4W-Discussion-Paper_Womens-Financial-Marathon-to-Survival_20160701.pdf>
Eslake, S. 2017, No place like home – The impact of declining home ownership on retirement, Australian Institute of Superannuation Trustees, viewed 20 July 2019. <https://www.aist.asn.au/getattachment/Media-and-News/News/2017/No-place-like-home-the-impact-of-declining-home-ow/AIST_Housing-affordability-and-retirement-incomes_FINAL-21032017.pdf>
Grbich, C. 1999, Qualitative Research in Health: An Introduction. Sage Publications, London.
Grudnoff, M. 2020, Early tax cuts as stimulus – gender analysis, Research Paper, The Australia Institute, Canberra.
Hamilton, M. & Thomson, C. 2017, ‘Recognising unpaid care in private pension schemes’, Social Policy and Society, vol. 16, no. 4, pp 517-534.
Hamilton, M. & Suthersan, B. 2020, ‘Gender moral rationalities in later life: Grandparents balancing paid work and care of grandchildren in Australia’. Ageing and Society. Early view.
Hank, K. & Wagner, M. 2013, ‘Parenthood, marital status, and well-being in later life: evidence from SHARE’, Social Indicators Research, vol. 114, no. 2, pp. 639 – 653.
Henry, K., Harmer, J., Piggot, J., Ridout, H. & Smith, G. 2010, Australia's Future Tax System: Final Report (The Henry Review), Commonwealth of Australia, Canberra.
Hermansson, C. 2017, ‘Saving motives, gender, and the use of financial advisory services’, Managerial Finance, vol. 43 Issue: 11, pp.1202-1223

79
HESTA 2020, Early release super scheme sees younger women drain super, Media Release 19 June 2020, viewed 1 October 2020. <https://www.hesta.com.au/about-us/media-centre/Early-release-super-scheme-sees-younger-women-drain-super-HESTA.html>
Hetherington, D. & Smith, W. 2017, Not so super, for women: superannuation and women’s retirement outcomes, Per Capita & Australian Services Union, viewed 20 May 2019. <https://percapita.org.au/wp-content/uploads/2018/05/Not-So-Super_FINAL-v2-2.pdf>
Hodgson, H. and Boden, R. 2008, ‘Not-so-distant cousins: Family benefits in the United Kingdom and Australia’, International Social Security Review, vol. 61, no. 3, pp. 29-46.
Hodgson, H. 2008, ‘Taxing the Family – The Tax Unit: Should New Zealand Adopt a Family-Based Income Tax?’, NZ Journal of Tax Law and Policy, vol. 14, pp. 398-412.
Hodgson, H., James, A.C. & Webb, E. 2018, Older renters in the Western Australian Private Rental Sector: Strategies to enhance housing security for WA's older renters, BCEC Research Report 19/18, Bankwest Curtin Economics Centre, Perth.
Housing and Urban Research Institute 2018, Support older lower income tenants in the private rental sector, Policy Issue Analysis, Australian Housing and Urban Research Institute, viewed 14 July 2019. <https://www.ahuri.edu.au/policy/policy-analysis/supporting-older-lower-income-tenants-in-the-private-rental-sector>
Income Tax Assessment Act 1936 (Cth)
Income Tax Assessment Act 1997 (Cth)
Jacobs, K., Lawson, J., Gabriel, M. & Hulse, K. 2015, Individualised and market-based housing assistance: evidence and policy options, Final Report No. 253, Australian Housing and Urban Research Institute, viewed 14 July 2019. <https://pdfs.semanticscholar.org/f99c/0590fb1364202dd333a23e62400201598f2a.pdf>
Johnson, R.W. & Favreaul, M. 2004, ‘Economic Status in Later Life Among Women Who Raised Children Outside of Marriage’, Journal of Gerontology: Social Sciences, Vol. 59, No. 6, pp. 315–32.
Koropeckyj-Cox, T. & Call, V. 2007, ‘Characteristics of Older Childless Persons and Parents’, Journal of Family Issues, vol. 28, No. 10, pp. 1362–1414.
Koukoulas, S. 2018, Defining the concept of economic security for all women: policy recommendations to boost women’s economic security, economic S4W, viewed 20 May 2019. <https://www.security4women.org.au/boosting-womens-economic-security/economic-security-defined-for-all-women/>
KPMG 2019, She’s Price(d)less: The Economics of the Gender Pay Gap – Summary Report, Report Prepared with Diversity Council of Australia and WGEA, KPMG.
Lim, M., Lambert, G., Thurston, L., Argent, T., Eres, R., Qualter, P.M., Hennessey, A., Badcock, J. & Holt-Lunstad, J. 2020, Survey of Health and Wellbeing – Monitoring the Impact of COVID-19, Iverson Health Innovation Research Institute, Swinburne University of Technology, <https://www.swinburne.edu.au/media/swinburneeduau/research-institutes/iverson-health/Loneliness-in-COVID-19-15-07-20_final.pdf>
McFerran, L. 2010, ‘It Could Be You: Female, Single, Older and Homeless’, Parity, vol. 23, no. 10, pp. 15-18.

80
McGann, M., Ong, R., Bowman, D., Duncan, A., Kimberley, H. & Biggs, S. 2016, ‘Gendered Ageism in Australia: Changing Perceptions of Age Discrimination among Older Men and Women’, Economic Papers, vol. 35, no. 4, pp. 375-388.
Muir, K., Hamilton, M., Noone, J.H., Marjolin, A., Salignac, F. & Saunders, P. 2017, Exploring Financial Wellbeing in the Australian Context, Centre for Social Impact & Social Policy Research Centre – University of New South Wales Sydney, for Financial Literacy Australia.
National Foundation for Australian Women 2017, Gender lens on the Budget 2017-18, National Foundation for Australian Women, viewed 02 June 2019. <https://nfaw.cdn.prismic.io/nfaw%2F34343a56-4465-45e7-a635-c5cb7d63636f_2017+gender+lens+on+the+budget.pdf>
National Foundation for Australian Women 2019, Gender Lens on the Budget 2019-20, National Foundation for Australian Women, viewed 02 June 2019. <https://www.nfaw.org/page/a-gender-lens-budget>
National Older Women’s Housing and Homelessness Working Group 2018, Retiring into Poverty, APO Online, viewed 27July 2019. <https://apo.org.au/node/188221>
New South Wales Government Family and Community Services 2019, Eligibility for social housing, New South Wales Government, viewed 24 April 2019. <https://www.facs.nsw.gov.au/housing/policies/eligibility-social-housing-policy>
Parliamentary Budget Office 2020, JobSeeker Payment: Understanding economic and policy trends influencing Commonwealth expenditure.
Plotnick, R.D. 2009, ‘Childlessness and the economic well-being of older Americans’, Journal of Gerontology: Social Sciences, vol. 64, no. 6, pp. 767–776.
Poterba, J. Venti, S. & Wise, D. 2018, Longitudinal determinants of end-of-life wealth inequality, NBER Working Paper No. 23839, National Bureau of Economic Research, viewed 20 May 2019. <https://www.nber.org/papers/w23839.pdf>
Power, E.R. 2020, Older Women in the Private Rental Sector: Unaffordable, Substandard and Insecure Housing. <https://doi.org/10.26183/5edf0f0d75cf8>
Prime Minister and Cabinet 2017, Towards 2025: An Australian Government Strategy to Boost Women's Workforce Participation, Australian government, viewed 26 June 2019. <https://womensworkforceparticipation.pmc.gov.au/sites/default/files/towards-2025-strategy.pdf>
Productivity Commission 2015, Housing Decisions of Older Australians, Commission Research Paper, Canberra. <https://www.pc.gov.au/research/completed/housing-decisions-older-australians>
Reserve Bank of Australia 2015, Submission to the inquiry into Home Ownership, House of Representatives Standing Committee on Economics, viewed 04 June 2019. <https://www.rba.gov.au/publications/submissions/housing-and-housing-finance/inquiry-into-home-ownership/pdf/inquiry-into-home-ownership.pdf>
Rowland, D.T. 1998, ‘Consequences of childlessness in later life’, Australaisian Journal on Ageing, vol. 17, no. 1, pp. 24 – 28.
81
Rowley, S., James, A., Gilbert, C., Gurran, N., Ong, R., Phibbs, P., Rosen, D. & Whitehead, C. 2016, Subsidised affordable rental housing: lessons from Australia and overseas, AHURI Final Report No. 267, Australian Housing and Urban Research Institute Limited, Melbourne. <https://www.ahuri.edu.au/research/final-reports/267>
Salignac, F., Hamilton, M., Noone, J., Marjolin, A., Muir, K. 2019, ‘Conceptualising Financial Wellbeing: An Ecological Life-course Approach’, Journal of Happiness Studies. Earlyview.
Sane, R. & Piggott, J. 2008, ‘Does the Owner-Occupier Exemption from the Pensions Means Text Affecting Housing Choice of the Elderly? Evidence from Australia’, Semantic Scholar [Online]. <https://pdfs.semanticscholar.org/eccc/3bb1110d6d527793cdb8625a48caf3749925.pdf?_ga=2.230139160.500869704.1572312589-1370208924.1569374352>
Senate Economics References Committee 2016, ‘A husband is not a retirement plan': achieving economic security for women in retirement, Australian Government, viewed 20 May 2019. <https://www.aph.gov.au/Parliamentary_Business/Committees/Senate/Economics/Economic_security_for_women_in_retirement/~/media/Committees/economics_ctte/Economic_security_for_women_in_retirement/report.pdf>
Senate Standing Committee on Economics (2016) Economic Security for Women in Retirement, Issues Paper, Canberra.
Sharam, A. 2008, Going it Alone: Single, Low Needs Women and Hidden Homelessness, APO online, viewed 10 June 2019. <https://apo.org.au/sites/default/files/resource-files/2008-11/apo-nid41394.pdf>
Stone W., Parkinson, S., Sharam, A. & Ralston, L. 2016, Housing assistance need and provision in Australian: a household-based policy analysis, Final Report 262, AHURI, viewed 27 June 2019. <https://www.ahuri.edu.au/__data/assets/pdf_file/0021/7617/AHURI_Final_Report_No262_Housing-assistance-need-and-provision-in-Australia-a-household-based-policy-analysis.pdf>
Tirado-Morueta, R., Aguaded-Gómez, J., Hernando-Gómez, A. 2018, ‘ The socio-demographic divide in Internet usage moderated by digital literacy support’, Technology in Society, vol. 55, pp. 47-55.
Tually, S., Beer, A. & Faulkner, D. 2007, Too big to ignore: future issues for Australian Housing 2006-2025, Australian Housing and Urban Research Institute, viewed 20 May 2019. <http://web.archive.org/web/20110411012506/http://www.socsci.flinders.edu.au/ahuri.src/docs/toobigtoignoreReportFINAL2.pdf>
Whelan, S., Dynan, L., & Atalay, K. 2018, Asset portfolio retirement decision: the role of the tax and transfer system, Australian Housing and Urban Research Institute, Final report no 298, viewed 19 June 2019. <https://www.ahuri.edu.au/__data/assets/pdf_file/0024/19176/AHURI-Final-Report-298-Asset-portfolio-retirement-decisions-the-role-of-the-tax-and-transfer-system.pdf>
Whittaker, N. 2017, ‘The case against letting first-home buyers use super’, Sydney Morning Herald, 03 March, viewed 03 March 2017. <https://www.smh.com.au/money/super-and-retirement/the-case-against-letting-firsthome-buyers-use-super-20170302-guovua.html>
Wood, G., Chamberlain, C., Babacan, A., Dockery, M., Cullen, G., Costello, G., Nygaard, A., Stoakes, A., Adam, M. & Moloney, K. 2008, The implications of loss of a partner for older private renter, AHURI Final Report No. 116, Australian Housing and Urban Research Institute, viewed 20 May 2019.

82
<https://www.ahuri.edu.au/__data/assets/pdf_file/0007/2140/AHURI_Final_Report_No116_The-implications-of-loss-of-a-partner-for-older-private-renters.pdf>
Workplace Gender Equality Agency 2019, Women’s economic security in retirement, Australian Government, viewed 20 May 2019. <https://www.wgea.gov.au/sites/default/files/documents/Women%27s%20economic%20security%20in%20retirement.pdf>
Workplace Gender Equality Agency 2018, Australia’s gender equality scorecard. Key findings from the Workplace Gender Equality Agency’s 2017-18 reporting data, Australian Government, viewed 28 April 2020. <https://www.wgea.gov.au/sites/default/files/documents/2017-18-gender-equality-scorecard_0.pdf>
World Economic Forum 2019, Investing in (and for) Our Future, World Economic Forum, viewed 27 July 2019. <http://www3.weforum.org/docs/WEF_Investing_in_our_Future_report_2019.pdf>
Yates, J. 2017, ‘Housing affordability in retirement: current and future issues, COTA National Policy Forum’, Presentation at the COTA National Policy Forum, 22 June 2017, viewed 20 June 2019. <https://www.cota.org.au/wp-content/uploads/2017/12/COTA-National-Policy-Forum-2017_Dr-Judith-Yates.pdf>

83
Appendix A. Detailed HILDA results This Appendix presents more detailed results underlying the figures shown in Section 4.
The Household, Income and Labour Dynamics in Australia survey is a longitudinal panel study currently covering the period 2001 to 2018. The sample is designed to provide a representative cross-section of the population in each year. Our focus is on how key outcomes for Single Women Without Children (SWWC) compare with outcomes for other demographic groups. We restrict attention to people who are aged 45 or older in the respective year of the survey.
We have calculated outcomes for eight demographic groups.
1. SWWC. Single women without children. Women who are currently not partnered, and who have never had a child
2. Single men without children. Men who are currently not partnered and who have never had a child.
3. Single women with children. Women who are currently not partnered, but who have had a child.
4. Single men with children. Men who are currently not partnered, but who have had a child. 5. Partnered women without children. Women who are currently partnered and who have never
had a child. 6. Partnered men without children. Men who are currently partnered and who have never had a
child. 7. Partnered women with children. Women who are currently partnered and who have had a
child. 8. Partnered men with children. Men who are currently partnered and who have had a child.
In the groups where the person has had a child, the child is not necessarily still co-resident with them. Partnered status, however, is based on status at the time of observation.
This needs to be considered when comparing the groups. In particular, it means that the men in group 6 do not necessarily live in the same households as the women in group 5 (similarly for 8 and 7). In fact, about a third of the men in group 6 have partners who have had children. These children from a previous relationship might nonetheless be living in the household of the men without children – and the mother’s childrearing responsibilities might have led to a reduced household income. This is why group 6 has a lower household income than group 5 in Table A.4.
Only results for groups 1, 2, 3 and 5 are shown in the figures in Section 6 above. These comprise SWWC and the three groups that differ in only one demographic characteristic (gender, past parenting or current partnered status respectively).
The rationale for these comparisons is to provide a simple description of the association between demographic outcomes (gender, parenting and partnering) and a range of key economic and social outcomes. However, SWWC without children also differ in other important respects. Most importantly, their education level tends to be higher than many of the other demographic groups. Since higher education is associated with better economic and social outcomes, this needs to be considered when looking at outcomes.
Table A.1 shows these educational outcomes in more detail, both overall and separately for each age group. For example, among people aged 45+, 4.1 per cent overall have a postgraduate degree, among SWWC this rate is 7.1 per cent. This higher than all other groups except the partnered men and women who have never had children. To take account of these educational differences we also present results controlling for education level.

84
We consider a range of outcome variables reflecting economic and health outcomes and caring responsibilities. These variables are defined in Section 6 above.
Results are presented both for data pooled across the 18 years of the survey, and for the most recent year (2018 for most variables, 2014 for the wealth variables). All currency amounts are adjusted to 2017-18 values using the CPI. We use the responding person cross-sectional weights for all estimates. Most people appear in more than one wave of the survey. Our tests for significant differences take account of this and the survey design features. (SAS proc surveyreg is used for all estimates).
For each outcome variable, we present estimates from a number of different models comparing the situation of SWWC with people in the other demographic groups. These models vary in whether they control for the year of observation, the person’s age or their education level. The model is estimated using least squares regression (taking account of the survey design) and we present the predicted values from that regression for people with particular characteristics. For example, for model 7 we show the predicted value for people with less than year 12 education in 2018 (estimated separately for each age group).
All tables follow the same format. Our preferred models are models 4 and 7, but the others are included to show the impact of different ways of controlling for age and year of observation. The results from models 4 and 7 are also shown in the main text of the document in Section 4.
In Table A.2, for example, the first row shows simple averages, and differences of averages, pooled across the 18 years of the survey. The first column shows the mean income for SWWC of $41,714. The second and later columns show differences in means for the other groups. For each estimate we include t statistics in parentheses and indicate estimates significantly different from zero with * (10%) and ** (5%). So single men without children have a mean income of $696 higher (not significantly different), while single women with children have a mean income $7,610 lower – a difference that is statistically different.
The second row shows the same results but calculated just for the most recent year.
In the third row, we control for year of observation (a cubic function, except for the wealth results where a quadratic is used). The results show the predicted value for 2018. This is a way of taking account of the data from all years, while providing an estimate that is most relevant to 2018.
The remaining rows all control for age, in different ways. This is important because the 45+ age range covers a wide range of circumstances, and the likelihood of being in our different demographic groups varies with age.
Model 4 splits the sample into three age groups, and controls for year of observation in each (preferred)
Model 5 keeps a single sample, but controls for both year and age (cubic).
Model 6 controls for age, but only presents data for the most recent year.
Model 7 is the same as model 4, but also controls for education level (holding constant at below year 12 education level – hence the lower average values in the first column) (preferred)
Model 8 is like model 5, but also controlling for education level.
In the figures in Section 4, we present the results from models 4 and 7. That is, pooled data across all years, estimated for 2018, separately for each age group, with and without controlling for education.

85
Table A.1: Education level by age and family status
All
Single women without children
(SWWC) (1)
Single men
without children
(2)
Single women
with children
(3)
Single men with
children (4)
Partnered women without children
(5)
Partnered men
without children
(6)
Partnered women
with children
(7)
Partnered men with
children (8)
% % % % % % % % %
7.8 6.9 2.5 3.4 12.5 9.5 3.9 6.6 5.4 45-54 Postgrad - masters or doctorate
Grad diploma, grad certificate 13.7 4.0 5.7 3.7 12.0 5.2 8.4 6.5 7.1
Bachelor or honours 22.4 6.5 13.5 7.6 19.3 14.0 13.1 15.1 13.6
Adv diploma, diploma 11.6 6.1 10.1 10.5 13.2 8.4 10.1 10.8 10.2
Cert III or IV 12.5 25.7 22.9 33.8 10.1 29.4 16.7 33.1 24.6
Year 12 10.6 17.5 11.8 9.5 13.1 15.3 13.5 7.2 11.1
Below year 12 and undetermined 21.5 33.2 33.6 31.4 19.8 18.1 34.3 20.8 28.0
All 100.0 100.0 100.0 100.0 100.0 100.0 100.0 100.0 100.0
55-64 Postgrad - masters or doctorate 9.4 2.0 2.2 4.1 8.5 7.3 2.7 6.3 4.5
Grad diploma, grad certificate 10.4 4.1 5.9 3.1 12.2 5.0 6.3 5.8 6.0
Bachelor or honours 17.7 7.4 9.5 6.2 16.2 13.4 8.9 12.3 10.5
Adv diploma, diploma 15.2 7.6 8.0 8.6 7.1 6.7 9.6 11.7 10.1
Cert III or IV 9.1 25.5 21.1 32.4 14.3 32.4 14.5 28.5 22.3
Year 12 6.2 13.7 9.4 9.2 9.0 10.3 11.3 9.4 10.1
Below year 12 and undetermined 32.0 39.7 44.0 36.4 32.8 24.9 46.7 26.0 36.6
All 100.0 100.0 100.0 100.0 100.0 100.0 100.0 100.0 100.0
65+ Postgrad - masters or doctorate 4.5 2.5 0.6 2.2 3.0 9.3 1.9 4.0 2.6
Grad diploma, grad certificate 8.8 0.6 2.7 2.0 6.7 7.0 2.9 3.9 3.3
Bachelor or honours 11.0 5.1 6.3 4.3 11.4 4.1 6.0 7.6 6.6
Adv diploma, diploma 7.6 6.8 6.2 9.6 7.8 3.6 8.1 10.4 8.5
Cert III or IV 4.0 23.9 7.9 31.0 7.7 31.8 8.9 27.2 17.4
Year 12 9.0 3.8 6.4 9.0 6.3 4.6 8.5 7.6 7.6
Below year 12 and undetermined 55.0 57.4 70.0 42.0 57.0 39.5 63.7 39.3 54.0
All 100.0 100.0 100.0 100.0 100.0 100.0 100.0 100.0 100.0
All Postgrad - masters or doctorate 7.1 4.7 1.4 3.1 9.4 8.8 2.9 5.6 4.1
Grad diploma, grad certificate 11.2 3.3 4.2 2.9 11.1 5.5 6.1 5.4 5.5
Bachelor or honours 17.4 6.4 8.8 5.9 16.8 11.7 9.7 11.6 10.3
Adv diploma, diploma 11.2 6.6 7.6 9.6 10.2 6.9 9.4 10.9 9.6
Cert III or IV 8.7 25.3 14.7 32.3 11.0 30.8 13.7 29.6 21.4
Year 12 8.9 13.6 8.4 9.2 10.5 11.5 11.3 8.0 9.6
Below year 12 and undetermined 35.5 40.0 54.9 37.1 30.9 24.7 46.9 28.8 39.5
All 100.0 100.0 100.0 100.0 100.0 100.0 100.0 100.0 100.0

Table A.2: Personal income by family status ($2017-18)
Mean for SWWC, and difference from SWWC for other groups
Single women without children
(1)
Single men
without children
(2)
Single women
with children
(3)
Single men with
children (4)
Partnered women without children
(5)
Partnered men
without children
(6)
Partnered women
with children
(7)
Partnered men with
children (8)
1. Average (pooled 2001-2018)
45+ 41,714 696 -7,610 1,585 4,201 12,698 -8,904 15,107
(0.3) (-4.2)** (0.7) (1.7)* (5.4)** (-5.1)** (7.6)**
2. Average (2018)
45+ 43,095 3,090 -4,155 1,939 8,247 10,922 -5,559 19,459
(0.9) (-1.6) (0.6) (2.3)** (3.4)** (-2.2)** (6.9)**
3. Controlling for year (2001-2018)
45+ 45,702 428 -7,498 1,405 3,891 12,527 -8,670 15,413
(0.2) (-4.2)** (0.6) (1.6) (5.4)** (-5.0)** (7.7)**
4. Controlling for year, separately for each age group (2001-2018)
45-54 53,016 -194 -1,266 5,009 3,579 14,168 -8,823 23,829
(-0.1) (-0.6) (1.7)* (1.3) (5.0)** (-4.5)** (10.3)**
55-64 46,130 -4,675 -4,834 3,926 1,627 11,976 -9,264 19,828
(-1.4) (-1.8)* (1.2) (0.5) (3.4)** (-3.7)** (7.3)**
65+ 38,993 -976 -6,216 -146 -2,361 1,293 -8,721 4,174
(-0.3) (-2.1)** (-0.0) (-0.6) (0.3) (-2.8)** (1.3)
5. Controlling for year and age (2001-2018)
45+ 47,486 -3,116 -2,526 3,475 -51 9,177 -9,629 15,729
(-1.4) (-1.5) (1.7)* (-0.0) (4.1)** (-5.9)** (8.4)**
6. Controlling for age (2018 only)
45+ 44,956 -494 118 3,692 4,632 7,709 -6,386 19,963
(-0.1) (0.0) (1.2) (1.3) (2.4)** (-2.5)** (7.0)**
7. Controlling for year and education, separately for each age group (2001-2018)
45-54 31,731 7,827 5,922 13,537 2,817 17,909 -2,901 27,951
(3.1)** (3.2)** (4.9)** (1.1) (7.0)** (-1.7)* (13.1)**
55-64 28,314 2,761 1,783 11,147 2,593 15,457 -3,047 22,934
(0.9) (0.7) (3.4)** (0.9) (4.5)** (-1.4) (8.9)**
65+ 30,133 3,364 -2,204 3,200 -1,156 2,336 -5,460 5,910
(1.0) (-0.8) (1.1) (-0.3) (0.7) (-1.9)* (1.9)*
8. Controlling for year, age and education (2001-2018)
45+ 32,383 3,395 3,215 9,455 31 12,055 -4,535 18,824
(1.7)* (2.1)** (4.6)** (0.0) (5.7)** (-3.0)** (10.5)**

87
Table A.3: Job security index (0-10) (for those with jobs)
Mean for SWWC, and difference from SWWC for other groups
Single women without children
(1)
Single men
without children
(2)
Single women
with children
(3)
Single men with
children (4)
Partnered women without children
(5)
Partnered men
without children
(6)
Partnered women
with children
(7)
Partnered men with
children (8)
1. Average (pooled 2001-2018)
45+ 7.8 -0.3 -0.1 -0.2 -0.1 -0.0 0.3 0.0
(-1.5) (-0.8) (-1.1) (-0.7) (-0.1) (1.9)* (0.3)
2. Average (2018)
45+ 7.8 -0.2 -0.0 -0.6 -0.1 0.0 0.2 0.1
(-0.8) (-0.0) (-2.4)** (-0.2) (0.2) (1.2) (0.5)
3. Controlling for year (2001-2018)
45+ 7.8 -0.3 -0.1 -0.2 -0.1 -0.0 0.3 0.0
(-1.5) (-0.8) (-1.1) (-0.6) (-0.1) (1.9)* (0.3)
4. Controlling for year, separately for each age group (2001-2018)
45-54 7.8 -0.4 -0.2 -0.3 -0.3 -0.0 0.2 -0.1
(-1.7)* (-1.1) (-1.6) (-1.3) (-0.0) (1.0) (-0.5)
55-64 7.5 -0.0 -0.1 -0.1 0.2 -0.0 0.5 0.2
(-0.0) (-0.2) (-0.2) (0.8) (-0.2) (2.5)** (0.9)
65+ 8.6 -0.2 -0.4 -0.3 0.2 -0.3 0.1 -0.0
(-0.5) (-0.9) (-0.8) (0.3) (-0.6) (0.4) (-0.1)
5. Controlling for year and age (2001-2018)
45+ 7.9 -0.3 -0.2 -0.2 -0.1 -0.0 0.3 -0.0
(-1.4) (-1.1) (-1.4) (-0.6) (-0.1) (1.8)* (-0.1)
6. Controlling for age (2018 only)
45+ 7.8 -0.2 -0.0 -0.6 -0.1 0.0 0.2 0.1
(-0.8) (-0.2) (-2.6)** (-0.2) (0.1) (1.2) (0.3)
7. Controlling for year and education, separately for each age group (2001-2018)
45-54 7.9 -0.3 -0.2 -0.3 -0.3 0.0 0.2 -0.1
(-1.6) (-1.1) (-1.5) (-1.3) (0.1) (1.0) (-0.3)
55-64 7.6 0.0 -0.0 -0.0 0.2 -0.0 0.5 0.2
(0.0) (-0.2) (-0.1) (0.8) (-0.1) (2.5)** (1.0)
65+ 8.9 -0.4 -0.5 -0.4 0.1 -0.4 0.0 -0.1
(-1.0) (-1.2) (-1.1) (0.2) (-0.8) (0.1) (-0.3)
8. Controlling for year, age and education (2001-2018)
45+ 8.0 -0.2 -0.2 -0.2 -0.1 -0.0 0.3 0.0
(-1.3) (-1.1) (-1.3) (-0.6) (-0.0) (1.8)* (0.1)

88
Table A.4: Equivalised household income by family status ($2017-18)
Mean for SWWC, and difference from SWWC for other groups
Single women without children
(1)
Single men
without children
(2)
Single women
with children
(3)
Single men with
children (4)
Partnered women without children
(5)
Partnered men
without children
(6)
Partnered women
with children
(7)
Partnered men with
children (8)
1. Average (pooled 2001-2018)
45+ 44,681 1,442 -6,593 216 23,499 17,680 8,981 9,444
(0.6) (-3.5)** (0.1) (8.1)** (6.9)** (4.7)** (5.0)**
2. Average (2018)
45+ 48,242 882 -7,167 -2,267 22,932 16,619 10,450 11,216
(0.3) (-2.7)** (-0.8) (6.3)** (5.0)** (4.1)** (4.3)**
3. Controlling for year (2001-2018)
45+ 48,215 1,163 -6,473 43 23,181 17,499 9,221 9,757
(0.5) (-3.5)** (0.0) (8.0)** (6.9)** (4.8)** (5.2)**
4. Controlling for year, separately for each age group (2001-2018)
45-54 53,728 -516 -8,076 -671 27,718 19,794 8,114 6,628
(-0.2) (-3.4)** (-0.2) (8.4)** (6.7)** (3.9)** (3.2)**
55-64 49,898 -3,163 -1,911 1,760 18,817 14,659 12,983 16,353
(-0.9) (-0.7) (0.5) (4.4)** (4.1)** (4.6)** (6.1)**
65+ 41,588 1,201 -2,083 2,426 6,923 7,487 5,484 8,131
(0.3) (-0.6) (0.7) (1.6) (1.8)* (1.7)* (2.5)**
5. Controlling for year and age (2001-2018)
45+ 53,394 -1,195 -2,883 1,208 19,934 14,878 7,970 9,457
(-0.5) (-1.6) (0.6) (7.1)** (6.1)** (4.4)** (5.3)**
6. Controlling for age (2018 only)
45+ 53,273 -887 -4,017 -1,178 20,670 14,443 9,800 11,567
(-0.3) (-1.5) (-0.4) (5.8)** (4.5)** (3.9)** (4.5)**
7. Controlling for year and education, separately for each age group (2001-2018)
45-54 40,806 4,372 -3,686 4,483 27,202 22,014 11,759 9,048
(1.9)* (-1.8)* (1.8)* (9.2)** (8.4)** (6.6)** (5.0)**
55-64 35,580 2,560 3,225 7,171 19,557 17,154 17,864 18,562
(0.8) (1.2) (2.4)** (5.1)** (5.4)** (7.0)** (7.4)**
65+ 32,898 4,943 1,766 5,125 8,019 7,695 8,592 9,305
(1.2) (0.6) (1.5) (2.1)** (2.0)** (2.7)** (2.9)**
8. Controlling for year, age and education (2001-2018)
45+ 41,615 3,539 1,421 5,429 19,962 16,757 11,797 11,522
(1.7)* (0.9) (2.8)** (8.0)** (7.8)** (7.1)** (6.9)**

89
Table A.5: Personal superannuation wealth
Mean for SWWC, and difference from SWWC for other groups
Single women without children
(1)
Single men
without children
(2)
Single women
with children
(3)
Single men with
children (4)
Partnered women without children
(5)
Partnered men
without children
(6)
Partnered women
with children
(7)
Partnered men with
children (8)
1. Average (pooled 2001-2018)
45+ 183,105 -17,346 -95,116 -63,022 242,878 156,917 127,638 123,584
(-0.6) (-4.6)** (-2.8)** (5.4)** (4.3)** (5.3)** (5.2)**
2. Average (2018)
45+ 169,462 17,801 -72,676 -50,038 290,533 237,017 177,981 168,437
(0.6) (-3.2)** (-2.0)** (5.4)** (5.4)** (6.8)** (6.6)**
3. Controlling for year (2001-2018)
45+ 259,666 -22,363 -92,377 -64,389 239,978 156,483 130,722 127,982
(-0.8) (-4.4)** (-2.8)** (5.3)** (4.3)** (5.4)** (5.3)**
4. Controlling for year, separately for each age group (2001-2018)
45-54 261,395 -41,354 -121,502 -77,875 199,024 67,293 102,955 70,754
(-1.2) (-4.3)** (-2.6)** (4.5)** (1.9)* (3.5)** (2.4)**
55-64 339,741 -60,181 -134,827 -114,950 224,552 164,475 150,522 152,071
(-1.2) (-2.9)** (-2.4)** (3.1)** (2.5)** (3.1)** (3.2)**
65+ 195,641 9,704 -17,214 -7,046 253,442 261,297 123,770 157,023
(0.3) (-0.8) (-0.3) (2.6)** (3.1)** (4.9)** (6.1)**
5. Controlling for year and age (2001-2018)
45+ 346,201 -32,192 -68,239 -64,275 216,520 136,110 113,415 116,140
(-1.2) (-3.2)** (-2.8)** (4.8)** (3.7)** (4.8)** (5.0)**
6. Controlling for age (2018 only)
45+ 253,022 9,711 -49,500 -49,533 264,936 224,210 164,364 158,068
(0.3) (-2.2)** (-2.0)** (5.0)** (5.1)** (6.4)** (6.3)**
7. Controlling for year and education, separately for each age group (2001-2018)
45-54 133,978 6,090 -81,814 -28,932 189,061 93,403 132,186 92,571
(0.2) (-3.2)** (-1.1) (4.5)** (2.8)** (4.8)** (3.5)**
55-64 129,669 44,139 -45,141 -6,105 257,531 224,206 235,369 205,014
(0.9) (-1.0) (-0.1) (3.9)** (3.5)** (5.0)** (4.4)**
65+ 86,232 46,547 29,231 23,021 252,579 237,380 157,788 161,485
(1.5) (1.3) (0.9) (2.9)** (3.2)** (5.9)** (6.1)**
8. Controlling for year, age and education (2001-2018)
45+ 200,534 29,547 -15,851 -8,593 214,613 163,973 158,076 140,761
(1.2) (-0.8) (-0.4) (5.2)** (4.8)** (6.9)** (6.4)**

90
Table A.6: Household net wealth
Mean for SWWC, and difference from SWWC for other groups
Single women without children
(1)
Single men
without children
(2)
Single women
with children
(3)
Single men with
children (4)
Partnered women without children
(5)
Partnered men
without children
(6)
Partnered women
with children
(7)
Partnered men with
children (8)
1. Average (pooled 2001-2018)
45+ 647,206 25,128 -165,454 -135,546 671,697 419,522 466,135 454,811
(0.4) (-3.3)** (-2.3)** (6.4)** (4.6)** (8.2)** (8.0)**
2. Average (2018)
45+ 725,124 -89,922 -227,774 -171,154 631,133 547,069 506,468 498,389
(-1.1) (-3.7)** (-2.2)** (5.0)** (4.9)** (7.5)** (7.4)**
3. Controlling for year (2001-2018)
45+ 927,353 3,706 -153,873 -134,757 662,011 417,497 479,282 472,791
(0.1) (-3.1)** (-2.3)** (6.2)** (4.6)** (8.4)** (8.3)**
4. Controlling for year, separately for each age group (2001-2018)
45-54 797,898 94,685 -187,880 -171,031 686,190 292,421 467,132 425,218
(1.0) (-3.5)** (-3.0)** (7.3)** (3.9)** (8.4)** (7.6)**
55-64 1105315 -206,352 -300,289 -366,550 567,435 399,676 454,399 426,661
(-1.6) (-2.6)** (-3.2)** (3.1)** (2.7)** (3.9)** (3.6)**
65+ 911,867 86,510 -57,867 37,696 695,753 667,550 481,069 526,470
(0.9) (-1.1) (0.5) (3.5)** (3.3)** (7.2)** (8.0)**
5. Controlling for year and age (2001-2018)
45+ 1082487 10,326 -144,097 -147,319 648,177 405,776 451,277 450,088
(0.1) (-2.9)** (-2.6)** (6.1)** (4.5)** (8.1)** (8.1)**
6. Controlling for age (2018 only)
45+ 871,837 -84,358 -209,839 -178,119 601,154 544,636 479,471 474,560
(-1.0) (-3.4)** (-2.3)** (4.8)** (4.9)** (7.1)** (7.0)**
7. Controlling for year and education, separately for each age group (2001-2018)
45-54 428,416 232,477 -58,389 -21,875 673,563 381,198 558,931 499,692
(2.6)** (-1.1) (-0.4) (7.4)** (5.3)** (10.1)** (9.0)**
55-64 601,821 30,083 -94,585 -125,120 660,813 519,499 647,671 541,843
(0.2) (-0.8) (-1.1) (3.9)** (3.8)** (5.6)** (4.7)**
65+ 591,216 174,737 72,938 121,285 674,266 615,237 575,790 536,445
(1.7)* (1.1) (1.5) (3.7)** (3.4)** (7.2)** (7.1)**
8. Controlling for year, age and education (2001-2018)
45+ 674,508 172,307 4,577 3,385 658,739 485,041 575,252 518,189
(2.6)** (0.1) (0.1) (6.8)** (5.9)** (10.4)** (9.7)**

91
Table A.7: Self-rated prosperity (0=very poor to 5=prosperous)
Mean for SWWC, and difference from SWWC for other groups
Single women without children
(1)
Single men
without children
(2)
Single women
with children
(3)
Single men with
children (4)
Partnered women without children
(5)
Partnered men
without children
(6)
Partnered women
with children
(7)
Partnered men with
children (8)
1. Average (pooled 2001-2018)
45+ 2.70 -0.08 -0.14 -0.14 0.40 0.24 0.23 0.19
(-1.4) (-3.3)** (-2.8)** (6.5)** (4.2)** (5.4)** (4.6)**
2. Average (2018)
45+ 2.71 -0.12 -0.18 -0.21 0.40 0.21 0.23 0.21
(-1.6) (-2.9)** (-3.0)** (5.1)** (2.8)** (4.1)** (3.5)**
3. Controlling for year (2001-2018)
45+ 2.72 -0.08 -0.14 -0.14 0.40 0.24 0.23 0.19
(-1.4) (-3.2)** (-2.8)** (6.5)** (4.1)** (5.5)** (4.6)**
4. Controlling for year, separately for each age group (2001-2018)
45-54 2.73 -0.11 -0.33 -0.33 0.39 0.19 0.21 0.16
(-1.7)* (-5.8)** (-5.2)** (5.5)** (2.8)** (4.0)** (3.0)**
55-64 2.68 -0.12 -0.23 -0.16 0.45 0.32 0.27 0.22
(-1.5) (-3.3)** (-2.2)** (4.6)** (3.6)** (4.5)** (3.6)**
65+ 2.75 0.08 -0.02 0.02 0.38 0.27 0.20 0.19
(1.0) (-0.4) (0.3) (4.2)** (3.0)** (3.2)** (3.0)**
5. Controlling for year and age (2001-2018)
45+ 2.72 -0.05 -0.17 -0.15 0.42 0.26 0.24 0.20
(-1.0) (-3.9)** (-3.1)** (6.8)** (4.5)** (5.6)** (4.6)**
6. Controlling for age (2018 only)
45+ 2.71 -0.10 -0.20 -0.22 0.42 0.23 0.24 0.21
(-1.3) (-3.3)** (-3.2)** (5.4)** (3.1)** (4.2)** (3.5)**
7. Controlling for year and education, separately for each age group (2001-2018)
45-54 2.45 -0.01 -0.23 -0.21 0.39 0.25 0.29 0.22
(-0.1) (-4.2)** (-3.4)** (5.8)** (3.7)** (5.6)** (4.2)**
55-64 2.44 -0.01 -0.14 -0.06 0.46 0.37 0.36 0.27
(-0.2) (-2.0)** (-0.8) (5.1)** (4.2)** (5.8)** (4.3)**
65+ 2.63 0.13 0.03 0.05 0.40 0.26 0.25 0.20
(1.6) (0.5) (0.8) (4.7)** (2.9)** (4.2)** (3.4)**
8. Controlling for year, age and education (2001-2018)
45+ 2.50 0.04 -0.09 -0.07 0.43 0.30 0.31 0.23
(0.7) (-2.2)** (-1.5) (7.5)** (5.3)** (7.7)** (5.9)**

92
Table A.8: Home ownership - both with and without mortgage (%)
Mean for SWWC, and difference from SWWC for other groups
Single women without children
(1)
Single men
without children
(2)
Single women
with children
(3)
Single men with
children (4)
Partnered women without children
(5)
Partnered men
without children
(6)
Partnered women
with children
(7)
Partnered men with
children (8)
1. Average (pooled 2001-2018)
45+ 74% -7.9% -8.7% -13% 11% 6.3% 14% 13%
(-2.0)** (-3.1)** (-3.5)** (3.0)** (1.6) (4.5)** (4.2)**
2. Average (2018)
45+ 76% -11% -13% -19% 8.2% 2.0% 11% 10%
(-2.5)** (-3.9)** (-5.2)** (2.1)** (0.5) (3.5)** (3.2)**
3. Controlling for year (2001-2018)
45+ 73% -7.9% -8.8% -13% 11% 6.3% 14% 13%
(-2.0)** (-3.1)** (-3.5)** (3.0)** (1.6) (4.5)** (4.2)**
4. Controlling for year, separately for each age group (2001-2018)
45-54 62% -0.7% -12% -14% 18% 11% 22% 21%
(-0.1) (-2.2)** (-2.4)** (3.1)** (1.6) (4.1)** (3.9)**
55-64 77% -13% -14% -20% 9.0% 8.9% 12% 10%
(-2.0)** (-3.1)** (-4.2)** (2.0)* (2.0)** (3.2)** (2.6)**
65+ 84% -8.0% -11% -11% 7.4% 1.2% 4.3% 4.8%
(-1.5) (-3.0)** (-2.7)** (1.6) (0.2) (1.3) (1.5)
5. Controlling for year and age (2001-2018)
45+ 75% -6.7% -10% -14% 12% 7.2% 14% 13%
(-1.8)* (-3.6)** (-3.7)** (3.5)** (1.9)* (4.7)** (4.3)**
6. Controlling for age (2018 only)
45+ 78% -9.3% -15% -20% 9.6% 3.2% 12% 10%
(-2.2)** (-4.2)** (-5.3)** (2.5)** (0.8) (3.6)** (3.2)**
7. Controlling for year and education, separately for each age group (2001-2018)
45-54 53% 1.7% -10% -13% 18% 12% 24% 22%
(0.3) (-1.8)* (-2.1)** (3.0)** (1.7)* (4.3)** (3.9)**
55-64 71% -12% -13% -19% 9.1% 8.8% 14% 10%
(-1.9)* (-2.8)** (-4.0)** (2.0)** (2.0)** (3.6)** (2.6)**
65+ 81% -7.4% -9.9% -11% 7.6% 0.7% 5.1% 4.3%
(-1.4) (-2.6)** (-2.8)** (1.6)* (0.2) (1.6) (1.3)
8. Controlling for year, age and education (2001-2018)
45+ 69% -5.1% -8.7% -13% 12% 7.4% 15% 13%
(-1.4) (-3.1)** (-3.6)** (3.4)** (1.9)* (5.2)** (4.2)**

93
Table A.9: Housing costs by family status ($2017-18)
Mean for SWWC, and difference from SWWC for other groups
Single women without children
(1)
Single men
without children
(2)
Single women
with children
(3)
Single men with
children (4)
Partnered women without children
(5)
Partnered men
without children
(6)
Partnered women
with children
(7)
Partnered men with
children (8)
1. Average (pooled 2001-2018)
45+ 6,059 1,650 1,059 2,643 4,888 5,823 3,742 4,842
(1.8)* (2.0)** (3.5)** (5.0)** (6.1)** (6.1)** (7.9)**
2. Average (2018)
45+ 6,598 1,913 1,841 2,340 4,941 5,808 6,421 7,452
(1.8)* (2.3)** (2.6)** (3.9)** (4.6)** (7.6)** (8.7)**
3. Controlling for year (2001-2018)
45+ 7,722 1,540 1,102 2,579 4,761 5,748 3,830 4,957
(1.7)* (2.1)** (3.4)** (5.0)** (6.0)** (6.2)** (8.1)**
4. Controlling for year, separately for each age group (2001-2018)
45-54 13,287 -98 2,716 3,091 6,692 7,265 6,588 8,657
(-0.1) (2.7)** (2.7)** (5.0)** (4.9)** (6.4)** (8.4)**
55-64 8,559 178 3,178 4,565 1,112 3,172 2,650 5,406
(0.2) (3.6)** (3.3)** (0.9) (2.7)** (2.9)** (5.9)**
65+ 2,021 2,126 2,274 2,579 355 1,658 1,289 1,776
(1.8)* (4.9)** (4.5)** (0.6) (2.8)** (3.2)** (4.5)**
5. Controlling for year and age (2001-2018)
45+ 6,943 -310 3,574 3,753 2,971 4,172 3,618 5,374
(-0.4) (7.7)** (5.7)** (3.5)** (5.1)** (6.8)** (10.2)**
6. Controlling for age (2018 only)
45+ 6,535 -407 4,230 3,415 2,802 3,943 6,051 7,854
(-0.4) (4.8)** (3.7)** (2.2)** (3.4)** (6.8)** (8.7)**
7. Controlling for year and education, separately for each age group (2001-2018)
45-54 9,541 1,344 4,011 4,728 6,577 7,967 7,644 9,506
(1.0) (4.3)** (4.5)** (5.2)** (5.7)** (7.9)** (9.8)**
55-64 6,401 911 3,868 5,346 1,121 3,439 3,298 5,694
(0.8) (4.3)** (3.6)** (0.9) (2.9)** (3.6)** (6.1)**
65+ 1,643 2,380 2,458 2,842 398 1,827 1,466 1,947
(2.1)** (5.2)** (5.2)** (0.7) (3.0)** (3.3)** (4.3)**
8. Controlling for year, age and education (2001-2018)
45+ 5,157 539 4,295 4,610 2,979 4,581 4,265 5,854
(0.6) (8.9)** (6.8)** (3.5)** (5.6)** (7.8)** (10.7)**

94
Table A.10: Could not pay utility bills on time (%)
Mean for SWWC, and difference from SWWC for other groups
Single women without children
(1)
Single men
without children
(2)
Single women
with children
(3)
Single men with
children (4)
Partnered women without children
(5)
Partnered men
without children
(6)
Partnered women
with children
(7)
Partnered men with
children (8)
1. Average (pooled 2001-2018)
45+ 9.4% 0.5% 6.1% 5.4% -4.5% -2.9% -2.1% -2.0%
(0.3) (4.6)** (3.4)** (-3.1)** (-1.8)* (-1.6) (-1.6)
2. Average (2018)
45+ 8.0% 0.2% 8.4% 5.8% -4.3% -1.2% -0.2% -1.2%
(0.1) (3.6)** (2.4)** (-2.0)** (-0.5) (-0.1) (-0.6)
3. Controlling for year (2001-2018)
45+ 8.3% 0.5% 6.1% 5.4% -4.5% -2.8% -2.1% -2.1%
(0.3) (4.6)** (3.4)** (-3.1)** (-1.8)* (-1.6) (-1.6)
4. Controlling for year, separately for each age group (2001-2018)
45-54 11% -1.2% 16% 10% -5.9% -4.1% -2.4% -2.1%
(-0.5) (7.0)** (4.1)** (-2.7)** (-1.8)* (-1.3) (-1.1)
55-64 9.2% -1.4% 6.3% 5.2% -6.5% -6.4% -4.2% -3.6%
(-0.5) (2.6)** (1.9)* (-2.8)** (-2.7)** (-1.8)* (-1.7)*
65+ 4.4% 2.8% 3.9% 3.3% -3.2% 1.0% -0.1% -0.0%
(1.6) (3.1)** (2.4)** (-2.9)** (0.5) (-0.1) (-0.0)
5. Controlling for year and age (2001-2018)
45+ 7.8% -0.7% 7.7% 6.2% -5.7% -3.9% -2.3% -1.8%
(-0.4) (5.9)** (4.0)** (-4.0)** (-2.5)** (-1.8)* (-1.4)
6. Controlling for age (2018 only)
45+ 7.3% -1.0% 9.5% 6.3% -5.2% -2.1% -0.4% -1.0%
(-0.4) (4.1)** (2.6)** (-2.5)** (-0.9) (-0.2) (-0.5)
7. Controlling for year and education, separately for each age group (2001-2018)
45-54 15% -2.9% 15% 8.5% -5.8% -5.1% -3.7% -3.1%
(-1.2) (6.6)** (3.5)** (-2.8)** (-2.3)** (-2.0)** (-1.7)*
55-64 13% -2.8% 5.3% 4.0% -6.7% -7.1% -5.3% -4.1%
(-1.1) (2.2)** (1.5) (-2.9)** (-3.1)** (-2.4)** (-1.9)*
65+ 5.7% 2.3% 3.4% 2.9% -3.4% 0.7% -0.5% -0.2%
(1.3) (2.7)** (2.1)** (-2.9)** (0.3) (-0.5) (-0.2)
8. Controlling for year, age and education (2001-2018)
45+ 11% -2.0% 6.7% 5.1% -5.8% -4.6% -3.3% -2.4%
(-1.3) (5.2)** (3.4)** (-4.2)** (-3.0)** (-2.6)** (-1.9)*

95
Table A.11: Asked for financial help from friends or family (%)
Mean for SWWC, and difference from SWWC for other groups
Single women without children
(1)
Single men
without children
(2)
Single women
with children
(3)
Single men with
children (4)
Partnered women without children
(5)
Partnered men
without children
(6)
Partnered women
with children
(7)
Partnered men with
children (8)
1. Average (pooled 2001-2018)
45+ 9.3% -1.7% 3.1% 2.4% -5.5% -4.7% -4.9% -4.9%
(-1.1) (2.4)** (1.7)* (-4.5)** (-3.6)** (-4.3)** (-4.3)**
2. Average (2018)
45+ 11% -3.2% 2.8% 1.4% -4.3% -4.2% -5.9% -6.2%
(-1.1) (1.1) (0.5) (-1.6) (-1.5) (-2.7)** (-2.8)**
3. Controlling for year (2001-2018)
45+ 9.5% -1.7% 3.1% 2.3% -5.5% -4.7% -4.9% -4.9%
(-1.2) (2.4)** (1.7)* (-4.5)** (-3.6)** (-4.3)** (-4.3)**
4. Controlling for year, separately for each age group (2001-2018)
45-54 15% -5.3% 9.9% 6.7% -9.4% -9.0% -7.9% -7.7%
(-2.2)** (4.0)** (2.6)** (-4.4)** (-3.9)** (-3.8)** (-3.7)**
55-64 10% -1.6% 6.9% 3.3% -5.8% -4.7% -5.2% -4.9%
(-0.7) (3.3)** (1.5) (-3.1)** (-2.4)** (-3.0)** (-2.9)**
65+ 2.9% 0.0% 2.0% 0.8% -2.3% -0.6% -1.0% -0.9%
(0.0) (2.0)** (0.8) (-2.5)** (-0.5) (-1.1) (-1.0)
5. Controlling for year and age (2001-2018)
45+ 9.4% -3.1% 4.9% 3.2% -6.8% -5.8% -5.2% -4.8%
(-2.1)** (3.8)** (2.4)** (-5.7)** (-4.5)** (-4.6)** (-4.2)**
6. Controlling for age (2018 only)
45+ 11% -4.7% 4.3% 1.9% -5.7% -5.4% -6.3% -6.2%
(-1.7)* (1.7)* (0.7) (-2.1)** (-2.0)** (-2.9)** (-2.8)**
7. Controlling for year and education, separately for each age group (2001-2018)
45-54 17% -6.2% 9.0% 5.7% -9.3% -9.6% -8.6% -8.2%
(-2.5)** (3.6)** (2.2)** (-4.4)** (-4.1)** (-4.1)** (-3.9)**
55-64 11% -2.4% 6.4% 2.7% -5.9% -5.1% -5.8% -5.2%
(-1.1) (3.1)** (1.2) (-3.2)** (-2.6)** (-3.4)** (-3.1)**
65+ 2.8% 0.1% 2.1% 0.8% -2.2% -0.8% -1.0% -0.9%
(0.1) (2.1)** (0.8) (-2.4)** (-0.6) (-1.1) (-1.0)
8. Controlling for year, age and education (2001-2018)
45+ 11% -3.7% 4.4% 2.7% -6.9% -6.2% -5.7% -5.1%
(-2.6)** (3.4)** (1.9)* (-5.8)** (-4.8)** (-5.0)** (-4.6)**

96
Table A.12: Asked for financial help from welfare organisations (%)
Mean for SWWC, and difference from SWWC for other groups
Single women without children
(1)
Single men
without children
(2)
Single women
with children
(3)
Single men with
children (4)
Partnered women without children
(5)
Partnered men
without children
(6)
Partnered women
with children
(7)
Partnered men with
children (8)
1. Average (pooled 2001-2018)
45+ 3.0% 0.6% 2.3% 3.0% -1.8% -1.8% -1.6% -1.4%
(0.8) (3.5)** (3.8)** (-2.8)** (-3.0)** (-2.9)** (-2.5)**
2. Average (2018)
45+ 2.0% 4.0% 3.0% 3.7% 0.3% 0.4% -0.6% -0.7%
(2.2)** (2.8)** (2.5)** (0.2) (0.3) (-0.6) (-0.8)
3. Controlling for year (2001-2018)
45+ 3.0% 0.6% 2.3% 3.0% -1.8% -1.8% -1.6% -1.4%
(0.8) (3.5)** (3.8)** (-2.8)** (-3.0)** (-2.9)** (-2.5)**
4. Controlling for year, separately for each age group (2001-2018)
45-54 2.5% 1.9% 7.3% 8.5% -1.2% -1.3% -0.9% -0.7%
(1.9)* (7.9)** (5.8)** (-1.7)* (-2.1)** (-1.5) (-1.1)
55-64 5.0% -1.6% 2.1% 0.7% -3.7% -3.6% -3.5% -3.0%
(-1.1) (1.3) (0.5) (-2.8)** (-2.8)** (-2.8)** (-2.5)**
65+ 2.0% 0.1% 0.1% 0.4% -0.9% -0.7% -0.8% -0.8%
(0.1) (0.2) (0.5) (-0.8) (-0.9) (-1.3) (-1.3)
5. Controlling for year and age (2001-2018)
45+ 3.0% 0.3% 2.7% 3.2% -2.1% -2.1% -1.7% -1.3%
(0.4) (4.1)** (4.0)** (-3.3)** (-3.4)** (-3.0)** (-2.4)**
6. Controlling for age (2018 only)
45+ 2.1% 3.7% 3.4% 3.9% -0.0% 0.1% -0.6% -0.7%
(2.0)** (3.2)** (2.6)** (-0.0) (0.1) (-0.7) (-0.8)
7. Controlling for year and education, separately for each age group (2001-2018)
45-54 4.4% 1.3% 6.7% 7.8% -1.1% -1.6% -1.4% -1.1%
(1.3) (7.4)** (5.4)** (-1.6) (-2.5)** (-2.3)** (-1.7)*
55-64 6.3% -2.0% 1.8% 0.3% -3.7% -3.8% -3.9% -3.1%
(-1.4) (1.1) (0.2) (-2.8)** (-2.9)** (-3.1)** (-2.5)**
65+ 2.1% 0.1% 0.1% 0.5% -0.8% -0.7% -0.8% -0.7%
(0.1) (0.2) (0.7) (-0.8) (-0.8) (-1.2) (-1.1)
8. Controlling for year, age and education (2001-2018)
45+ 4.1% -0.1% 2.4% 2.9% -2.1% -2.2% -2.0% -1.5%
(-0.1) (3.5)** (3.7)** (-3.3)** (-3.7)** (-3.4)** (-2.7)**

97
Table A.13: SEIFA 2011 advantage/disadvantage decile (10=highest)
Mean for SWWC, and difference from SWWC for other groups
Single women without children
(1)
Single men
without children
(2)
Single women
with children
(3)
Single men with
children (4)
Partnered women without children
(5)
Partnered men
without children
(6)
Partnered women
with children
(7)
Partnered men with
children (8)
1. Average (pooled 2001-2018)
45+ 5.4 -0.4 -0.5 -0.8 0.7 0.6 0.4 0.4
(-1.7)* (-3.0)** (-3.5)** (2.7)** (2.3)** (2.2)** (2.2)**
2. Average (2018)
45+ 5.2 -0.2 -0.3 -0.6 0.6 0.6 0.9 0.9
(-0.8) (-1.3) (-2.4)** (2.2)** (2.0)** (4.1)** (3.9)**
3. Controlling for year (2001-2018)
45+ 5.5 -0.4 -0.5 -0.8 0.7 0.6 0.4 0.4
(-1.7)* (-3.0)** (-3.6)** (2.7)** (2.3)** (2.2)** (2.2)**
4. Controlling for year, separately for each age group (2001-2018)
45-54 5.4 -0.3 -0.4 -0.6 1.1 0.7 0.7 0.7
(-0.7) (-1.3) (-1.7)* (3.0)** (1.8)* (2.0)** (2.0)**
55-64 5.9 -0.9 -0.7 -1.0 0.2 0.5 0.1 0.2
(-2.2)** (-2.5)** (-3.1)** (0.5) (1.2) (0.5) (0.8)
65+ 5.4 -0.3 -0.4 -0.7 0.2 0.5 0.4 0.4
(-0.8) (-1.5) (-2.4)** (0.5) (1.2) (1.3) (1.3)
5. Controlling for year and age (2001-2018)
45+ 5.6 -0.5 -0.5 -0.8 0.6 0.5 0.4 0.5
(-1.9)* (-2.5)** (-3.4)** (2.4)** (2.1)** (2.1)** (2.2)**
6. Controlling for age (2018 only)
45+ 5.3 -0.3 -0.2 -0.5 0.6 0.5 0.9 0.9
(-0.9) (-1.0) (-2.3)** (2.0)** (1.8)* (4.1)** (4.0)**
7. Controlling for year and education, separately for each age group (2001-2018)
45-54 3.9 0.2 0.0 -0.1 1.0 0.9 1.1 0.9
(0.5) (0.0) (-0.3) (2.6)** (2.1)** (2.9)** (2.4)**
55-64 4.6 -0.5 -0.3 -0.6 0.2 0.6 0.5 0.3
(-1.3) (-1.1) (-2.0)** (0.6) (1.6) (1.8)* (1.2)
65+ 4.6 -0.0 -0.1 -0.6 0.3 0.5 0.6 0.4
(-0.1) (-0.4) (-2.0)** (0.6) (1.2) (2.2)** (1.5)
8. Controlling for year, age and education (2001-2018)
45+ 4.4 -0.1 -0.1 -0.4 0.6 0.7 0.8 0.6
(-0.3) (-0.4) (-1.9)* (2.4)** (2.6)** (3.7)** (2.7)**

98
Table A.14: SF-36 General health score
Mean for SWWC, and difference from SWWC for other groups
Single women without children
(1)
Single men
without children
(2)
Single women
with children
(3)
Single men with
children (4)
Partnered women without children
(5)
Partnered men
without children
(6)
Partnered women
with children
(7)
Partnered men with
children (8)
1. Average (pooled 2001-2018)
45+ 63.2 -3.9 -3.4 -3.1 5.0 1.7 2.4 0.8
(-2.2)** (-2.2)** (-2.0)** (2.9)** (1.0) (1.8)* (0.6)
2. Average (2018)
45+ 61.0 -2.6 -2.0 -3.4 6.5 1.8 3.3 2.3
(-1.2) (-1.1) (-1.8)* (2.9)** (0.8) (1.9)* (1.4)
3. Controlling for year (2001-2018)
45+ 62.1 -3.9 -3.4 -3.0 5.0 1.7 2.4 0.8
(-2.2)** (-2.2)** (-2.0)** (2.9)** (1.1) (1.8)* (0.6)
4. Controlling for year, separately for each age group (2001-2018)
45-54 61.1 -0.1 1.1 -0.2 7.9 4.6 6.0 5.6
(-0.0) (0.5) (-0.1) (3.4)** (1.9)* (3.1)** (2.8)**
55-64 61.5 -5.6 -2.8 -3.9 5.8 1.0 2.7 1.3
(-2.1)** (-1.3) (-1.8)* (2.4)** (0.5) (1.5) (0.7)
65+ 64.5 -10.0 -6.7 -5.2 -2.8 -2.7 -2.4 -4.7
(-3.2)** (-3.3)** (-2.4)** (-1.0) (-1.1) (-1.2) (-2.4)**
5. Controlling for year and age (2001-2018)
45+ 62.2 -4.9 -1.9 -2.3 3.9 0.8 2.2 0.9
(-2.7)** (-1.3) (-1.5) (2.3)** (0.5) (1.6) (0.7)
6. Controlling for age (2018 only)
45+ 60.9 -3.6 -0.9 -3.0 5.5 1.0 3.1 2.4
(-1.7)* (-0.5) (-1.6) (2.4)** (0.5) (1.8)* (1.4)
7. Controlling for year and education, separately for each age group (2001-2018)
45-54 56.1 1.1 2.2 1.0 7.8 5.0 7.0 6.0
(0.5) (1.0) (0.5) (3.3)** (2.0)** (3.5)** (3.0)**
55-64 56.2 -3.8 -1.2 -2.2 6.1 1.8 4.3 1.9
(-1.4) (-0.6) (-1.0) (2.6)** (0.9) (2.4)** (1.1)
65+ 62.0 -9.6 -5.9 -5.2 -2.7 -3.0 -1.8 -5.0
(-3.1)** (-2.9)** (-2.4)** (-0.9) (-1.2) (-0.9) (-2.5)**
8. Controlling for year, age and education (2001-2018)
45+ 58.2 -3.7 -0.8 -1.5 4.0 1.3 3.2 1.2
(-2.0)** (-0.5) (-1.0) (2.3)** (0.8) (2.4)** (0.9)

99
Table A.15: SF-36 Mental health score
Mean for SWWC, and difference from SWWC for other groups
Single women without children
(1)
Single men
without children
(2)
Single women
with children
(3)
Single men with
children (4)
Partnered women without children
(5)
Partnered men
without children
(6)
Partnered women
with children
(7)
Partnered men with
children (8)
1. Average (pooled 2001-2018)
45+ 73.6 -1.4 -1.8 -1.0 2.3 2.7 1.2 3.3
(-1.3) (-1.9)* (-0.9) (1.8)* (2.1)** (1.3) (3.6)**
2. Average (2018)
45+ 72.2 -1.8 -1.0 -1.9 2.3 1.8 2.1 4.7
(-1.1) (-0.7) (-1.2) (1.3) (1.0) (1.5) (3.4)**
3. Controlling for year (2001-2018)
45+ 73.1 -1.3 -1.8 -1.0 2.3 2.7 1.2 3.3
(-1.3) (-1.8)* (-0.9) (1.8)* (2.1)** (1.3) (3.6)**
4. Controlling for year, separately for each age group (2001-2018)
45-54 70.4 -0.8 -3.6 -3.2 3.3 3.6 2.0 4.2
(-0.5) (-2.6)** (-2.3)** (2.2)** (2.3)** (1.7)* (3.5)**
55-64 71.8 1.5 -2.8 -1.2 4.0 4.1 2.7 4.5
(0.9) (-1.8)* (-0.7) (1.9)* (2.2)** (2.0)** (3.4)**
65+ 77.1 -3.1 -2.5 -0.4 0.7 1.3 -1.1 0.8
(-1.7)* (-1.7)* (-0.2) (0.3) (0.6) (-0.7) (0.5)
5. Controlling for year and age (2001-2018)
45+ 73.3 -0.9 -2.5 -1.3 2.7 3.1 1.2 3.1
(-0.8) (-2.5)** (-1.3) (2.2)** (2.4)** (1.4) (3.5)**
6. Controlling for age (2018 only)
45+ 72.0 -1.2 -1.8 -2.2 2.8 2.3 2.1 4.5
(-0.7) (-1.2) (-1.4) (1.6) (1.3) (1.5) (3.3)**
7. Controlling for year and education, separately for each age group (2001-2018)
45-54 68.3 -0.3 -3.2 -2.8 3.2 3.7 2.4 4.3
(-0.2) (-2.3)** (-1.9)* (2.2)** (2.4)** (2.0)* (3.5)**
55-64 68.6 2.6 -1.9 -0.2 4.1 4.6 3.6 4.8
(1.6) (-1.2) (-0.1) (1.9)* (2.4)** (2.7)** (3.6)**
65+ 75.1 -2.8 -1.8 -0.3 0.7 1.0 -0.5 0.6
(-1.5) (-1.2) (-0.2) (0.3) (0.5) (-0.3) (0.4)
8. Controlling for year, age and education (2001-2018)
45+ 70.8 -0.1 -1.8 -0.9 2.8 3.3 1.9 3.3
(-0.1) (-1.8)* (-0.8) (2.2)** (2.6)** (2.1)** (3.6)**

100
Table A.16: Hours/week caring for a disabled/elderly relative
Mean for SWWC, and difference from SWWC for other groups
Single women without children
(1)
Single men
without children
(2)
Single women
with children
(3)
Single men with
children (4)
Partnered women without children
(5)
Partnered men
without children
(6)
Partnered women
with children
(7)
Partnered men with
children (8)
1. Average (pooled 2001-2018)
45+ 5.85 -2.92 -2.63 -3.05 -1.95 -3.44 -2.50 -3.89
(-2.1)** (-1.9)* (-2.1)** (-1.2) (-2.4)** (-1.8)* (-2.9)**
2. Average (2018)
45+ 4.05 -1.66 0.57 -0.88 0.39 -1.42 -0.75 -2.22
(-1.3) (0.4) (-0.7) (0.3) (-1.1) (-0.7) (-2.1)**
3. Controlling for year (2001-2018)
45+ 5.86 -2.92 -2.62 -3.05 -1.95 -3.44 -2.48 -3.88
(-2.1)** (-1.9)* (-2.1)** (-1.2) (-2.4)** (-1.8)* (-2.9)**
4. Controlling for year, separately for each age group (2001-2018)
45-54 3.43 0.13 0.32 -0.14 -1.37 -1.47 -1.16 -2.42
(0.1) (0.4) (-0.1) (-1.7)* (-1.8)* (-1.5) (-3.3)**
55-64 11.33 -8.53 -5.38 -7.13 -5.54 -8.47 -7.69 -9.03
(-2.4)** (-1.4) (-1.9)* (-1.4) (-2.3)** (-2.2)** (-2.5)**
65+ 4.12 -2.93 -2.52 -2.72 1.03 -1.59 0.16 -1.64
(-1.4) (-1.2) (-1.3) (0.4) (-0.7) (0.1) (-0.8)
5. Controlling for year and age (2001-2018)
45+ 6.32 -2.84 -2.71 -3.13 -1.94 -3.42 -2.55 -3.96
(-2.1)** (-1.9)* (-2.2)** (-1.2) (-2.4)** (-1.9)* (-2.9)**
6. Controlling for age (2018 only)
45+ 4.77 -1.66 0.76 -0.84 0.31 -1.53 -0.83 -2.26
(-1.3) (0.6) (-0.7) (0.2) (-1.2) (-0.8) (-2.2)**
7. Controlling for year and education, separately for each age group (2001-2018)
45-54 4.61 -0.21 0.02 -0.48 -1.37 -1.59 -1.43 -2.55
(-0.2) (0.0) (-0.4) (-1.6) (-1.9)* (-1.9)* (-3.4)**
55-64 12.80 -8.82 -5.70 -7.46 -5.48 -8.44 -8.05 -9.04
(-2.5)** (-1.5) (-2.0)** (-1.4) (-2.4)** (-2.3)** (-2.5)**
65+ 4.31 -2.81 -2.56 -2.59 1.04 -1.37 0.16 -1.49
(-1.4) (-1.2) (-1.3) (0.4) (-0.6) (0.1) (-0.8)
8. Controlling for year, age and education (2001-2018)
45+ 7.23 -3.08 -2.99 -3.32 -1.95 -3.44 -2.80 -4.01
(-2.2)** (-2.1)** (-2.3)** (-1.2) (-2.4)** (-2.1)** (-2.9)**

100
Table A.17: Percentage of years working (after full-time education)
Mean for SWWC, and difference from SWWC for other groups
Single women without children
(1)
Single men
without children
(2)
Single women
with children
(3)
Single men with
children (4)
Partnered women without children
(5)
Partnered men
without children
(6)
Partnered women
with children
(7)
Partnered men with
children (8)
1. Average (pooled 2001-2018)
45+ 76% 3.2% -23% 5.2% 6.0% 12% -15% 12%
(1.4) (-12.2)** (2.9)** (2.9)** (6.2)** (-8.6)** (7.5)**
2. Average (2018)
45+ 74% 4.1% -18% 5.5% 10% 13% -8.3% 14%
(1.6) (-7.8)** (2.4)** (4.3)** (5.3)** (-3.7)** (6.5)**
3. Controlling for year (2001-2018)
45+ 77% 3.1% -23% 5.1% 5.9% 12% -15% 12%
(1.3) (-12.2)** (2.9)** (2.9)** (6.2)** (-8.6)** (7.5)**
4. Controlling for year, separately for each age group (2001-2018)
45-54 84% -1.6% -16% 2.6% 4.5% 6.6% -14% 9.8%
(-0.6) (-6.4)** (1.1) (1.9)* (2.8)** (-6.3)** (4.7)**
55-64 83% -3.1% -18% 2.3% -0.2% 8.0% -17% 9.7%
(-0.9) (-7.0)** (1.0) (-0.1) (3.4)** (-7.7)** (4.7)**
65+ 67% 11% -21% 12% 3.6% 16% -17% 17%
(3.4)** (-8.8)** (5.4)** (1.0) (5.9)** (-6.9)** (7.6)**
5. Controlling for year and age (2001-2018)
45+ 82% 0.0% -18% 6.7% 1.9% 8.2% -17% 11%
(0.0) (-10.8)** (4.1)** (1.0) (4.7)** (-10.8)** (8.0)**
6. Controlling for age (2018 only)
45+ 78% 1.4% -14% 6.7% 7.1% 9.7% -9.6% 14%
(0.6) (-6.3)** (3.0)** (3.0)** (4.1)** (-4.5)** (6.6)**
7. Controlling for year and education, separately for each age group (2001-2018)
45-54 75% 0.6% -15% 4.2% 4.6% 7.0% -12% 10%
(0.3) (-6.1)** (1.9)* (2.0)** (3.0)** (-5.9)** (5.0)**
55-64 75% -1.4% -16% 3.5% 0.1% 8.1% -15% 9.6%
(-0.4) (-6.4)** (1.5) (0.0) (3.4)** (-7.0)** (4.7)**
65+ 61% 12% -19% 13% 4.0% 15% -16% 17%
(3.5)** (-7.5)** (5.2)** (1.1) (5.2)** (-5.9)** (6.9)**
8. Controlling for year, age and education (2001-2018)
45+ 75% 1.8% -16% 7.5% 2.0% 8.3% -15% 11%
(0.8) (-9.8)** (4.7)** (1.1) (4.7)** (-9.7)** (7.9)**
102
Appendix B. Online community questions
Day 1
Introduction Thanks again for joining us! We’d like to start off by hearing a bit about the things you think are important to your financial security.
Could you tell us what you think is most important in shaping how financially secure you feel now and into the future?
Do you think that being a woman has affected, and still affects, your capacity to build financial security now and into the future? Could you describe how?
Theme 1: Factors shaping financial security
Employment
Could you tell us a bit about your experience and patterns of employment (such as for how long you have worked, whether you work/worked full time/part time)?
If you have worked part time, could you tell us a bit about why you were working part time? Have you had any substantial interruptions to your employment (such as because of unemployment,
illness, care responsibilities)? Do you think being single has affected, or still affects, your opportunities in employment? Do you think not having children has affected, or still affects, your employment opportunities?
Housing
In what ways does housing contribute to your financial security? What has been your experience of finding suitable housing, such as finding a suitable rental
property, buying a house, or finding other forms of housing? Do you think being single has affected, or still affects, your housing options over time? In what
way/s? From your experience, in what ways does being single affect your costs of living? Do you think not having children has affected, or still affects, your housing options over time? In
what way/s? If you have experienced challenges in finding suitable housing, how have you managed these
challenges? Who provides you with help and support in these situations?

103
Day 2
Theme 2: Informal and formal support
Friends and family
Are friends and family important to your sense of financial security now and into the future? In what ways?
If you have been divorced or separated, how did divorce/separation affect your capacity to build financial security?
Government support
What is your experience of navigating the taxation system? From your experience, in what ways does your relationship and family status shape the way in
which you are taxed? Do you think being single has affected, or still affects, your access to government payments (such as
the age pension, Carer Payment Disability Support Pension etc)? In what way/s? What could governments do better to support you to be financially secure?
Day 3
Theme 3: Plans for the future
Future plans
How important is your superannuation to your financial security in later life? Could you tell us about your plans or wishes for your future aged care needs?
Financial institutions and planning
Could you tell us about some of the things you have done or are doing to be financially secure in later life?
Have you ever sought financial advice about your current or future financial security? Could you tell us about how useful it was? Have you ever felt like financial institutions treated you differently because you are single? Have you ever felt like financial institutions treated you differently because you do not have
children? How could financial institutions better support you to be financially secure? What type of financial advice would support you to be financially secure? Do you have anything else you would like to add?

104
Appendix C. Stakeholder Interviews – Topic Guide
1) Role and background
Can you tell me briefly about your role and the work you do? What is your experience of working with older single women without children?
2) Characteristics of older, single women
How do you think being a woman affects a person’s capacity to build a financially secure old age? How do you think being single affects a person’s capacity to build a financially secure old age? How do you think not having children affects a person’s capacity to build a financially secure old
age? Do you think these characteristics (gender, single, not having children) affects access to government
transfers and other supports and treatment in the tax system?
3) Impact of employment
From your experience, what are the most important aspects of employment for single older women? − Prompts: wage, conditions, permanent, flexibility, access to benefits, superannuation
4) Impact of housing
From your experience, what are the factors shaping the access by this group to housing, including both the housing market and the private rental market?
5) Residential aged care options
From your experience, what are the factors shaping the access by this group to formal aged care services and other aged care options (i.e. retirement villages etc)?
6) Impact of relationship breakdown
From your experience, does having one/more than one divorce/separation make a difference for single women’s financial security?
− Do you have any ideas for how to provide better financial support and advice to older single women who have experienced/are experiencing divorce/separation?
7) Impact of caring for others
From your experience, does caring for family affect women’s financial security? − If so, is there anything that could be done to mitigate these challenges?
8) Financial advice and policy
− What is the best financial advice for single women without children in in preparing for older age, including for navigating the tax/transfer system?
− Are there any common characteristics or factors among older single women who ARE financially secure?
− How do you think policy could better support this group to have financially secure retirements?

For more Information
Associate Professor Myra [email protected] University of Sydney BusinessSchool
Produced by The University ofSydney, November 2020. The University reserves the right tomake alterations to any informationcontained within this publicationwithout notice.ISBN: 978-1-74210-482-9
CRICOS: 00026A