security analysis, agency costs, and company...
TRANSCRIPT

_____________________ John A. Doukas is Professor of Finance at Old Dominion University, Chansog (Francis) Kim is Assistant Professor of Accounting at Queens College of the City University of New York, and Christos Pantzalis is Assistant Professor of Finance at the University of South Florida.
Security Analysis, Agency Costs, and Company Characteristics John A. Doukas, Chansog Kim, and Christos Pantzalis
We appraise the monitoring activity of security analysis from the perspective of the manager–shareholder conflict. Using a data set of more than 7,000 company-year observations for manufacturing companies tracked by security analysts over the 1988–94 period, we found that security analysis acts as a monitor to reduce the agency costs associated with the separation of ownership and control. We also found, however, that security analysts are more effective in reducing managerial non-value-maximizing behavior for single-segment than for multisegment companies. In addition, the shareholder gains from the monitoring activity of security analysis are larger for single-segment than for multisegment companies.
Despite numerous studies on the information content and valuation effects of
analysts’ forecasts, little is known about the effect of security analysis on the
agency costs of companies with different characteristics. Does security analysis
act as a monitoring mechanism to reduce the agency costs associated with the
separation of ownership and control of the company, and if so, to what extent is
its effectiveness related to the characteristics of the company? These two
questions remain largely unanswered.
Corporate managers have many personal objectives that are not always
consistent with the maximization of shareholder value. And although many
papers have examined the effectiveness of various internal and external
disciplinary mechanisms in terms of restricting managers’ non-value-
maximizing conduct, security analysis as an agency-cost monitoring device has
been largely unexplored. This omission is surprising in light of investors’ wide
use of analyst earnings forecasts in investment decisions and the great

2 influence forecasts (rather than historical measures of growth) have on stock
prices. Several researchers have examined the determinants of security analysis
(Bhushan 1989; Moyer, Chatfield, and Sisneros 1989; Brennan and Hughes
1991) and the valuation effects of security analysis (Chung and Jo 1996). But
although these studies provided interesting insights into the effects of security
analysts, they did not directly examine the effects of security analysis on the
conflict between managers and shareholders. In addition, the relative
effectivenes of security analysis for companies with different industrial
structures has been overlooked.
Jensen and Meckling (1976) argued that the monitoring activity of
security analysis helps reduce the agency costs associated with the separation
of ownership and control by restricting the non-value-maximizing behavior of
managers. Thus, agency costs should decline as a result of the monitoring
activity of security analysts. We set out to address this issue.
Our research was designed to test, first, whether security analysis serves
as an external monitoring device in terms of reducing agency costs (i.e.,
restricting managers’ non-value-maximizing behavior) as do such internal and
external monitoring mechanisms as independent boards of directors, bond
ratings, investment banks, and takeovers. Second, because non-value-
maximizing conduct by managers is more likely to occur in multisegment
(diversified) than single-segment (focused) companies, we also investigated
whether the monitoring effectiveness of security analysis is related to the
diversification of the company among industries.1 Our investigation of this
1 Nanda and Narayanan (1997) and Harris, Kriebel, and Raviv (1982), among others, argued that
informational asymmetries are more pronounced in diversified than in focused companies. Agency costs associated with overinvestment activity may also arise from managerial compensation that is

3 dimension was also motivated by the growing interest of the academic and
business communities in the causes of the value loss associated with
diversification into different lines of business (e.g., Berger and Ofek 1995; Lang
and Stulz 1994; Comment and Jarrell 1995; Servaes 1996). The general belief is
that diversification fails to increase shareholder value because it creates
overinvestment and agency costs (Jensen 1986; Stulz 1990; Denis, Denis, and
Sarin 1997, among others) and because of inefficiencies in the company’s
internal capital market (Lamont 1997; Shin and Stulz 1998; Rajan, Servaes, and
Zingales 2000). 2
We hypothesized that the monitoring effectiveness of security analysis will
be lower for diversified than for focused companies because multisegment
companies are more complex organizations, subject to greater agency costs, and
harder for analysts to assess and monitor. For a number of reasons, analysts can
produce more accurate information and monitoring for focused than for
diversified companies.3 A trend in the issuance of “tracking stock” may be
traced to the difficulty analysts have in analyzing diversified companies
Tracking stock is a class of stock whose value tracks the performance of a
company’s particular business segment or division. Several diversified
corporations have issued tracking stock in response to the information
acquisition burden, higher cost, and limitations faced by analysts in evaluating
tied to company size (Jensen and Murphy 1990) or from the managers’ desires to become indispensable to the company (Shleifer and Vishny 1989), to increase their power and prestige (Jensen 1986; Stulz 1990), or to reduce the risk to their personal wealth (Amihud and Lev 1981). 2 Recent industrial diversification literature (e.g., Denis, Denis, and Sarin; Berger and Ofek) documented a diversification discount. 3 Increased public awareness of the company due to its coverage by analysts can also result in
increased volume of trading and in higher market valuation (Merton 1987; Brennan and Hughes 1991).

4 the cash flows of multisegment companies.4 This aspect of our research put the
manager–shareholder conflict to a new test.
Sample
For this study, we used a data set of 7,485 manufacturing company-year
observations over the 1988–94 period to examine the monitoring effectiveness of
security analysts. The sample was constructed on the basis of the following
criteria:
• Companies were required to be classified in sectors with primary four-
digit SIC codes of less than 4,000;
• they had to be covered in the I/B/E/S summary database of 1995;
• they had to have financial data available in the 1994 Standard & Poor’s
Compustat Primary, Secondary, Tertiary, Full Coverage, and Research
databases;
• they also had to have available data from the Disclosure Database CD-Rom
on the ownership of the company’s common equity;
• they had to have business segment data available in the 1994 Standard &
Poor’s Compustat Business Segment Database.
We used analyst coverage data (i.e., the number of analysts following each
company) available in July of each year for the one-quarter-, one-year-, and
4 Tracking stock is also referred to as “alphabet stock,” “letter stock,” or “targeted stock.” Among the several companies that have adopted or proposed a tracking stock structure are CBS Corporation, General Motors Corporation, USX Corporation, Kmart Corporation, and U.S. West . Logue, Seward, and Walsh (1996) and Gilson, Healy, Noe, and Palepu (1998) found that analyst coverage and quality of analyst coverage (as measured by analyst forecast errors) increase following the issuance
of tracking stock. Billett and Mauer (1998) found that the introduction of tracking stock conveys information about the company’s internal capital market and its new corporate structure.
5 two-year-ahead forecasting horizons.5
These selection criteria produced 6,367 company-quarter observations for
the one-quarter-ahead forecasting horizon, 7,485 company-year observations for
the one-year-ahead forecasting horizon, and 6,771 company-year observations
for the two-year-ahead forecasting horizon.6
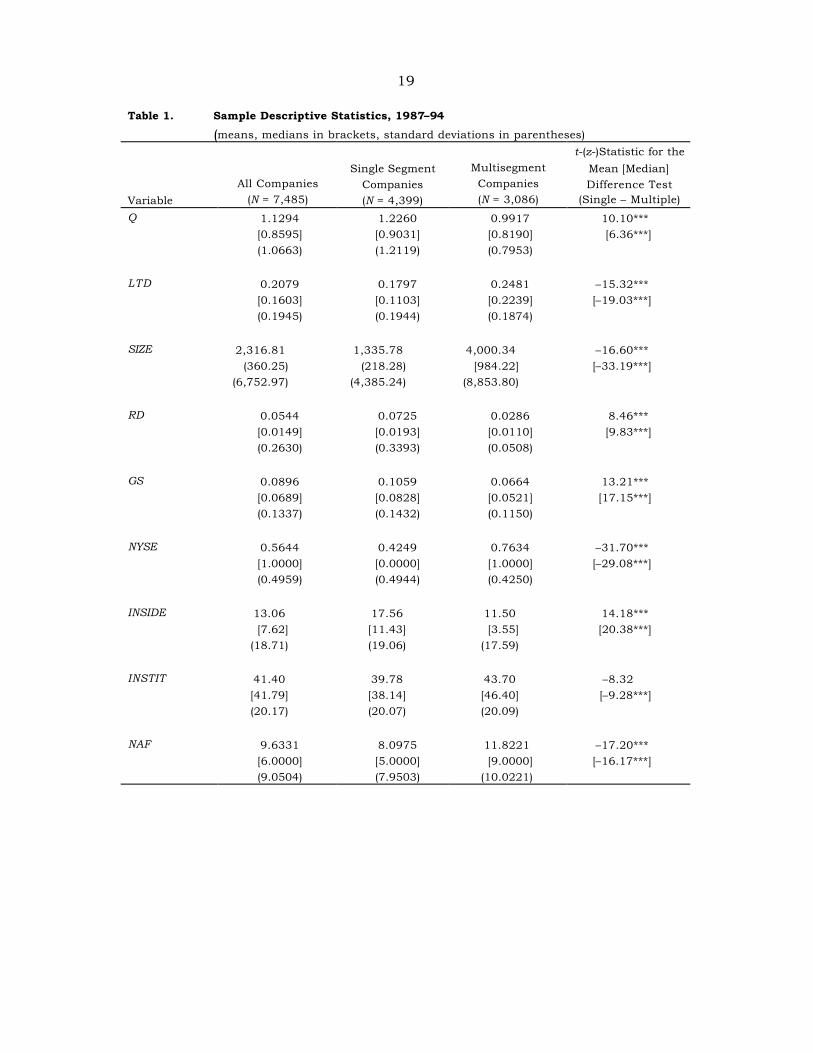
The descriptive statistics for the financial and ownership characteristics
of the sample are in Table 1. Table 1 also shows the means, medians (in
brackets), and standard deviations (in parentheses) for the focused and
diversified samples. The last column provides the t-statistics and Wilcoxon rank
sum z-statistics for the mean and median difference tests between the single-
segment and multisegment samples. Consistent with the diversification
literature, multisegment companies had, on average, significantly lower Tobin’s
q values (row Q), research and development expenditures to sales (row RD), and
sales growth rates (row GS).7 Single-segment companies had lower long-term
debt ratios (row LTD) and total assets (row SIZE), and they were less likely to be
listed on the NYSE. The statistics in the last column reveal significant
differences in terms of ownership structure between diversified and focused
companies. Single-segment companies exhibited, on average, higher insider
ownership (row INSIDE) and lower institutional ownership (row INSTIT) than
multisegment companies.
5 See also Chung and Jo. 6 We used the Compustat convention for assigning fiscal years. 7 For instance, Lang and Stulz reported mean (median) q values of 1.53 (1.01) for 580 single-segment companies and 0.66 (0.58) for 184 multisegment companies. It should be noted that the differences betw een the values found by Lang and Stulz and our corresponding q values could be the result of the larger sample size (i.e., 4,399 single-segment and 3,086 multisegment companies) and the different time span we used. Another reason could be that the Lang and Stulz sample was loaded with larger companies, but the validity of this difference cannot be confirmed because the

6 The difference tests indicate that the number of analysts following (row
NAF) diversified companies was, on average, significantly higher than the
number following focused companies. Thus, if the number of analysts is
proxying for the total expenditures on information acquisition about a company
(Bhushan), this result suggests that more resources are spent for acquisition of
private information for multisegment than for single-segment companies.8 The
result also implies that the demand for forecast services is greater for diversified
than for focused companies, which suggests that the total expenditures
associated with acquisition of information for multisegment companies is
considerably larger than the expenditures for single-segment companies. This
result is inconsistent with Bhushan’s contention that multisegment companies
will be followed by fewer analysts because of the increased costs associated with
obtaining and analyzing data for them.9 Our evidence suggests that the higher
cost of information acquisition associated with multisegment companies is
apparently outweighed by the strong demand for information on the companies
generated by analysts. The fact that more information is generated by security
analysts for diversified companies, coupled with the documented evidence that
these companies trade at a discount from single-segment companies, raises
concerns about the relative efficiency of monitoring role of security analysis.
authors did not provide information on company size. 8 We do not deal here explicitly with issues of “free riding,” “resale of analyst services,” or “salary differences among analysts.” 9 Bhushan’s results drew on data obtained from Nelson’s Directory of Wall Street Research, which is a subset of the sample used in this study. The mean (median) of Bhushan’s number of analysts following his total sample of companies and was 13.94 (10.00), which contrasts to the 9.63 (6.00) we found and suggests that the two studies relied on entirely different samples of companies.
7 Methodology
One of the most basic predictions of the monitoring theory of security analysis is
that companies that are followed by relatively more analysts are subject to
relatively lower agency costs. Empirically, the theory predicts a negative
relationship between agency costs and the number of analysts following (that is,
analysts that provided earnings forecasts) each company in our sample.
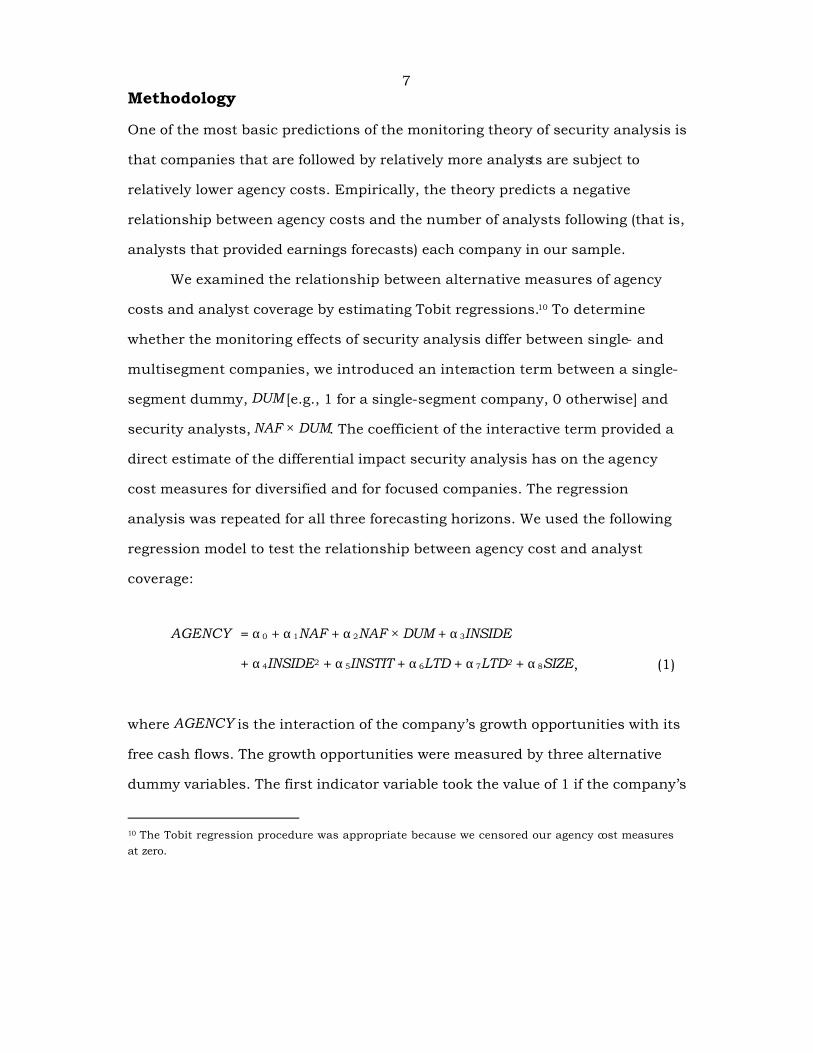
We examined the relationship between alternative measures of agency
costs and analyst coverage by estimating Tobit regressions.10 To determine
whether the monitoring effects of security analysis differ between single- and
multisegment companies, we introduced an interaction term between a single-
segment dummy, DUM [e.g., 1 for a single-segment company, 0 otherwise] and
security analysts, NAF × DUM. The coefficient of the interactive term provided a
direct estimate of the differential impact security analysis has on the agency
cost measures for diversified and for focused companies. The regression
analysis was repeated for all three forecasting horizons. We used the following
regression model to test the relationship between agency cost and analyst
coverage:
AGENCY = α0 + α1NAF + α2NAF × DUM + α3INSIDE
+ α4INSIDE2 + α5INSTIT + α6LTD + α7LTD2 + α8SIZE, (1)
where AGENCY is the interaction of the company’s growth opportunities with its
free cash flows. The growth opportunities were measured by three alternative
dummy variables. The first indicator variable took the value of 1 if the company’s
10 The Tobit regression procedure was appropriate because we censored our agency cost measures at zero.

8 Tobin’s q was less than 1 (i.e., a poorly managed company) and the value of 0
otherwise. The second indicator variable took the value of 1 if the company’s
five-year growth of sales was less than the sample median and the value of 0
otherwise. The third indicator variable took the value of 1 if the company’s five-
year growth of sales was less than the median for its industry, based on the two-
digit primary SIC code classification, and the value of 0 otherwise. Following
Lehn and Poulsen (1989), free cash flows were measured as operating income
before depreciation minus the sum of taxes plus interest expense and dividends
paid standardized by total assets.
We considered poorly managed companies more likely to be susceptible
to higher agency costs than well-managed companies and, consequently, more
likely to waste free cash flows in projects with negative net present value
whereas well-managed companies would be involved in value-maximizing
activities for which free cash flows were not wasted. Therefore, given the
company’s level of corporate free cash flows, a company with low (high) growth
opportunities was expected to be subject to high (low) agency costs. Specifically,
a high value for the interactive AGENCY variable should be indicative of a
company with high agency costs arising from the existence of high free cash
flows that are at the discretion of its managers and are being poorly managed.
If the monitoring activity of security analysts reduces managerial
misconduct, we expected to find a negative relationship between agency costs
and the number of security analysts following a company. If security analysis,
however, is less effective in limiting managerial non-value-maximizing behavior
for diversified than focused companies, we predicted that the coefficient (α2) of
the interactive term would be negative and statistically significant.
We also used a set of control variables that characterized the company’s

9 ownership structure, leverage, and size. We theorized that the greater the
dispersion in the company’s ownership, the greater the non-value-maximizing
conduct by managers and, therefore, the greater the agency costs. We used the
INSIDE variable to capture the aligned interests of insiders and shareholders. We
expected that the larger the ownership stakes by insiders were, the lower the
agency costs would be. The squared term, INSIDE2, was used to account for
possible nonlinear insider-ownership effects (i.e., non-value-maximizing
behavior by entrenched managers) on agency costs.
We theorized that agency conflicts between managers and shareholders
are likely to be mitigated through the monitoring activities of institutional
investors. Thus, the INSTIT measure was expected to indicate the extent of
outside monitoring of managerial behavior. Institutional shareholders may be
ineffective monitors, however, because they have little time and/or few
resources to devote to active monitoring for any but underperforming companies
in which they have large equity stakes (Berle 1959; Pound 1988).
The LTD variable (book value of long-term debt divided by book value of
total assets) was used to control for the monitoring role of debt on managers’
discretion over free cash flows. We anticipated that the agency cost measures
would be inversely related to the fraction of debt in the company’s capital
structure. As with outside shareholders, the monitoring provided by
debtholders, however, may not be effective until debt reaches a critical
threshold. We accounted for this possibility by including the squared LTD
variable in the analysis.
Finally, because agency conflicts are more pronounced in large than in
small organizations, we expected a positive relationship between SIZE and
agency costs.
10
Empirical Results
We discuss first the monitoring effects of security analysis in reducing agency
costs and the difference in the effects for focused versus diversified companies.
Then, we turn to our findings concerning whether monitoring by security
analysts affects firm value.
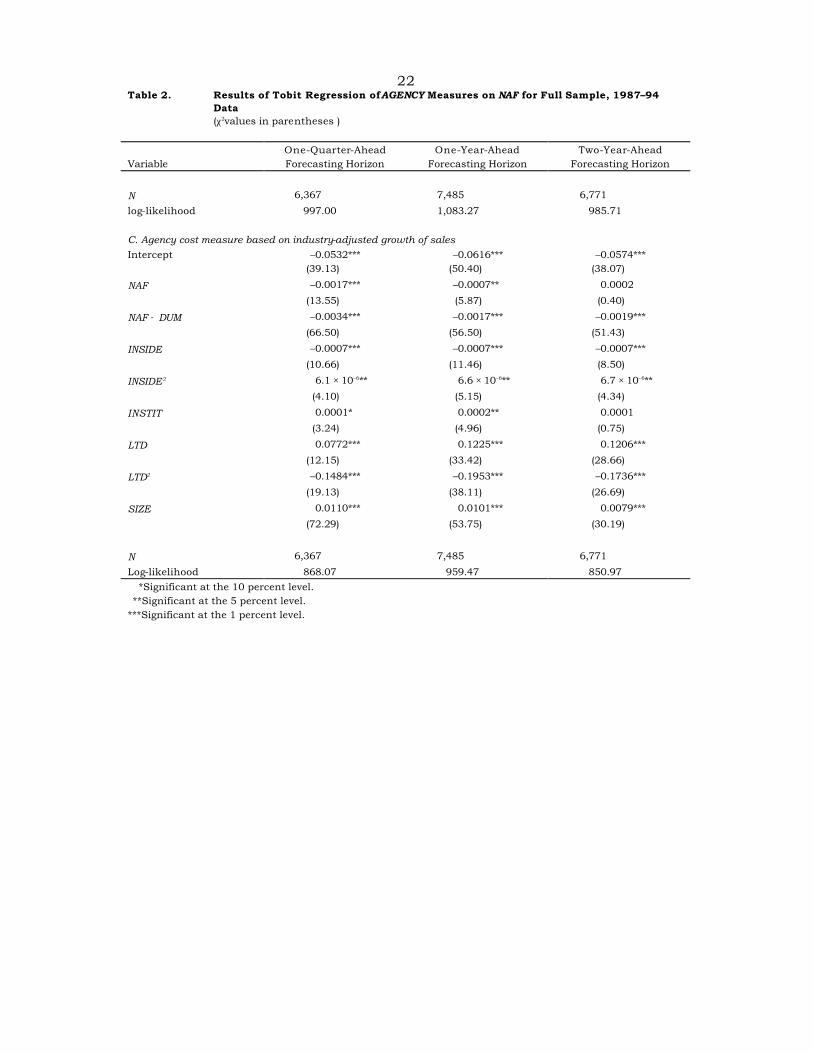
Monitoring Effects of Security Analysis. Our findings on the relationship
between agency costs (AGENCY) and analyst coverage (NAF) for three forecasting
horizons are in Table 2. Consistent with the conjecture of Jensen and Meckling
that security analysis can reduce agency costs, the coefficient of the NAF
variable is, in general, negative and significant at the 5 percent level or better.
The results in the three panels are similar enough to indicate that they were
insensitive to the measure of agency cost used. These results suggest that a
connection does indeed exist between how closely a publicly traded corporation
is followed by security analysts and how closely the management of that
corporation focuses on creating shareholder value. Security analysis evidently
acts not only as an information intermediary but also as a mechanism for
monitoring agency costs that restricts managerial misconduct.
Interestingly, however, the coefficients of the interactive variable NAF ×
DUM are negative and significant at the 1 percent level, which indicates that the
monitoring role of security analysis is more pronounced for focused than for
diversified companies. These results imply that security analysts exert
substantially greater influence on reducing agency costs for single-segment
companies than for multisegment companies. This result suggests an agency-
based explanation for the consensus among academic researchers and

11 practitioners that diversified companies trade at a discount to comparable
stand-alone companies. Our evidence could imply, however, that the
monitoring activity of security analysis fails to alleviate inefficiencies in
internal capital markets or curtail overinvestment on the part of diversified
companies.
The coefficients of the ownership variables are, in general, as we expected.
The coefficient of the INSIDE variable supports the Jensen and Meckling
convergence-of-interest hypothesis at low levels of managerial ownership, which
contends that managers who are owners are not inclined to divert resources
away from value maximization. Consistent with McConnell and Servaes (1990,
1995), the squared INSIDE and LTD variables show that inside owners and
corporate lenders have curvilinear effects on agency costs. These results
support the view that high levels of inside ownership (because of the
nonconvergence of interests between inside and outside owners of the company
and because insider owners are driven by managerial equity ownership
entrenchment) are associated with high agency costs whereas high levels of debt
play an important role in reducing the non-value-maximizing conduct of
managers. Institutional ownership, however, apparently has no monitoring
effect on managerial behavior. The evidence suggests that institutional
ownership does have a small but significant impact on the agency costs of the
company, which implies that the monitoring activity of institutional investors is
reduced mainly because of special lucrative relationships that seem to exist
between managers and the institutional owners of a company.
Firm Value and Security Analysis. The evidence suggests that the
monitoring effects of security analysis are considerably greater for focused than

12 for diversified companies, but whether the effects are reflected in firm value is
not known. To determine the valuation effects of security analysis, we examined
the relationship between Tobin’s q and the number of security analysts, together
with a set of control variables to account for other effects.11 To determine
whether the valuation effects of security analysis differ between single- and
multisegment companies, we introduced an intersection between security
analysts and the single-segment dummy, NAF × DUM.12 We investigated this
relationship by estimating the regression
Qj = α0 + α1NAF + α2NAF × DUM + α3INSIDE + α4INSIDE2 + α5INSTIT
+ α6LTD + α7LTD 2 + α8RD + α9SIZE + α10SEGN, (2)
where SEGN is the number of business segments reported by each company.
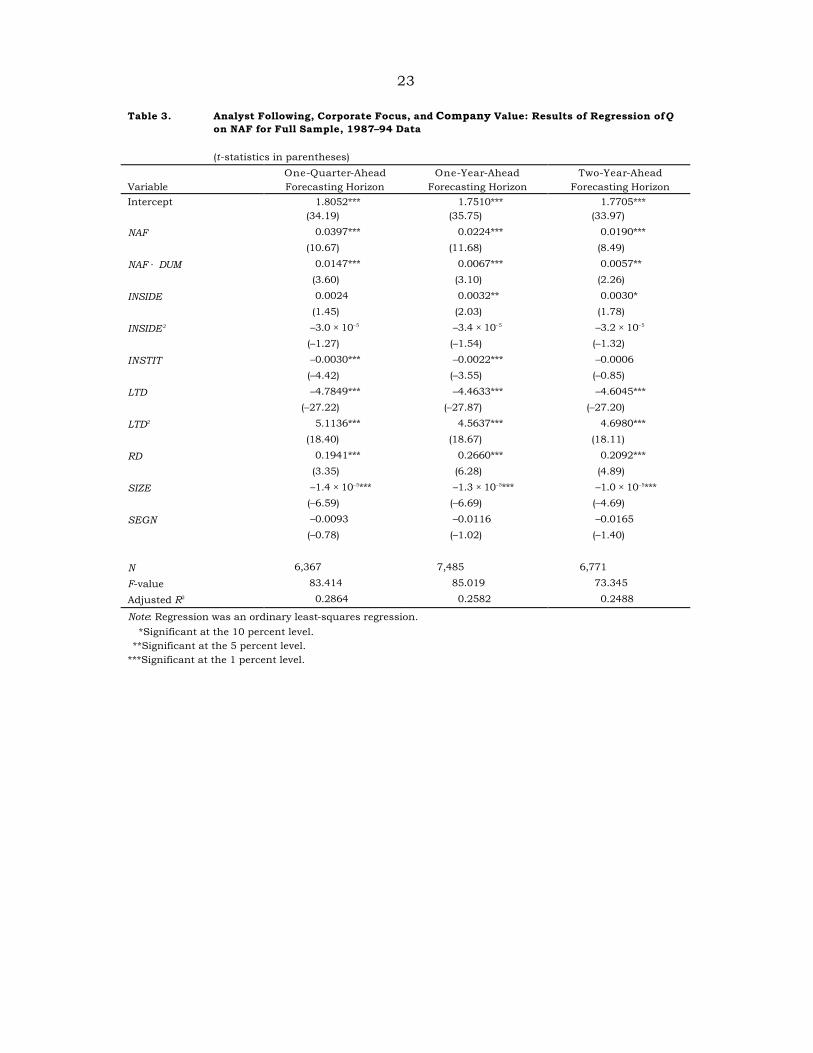
Table 3 shows the regression results. As expected, the coefficient of the
NAF variable is positive and significant at the 1 percent level in all regressions.
These results suggest that, consistent with the conjecture of Jensen and
Meckling and the evidence of Chung and Jo, security analysis has a positive
impact on firm value by monitoring managerial non-value-maximizing behavior
and reducing information asymmetries between insiders and outside investors.
Furthermore, the coefficients of the interactive variable NAF × DUM (0.0147 with
a t-value of 3.60, 0.0067 with a t-value of 3.10, and 0.0057 with a t-value of 2.26
11 Chung and Pruitt (1994) showed that our Q measure as defined in Table 1 is highly correlated with the Tobin’s q measure of Lindenberg and Ross (1981). The Q values were estimated after the announcement of earnings forecasted by security analysts. 12 Chung and Jo also examined the relationship between firm value and the NAF variable for the 1984–87 period. Without distinguishing between single-segment and multisegment companies, they reported a positive relationship between NAF and Q.

13 for the three forecasting horizons) indicate that the valuation effects of security
analysis differ between diversified and focused companies. Consistent with our
earlier findings, which showed that the monitoring and information
dissemination of security analysis are more effective for focused than for
diversified companies, these findings suggest that security analysis has larger
valuation effects on focused than on diversified companies.
The signs of the other explanatory variables are as expected. The sign of
the coefficient of the INSIDE variable is positive and significant at conventional
levels. This positive relationship between Q and low levels of insider ownership
shareholdings is consistent with the view that some insider ownership exerts a
positive influence on firm value by increasing the alignment of interests
between managers and shareholders. The INSIDE variable exhibits a quadratic
relationship, however, with Q. Consistent with the evidence reported in Table 2,
which indicated that the squared INSIDE variable has curvilinear effects on
agency costs, the negative coefficients of the INSIDE2 variable shown in Table 3
indicate that increasing insider equity ownership beyond a critical point is
driven by managerial ownership entrenchment. The sign of the coefficient of the
institutional ownership variable is negative and significant at conventional
levels of significance except for the two-year-ahead forecasting horizon. The
indication is that firm value is a decreasing function of institutional ownership,
which is consistent with the findings reported in Table 2, in the sense that
institutional shareholders do not increase firm value by restricting agency costs
associated with managerial misconduct. The result in Table 3 confirms that
institutional ownership of the company sides with managers rather than
monitoring managerial misconduct, probably because of special relationships
between institutions and company managers (see Pound). The negative and

14 significant coefficient of long-term debt is inconsistent with the view that
debtholders monitor managers’ non-value-maximizing conduct. The positive
and significant coefficient of the squared term, LTD2, suggests, however, that
debt’s monitoring role becomes effective above a critical threshold level. This
finding is consistent with the evidence in Table 2. The negative coefficient of
the SIZE variable implies that firm value is adversely affected by size. Consistent
with the corporate diversification studies, our results show that an inverse,
albeit insignificant, relationship exists between industrial diversity, SEGN, and
firm value, Q.
We conclude that monitoring of multisegment companies by security
analysts fails to add shareholder value mainly because of the difficulty of
disciplining managerial non-value-maximizing behavior in these companies.
Disentangling operating inefficiencies and asymmetries of information
associated with diversified companies may be not only difficult but also costly.
The limitations of security analysis in monitoring managerial misconduct in
complex and diversified companies may be another reason diversified
companies trade at a discount to comparable stand-alone companies.
Conclusions
We had three objectives. The first was to examine directly whether security
analysis acts as a monitoring mechanism in restricting agency-related costs
arising from the separation of ownership and control in public corporations. The
second was to investigate whether the effectiveness of the monitoring activity of
security analysis is related to the industrial diversity of the company. The third
was to analyze the valuation effects of security analysis for companies with
different industrial structures.
15 We provided evidence in support of the view that security analysis acts as
a monitoring mechanism in reducing the agency costs associated with the
manager–shareholder conflict. We also found that, although more security
analysts and resources are used for tracking multisegment companies, the
monitoring activity of security analysis is considerably less effective in
restricting managers’ non-value-maximizing behavior for multi- than for single-
segment companies. Hence, our findings suggest that the usefulness of security
analysis as a monitor diminishes with the industrial diversification of the
company. Furthermore, although our empirical results show that firm value is a
positive function of security analysis, security analysis exerts greater influence
on the value of focused companies than on the value of diversified companies.
These results raise concerns about the quality of security analysts’
earnings forecasts for diversified companies, whereas they support the
likelihood that the recent trend among diversified companies of introducing
tracking stock will enhance financial analyst coverage and the quality of
analyst coverage in terms of forecast errors. Overall, our findings support the
notion that the monitoring limitations of security analysis may be another
reason diversified companies trade at a discount to stand-alone companies.
We are grateful to I/B/E/S International for providing the EPS forecast
data. We would also like to thank Mark Clatworthy and seminar
participants at the University of Grenoble for useful comments.

16
References Amihud, Y., and B. Lev. 1981. “Risk Reduction as a Managerial Motive for Conglomerate Mergers.” Bell Journal of Economics, vol. 12, no. 2 (Autumn):605–617. Berger, P., and E. Ofek. 1995. “Diversification’s Effect on Firm Value.” Journal of Financial Economics, vol. 37, no. 1 (January):39–65. Berle, A. 1959. Power without Property: A New Development in American Political Economy. New York: Harcourt Brace. Bhushan, R. 1989. “Firm Characteristics and Analyst Following.” Journal of Accounting and Economics, vol. 11, no. 2–3 (July):39–65. Billett, M., and S. Mauer. 1998. “Diversification and the Value of Internal Capital Markets: The Case of Tracking Stock.” Working paper, Southern Methodist University. Brennan, M., and P. Hughes. 1991. “Stock Prices and the Supply of Information.” Journal of Finance, vol. 46, no. 5 (December):1665–91. Brennan, M., and A. Subrahmanyam. 1995. “Investment Analysis and Price Formation in Security Markets.” Journal of Financial Economics, vol. 38, no. 3 (July):361–381. Chung, K.H., and H. Jo. 1996. “The Impact of Security Analysts’ Monitoring and Marketing Functions on the Market Value of Firms.” Journal of Financial and Quantitative Analysis, vol. 31, no. 4 (December):493–512. Chung, K.H., and S.W. Pruitt. 1994. “A Simple Approximation of Tobin’s q.” Financial Management, vol. 23, no. 3 (Autumn):70–74. Comment, R., and G.A. Jarrell. 1995. “Corporate Focus and Stock Returns.” Journal of Financial Economics, vol. 37, no. 1 (January):67–87. Denis, D.J., D.K. Denis, and A. Sarin. 1997. “Agency Problems, Equity Ownership, and Corporate Diversification.” Journal of Finance, vol. 52, no. 1 (March):135–160.
17 Gilson, S.C., P.M. Healy, C.F. Noe, and K.G. Palepu. 1998. “Information Effects of Spin-Offs, Equity Carve-Outs, and Targeted Stock Offerings.” Working paper, Harvard University. Harris, M., C.H. Kriebel, and A. Raviv. 1982. “Asymmetric Information, Incentives, and Intrafirm Resource Allocation.” Management Science, vol. 28, no. 3 (June):604–620. Jensen, M.C. 1986. “Agency Costs of Free Cash Flow, Corporate Finance and Takeovers.” American Economic Review, vol. 76, no. 2 (May):323–329. Jensen, M.C., and W.H. Meckling. 1976. “Theory of the Firm: Managerial Behavior, Agency Costs and Ownership Structure.” Journal of Financial Economics, vol. 3, no. 4 (October):305–360. Jensen, M.C., and K.J. Murphy. 1990. “Performance Pay and Top Management Incentives.” Journal of Political Economy, vol. 98, no. 2 (April):225–264. Lamont, O. 1997. “Cash Flow and Investment: Evidence from Internal Capital Markets.” Journal of Finance, vol. 52, no. 1 (March):83–109. Lang, L.H.P., and R.M. Stulz. 1994. “Tobin’s q, Corporate Diversification, and Firm Performance.” Journal of Political Economy, vol. 102, no. 6 (December):1248–80. Lehn, K., and A. Poulsen. 1989. “Free Cash Flow and Stock Holder Gains in Going Private Transactions.” Journal of Finance, vol. 44, no. 3 (July):771–789. Lindenberg, E.B., and S.A. Ross. 1981. “Tobin’s q Ratio and Industrial Organization.” Journal of Business, vol. 54, no. 1 (January):1–32. Logue, D.E., J.K. Seward, and J.P. Walsh. 1996. “Rearranging Residual Claims: A Case for Targeted Stock.” Financial Management, vol. 25, no. 1 (Spring):43–61. McConnell, J., and H. Servaes. 1990. “Additional Evidence on Equity Ownership and Corporate Value.” Journal of Financial Economics, vol. 27, no. 2 (October):595–612.

18 ———. 1995. “Equity Ownership and the Two Faces of Debt.” Journal of Financial Economics, vol. 39, no. 1 (September):131–157. Merton, R. 1987. “A Simple Model of Capital Market Equilibrium with Incomplete Information.” Journal of Finance, vol. 42, no. 3 (July):483–510. Moyer, R.C., R.E. Chatfield, and P.M. Sisneros. 1989. “Security Analyst Monitoring Activity: Agency Costs and Information Demands.” Journal of Financial and Quantitative Analysis, vol. 24, no. 4 (December):503–512. Nanda, V., and M.P. Narayanan. 1997. “Disentangling Value: Misvaluation and the Scope of the Firm.” Working paper, University of Michigan Business School. Pound, J. 1988. “Proxy Contests and the Efficiency of Shareholder Oversight.” Journal of Financial Economics, vol. 20, no. 1/2 (January/March):237–265. Rajan, R., H. Servaes, and L. Zingales. 2000. “The Cost of Diversity: The Diversification Discount and Inefficient Investment.” Journal of Finance, vol. 55, no. 1 (February):35–80. Servaes, H. 1996. “The Value of Diversification during the Conglomerate Merger Wave.” Journal of Finance, vol. 51, no. 4 (September):1201–25. Shin, H.H., and R. Stulz. 1998. “Are Internal Capital Markets Efficient?” Quarterly Journal of Economics, vol. 113, no. 2 (May):531–552. Shleifer, A., and R. Vishny. 1989. “Managerial Entrenchment: The Case of Manager-Specific Investments.” Journal of Financial Economics, vol. 25, no. 1 (November):123–139. Stulz, R.M. 1990. “Managerial Discretion and Optimal Financing Policies.” Journal of Financial Economics, vol. 26, no. 1 (July):3–27.
19 Table 1. Sample Descriptive Statistics, 1987–94
(means, medians in brackets, standard deviations in parentheses)
Variable All Companies
(N = 7,485)
Single Segment Companies (N = 4,399)
Multisegment Companies (N = 3,086)
t-(z-)Statistic for the Mean [Median] Difference Test
(Single – Multiple)
Q 1.1294 1.2260 0.9917 10.10*** [0.8595] [0.9031] [0.8190] [6.36***] (1.0663) (1.2119) (0.7953) LTD 0.2079 0.1797 0.2481 –15.32*** [0.1603] [0.1103] [0.2239] [–19.03***] (0.1945) (0.1944) (0.1874) SIZE 2,316.81 1,335.78 4,000.34 –16.60*** (360.25) (218.28) [984.22] [–33.19***] (6,752.97) (4,385.24) (8,853.80) RD 0.0544 0.0725 0.0286 8.46*** [0.0149] [0.0193] [0.0110] [9.83***] (0.2630) (0.3393) (0.0508) GS 0.0896 0.1059 0.0664 13.21*** [0.0689] [0.0828] [0.0521] [17.15***] (0.1337) (0.1432) (0.1150) NYSE 0.5644 0.4249 0.7634 –31.70*** [1.0000] [0.0000] [1.0000] [–29.08***] (0.4959) (0.4944) (0.4250) INSIDE 13.06 17.56 11.50 14.18*** [7.62] [11.43] [3.55] [20.38***] (18.71) (19.06) (17.59) INSTIT 41.40 39.78 43.70 –8.32 [41.79] [38.14] [46.40] [–9.28***] (20.17) (20.07) (20.09) NAF 9.6331 8.0975 11.8221 –17.20*** [6.0000] [5.0000] [9.0000] [–16.17***] (9.0504) (7.9503) (10.0221)

20 Note: Q is a proxy for Tobin’s q measured as [Market value of equity + Book value of long-term debt + (Short-term liabilities – Short-term assets)]/Total assets; LTD is the ratio of the company’s long-term debt to total assets; SIZE is book value of the company’s total assets; RD is R&D expenditures standardized by sales (i.e., a measure of intangibles); GS is the five-year geometric growth rate of the company’s sales; NYSE is a dummy variable of 1 indicating a company was listed on the NYSE, 0 otherwise; INSIDE is the percentage holdings of common shares by officers and directors (insiders); INSTIT is the percentage of common shares held by institutional investors; NAF is the number of analysts providing one-year-ahead earnings forecasts. ***Significant at the 1 percent level.

21 Table 2. Results of Tobit Regression of AGENCY Measures on NAF for Full Sample, 1987–94
Data (χ2values in parentheses )
Variable One-Quarter-Ahead Forecasting Horizon
One-Year-Ahead Forecasting Horizon
Two-Year-Ahead Forecasting Horizon
A. Q-based agency cost measure Intercept –0.0294*** –0.363*** –0.0356*** (21.46) (35.56) (29.33)
NAF –0.0016*** –0.0011*** –0.0009***
(20.67) (29.14) (15.51)
NAF × DUM –0.0011*** –0.0006*** –0.0008***
(12.41) (15.24) (17.93)
INSIDE 0.0001 0.0001 0.0001
(0.63) (0.71) (0.49)
INSIDE2 –9.8 × 10⁻⁷ –6.6 × 10⁻⁷ –9.1 × 10⁻⁷
(0.20) (0.11) (0.16)
INSTIT 0.0001** 0.0002*** 0.0002***
(4.34) (9.52) (6.92)
LTD 0.3229*** 0.3066*** 0.3135***
(388.4) (436.94) (393.61)
LTD2 –0.3820*** –0.3707*** –0.3697***
(245.0) (302.55) (257.90)
SIZE –0.0001 0.0005 –0.0002
(1.04) (0.32) (0.05)
N 6,367 7,485 6,771
log-likelihood 2,750.17 3,457.11 3,016.07 B. Agency cost measure based on median growth of sales
Intercept –0.0582*** –0.0665*** –0.0658*** (48.48) (60.19) (51.60)
NAF –0.0018*** –0.0007** –0.00003
(16.68) (6.18) (0.01)
NAF × DUM –0.0029*** –0.0015*** –0.0017***
(51.55) (44.94) (41.21)
INSIDE –0.0008*** –0.0008*** –0.0007***
(13.86) (14.80) (9.86)
INSIDE2 6.7 × 10⁻⁶** 7.6 × 10⁻⁶*** 7.1 × 10⁻⁶**
(5.23) (7.16) (5.06)
INSTIT 0.0001** 0.0001* 0.0001
(2.01) (3.72) (0.69)
LTD 0.0876*** 0.1342*** 0.1317***
(16.37) (41.54) (35.50)
LTD2 –0.1573*** –0.2059*** –0.1859***
(22.55) (44.02) (31.84)
SIZE 0.0107*** 0.0096*** 0.0082***
(70.75) (49.25) (33.55)
22 Table 2. Results of Tobit Regression of AGENCY Measures on NAF for Full Sample, 1987–94
Data (χ2values in parentheses )
Variable One-Quarter-Ahead Forecasting Horizon
One-Year-Ahead Forecasting Horizon
Two-Year-Ahead Forecasting Horizon
N 6,367 7,485 6,771
log-likelihood 997.00 1,083.27 985.71 C. Agency cost measure based on industry-adjusted growth of sales
Intercept –0.0532*** –0.0616*** –0.0574*** (39.13) (50.40) (38.07)
NAF –0.0017*** –0.0007** 0.0002
(13.55) (5.87) (0.40)
NAF × DUM –0.0034*** –0.0017*** –0.0019***
(66.50) (56.50) (51.43)
INSIDE –0.0007*** –0.0007*** –0.0007***
(10.66) (11.46) (8.50)
INSIDE2 6.1 × 10⁻⁶** 6.6 × 10⁻⁶** 6.7 × 10⁻⁶**
(4.10) (5.15) (4.34)
INSTIT 0.0001* 0.0002** 0.0001
(3.24) (4.96) (0.75)
LTD 0.0772*** 0.1225*** 0.1206***
(12.15) (33.42) (28.66)
LTD2 –0.1484*** –0.1953*** –0.1736***
(19.13) (38.11) (26.69)
SIZE 0.0110*** 0.0101*** 0.0079***
(72.29) (53.75) (30.19)
N 6,367 7,485 6,771
Log-likelihood 868.07 959.47 850.97 *Significant at the 10 percent level.
**Significant at the 5 percent level. ***Significant at the 1 percent level.
23 Table 3. Analyst Following, Corporate Focus, and Company Value: Results of Regression of Q
on NAF for Full Sample, 1987–94 Data
(t-statistics in parentheses)
Variable One-Quarter-Ahead Forecasting Horizon
One-Year-Ahead Forecasting Horizon
Two-Year-Ahead Forecasting Horizon
Intercept 1.8052*** 1.7510*** 1.7705*** (34.19) (35.75) (33.97)
NAF 0.0397*** 0.0224*** 0.0190***
(10.67) (11.68) (8.49)
NAF × DUM 0.0147*** 0.0067*** 0.0057**
(3.60) (3.10) (2.26)
INSIDE 0.0024 0.0032** 0.0030*
(1.45) (2.03) (1.78)
INSIDE2 –3.0 × 10⁻⁵ –3.4 × 10⁻⁵ –3.2 × 10⁻⁵
(–1.27) (–1.54) (–1.32)
INSTIT –0.0030*** –0.0022*** –0.0006
(–4.42) (–3.55) (–0.85)
LTD –4.7849*** –4.4633*** –4.6045***
(–27.22) (–27.87) (–27.20)
LTD2 5.1136*** 4.5637*** 4.6980***
(18.40) (18.67) (18.11)
RD 0.1941*** 0.2660*** 0.2092***
(3.35) (6.28) (4.89)
SIZE –1.4 × 10⁻⁵*** –1.3 × 10⁻⁵*** –1.0 × 10⁻⁵***
(–6.59) (–6.69) (–4.69)
SEGN –0.0093 –0.0116 –0.0165
(–0.78) (–1.02) (–1.40)
N 6,367 7,485 6,771
F-value 83.414 85.019 73.345
Adjusted R2 0.2864 0.2582 0.2488
Note: Regression was an ordinary least-squares regression. *Significant at the 10 percent level.
**Significant at the 5 percent level. ***Significant at the 1 percent level.

24 Security Analysis, Agency Costs, and Company Characteristics
John A. Doukas, Chansog Kim, and Christos Pantzalis Author Digest
In spite of the general belief that the activities of security analysts affect firm value, little is known about whether analysts act as a monitoring mechanism in reducing the agency costs of manager–shareholder conflict. If security analysis exerts positive influence on firm value by restricting managers’ non-value-maximizing activities, it should decrease agency costs. Thus, we carried out a direct testing of the relationship between security analysis and agency costs.
Little is known also about whether the effectiveness of security analyst monitoring is related to the structure (diversification) of the company. This issue is important because recent studies have documented that diversified companies destroy shareholder value. Although a diversification discount is generally accepted, the mechanism through which diversification destroys firm value is not understood. Possible causes are that diversification encourages overinvestment, that it invites agency costs, and that diversified companies suffer from internal capital market inefficiencies associated with the misallocation of resources. We studied whether security analysis as an external monitor of managerial conduct, in the sense of reducing agency costs arising from informational asymmetries, works as well, less well, or better for nondiversified companies than for diversified companies.
We examined the monitoring effectiveness of security analysts with a data set of 7,485 manufacturing company-year observations over the 1988–94 period. Based on the number of analysts following a company for forecasting horizons of (fiscal) one quarter, one year, and two years, our results consistently show that security analysis reduces agency costs (i.e., managers’ non-value-maximizing behavior) while it increases firm value. We also found that the effectiveness of analysts’ monitoring activity declines with industrial diversification, despite the fact that the number of analysts following diversified companies is substantially greater than the number following nondiversified companies. In addition, we show that the shareholder gains from the monitoring activity of security analysis are larger for nondiversified than for diversified companies.