securities and exchange commission - corporate · pdf filesecurities and exchange commission...
TRANSCRIPT

SECURITIES AND EXCHANGE COMMISSIONWashington, D.C. 20549
_________________
FORM 10-K[X] ANNUAL REPORT PURSUANT TO SECTION 13 or 15(d)
OF THE SECURITIES EXCHANGE ACT OF 1934
For the fiscal year endedSeptember 29, 2001
Commission File Number0-20242
CENTRAL GARDEN & PET COMPANY(Exact name of registrant as specified in its charter)
Delaware(State or other jurisdiction of
incorporation or organization)
68-0275553(IRS Employer
Identification Number)
___________________________
3697 Mt. Diablo Boulevard, Lafayette, California 94549(Address of principal executive offices) (Zip Code)
Telephone Number: (925) 283-4573
SECURITIES REGISTERED PURSUANT TO SECTION 12(b) OF THE ACT:
Title of Each ClassNone
Name of Each Exchangeon Which Registered
None
SECURITIES REGISTERED PURSUANT TO SECTION 12(g) OF THE ACT:
Common Stock(Title of Class)
Indicate by check mark whether the registrant (1) has filed all reports required to be filed by Section 13 or 15(d) of theSecurities Exchange Act of 1934 during the preceding 12 months (or for such shorter period that the registrant was requiredto file such reports), and (2) has been subject to such filing requirements for the past 90 days. Yes X . No .
Indicate by check mark if disclosure of delinquent filers pursuant to Item 405 of Regulation S-K (§ 229.405 of thischapter) is not contained herein, and will not be contained, to the best of registrant’s knowledge, in definitive proxy orinformation statements incorporated by reference in Part III of this Form 10-K or any amendment to this Form 10-K. [ ]
At December 5, 2001, the aggregate market value of the registrant’s Common Stock and Class B Stock held by non-affiliates of the registrant was approximately $127,415,000 and $446,000, respectively.
At December 5, 2001, the number of shares outstanding of registrant’s Common Stock was 16,790,623. In addition, onsuch date the registrant had outstanding 1,655,462 shares of its Class B Stock which is convertible into Common Stock on ashare-for-share basis.
DOCUMENTS INCORPORATED BY REFERENCE
Definitive Proxy Statement for the Company’s 2002 Annual Meeting of Stockholders - Part III of this Form 10-K.

2
PART I
Item 1. Business
GENERAL
Overview
Central Garden & Pet Company offers a broad array of branded lawn and garden and pet supply products,including Pennington®, Four Paws®, Zodiac®, Kaytee®, Nylabone®, All-Glass®, Lofts®, Max-Q®, NorcalPottery®, Matthews®, Amdro®, Image® and Grant’s®. Beginning in the fiscal year ended September 29, 2001(“fiscal 2001”), Central’s operations were grouped into two business segments, the lawn and garden productsbusiness (“Garden Products”) and the pet products business (“Pet Products”). For fiscal 2001, Garden Products andPet Products accounted for 57% and 43%, respectively, of consolidated net sales before corporate eliminations.These businesses accounted for income from operations before other charges and the allocation of certain corporatecosts and eliminations of $7.4 million and $34.9 million, respectively, in fiscal 2001. These segments, theirproducts, and the markets they serve are described under the headings “The Garden Products Business” and “ThePet Products Business” in this Part I.
Central was incorporated in Delaware in June 1992 and is the successor to a California corporation which wasincorporated in 1955. References to “we,” “us,” “our” or “Central” mean Central Garden & Pet Company and itssubsidiaries and divisions, and their predecessor companies and subsidiaries. Our principal executive offices arelocated at 3697 Mt. Diablo Boulevard, Lafayette, California 94549 and our telephone number is (925) 283-4573.
Recent Developments
Garden Products
During fiscal 2001, we intensified our focus on branded products and continued to downsize our distributionoperations to reflect the reduction in business as a result of the termination on September 30, 2000 of ourdistribution relationship with The Scotts Company (“Scotts”).
Pet Products
On September 30, 2000, Central acquired All-Glass Aquarium Co., a leading manufacturer and marketer ofaquariums and related products. Based in Franklin, Wisconsin, All-Glass had sales of approximately $61 million forthe twelve months ended September 30, 2000, with manufacturing facilities located in Franklin and its OceanicSystems subsidiary in Dallas, Texas. Its brands include All-Glass Aquarium® and Oceanic Systems®. Duringfiscal 2001, we integrated the acquired All-Glass business with our existing Island aquarium business so that wenow offer a full line of aquariums.
In 2001, we received numerous awards for our new and innovative pet products. In January 2001, the PetIndustry Distributors Association selected our All-Glass Mini Bow 7 as the “Best New Aquarium Product,” ourNylabone Fold-away Pet Carriers as the “Best New Dog or Cat Product” and our Kaytee Yogurt Dips as the “BestNew Bird or Small Animal Product.” In addition, The American Pet Products Manufacturers Association namedour All-Glass Mini Bow 5 as the “Best New Aquatic Product” and our Nylabone Fold-away Pet Carrier DisplayRack as the “Best POS Display.”

3
THE GARDEN PRODUCTS BUSINESS
Overview
Garden Products manufactures a broad array of proprietary branded lawn and garden products, includingPennington®, Amdro®, Norcal Pottery®, Lofts®, Matthews® and Grant’s®, and also performs logistics and salesactivities for a variety of other manufacturers of lawn and garden products. Garden Products accounted for 57% ofCentral’s consolidated net sales before corporate eliminations in fiscal 2001, 66% in fiscal 2000 and 71% in fiscal1999, and before the allocation of certain corporate costs and eliminations accounted for income from operationsbefore other charges of $7.4 million in fiscal 2001, $37.1 million in fiscal 2000, and $50.7 million in fiscal 1999.
Proprietary Branded Products
The principal lawn and garden product lines are the Pennington line of grass seed, wild bird food and lawn careproducts, the Norcal Pottery line of pottery products, the Amdro and Grant’s line of ant control products, theMatthews line of wooden garden products, and seven proprietary brands of fertilizer.
Pennington. Pennington offers a broad range of seed products in the lawn and garden, forage, and wild gameand bird markets. Pennington is also a large manufacturer of lawn and garden chemicals, fertilizers, soils andrelated products. The Pennington line of grass seed and lawn and garden products includes the trademarksPennington Seed®, Pennington®, Penkoted®, Max-Q, ProCare®, Green Charm®, Lofts® and Rebel®. Penningtonproducts are offered nationwide and include:
• Grass Seed. Pennington manufactures numerous varieties and blends of cool and warm season turfgrass for both the residential and professional markets, as well as forage and wild game seed varietiesunder the Pennington name and under private labels, including Wal*Mart’s Better Homes andGardens® licensed program. The Pennington grass seed manufacturing facilities are some of thelargest and most modern seed conditioning facilities in the industry. Pennington has recently addedLofts® and Rebel® products to its offerings under a license arrangement.
• Bird Seed Products. Pennington is one of the largest manufacturers of wild bird feed includingpremium, specialty and gourmet mixes. Pennington also manufactures liquid hummingbird food.
• Lawn and Garden Chemicals. Pennington manufactures a full line of lawn and garden weed and insectcontrol products, under the names Eliminator®, ProCare® and Pennington’s Pride®. Eliminator®lawn and garden insecticides and herbicides are packaged exclusively for Wal*Mart.
• Fertilizers and Soil Products. Pennington manufactures several lines of lawn and garden fertilizers,including granular products and liquid plant foods, under several brands, including Pennington® andother private and controlled labels. In addition, Pennington’s Earth Pak division also offers a completeline of soil, mulch and rock products under several brands, including Pennington and other private andcontrolled labels.
Norcal Pottery. Norcal Pottery designs and procures pottery products from across the United States and aroundthe world. The products include terra cotta, stoneware, ceramics and porcelain pots and are sold to chain storeaccounts, independent retailers and landscapers nationwide.
AMBRANDS. AMBRANDS manufactures AMDRO® Fire Ant Bait, the leading fire ant bait product availablein the consumer market, and IMAGE® Consumer Concentrate, a selective herbicide for the control of difficultweeds in Southern turf, such as nutsedge, dollarweed, wild onion and garlic, Virginia buttonweed and others. Bothproducts are sold primarily in the Southern and Southeastern markets and are carried by key retailers including Wal-Mart, Home Depot, Ace and Lowe’s.
4
Grant’s. Grant’s manufactures ant baits, animal repellents and garden aid products. The Grant’s line of antcontrol products consists of Grant’s ant baits and granules. These products are sold nationwide through a network oflawn and garden distributors.
Unicorn Laboratories. Unicorn serves the U.S. animal health and lawn and garden industries as a private labeland branded manufacturer of lawn, garden and animal health chemical products.
Matthews Four Seasons. Matthews manufactures a complete line of wooden garden products, includingplanters, barrel fountains, arbors and trellises. Matthews also produces a cedar bird feeder line under the Kaytee®label.
Cedar Works. Pennington has an equity stake in Cedar Works, the largest producer of wooden bird feeders inthe country. Its brands include Country Home®, Nature’s Market®, Cedar Works®, Harvest Landing® and TheAddress of Distinction®. Cedar Works also offers injection molded plastic bird feeders and feeder accessories tocomplement its wooden feeder lines.
Fertilizers. Central has four proprietary brands of fertilizer — Colorado’s Own® and Mountain States®, whichare manufactured by the Company, and Easy-Gro® and Turf-Magic®, which are supplied to Central by contractmanufacturers. In addition, Gro Tec, Inc., a subsidiary of Pennington, markets fertilizers under Pennington®, ProCare®, Green Charm® and other proprietary brands.
Distributed Lawn and Garden Products
Garden Products also offers its customers a comprehensive selection of other manufacturers’ brand name lawnand garden products. In selecting which products to distribute, Garden Products generally focuses on those lawnand garden brand name products that are suited to distribution due to their seasonality, variable sales movements,complexity to consumers and retailers, handling and transportation difficulties, and which therefore generallyrequire value-added services. Garden Products does not carry live plants, power tools or high priced items which aregenerally sourced directly from manufacturers.
Sales and Marketing
Garden Products’ lawn and garden products are sold by approximately 175 sales personnel to a network of lawnand garden and hardware wholesale distributors nationwide. Garden Products also employs approximately 250 salesand marketing personnel to support its logistics and sales activities for a variety of other manufacturers of lawn andgarden products. Most products are sold directly to retailers. Historically, Garden Products’ sales have been highlyseasonal. Most retail sales of lawn and garden products occur on weekends during the spring and fall.
Sales to mass merchandisers, warehouse-type clubs and home improvement centers represent a significantportion of Garden Products’ sales. Sales to Wal*Mart represented approximately 31% of Garden Products’ sales infiscal 2001, 36% in fiscal 2000 and 32% in fiscal 1999. Sales to Home Depot represented approximately 11% ofGarden Products’ sales in fiscal 2001, 7% in fiscal 2000 and 12% in fiscal 1999. Sales to Lowe’s representedapproximately 9% of Garden Products’ sales in fiscal 2001, 7% in fiscal 2000 and 8% in fiscal 1999.
Subsequent to the fiscal 2000 year end, Wal*Mart informed Garden Products of a number of significantchanges in its lawn and garden supplies purchasing programs and procedures for fiscal 2001. These includedWal*Mart’s decision to purchase certain lawn and garden supplies directly from a number of manufacturers whosesupplies had previously been sold through Garden Products; a change from “store door” deliveries of many of thelawn and garden supplies formerly delivered by Garden Products to individual Wal*Mart stores to a new procedurewhereby Garden Products would ship these products to Wal*Mart distribution centers; and Wal*Mart’s decision notto have Garden Products personnel perform lawn and garden supplies merchandising functions inside Wal*Martstores. As a result of these factors, and the closing of 13 distribution centers associated with the garden distributiondownsizing, sales by Garden Products of other manufacturers’ lawn and garden products to Wal*Mart in 2001declined significantly.

5
Garden Products’ current practice on product returns generally is to accept and credit the return of unopenedcases of products from customers where the quantity is small, the product has been misshipped or the product isdefective. Garden Products has arrangements with its manufacturers and suppliers to stock balance and/or credit itfor a certain percentage of returned or defective products.
Manufacturing
Garden Products currently operates 14 manufacturing facilities. In addition, certain of its proprietary brandedproducts are manufactured by contract manufacturers. Garden Products also has a development team that isresponsible for developing new products within existing proprietary branded product lines and the development ofnew proprietary branded product lines.
Pennington has seed processing facilities in Madison, Georgia; Greenfield, Missouri; Roll, Arizona; El Centro,California; and Lebanon, Oregon to test, process and package a full range of Pennington seed varieties. Penningtonalso maintains observation nurseries at all manufacturing locations, enabling it to track seed growth for Penningtonquality prior to selection. Pennington’s fertilizer plant, Gro Tec®, is located in Eatonton, Georgia. Pennington wildbird feed is manufactured in Penn Pak facilities in Madison, Georgia; Greenfield, Missouri; and Sidney, Nebraska.In addition, Pennington’s Earth Pak plant in Shady Dale, Georgia produces a variety of soil amendments, includingpine bark nuggets and potting soils used in landscaping. Pennington also operates a fertilizer manufacturing facilityin Longmont, Colorado.
Unicorn Laboratories, Inc. is located in Clearwater, Florida where it manufactures and formulates a variety oflawn, garden and animal health products. Grant’s operates a manufacturing facility in San Leandro, California, andMatthews operates a manufacturing facility in Stockton, California.
Purchasing
Most of the raw materials purchased by Garden Products are acquired from a number of different suppliers;however, a number of items are purchased from limited or single sources of supply, and disruption of these sourcescould have a temporary adverse effect on product shipments and Garden Products’ financial results. GardenProducts believes alternative sources could be obtained to supply these materials, but a prolonged inability to obtaincertain materials could result in lost sales.
Pennington obtains grass seed from various sources, which it presently considers to be adequate. No one sourceis considered to be essential to Pennington or to Garden Products’ business as a whole. Pennington has neverexperienced a significant interruption of supply. The principal raw materials required for Pennington’s wild birdseed manufacturing operations are bulk commodity grains, including millet, milo, wheat and sunflower seeds.Pennington generally purchases these raw materials one to three months in advance. Raw materials are generallypurchased from large national commodity companies and local grain cooperatives. In order to ensure an adequatesupply of seed to satisfy expected production volume, Pennington enters into contracts to purchase grain and seed atfuture dates by fixing the quantity, and often the price, at the commitment date.
The key ingredients in the Garden Products’ fertilizer and insect and weed control products are variouscommodity and specialty chemicals including phosphates, urea, potash, herbicides, insecticides and fungicides.Garden Products obtains its raw materials from various sources, which it presently considers to be adequate. No onesource is considered to be essential to any of Garden Products’ companies or to its business as a whole. GardenProducts has never experienced a significant interruption of supply.
Distribution
Garden Products currently operates 20 distribution centers throughout the country. The primary distributioncenters for Pennington’s products are located both near the point of manufacture and at strategically locatedwarehousing facilities. These facilities are located in Columbia, South Carolina; Cullman, Alabama; Greenfield,Missouri; Madison, Georgia; Kenbridge, Virginia; Hammond, Louisiana; Little Rock, Arkansas; Woburn,Massachusetts; and Laurel, Maryland. In addition, Pennington uses other outside agents and distributors, including,

6
but not limited to, Excel Garden Products, Central’s other garden sales and logistics operations. Pennington’sproducts are shipped by rail and truck. While the majority of truck shipments are made by contract carriers, aportion is made by Pennington’s fleet of trucks.
Excel Garden Products operates distribution centers in Dallas, Texas; Orlando, Florida; Portland, Oregon;Sacramento, California; Santa Fe Springs, California; and Salt Lake City, Utah. Norcal Pottery operates distributioncenters in San Leandro, California; Richmond, California; Ontario, California; Houston, Texas; and Algona,Washington.
Competition
The lawn and garden products industry is highly competitive. Garden Products’ lawn and garden productscompete against national and regional products and private label products produced by various suppliers. Our turfand forage grass seed products compete principally against products by Barenburg, J.R. Simplott, Scotts andnumerous regional seed suppliers. Our wild bird seed products compete principally against products by AudubonPark, Wagner, Red River and Gutwein. Our fertilizers, pesticides and combination products compete principallyagainst products marketed by such companies as Scotts, Lebanon Chemical Corp., United Industries Corporation,Vigoro/Pursell Industries and Bayer/Pursell. Since its acquisition of the Ortho® line of lawn and garden productsfrom Pharmacia Corporation (formerly Monsanto) in 1999, Scotts’ dominant position in the lawn and gardenindustry has been a significant competitive disadvantage for Garden Products’ branded products. Garden Productscompetes primarily on the basis of its strong brand names, quality, value, service and price.
Garden Products also competes with a large number of smaller local and regional distributors—withcompetition based on price, service and personal relationships. In addition to competition from other distributors,Garden Products also faces increased competition from manufacturers and suppliers which distribute somepercentage of their products directly to retailers, bypassing distributors, or through a dual distribution system inwhich the manufacturer or supplier competes with distributors for sales to certain accounts. Such competition istypically based on service and price. The termination of the distribution relationship with Scotts effectiveSeptember 2000 is a significant competitive disadvantage for Garden Products’ distribution sales.
THE PET PRODUCTS BUSINESS
Overview
Pet Products is a leading manufacturer of proprietary branded pet supply products, including FourPaws®,Zodiac®, Kaytee®, All-Glass Aquarium®, Oceanic Systems , Island Aquarium , Nylabone and TFH®, and alsoperforms logistics and sales activities for a variety of other manufacturers of pet supply products. Pet Productsaccounted for 43% of Central’s consolidated net sales before corporate eliminations in fiscal 2001, 34% in fiscal2000 and 29% in fiscal 1999, and before the allocation of certain corporate costs and eliminations accounted forincome from operations of $34.9 million in fiscal 2001, $32.3 million in fiscal 2000, and $25.3 million in fiscal1999.
Proprietary Branded Pet Products
Pet Products’ principal pet supply product lines include the Four Paws’ line of animal products, the TFH line ofpet books and Nylabone premium dog chews and pet carriers, the Kaytee line of bird and small animal food, theWellmark line of flea and tick products, and the All-Glass®, Oceanic Systems® and Island Aquarium® line ofaquariums.
Four Paws. Four Paws is one of the largest producers of dog, cat, reptile and small animal products in theUnited States, according to the 2000-01 Pet Age Retailer Report. Four Paws products include Magic Coat®shampoos, Wee-Wee Pads, a line of grooming supplies for dogs and cats, animal cages, tie out cables, leashes,collars, and accessories, oral hygiene products and a complete line of catnip products. Four Paws also offers a lineof heating equipment and bedding material for reptiles and a line of hard rubber toys called Rough & Rugged. FourPaws products are distributed throughout the United States, Canada, Europe and Asia.

7
TFH Publications. TFH is a producer of pet books and the manufacturer of premium dog chews and ediblebones under the brand names Nylabone®, Gumabone®, Healthy Edibles® and Flexibone®. TFH currently has over1,200 titles in print and publishes a monthly magazine. TFH also offers a line of premium dog houses, pet carriersand dog and cat toys under the Nylabone® brand.
Kaytee. Kaytee is one of the nation’s largest manufacturers of bird seed for pet and wild birds, according to the2000-01 Pet Age Retailer Report, as well as a manufacturer of food and treats for small animals under the Kaytee®brand. Kaytee also manufactures wild bird feed under the brand name Natures Harvest™ for Kmart Corporationand under the PETsMART private label.
Wellmark. Wellmark is a leading manufacturer of flea, tick and pest protection products for a diversified groupof pest control markets, according to the 2000-01 Pet Age Retailer Report. These products—which include on-animal spot applications, sprays, shampoos and powders, collars, indoor foggers, aerosols, concentrates and pump-sprays—are based on the active ingredient methoprene. Wellmark owns the Zodiac® and Vet-Kem® trademarks inthe United States and Canada as well as those of Ovitrol®, Siphotrol®, Fleatrol™, vIGRen®, Petcor®, Precor® andNatural Signature®.
All-Glass Aquarium and Island Aquarium. All-Glass Aquarium and Island Aquarium manufacture aquariums,terrariums, aquatic lighting systems, and aquarium and terrarium furniture sold under the brand names All-GlassAquarium®, Oceanic Systems® and Island® Aquarium.
Distributed Pet Supply Products
Pet Products also offers its customers a comprehensive selection of other manufacturers’ brand name pet supplyproducts. Pet Products carries many of the best-known brands in pet foods and supplies and combines these productsinto single shipments, providing its pet supply customers a wide variety of products on a cost-effective basis.
Sales and Marketing
Pet Products’ branded products are sold nationwide through its own distribution network, as well asindependent distributors and directly to retailers, including national specialty pet stores, mass merchants, bookstoresand independent pet retailers. Wellmark also sells products to the professional pest control market andveterinarians. At September 29, 2001, Pet Products employed approximately 125 branded products sales andmarketing personnel. Pet Products also focuses on selling pet supply products to a wide variety of retailers,including independent, regional and national retail chains. Pet Products employs approximately 100 sales andmarketing personnel to support its logistics and sales activities for a variety of other manufacturers of pet supplyproducts.
Sales to mass merchants and national specialty pet stores represent a significant portion of Pet Products’ sales.Sales to PETsMART represented 7% of Pet Products’ sales in fiscal 2001, 7% in fiscal 2000 and 6% in fiscal 1999.Sales to Petco represented 6% of Pet Products’ sales in fiscal 2001, 8% in fiscal 2000 and 5% in fiscal 1999.
Manufacturing
Pet Products currently operates ten manufacturing facilities. In addition, certain of its proprietary brandedproducts are manufactured by contract manufacturers. Pet Products also has development teams that are responsiblefor developing new products within existing proprietary branded product lines and the development of newproprietary branded product lines.
Four Paws operates manufacturing facilities in Hauppauge, New York. TFH’s book division and Nylabonemanufacturing facilities are located in Neptune City, New Jersey. Kaytee operates manufacturing facilities inAbilene, Kansas; Chilton, Wisconsin; Cressona, Pennsylvania; and Rialto, California. Wellmark operates amanufacturing and technology center in Dallas, Texas. All-Glass Aquarium operates manufacturing facilities inFranklin, Wisconsin and Dallas, Texas. Island Aquarium operates a manufacturing facility in Fontana, California.

8
Purchasing
Most of the raw materials purchased by Pet Products are acquired from a number of different suppliers;however, some items, including the active ingredient Methoprene, are purchased from limited or single sources ofsupply, and disruption of these sources could have a temporary adverse effect on product shipments and PetProducts’ financial results. Pet Products believes alternative sources could be obtained to supply these materials, buta prolonged delay in obtaining certain materials could result in lost sales.
The principal raw materials required for Kaytee’s bird seed manufacturing operations are bulk commoditygrains, including millet, milo, wheat and sunflower seeds. Kaytee generally purchases these raw materials one tothree months in advance. Raw materials are generally purchased from large national commodity companies andlocal grain cooperatives. In order to ensure an adequate supply of seed to satisfy expected production volume,Kaytee enters into contracts to purchase grain and seed at future dates by fixing the quantity, and often the price, atthe commitment date.
Distribution
Pet Products sells its products directly to retailers and a network of distributors. Pet Products currently operateseight distribution centers throughout the country. The facilities are located in Algona, Washington; Denver,Colorado; Houston, Texas; Mahwah, New Jersey; Miami, Florida; Sacramento, California; Santa Fe Springs,California; and Tampa, Florida. While the majority of truck shipments are made by Pet Products’ fleet of trucks, aportion is made by common carriers.
Competition
The pet supply products industry is highly competitive. Our branded pet products compete against national andregional products and private label products produced by various suppliers. Our Four Paws and Wellmark brandedproducts compete principally against branded products marketed by such companies as Hartz Mountain, Sargeant’sand Eight in One. TFH Publications’ pet books compete principally against books published by Howell andBarrons, and Nylabone products compete principally against products manufactured by Aspen/Booda and Doskocil.Our Kaytee products compete principally against products marketed by Hartz Mountain, Sun Seed, Audobon Parkand Wagner. Our All-Glass Aquarium and Island Aquarium branded products compete principally against Perfecto.Pet Products competes primarily on the basis of its strong brand names, innovative new products, quality, value,service and price.
Pet Products also competes with a large number of smaller local and regional distributors—with competitionbased on price, service and personal relationships. In addition to competition from other distributors, Pet Productsalso faces increased competition from manufacturers and suppliers which distribute some percentage of theirproducts directly to retailers, bypassing distributors, or through a dual distribution system in which the manufactureror supplier competes with distributors for sales to certain accounts. Such competition is typically based on serviceand price.
MATTERS RELATING TO CENTRAL GENERALLY
Significant Customers
Wal*Mart represented approximately 21% of Central’s net sales in fiscal 2001, 25% in fiscal 2000 and 24% infiscal 1999. Wal*Mart holds significant positions in the retail lawn and garden and pet supplies markets. See “TheGarden Products Business – Sales and Marketing” above.
Patent and Other Proprietary Rights
Central’s branded products companies hold numerous patents in the United States and in other countries, andhave many patent applications pending in the United States and in other countries. Central considers thedevelopment of patents through creative research and the maintenance of an active patent program to be

9
advantageous in the conduct of its business, but does not regard the holding of any particular patent as essential to itsoperations. Central grants licenses to certain manufacturers on various terms and enters into cross-licensingarrangements with other parties.
Employees
As of September 29, 2001, Central had approximately 4,200 employees of which approximately 4,000 werefull-time employees and 200 were temporary or part-time employees. We hire substantial numbers of temporaryemployees for the peak lawn and garden shipping season of February through June to meet the increased demandexperienced during the spring and summer months, including merchandising in stores. All of our temporaryemployees are paid on an hourly basis. Except for certain employees at TFH Publications, Inc. and a Kaytee facilityin Rialto, California, none of our employees is represented by a labor union. We consider our relationships with ouremployees to be good.
Environmental Considerations
Many of the products that we manufacture or distribute are subject to local, state, federal and foreign laws andregulations relating to environmental matters. Such regulations are often complex and are subject to change. In theUnited States, all products containing pesticides must be registered with the United States Environmental ProtectionAgency (“USEPA”) (and in many cases, similar state and/or foreign agencies) before they can be sold. The inabilityto obtain or the cancellation of any such registration could have an adverse effect on our business. The severity ofthe effect would depend on which products were involved, whether another product could be substituted andwhether our competitors were similarly affected. We attempt to anticipate regulatory developments and maintainregistrations of, and access to, substitute chemicals, but there can be no assurance that we will continue to be able toavoid or minimize these risks. Fertilizer and growing media products are also subject to state and foreign labelingregulations. Grass seed is also subject to state, federal and foreign labeling regulations.
The Food Quality Protection Act, enacted by the U.S. Congress in August 1996, establishes a standard for food-use pesticides, which is that a reasonable certainty of no harm will result from the cumulative effect of pesticideexposures. Under this Act, the USEPA is evaluating the cumulative risks from dietary and non-dietary exposures topesticides. The pesticides in our products, which are also used on foods, will be evaluated by the USEPA as part ofthis non-dietary exposure risk assessment. It is possible that the USEPA may decide that a pesticide that we use inour products, would be limited or made unavailable to us. We cannot predict the outcome or the severity of theeffect of the USEPA’s evaluation. Management believes that we should be able to obtain substitute ingredients ifselected pesticides are limited or made unavailable, but there can be no assurance that it will be able to do so for allproducts.
In addition, the use of certain pesticide and fertilizer products is regulated by various local, state, federal andforeign environmental and public health agencies. These regulations may include requirements that only certified orprofessional users apply the product or that certain products be used only on certain types of locations (such as “notfor use on sod farms or golf courses”), may require users to post notices on properties to which products have beenor will be applied, may require notification of individuals in the vicinity that products will be applied in the future ormay ban the use of certain ingredients. We believe we are operating in substantial compliance with, or taking actionaimed at ensuring compliance with, these laws and regulations. Compliance with these regulations and the obtainingof registrations does not assure, however, that our products will not cause injury to the environment or to peopleunder all circumstances.
Environmental regulations may affect us by restricting the manufacturing or use of our products or regulatingtheir disposal. Regulatory or legislative changes may cause future increases in our operating costs or otherwiseaffect operations. Although we believe we are and have been in substantial compliance with such regulations andhave strict internal guidelines on the handling and disposal of our products, there is no assurance that in the futurewe may not be adversely affected by such regulations or incur increased operating costs in complying with suchregulations. However, neither the compliance with regulatory requirements nor our environmental procedures canensure that we will not be subject to claims for personal injury, property damages or governmental enforcement.For a discussion of potential environmental issues arising from a fire in our Phoenix distribution facility, please seeItem 3. Legal Proceedings.

10
EXECUTIVE OFFICERS
Certain information regarding the executive officers of the Company is set forth below:
Name Age Position
William E. Brown................................... 60 Chairman of the Board and Chief Executive Officer
Glenn W. Novotny.................................. 54 President, Chief Operating Officer and Director
Lee D. Hines, Jr. ..................................... 55 Vice President, Chief Financial Officer, Secretary and Director
Brooks M. Pennington III....................... 47 Chief Executive Officer of Pennington Seed, Inc. and Director
William E. Brown has been Chairman and Chief Executive Officer of the Company since 1980. From 1977 to1980, Mr. Brown was Senior Vice President of the Vivitar Corporation with responsibility for Finance, Operations,and Research & Development. From 1972 to 1977, he was with McKesson Corporation where he was responsiblefor its 200-site data processing organization. Prior to joining McKesson Corporation, Mr. Brown spent the first 10years of his business career at McCormick, Inc. in manufacturing, engineering and data processing.
Glenn W. Novotny has been President of the Company since June 1990 and was President of the predecessorWeyerhaeuser Garden Supply (“WGS”) since 1988. Prior thereto, he was with Weyerhaeuser Corporation for 20years with a wide range of managerial experience including manufacturing, accounting, strategic planning, sales,general management and business turnarounds.
Lee D. Hines, Jr. has been the Chief Financial Officer and Secretary of the Company since January 2000, aposition he previously held from 1991 until 1993. Mr. Hines began his business career with the Chase ManhattanBank in New York as a domestic and international lending officer and International Trade Specialist. From 1978 to1982, he served as Vice President Finance and Chief Financial Officer of Vivitar Corporation. Following his tenureat Vivitar, Hines held the position of Chief Financial Officer of Applause, Inc. until 1987. From 1988 to 1990, heserved as President and Chief Executive Officer of International Tropic-Cal, a designer, manufacturer anddistributor of sunglasses and women’s hair accessories. From 1993 until January 2000, Mr. Hines was a self-employed consultant.
Brooks M. Pennington III joined the Company in February 1998 when the Company acquired Pennington. Mr.Pennington has been the President and Chief Executive Officer of Pennington since June 1994.

11
Item 2. Properties
Central currently operates 24 manufacturing facilities totaling approximately 2,979,000 square feet and28 distribution facilities totaling approximately 3,220,000 square feet. Most distribution centers consist of officeand warehouse space, and several large bays for loading and unloading. Each distribution center provideswarehouse, distribution, sales and support functions for its geographic area under the supervision of a regionalmanager. Central’s executive offices are located in Lafayette, California.
The table below lists Garden Products’ manufacturing and distribution facilities:
Location Type of Facility Owned or Leased
Cullman, AL Distribution OwnedLittle Rock, AR Distribution Owned
Roll, AZ Manufacturing OwnedEl Centro, CA Manufacturing OwnedOntario, CA Distribution Leased
Richmond, CA Distribution LeasedSacramento, CA Distribution LeasedSan Leandro, CA Manufacturing LeasedSan Leandro, CA Distribution Leased
Santa Fe Springs, CA Distribution LeasedStockton, CA Manufacturing Leased
Longmont, CO Manufacturing OwnedClearwater, FL Manufacturing Leased
Orlando, FL Distribution LeasedEatonton, GA Manufacturing Owned
Madison, GA (2) Manufacturing OwnedMadison, GA Distribution Owned
Shady Dale, GA Manufacturing OwnedHammond, LA Distribution OwnedWoburn, MA Distribution LeasedLaurel, MD Distribution Leased
Greenfield, MO (2) Manufacturing OwnedGreenfield, MO Distribution Owned
Sidney, NE Manufacturing OwnedLebanon, OR Manufacturing OwnedPortland, OR Distribution LeasedColumbia, SC Distribution Owned
Dallas, TX Distribution LeasedHouston, TX Distribution Leased
Salt Lake City, UT Distribution LeasedKenbridge, VA Distribution Leased
Algona, WA Distribution Leased
The table below lists Pet Products’ manufacturing and distribution facilities:
Location Type of Facility Owned or Leased
Fontana, CA Manufacturing LeasedRialto, CA Manufacturing Owned
Sacramento, CA Distribution LeasedSanta Fe Springs, CA Distribution Leased
Denver, CO Distribution LeasedMiami, FL Distribution LeasedTampa, FL Distribution Leased
Abilene, KS Manufacturing OwnedMahwah, NJ Distribution Leased

12
Location Type of Facility Owned or Leased
Neptune City, NJ Manufacturing LeasedHauppauge, NY Manufacturing Owned
Cressona, PA Manufacturing OwnedDallas, TX Manufacturing LeasedDallas, TX Manufacturing Owned
Houston, TX Distribution LeasedAlgona, WA Distribution LeasedChilton, WI Manufacturing OwnedFranklin, WI Manufacturing Owned
Central’s leases generally expire between 2002 and 2008. Substantially all of the leases contain renewalprovisions with automatic rent escalation clauses. In addition to the facilities that are owned, Central’s fixed assetsare comprised primarily of trucks and warehousing, transportation and computer equipment.
Item 3. Legal Proceedings
TFH Litigation. In December 1997, the Company acquired all of the stock of TFH Publications, Inc. Inconnection with the transaction, the Company made a $10 million loan to the sellers, which was evidenced by aPromissory Note. In September 1998, the prior owners of TFH brought suit against the Company and certainexecutives of the Company for damages and relief from their obligations under the Promissory Note, alleging,among other things, that the Company’s failure to properly supervise the TFH management team had jeopardizedtheir prospects of achieving certain earnouts. The Company believes that these allegations are without merit. TheCompany counterclaimed against the prior owners for enforcement of the Promissory Note, damages and otherrelief, alleging, among other things, fraud, misrepresentation and breach of fiduciary duty by the prior owners ofTFH. These actions, Herbert R. Axelrod and Evelyn Axelrod v. Central Garden & Pet Company; Glen S. Axelrod;Gary Hersch; William E. Brown; Robert B. Jones; Glen Novotny; and Neill Hines, Docket No. MON-L-5100-99,and TFH Publications, Inc. v. Herbert Axelrod et al., Docket No. L-2127-99 (consolidated cases), are in the NewJersey Superior Court. The case is currently in pretrial discovery and is scheduled for trial in June 2002.
During the course of discovery in this action, the Company has become aware of certain information whichsuggests that prior to the acquisition of TFH by the Company, certain records of TFH were prepared in an inaccuratemanner which resulted in underpayment of taxes by certain individuals. Those individuals could be liable for backtaxes, interest, and penalties. In addition, even though all of the events occurred prior to the acquisition of TFH bythe Company, there is a possibility that TFH could be liable for penalties for events which occurred under priormanagement. The Company believes that TFH has strong defenses available to the assertion of any penalties againstTFH. The Company cannot predict whether TFH will be required to pay any such penalties. In the event that TFHwere required to pay penalties, the Company would seek compensation from the prior owners.
In March 2001, the prior owners of TFH also brought a separate action in federal court seeking to enforce whatthey alleged was an “arbitration award” made by an accountant concerning the closing balance sheet of TFH. Theprior owners contended that the decisions by the accountant concerning the closing balance sheet entitled them toadditional monies under the purchase price provisions of the Stock Purchase Agreement. The federal court held thatthe accountant did not make any monetary award. The federal court entered a judgment enforcing the decisionsmade by the accountant concerning the closing balance sheet of TFH, but the court did not, and refused to, enter amonetary award. See Evelyn M. Axelrod, et al. v. Central Garden & Pet Company, Civil Action No. 01-1262(MLC) U.S.D.C. of New Jersey. The prior owners have argued in the consolidated civil actions pending in the NewJersey Superior Court that the judgment by the federal court entitles them to additional monies under the purchaseprice provision of the Stock Purchase Agreement. The New Jersey Superior Court has stated that it will not, at thistime, enter a monetary award, but that it, like the federal court, will confirm the decisions made by the accountantconcerning the closing balance sheet of TFH. The New Jersey Superior Court has not yet issued a written Order onits rulings, but the Company anticipates such an Order shortly. The Company believes that it has defenses to theclaims by the prior owner for additional monies under the purchase price provisions of the Stock PurchaseAgreement, and that the prior owners’ claims are subject to or will be offset by the Company’s claims against theprior owners.
13
The Company, based on consultation with legal counsel, does not believe that the outcome of the above matterswill have a material adverse impact on its operations, financial position, or cash flows.
Scotts and Pharmacia Litigation. On June 30, 2000, The Scotts Company filed suit against Central to collectthe purchase price of certain lawn and garden products previously sold to Central. Scotts has filed an amendedcomplaint seeking $23 million for such products. Central has withheld payments to Scotts on the basis of claims ithas against Scotts - including amounts due for services and goods previously supplied by Central and not yet paidfor by Scotts. This action, The Scotts Company v. Central Garden & Pet Company, Docket No. C2 00-755, is in theUnited States District Court for the Southern District of Ohio, Eastern Division. On July 3, 2000, PharmaciaCorporation (formerly known as Monsanto Company) filed suit against Central seeking an accounting andunspecified amounts allegedly due Pharmacia under the four-year alliance agreement between Central andPharmacia which expired in September 1999, as well as damages for breach of contract. This action, PharmaciaCorporation v. Central Garden & Pet Company, Docket No. 00CC-002253 Q CV, is in the Circuit Court of St.Louis County, Missouri. Central filed motions in both the Scotts and Pharmacia actions to have those casesdismissed or stayed. Central's motion in the Scotts' action has been denied. In the Scotts action, Central has filed itsanswer and a counter complaint asserting various claims for breaches of contracts. Scotts has filed a motion todismiss one of Central’s claims, and that motion is still under submission by the court. Trial in the Scotts action iscurrently scheduled to begin in March 2002.
In the Pharmacia action, the court denied Central's motion to stay but granted Central's request that Scotts bejoined as a party. On January 18, 2001, Pharmacia Corporation filed an Amended Petition adding Scotts to thePharmacia action. On January 29, 2001, Central filed its Answer, including affirmative defenses, to the AmendedPetition as well as Counter/Cross claims against Pharmacia and Scotts. Pharmacia and Scotts have filed responses toCentral's counter and cross-claims. In addition, they filed a motion to stay claims other than claims arising under thealliance agreement between Central and Pharmacia. The Court granted this motion, thereby requiring that claimsagainst Scotts or Pharmacia arising from non-alliance matters be litigated in the Ohio and California's federalactions, as appropriate. Trial in the Pharmacia action is scheduled to begin on January 22, 2002.
Central believes that the reconciliation of all accounts and claims with Pharmacia and Scotts in the above casesand in the action described below will in the aggregate, not result in additional charges to Central. Further, Centralbelieves it has substantial counterclaims and rights of offset against both Scotts and Pharmacia, as well asmeritorious defenses, and intends to vigorously contest both suits. However, Central cannot assure you that theresolution of this litigation will not have a material adverse effect on its results of operations, financial positionand/or cash flows.
On July 7, 2000, Central filed suit against Scotts and Pharmacia seeking damages and injunctive relief as wellas restitution for, among other things, breach of contract and violations of the antitrust laws. This action, CentralGarden & Pet Company, a Delaware Corporation v. The Scotts Company, an Ohio corporation; and PharmaciaCorporation, formerly known as Monsanto Company, a Delaware corporation, Docket No. C 00 2465, is in theUnited States District Court for the Northern District of California. On October 26, 2000, the federal district courtissued an order denying, for the most part, Pharmacia's motion to dismiss Central's federal antitrust claims. Centralwas given leave to file an amended federal complaint to clarify certain of its allegations. Central filed a firstamended complaint on November 14, 2000. The defendants have answered the amended complaint, and trial isscheduled for July 15, 2002. The federal district court's October 26 order also ruled that it did not have jurisdictionover Central's state law claims and that such claims should be adjudicated in a state court. On October 31, 2000,Central filed an action entitled Central Garden & Pet Company v. The Scotts Company and PharmaciaCorporation, Docket No. C00-04586 in Contra Costa Superior Court asserting various state law claims, includingthe claims previously asserted in the federal action. On December 4, 2000, Pharmacia and Scotts filed a joint Motionto Stay. The state court has stayed the California action while the contract claims between and among the parties arelitigated in the Ohio and Missouri actions and the antitrust claims are litigated in the California federal action.
Phoenix Fire. On August 2, 2000, a fire destroyed Central's leased warehouse space in Phoenix, Arizona, andan adjoining warehouse space leased by a third party. The adjoining warehouse tenant has filed a lawsuit seeking torecover for property damage from the fire. Local residents have also filed a purported class action lawsuit allegingclaims for bodily injury and property damage as a result of the fire. The building owner and nearby businesses havealso presented claims for property damage and business interruption but have not filed lawsuits. In addition, the

14
Arizona Department of Environmental Quality is monitoring the cleanup operations and has asked Central, thebuilding owner and the adjoining warehouse tenant to assess whether the fire and fire suppression efforts may havecaused environmental impacts to soil, groundwater and/or surface water. The United States EnvironmentalProtection Agency has also requested information relating to the fire. The overall amount of the damages to allparties caused by the fire, and the overall amount of damages which Central may sustain as a result of the fire, havenot been quantified. At the time of the fire, Central maintained property insurance covering losses to the leasedpremises, Central's inventory and equipment, and loss of business income. Central also maintained insuranceproviding $51 million of coverage (with no deductible) against third party liability. Central believes that thisinsurance coverage will be available with respect to third party claims against Central if parties other than Centralare not found responsible. The precise amount of the damages sustained in the fire, the ultimate determination of theparties responsible and the availability of insurance coverage are likely to depend on the outcome of complexlitigation, involving numerous claimants, defendants and insurance companies.
Item 4. Submission of Matters to a Vote of Security Holders
None.
PART II
Item 5. Market for the Registrant’s Common Equity and Related Stockholder Matters
The Common Stock of the Company has been traded on the Nasdaq National Market under the symbol CENTsince the Company’s initial public offering on July 15, 1993. The following table sets forth, for the periodsindicated, the highest and lowest closing sale prices for the Common Stock, as reported by the Nasdaq NationalMarket.
Fiscal 2000 High LowFirst Quarter ............................................................................................................................ 9.63 6.94Second Quarter........................................................................................................................ 11.69 8.25Third Quarter........................................................................................................................... 12.13 8.72Fourth Quarter......................................................................................................................... 10.06 6.75
Fiscal 2001First Quarter ............................................................................................................................ 9.19 6.63Second Quarter........................................................................................................................ 8.97 6.81Third Quarter........................................................................................................................... 10.00 6.48Fourth Quarter......................................................................................................................... 9.75 7.13
As of September 29, 2001, there were approximately 154 holders of record of the Company’s Common Stockand seven holders of record of the Company’s Class B Stock.
Central has not paid any cash dividends on its common stock in the past. Central currently intends to retain anyearnings for use in its business and does not anticipate paying any cash dividends on its common stock in theforeseeable future. In addition, Central’s line of credit restricts its ability to pay dividends. See Note 5 of Notes toConsolidated Financial Statements.

15
Item 6. Selected Financial Data
The following selected income statement and balance sheet data of Central as of and for the fiscal years endedSeptember 27, 1997, September 26, 1998, September 25, 1999, September 30, 2000 and September 29, 2001 havebeen derived from our audited consolidated financial statements. The financial data set forth below should be readin conjunction with the Consolidated Financial Statements of the Company and related Notes thereto in “Item 8 -Financial Statements and Supplementary Data” and “Item 7 - Management’s Discussion and Analysis of FinancialCondition and Results of Operations” included elsewhere herein.
Fiscal Year EndedSeptember 27,
1997September 26,
1998September 25,
1999September 30,
2000September 29,
2001
(in thousands, except per share data)Income Statement Data:Net sales (1)(2) ........................................ $839,498 $1,293,330 $1,531,615 $1,350,878 $1,122,999Cost of goods sold and occupancy.......... 694,925 1,009,143 1,187,722 1,010,106 784,282
Gross profit....................................... 144,573 284,187 343,893 340,772 338,717Selling, general and administrative
expenses (2).......................................... 109,160 213,114 286,471 298,839 328,226
Other charges ........................................... – 6,903 2,708 27,156 – Income from operations........................... 35,413 64,170 54,714 14,777 10,491Interest expense – net .............................. (6,554) (7,609) (12,087) (22,551) (23,083)Other income............................................ 1,509 1,534 1,106 1,176 1,631Income (loss) before income taxes ......... 30,368 58,095 43,733 (6,598) (10,961)Income taxes ............................................ 12,765 24,402 19,243 5,215 (1,711)Net income (loss)..................................... $ 17,603 $ 33,693 $ 24,490 $ (11,813) $ (9,250)
Net income (loss) per common share:Basic ................................................. $ 1.11 $ 1.18 $ 0.90 $ (0.63) $ (0.50)Diluted .............................................. $ 1.07 $ 1.15 $ 0.89 $ (0.63) $ (0.50)
Weighted average sharesoutstanding:
Basic ................................................. 15,832 28,502 27,328 18,786 18,402Diluted .............................................. 19,970 33,007 27,437 18,786 18,402
September 27,1997
September 26,1998
September 25,1999
September 30,2000
September 29,2001
Balance Sheet Data:Working capital ....................................... $253,926 $ 277,713 $ 169,628 $ 121,128 $ 110,990Total assets............................................... 559,043 928,700 955,830 947,418 916,626Short-term borrowings ............................ 72 8,095 97,368 134,516 126,475Long-term borrowings............................. 115,200 125,125 123,898 148,242 151,623Shareholders’ equity................................ 281,807 588,774 495,727 463,947 455,315_________________(1) See Management’s Discussion and Analysis of Financial Condition and Results of Operations herein for a
discussion of sales fluctuations related to internal growth and business acquisitions for fiscal years 2001, 2000and 1999.
(2) Reflects the reclassification of $2.9 million and $4.3 million for fiscal 1999 and 2000, respectively, related tovolume-based rebate incentives offset by certain shipping and handling billings.

16
Item 7. Management’s Discussion and Analysis of Financial Condition and Results of Operations
Overview
In fiscal 2000, Central’s operations were grouped into three business segments, the lawn and garden brandedproducts business, the pet branded products business and the distribution business. In fiscal 2001, Centralreorganized its garden and pet businesses. Under the reorganization, Central’s garden branded products anddistribution businesses became one operating unit, “Garden Products”, while its pet branded products anddistribution businesses became another operating unit, “Pet Products”. For fiscal 2001, Garden Products and PetProducts accounted for approximately 57% and 43%, respectively, of consolidated net sales before corporateeliminations. These businesses accounted for income from operations before other charges and the allocation ofcertain corporate costs and eliminations of $7.4 million and $34.9 million, respectively, in fiscal 2001. TheCompany experienced a net loss of $9.3 million and $11.8 million for fiscal 2001 and 2000, respectively.
One of the measures management uses to evaluate the performance of its business segments is earnings beforeother charges, unusual items, interest, taxes and amortization and depreciation (EBITDA – excluding other income,other charges and unusual items), which represented income of $71.2 million and $79.3 million in fiscal 2001 and2000, respectively.
The discussion below, and the following presentation, are intended to assist the reader in understanding theresults of our operations. This presentation is not intended to replace net income (loss), cash flows or financialposition, as determined in accordance with accounting principles generally accepted in the United States of America.
Fiscal 2001 Fiscal 2000(in thousands)
Net sales ................................................................................................................... $1,123.0 $1,350.9
Net loss..................................................................................................................... $ (9.3) $ (11.8)Add: Other charges ........................................................................................ – 27.2
Unusual items........................................................................................ 32.3 11.3Interest expense – net............................................................................ 23.1 22.6
Less: Other income......................................................................................... (1.6) (1.2)Income tax (benefit) expense................................................................ (1.7) 5.2
EBIT (1) ................................................................................................................... 42.8 53.3Add: Depreciation and amortization ............................................................. 28.4 26.0
EBITDA (2) ............................................................................................................. $ 71.2 $ 79.3
__________(1) Earnings before other charges, unusual items, interest and taxes.
(2) Earnings before other charges, unusual items, interest, taxes and amortization and depreciation.
Shown below is a summary of these expenses, which the Company believes were unusual in nature during fiscal2001.
Pet Products Garden Products Corporate Company(in thousands)
Closed branches .............................................. $ 274 $ 3,910 $ – $ 4,184Personnel reductions....................................... 1,088 2,970 450 4,508Excess freight.................................................. – 2,063 – 2,063Legal & professional ...................................... 597 – 11,875 12,472Excess bad debt............................................... – 3,100 – 3,100Pre-press publication & inventory write-downs ................................................. 2,000 3,956 – 5,956
$3,959 $15,999 $12,325 $32,283

17
During the last two fiscal years, the Company has been adversely affected by a number of events.
At the end of fiscal 1999, the Company’s exclusive distribution agreement for Solaris products ended. Duringfiscal 2000, Scotts began to distribute both its Miracle Gro and Solaris products through a system that involved acombination of distributors as well as direct sales to certain major retailers. This change, compared with fiscal 1999,reduced revenue by approximately $176 million in fiscal 2000. Before the end of fiscal 2000, Scotts discontinuedits distribution relationship with the Company. As a consequence, sales volumes for future periods were expected tosignificantly decline, which resulted in the Company initiating a plan to close 13 distribution centers. The closuresand the related workforce reductions, employee benefit obligations and asset impairments resulted in “othercharges” for fiscal 2000 of $27.5 million. As a result, sales of other companies’ products by Garden Products infiscal 2001 declined approximately $275 million compared with fiscal 2000. Also in fiscal 2000, both Scotts andPharmacia initiated litigation against the Company arising out of the prior distribution relationship, and theCompany filed suit against Scotts and Pharmacia for breach of contract and violations of the antitrust laws asdiscussed above in “Item 3. Legal Proceedings.”
In August 2000, a fire destroyed the Company’s leased facility in Arizona and an adjoining warehouse spaceleased by a third party. Various parties have filed lawsuits, and both the Arizona Department of EnvironmentalQuality and the U.S. Environmental Protection Agency have requested information relating to the fire. Lawyers andspecialists representing several insurance companies have been meeting since August 2000 to determine the extentof liability for the various parties involved. At this time the precise amount of damages, the ultimate determinationof the parties responsible and the availability of insurance coverage are likely to depend on the outcome of complexlitigation.
Much of the discovery work on the above lawsuits and the other litigation described above in “Item 3. LegalProceedings” was conducted during fiscal 2001 and will continue into fiscal 2002. As a result of the litigation, theCompany incurred legal, accounting and other professional expenses of approximately $12.4 million in fiscal 2001and $3.8 million in fiscal 2000. The Company believes that legal and professional fees for fiscal 2002 willapproximate the fiscal 2001 level and will decline significantly in subsequent years.
Despite downsizing, the distribution operations of our Garden Products segment continued to adversely affectprofitability in fiscal 2001. In accordance with accounting principals generally accepted in the United States ofAmerica, certain costs related to the 13 closed distribution centers were not included as part of the $27.5 million of“other charges” recorded in fiscal 2000. These costs included wages and related benefits for those employees whostayed on to either sell off certain of the remaining inventory or arrange to ship inventory to other Central locations,or arrange to secure temporary storage until the inventory could be moved to other Central locations. Likewise,freight costs incurred to ship inventory from the closed locations to open facilities were not included in the fiscal2000 “other charges”. These costs were incurred and recorded in fiscal 2001.
The Company underestimated the costs the remaining distribution centers would incur to service customersformerly serviced by the closed locations. Since many of these customers were outside of the local area, most of theproduct sold to them was shipped by common carrier. Additionally, assimilating the extra inventory from the closedlocations created inefficient warehouse operations. With warehouse space severely limited because of the additionalinventory, picking, packing and shipping an order took significantly longer than normal. To ship product timelyunder these conditions meant increasing the amount of outside labor.
Also during the fourth quarter of fiscal 2001, two large customers of Garden Products filed for bankruptcy.
During the last quarter of fiscal 2001, and continuing in the first quarter of fiscal 2002, the Company furtherreduced personnel and related people costs in both our businesses. The reductions in our Garden Products segmentwere largely in the administrative areas where the Company consolidated certain computer operations andadministrative functions into one logistics operation.
Pet Products closed three smaller under performing distribution centers during fiscal 2001 and a smallmanufacturing facility which produced nylon collars and leashes. These products are now secured through outsidevendors. These closures resulted in additional facility and personnel costs being incurred in fiscal 2001 whichtotaled $1.5 million. In addition, sales of TFH pet books are declining due to, among other things, reduced floor

18
space allocated to books by the larger retailers in favor of other pet products which turn faster than books. However,book production was not reduced to meet the lower sales volume. On hand inventory of books included titles withlittle current consumer appeal, and in certain cases large quantities of books remained on hand, which had beenproduced in 1998 and prior. As a result, the Company recorded a charge of $1.5 million to reduce the carrying valueof book inventory to its estimated realizable value. In addition, $0.5 million of pre-press publication costs, whichwere being amortized over the anticipated useful life of specific titles, were determined to be unrecoverable in lightof the sales decline and were written off.
In Garden Products, Pennington wrote-down its Bahia grass seed inventory as a result of a significant decline inthe market price for that particular variety. In connection with the closure of 13 distribution centers in fiscal 2000,management evaluated the inventory remaining from such locations during fiscal 2001 to determine its estimatedrealizable value. Due to the age of the inventory which remained combined with the fact that more of this inventorybecame obsolete due to packaging changes made by the manufacturer, a further write-down was taken in fiscal2001.
Results of Operations
The following table sets forth, for the periods indicated, the relative percentages that certain income andexpense items bear to net sales:
Fiscal Year Ended
September 29,2001
September 30,2000
September 25,1999
Net sales ...................................................................................................... 100.0% 100.0% 100.0%Cost of goods sold and occupancy............................................................. 69.8 74.8 77.5Gross profit ................................................................................................. 30.2 25.2 22.5Selling, general and administrative............................................................ 29.2 22.1 18.7Other charges .............................................................................................. — 2.0 0.2Income from operations.............................................................................. 1.0 1.1 3.6Interest expense, net ................................................................................... (2.1) (1.7) (0.8)Other income............................................................................................... 0.1 0.1 0.1Income tax expense (benefit) ..................................................................... (0.2) 0.4 1.3Net income (loss)........................................................................................ (0.8)% (0.9)% 1.6%
Fiscal 2001 Compared with Fiscal 2000
Net sales for fiscal 2001 decreased by 16.9% or $227.9 million to $1,123.0 million from $1,350.9 million forfiscal 2000. The decrease is due to a $243.1 million decrease in net sales of Garden Products offset in part by a salesincrease in Pet Products of $15.2 million. Adjusting for newly acquired operations, the sales decrease in GardenProducts was $252.8 million and in Pet Products net sales would have resulted in a decrease of $32.7 million. Thedecrease in Garden Products relates to the sales and logistics group, which was expected after we closed 13distribution centers in late fiscal 2000 as a result of the termination of our distribution relationship with Scotts. Thesales decrease in our Pet Products business was attributable to the closure of three pet distribution centers duringfiscal 2000 and a modest decline in Kaytee sales of wild birdseed. In fiscal 2001, Arch, a major pool chemicalsupplier, and Kal Kan, a supplier of dog food, notified us that they each intend to terminate their relationship withthe Company and distribute their products directly to retailers. In fiscal 2001, sales of Arch products wereapproximately $50.5 million. The gross profit associated with these sales in fiscal 2001 was approximately $8.0million. Sales of Kal Kan products to independent retailers were approximately $8.5 million in fiscal 2001. Thegross profit associated with these sales in fiscal 2001 was estimated to be $0.9 million based on historical customerprofitability. In addition, the Kal Kan business lost includes approximately $5.8 million of fees related to shipmentsto PETsMART. The loss of the Kal Kan business contributed to the decision to close two smaller pet distributioncenters during the first quarter of fiscal 2002 with a third facility closure planned for February 2002.
Gross profit decreased by $2.1 million or 0.6% from $340.8 million during fiscal 2000 to $338.7 million forfiscal 2001. Adjusting for newly acquired operations, gross profit would have decreased by 3.9% or $13.2 million.
19
The decrease in gross profit dollars relates principally to the sales and logistics group within Garden Products, whilePet Products generated approximately the same gross profit dollars as in fiscal 2000. Gross profit for both segmentswas adversely affected by inventory and inventory related write-downs in fiscal 2001. In Pet Products, TFH reducedthe carrying value of their book inventory by $1.5 million and wrote off $0.5 million of pre-press publication costs.The inventory write-down is primarily the result of a continuing sales decline in pet books which in turn has createdexcess and obsolete book inventory. The decline in pet book sales relates principally to reduced floor spaceallocated to books by the large retailers coupled with a reduction in the number of titles they will carry. In GardenProducts, Pennington wrote-down its Bahia grass seed inventory by $1.7 million as a result of a significant declinein the market price for that particular variety. In connection with the closure of 13 distribution centers in fiscal2000, management, at the existing centers, evaluated the inventory at these facilities to determine the amount ofpotential overstock and to assess how much inventory could be moved to those locations which would remain open.This evaluation resulted in a write-down of $7.5 million in fiscal 2000 to adjust the inventory to its estimatedrealizable value. Due to the age of the inventory which remained combined with the fact that more of this inventorybecame obsolete due to packaging changes made by the manufacturer, management’s evaluation of its estimatedrealizable value resulted in a further write-down of $2.2 million in fiscal 2001.
Gross profit as a percentage of sales increased to 30.2% during fiscal 2001 from 25.2% for fiscal 2000. Thepercentage improvement is principally due to a reduction in sales of other companies’ products within GardenProducts, which accounted for a significantly lower percentage of total sales. Sales of other companies’ productsresult in lower gross margins compared to sales of Central’s own proprietary branded products. Overall, GardenProducts’ gross profit improved from 25.2% in fiscal 2000 to 27.0% in fiscal 2001.
Selling, general and administrative expenses increased by $29.4 million or 9.8% from $298.8 million duringfiscal 2000 to $328.2 million in fiscal 2001. Of the $29.4 million increase, approximately $17.8 million wasattributable to newly acquired businesses. As a percentage of net sales, selling, general and administrative expensesincreased from 22.1% during fiscal 2000 to 29.2% for fiscal 2001.
Selling and delivery expenses decreased by $9.2 million, which was net of a $10.0 million increase related tonewly acquired operations, from $146.7 million in fiscal 2000 to $137.5 million in fiscal 2001. The decrease inselling and delivery expenses related to existing business in fiscal 2001 relates principally to a sales decline inGarden Products compared with fiscal 2000 of $243.1 million offset by increased freight costs. Included in fiscal2001 selling and delivery expense was approximately $2.1 million attributable to the closure of three Pet Productsbranches during fiscal 2001 and increased freight costs to service out of market customers transferred from GardenProducts 13 distribution centers closed in fiscal 2000.
Facilities expense decreased by $0.6 million from $14.4 million in fiscal 2000 to $13.8 million in fiscal 2001.Included in fiscal 2001 is approximately $0.5 million related to newly acquired businesses.
Warehouse and administrative expenses increased $39.2 million to $176.9 million in fiscal 2001 from $137.7million in fiscal 2000. Of the $39.2 million increase, approximately $7.3 million related to newly acquiredbusinesses. Of the $31.9 million increase from existing operations, approximately $4.0 million was attributable toPet Products, $17.5 million to Garden Products and $10.4 million to corporate. The increase of $31.9 millioncompared with fiscal 2000 related principally to 1) additional bad debt provisions of $4.5 million, of which $3.1million relates to two large Garden Products’ customers who went bankrupt or ceased operations during the lastmonth of fiscal 2001; 2) increased legal and professional fees of $5.4 million, which included in fiscal 2001approximately $12.4 million associated with the fire at our Arizona warehouse and the litigation work related to theScotts and T.F.H. lawsuits; 3) an increase in general and medical insurance of $2.4 million; 4) increaseddepreciation and goodwill amortization of $2.4 million; 5) as a result of the closure of Garden Products’ and PetProducts’ locations, there has been a significant decrease in both sales and inventory levels, which resulted in an$11.5 million increase in the amount of purchasing, merchandise handling and storage costs charged to warehouseand administration expense, and not included as inventory costs, compared to the prior year; 6) increasedinformation systems costs of $0.9 million – primarily new systems being implemented to centralize sales, marketing,inventory and financial data; 7) an increase in personnel and other professional costs for research and developmentof $0.6 million; and 8) increases in office rents and general increases in normal operating expenses of $4.2 million.

20
Net interest expense for the fiscal year ended September 29, 2001 increased by $0.5 million to $23.1 millionfrom $22.6 million for the fiscal year ended September 30, 2000. The increase is due to new long term borrowingsresulting principally from the businesses acquired, offset by lower average short-term interest rates.
Average short-term borrowings for the fiscal year ended September 29, 2001 were $160.3 million comparedwith $159.2 million for the fiscal year ended September 30, 2000. The average short-term interest rates for thefiscal years ended September 29, 2001 and September 30, 2000 were 7.5% and 9.0%, respectively.
During fiscal 2001, the Company recognized a tax benefit of $1.7 million on a pre-tax loss of $11.0 million.The tax benefit was affected by certain goodwill amortization which is not deductible for income tax purposes.
Fiscal 2000 Compared with Fiscal 1999
Net sales for fiscal 2000 decreased by 11.8% or $180.7 million to $1,350.9 million from $1,531.6 million forfiscal 1999. The decrease was due to a $218.7 million decrease in Garden Products’ sales ($261.1 millionattributable to reduced sales of other companies’ products, primarily sales of Solaris’ products, which was partiallyoffset by $12.7 million in sales of existing branded product offerings and $29.7 million in sales attributable tobusinesses acquired – Norcal Pottery, acquired in January 1999; Unicorn Laboratories, acquired in December 1999;and the Amdro and Image product lines, acquired in March 2000) being partially offset by a $38.0 million increasein Pet Products sales.
Gross profit decreased by $3.1 million or 0.9% from $343.9 million during fiscal 1999 to $340.8 million forfiscal 2000. Gross profit as a percentage of net sales increased from 22.5% for fiscal 1999 to 25.2% for fiscal 2000.The decrease in gross profit dollars was principally related to a $13.9 million decrease in Garden Products’ grossprofit partially offset by a $10.8 million increase in Pet Products’ gross profit. As a result of resizing our lawn andgarden distribution operations, the carrying value of inventory at the distribution centers to be closed was evaluatedto determine what products could be moved to the locations remaining open, how much of it would representsignificant overstock and what products would have to be liquidated at the individual distribution centers. Thisevaluation resulted in a write-down of lawn and garden inventory of $7.5 million to adjust such inventory to itsestimated realizable value. This write-down resulted in an increase in cost of goods sold and occupancy of $2.6million in fiscal 2000 compared with the inventory write-down of $4.9 million recorded in fiscal 1999. The increasein gross profit as a percentage of net sales was primarily driven by an increase in Garden Products resulting from alarger proportion of higher margin branded product sales relative to total sales due to the reduction in sales of lowmargin Solaris products principally to retailers’ distribution centers. Pet Products’ gross profit percentage remainedrelatively constant.
Selling, general and administrative expenses increased $12.4 million, or 4.3% from $286.4 million during fiscal1999 to $298.8 million for fiscal 2000. Of the $12.4 million increase, approximately $8.3 million was attributed tonewly acquired businesses. As a percentage of net sales, selling, general and administrative expenses increasedfrom 18.7% during fiscal 1999 to 22.1% for fiscal 2000. Selling and delivery expenses increased by $1.6 millionfrom $145.1 million in fiscal 1999 to $146.7 million in fiscal 2000. Of this increase, $3.7 million related to newlyacquired businesses. These increases were offset by a decrease from existing operations of $2.1 million primarilyattributable to a $6.7 million decrease in lawn and garden distribution operations resulting from lower sales, offsetby a $4.6 million increase principally related to Pennington as a result of increased coop and media advertising, andexpanded use of common freight carriers coupled with increased fuel costs. Facilities expense totaled $14.4 millionin both fiscal 1999 and 2000. This results from an increase in costs associated with newly acquired businesses of$0.3 million, offset by a reduction in costs associated with existing operations of $0.3 million. The decrease inexisting operations related principally to lawn and garden distribution operations resulting from certain facilitieswhich were closed during fiscal 1999. Warehouse and administrative expense increased $10.7 million from $127.0million in fiscal 1999 to $137.7 million in fiscal 2000. Of this increase, $4.3 million related to newly acquiredbusinesses. The increase from existing operations, $6.4 million, related principally to increases in legal andprofessional fees of $5.3 million related to our strategic planning and evaluation process, increases in corporatepersonnel and related travel of $0.7 million and $0.4 million in additional corporate office space costs.
In September 2000, the Company recorded $27.5 million of charges resulting from workforce reductions,employee benefit obligations, facility closures, and asset impairments that were necessary due to the termination of

21
the Company’s distribution arrangement with Scotts and other anticipated sales decreases in Garden Products.These charges were offset by the reversal of $0.3 million of certain exit-related costs recorded in connection with thefiscal 1998 restructuring plan for which the Company was no longer obligated.
As a result of the fiscal 2000, and anticipated future, sales decreases in Garden Products, the Company initiateda plan to close 13 distribution centers and reduce its workforce which was completed in fiscal 2001. In connectionwith this plan, the Company recorded a severance charge of $1.1 million associated with the termination of 309employees, primarily in the sales force and distribution centers. Severance of $0.7 million was paid to 196employees terminated during fiscal 2000, with the balance expected to be paid to employees who will be terminatedin fiscal 2001. In connection with the facilities closures, $3.6 million was accrued for estimated lease costs, and$0.2 million for estimated property tax and facilities maintenance costs, that the Company is obligated to pay forperiods subsequent to closure. The Company also recorded an $0.8 million impairment charge to reduce certainfacility assets to their estimated fair value based on an independent appraisal, and an $0.8 million provision forestimated uncollectible receivables from customers of the closed facilities.
In addition, as a direct result of the termination of the distribution relationship with Scotts, the Companyrecorded a charge of $4.7 million as the Company became obligated to make cash payments which were guaranteedto certain employees in the event of such termination. These payments were paid during fiscal 2001.
As a result of the events described above, management reevaluated the recoverability of certain intangible assetsin Garden Products. Based on an evaluation of estimated future cash flows associated with affected facilities, theCompany determined that goodwill and certain trademarks were impaired, and accordingly recorded charges of$15.7 million and $0.6 million, respectively, to reduce those assets to estimated fair values.
Net interest expense for the fiscal year ended September 30, 2000 increased by $10.5 million to $22.6 millionfrom $12.1 million for the fiscal year ended September 25, 1999. The increase is due to higher average outstandingshort-term debt resulting principally from the Company’s stock repurchase program and the businesses acquired.During the fiscal year ended September 30, 2000, the Company repurchased 2,890,900 shares of its stock for a totalcost of approximately $21.7 million, primarily through the use of its revolving credit facility.
Average short-term borrowings for the fiscal year ended September 30, 2000 were $159.2 million comparedwith $65.8 million for the fiscal year ended September 25, 1999. The average short-term interest rates for the fiscalyears ended September 30, 2000 and September 25, 1999 were 9.0% and 7.5%, respectively.
During fiscal 2000 the Company recognized tax expense of $5.2 million on a pre-tax loss of $6.6 millionprimarily as the result of non-deductible charges, primarily goodwill amortization and impairment charges, recordedduring the year.
New Accounting Pronouncements
See Note 1, “Organization and Significant Accounting Policies” in the accompanying consolidated financialstatements.
Inflation
The results of operations and financial condition are presented based upon historical cost. While it is difficult toaccurately measure the impact of inflation, the Company believes that the effects of inflation on its operations havebeen immaterial.
Liquidity and Capital Resources
The Company has financed its growth through a combination of bank borrowings, supplier credit, internallygenerated funds and sales of securities to the public. The Company received net proceeds (after offering expenses)of approximately $431.0 million from its five public offerings of common stock in July 1993, November 1995, July

22
1996, August 1997 and January 1998. In November 1996, the Company completed the sale of $115 million 6%subordinated convertible notes generating approximately $112 million net of underwriting commissions.
Historically, the Company’s business has been highly seasonal and its working capital requirements and capitalresources tracked closely to this seasonal pattern. During the first fiscal quarter accounts receivable reach theirlowest level while inventory, accounts payable and short-term borrowings begin to increase. Since the Company’sshort-term credit line fluctuates based upon a specified asset borrowing base, this quarter is typically the periodwhen the asset borrowing base is at its lowest and consequently the Company’s ability to borrow is at its lowest.During the second fiscal quarter, receivables, accounts payable and short-term borrowings begin to increase,reflecting the build-up of inventory and related payables in anticipation of the peak selling season. During the thirdfiscal quarter, inventory levels remain relatively constant while accounts receivable peak and short-term borrowingsstart to decline as cash collections are received during the peak selling season. During the fourth fiscal quarter,inventory levels are at their lowest, and accounts receivable and payables are substantially reduced throughconversion of receivables to cash. As a result of the termination of the Solaris agreement and the associatedreduction in distribution sales as a percentage of overall sales, this seasonal pattern is expected to be less significantin the future.
The Company’s businesses service two broad markets: lawn and garden and pet supplies. The pet suppliesbusinesses involve products that have a year round selling cycle with very little change quarter to quarter. As aresult, it is not necessary to carry large quantities of inventory to meet peak demands. Additionally, this level salescycle eliminates the need for manufacturers to give extended credit terms to either distributors or retailers. On theother hand, the Garden Products’ businesses are highly seasonal with approximately 66% of their aggregate salesoccurring during the fiscal second and third quarters. For many manufacturers of garden products this seasonalityrequires them to move large quantities of their product well ahead of the peak selling periods. To encouragedistributors to carry large amounts of inventory, industry practice has been for manufacturers to give extended creditterms and/or promotional discounts.
The Company generated cash from operating activities of $38.8 million during fiscal 2001, which declined from$40.1 million during fiscal 2000, primarily due to the decline in sales volume during the year. Net cash used ininvesting activities of $32.2 million resulted from acquisitions of new companies and the acquisition of office andwarehouse equipment, including computer hardware and software. Net cash used in financing activities of $4.0million consisted principally of net repayments of $9.8 million under the Company’s lines of credit and payments of$12.8 million related to long-term debt, partially offset by $18.0 million in new long-term borrowings.
The Company has a $200.0 million line of credit with Congress Financial Corporation (Western). The availableamount under the line of credit fluctuates based upon a specific asset-borrowing base. The line of credit bearsinterest at a rate either equal to the prime rate or LIBOR plus 2% at the Company’s option, and is secured bysubstantially all of the Company’s assets. At September 29, 2001, the Company had $83.1 million of outstandingborrowings, and had $16.8 million of available borrowing capacity under this line. The Company’s line of creditcontains certain financial covenants such as minimum net worth and minimum working capital requirements. Theline also requires the lender’s prior written consent to any acquisition of a business. The Company’s Penningtonsubsidiary also has a $85.0 million line of credit. At September 29, 2001, there were $31.6 million of outstandingborrowings and $53.4 million of available borrowing capacity under this line. Interest related to this line is based ona rate either equal to the prime rate or LIBOR plus .875% at the Company’s option. The Company All-GlassAquarium subsidiary also has a $10.0 million line of credit. As of September 29, 2001, there were $4.6 million ofborrowings and $5.4 million of available borrowing capacity under this line. Interest related to this line is based ona rate equal to the prime rate less 0.5% (6% at September 29, 2001).
Excluding the potential impact of any adverse consequences associated with legal matters discussed below andin more detail in “Item 3. Legal Proceedings”, the Company believes that cash flows from operating activities,funds available under its lines of credit, and arrangements with suppliers will be adequate to fund its presentlyanticipated working capital requirements for the foreseeable future. The Company anticipates that its capitalexpenditures will not exceed $15.0 million for the next 12 months.
The Company is involved in a number of lawsuits, several of which could result in substantial monetaryjudgments. This litigation includes three significant cases between the Company and Scotts and Pharmacia which

23
are currently set for trial on January 2002, March 2002 and July 2002, respectively. Depending on how and whenthese lawsuits are resolved, these lawsuits could result in substantial changes to the Company’s liquidity position –either favorable or unfavorable. The Company is currently exploring a number of possible ways to enhance itsliquidity, including, among other things, additional debt financing by the Company or one or more of its subsidiariesand/or an equity offering.
In November 1996, the Company issued $115 million of 6% subordinated convertible notes. The principalamount of the notes will become due on November 15, 2003, unless converted into common stock by the holders orredeemed by the Company prior to maturity.
As part of its growth strategy, the Company has engaged in acquisition discussions with a number of companiesin the past and it anticipates it will continue to evaluate potential acquisition candidates. If one or more potentialacquisition opportunities, including those that would be material, become available in the near future, the Companymay require additional external capital. In addition, such acquisitions would subject the Company to the generalrisks associated with acquiring companies, particularly if the acquisitions are relatively large.
Weather and Seasonality
Historically, the Company’s sales of lawn and garden products have been influenced by weather and climateconditions in the markets it serves. Additionally, the Company’s business has historically been highly seasonal. Infiscal 2001, approximately 66% of Garden Products’ sales occurred in the first six months of the calendar year.Substantially all of Garden Products’ operating income is typically generated in this period which has historicallyoffset the operating losses incurred during the first fiscal quarter of the year.
Risk Factors Relating to Forward-Looking Statements
This Form 10-K contains forward-looking statements that involve risks and uncertainties. These forwardlooking statements include information regarding future financial results, the estimated effect of the termination ofthe Solaris Agreement and future acquisition activity. Our actual results could differ materially from thoseanticipated in these forward-looking statements as a result of factors both in and out of our control, including therisks faced by us described below and elsewhere in this Form 10-K.
You should carefully consider the risks described below. We have separated the risks into three groups:
• risks that relate to Central generally;
• risks that relate to Garden Products; and
• risks that relate to Pet Products.
In addition, the risks described below are not the only ones facing us. We have only described the risks we considerto be the most material. However, there may be additional risks that are viewed by us as not material or are notpresently known to us.
If any of the events described below were to occur, our business, prospects, financial condition, results ofoperations and/or cash flows could be materially adversely affected. When we say below that something could orwill have a material adverse effect on us, we mean that it could or will have one or more of these effects. In any suchcase, the price of our common stock could decline, and you could lose all or part of your investment in ourcompany.

24
Risks Relating to Central Generally
Our quarterly operating results are susceptible to fluctuations, which could cause our stock price to decline.
We expect to continue to experience variability in our net sales and net income on a quarterly basis. Factors thatmay contribute to this variability include:
• weather conditions and seasonality during peak gardening seasons;
• shifts in demand for lawn and garden products;
• shifts in demand for pet products;
• changes in product mix, service levels and pricing by us and our competitors;
• the effect of acquisitions;
• economic stability of retail customers; and
• the extent of lost business from the termination of distribution relationships, such as with Scotts, and ourability to offset the loss of gross profit as a result of the terminations through expense reductions and otherbusiness growth.
In addition, because our distribution businesses operate on relatively low margins, our operating results in anyquarterly period could be affected significantly by slight variations in revenues or operating costs. For the samereason, our quarterly results also may be vulnerable to problems in areas such as collectibility of accountsreceivable, inventory control and competitive price pressures. The market price of our common stock could besubject to significant fluctuations in response to these variations in quarterly operating results and other factors.
Because of intense competition, Central’s distribution related sales generate low margins.
The lawn and garden and pet supply distribution industries in which we operate are characterized by relativelylow profit margins. As a result, Central’s success is highly dependent upon effective cost and management controlsand differentiating its services from those of its competitors. The wholesale lawn and garden and pet supplydistribution businesses are highly competitive, with many companies competing principally on the basis of price andservice. In addition to competition from other distributors, Central also competes with manufacturers and suppliersthat elect to distribute certain of their products directly to retailers, including Central’s major customers, and privatelabel product suppliers. For example, beginning in fiscal 2000, Scotts began to distribute Ortho®, Roundup® andMiracle-Gro® directly to certain retailers. Similarly, in 2001, Arch Pool Chemicals and Kal Kan Foods notifiedCentral that they intend to terminate their distribution relationships with Central and distribute their products directlyto retailers. There can be no assurance that Central will not encounter increased competition in the future or will notlose business from major manufacturers that elect to sell their products directly to retailers, either of which couldadversely affect our operations and financial results.
Our ability to grow will depend upon internal expansion and acquisitions.
As part of our growth strategy, we aggressively pursue the acquisition of other companies, assets and productlines that either complement or expand our existing business. Acquisitions involve a number of special risks,including the diversion of management’s attention to the assimilation of the operations and personnel of the acquiredcompanies, adverse short-term effects on our operating results, integration of financial reporting systems and theamortization of acquired intangible assets. Since 1993, Central has completed over 29 acquisitions. There can be noassurance that we can successfully integrate acquired businesses or that such businesses will enhance our business.We have also had preliminary acquisition discussions with, or have evaluated the potential acquisition of, numerousother companies over the last several years. We are unable to predict the likelihood of a material acquisition being

25
completed in the future. We may seek to finance any such acquisition through additional debt or equity financings,which could result in dilution and additional risk for the holders of our common stock.
We anticipate that one or more potential acquisition opportunities, including those that would be material, maybecome available in the near future. If and when appropriate acquisition opportunities become available, we intendto pursue them actively. No assurance can be given that any acquisition by us will or will not occur, that if anacquisition does occur that it will not materially and adversely affect us or that any such acquisition will besuccessful in enhancing our business. Our future results of operations will also depend in part on our ability tosuccessfully expand internally by increasing the number of new product lines, and to manage any future growth. Noassurance can be given that we will be able to obtain or integrate additional product lines or manage any futuregrowth successfully.
Our success is dependent upon retaining key personnel.
Our future performance is substantially dependent upon the continued services of William E. Brown, ourChairman and Chief Executive Officer, Glenn W. Novotny, our President and Chief Operating Officer, and BrooksM. Pennington III, the President of Pennington. The loss of the services of any of these persons could have amaterial adverse effect upon us. In addition, our future performance depends on our ability to attract and retainskilled employees. There can be no assurance that we will be able to retain our existing personnel or attractadditional qualified employees in the future.
The holders of our Class B stock, through their voting power, can greatly influence control of the Company.
As of December 5, 2001, William E. Brown, our Chairman and Chief Executive Officer, controls approximately47.9% of the voting power of our capital stock and, therefore, can effectively control all matters requiringstockholder approval, including the power to elect all of our directors. Holders of Class B stock are entitled to thelesser of ten votes per share or 49% of the total votes cast. Holders of common stock are entitled to one vote foreach share owned. The holders of Class B stock have 49% of the combined voting power, subject to theaforementioned voting restrictions. Holders of Class B stock are likely to be able to elect all of our directors, controlour management and policies and determine the outcome of any matter submitted to a vote of our stockholdersexcept to the extent that a class vote of the common stock is required by applicable law. The disproportionate votingrights of the common stock and Class B stock could have an adverse effect on the market price of the commonstock. Such disproportionate voting rights may make us a less attractive target for a takeover than we otherwisemight be, or render more difficult or discourage a merger proposal, a tender offer or a proxy contest, even if suchactions were favored by our common stockholders. Accordingly, such disproportionate voting rights may depriveholders of common stock of an opportunity to sell their shares at a premium over prevailing market prices, sincetakeover bids frequently involve purchases of stock directly from stockholders at such a premium price.
The products that we manufacture and distribute may subject us to environmental considerations.
Many of the products that we manufacture and distribute are subject to regulation by federal, state and localauthorities. Such regulations are often complex and are subject to change. Environmental regulations may affect usby restricting the manufacturing or use of our products or regulating their disposal. Regulatory or legislativechanges may cause future increases in our operating costs or otherwise affect operations. Although we believe weare and have been in substantial compliance with such regulations and has strict internal guidelines on the handlingand disposal of our products, there is no assurance that in the future we may not be adversely affected by suchregulations or incur increased operating costs in complying with such regulations. However, neither the compliancewith regulatory requirements nor our environmental procedures can ensure that we will not be subject to claims forpersonal injury, property damages or governmental enforcement.
The products that we manufacture could expose us to product liability claims.
Our business exposes us to potential product liability risks, which are inherent in the manufacture anddistribution of certain of our products. Although we generally seek to insure against such risks, there can be noassurance that such coverage is adequate or that we will be able to maintain such insurance on acceptable terms. A

26
successful product liability claim in excess of our insurance coverage could have a material adverse effect on us andcould prevent us from obtaining adequate product liability insurance in the future on commercially reasonable terms.
We have pending litigation which could adversely impact our operating results.
We are a party to certain legal proceedings including the litigation between us and Scotts and Pharmacia arisingout of disputes regarding the termination of the Solaris Agreement and litigation arising from a fire which destroyedour Phoenix, Arizona facility. We are currently unable to determine the total expense or possible loss, if any, thatmay ultimately be incurred in the resolution of these proceedings. Regardless of the ultimate outcome of theseproceedings, they could result in significant diversion of time by our management. The results of these proceedings,including any potential settlements, are uncertain and we cannot assure you that the outcome of these disputes willnot adversely affect our operating results. Among the proceedings in which we are involved are three significantcases between us and Scotts and Pharmacia which are currently set for trial on January 2002, March 2002 and July2002, respectively. Depending on how and when these lawsuits are resolved, these lawsuits could result insubstantial changes to the Company’s liquidity position – either favorable or unfavorable. For more information onour pending litigation, please see “Item 3. Legal Proceedings.”
Risks Relating to Garden Products
Adverse weather during the peak gardening season can hurt Garden Products’ and our net sales.
Because demand for lawn and garden products is significantly influenced by weather, particularly weekendweather during the peak gardening season, our results of operations could be adversely affected by certain weatherpatterns such as unseasonably cool or warm temperatures, water shortages or floods. During the last several years,our results of operations were negatively affected by severe weather conditions in some parts of the country.Additionally, our business is highly seasonal, with approximately 66% of Garden Products’ sales in fiscal 2001occurring during the second and third quarters of the fiscal year. Historically, substantially all of Garden Products’operating income is generated in this period.
An increase in market prices for seeds and grains used to produce bird seed and grass seed or a decrease in demandfor bird seed or grass seed could have a negative impact on our operating income.
Garden Products’ financial results depend to a large extent on the cost of raw materials and the ability ofGarden Products to pass along to its customers increases in these costs. In particular, our Pennington subsidiary isexposed to fluctuation in market prices for commodity seeds and grains, used to produce bird seed and grass seed.Historically, market prices for commodity seeds and grains have fluctuated in response to a number of factors,including changes in United States government farm support programs, changes in international agricultural andtrading policies and weather conditions during the growing and harvesting seasons. For example, a significant rise inthe white millet acquisition cost in late 2000 and 2001 had a negative impact on profitability of bird feed products infiscal 2001, although we do not believe this will be a long-term problem. In the event of any increases in rawmaterials costs, Garden Products would be required to increase sales prices for its products in order to avoid margindeterioration. We cannot assure you as to the timing or extent of Garden Products’ ability to implement future priceadjustments in the event of increased raw material costs or as to whether any price increases implemented by GardenProducts may affect the volumes of future shipments.
In fiscal 2001, Garden Products was adversely affected by a worldwide oversupply of certain grass seedsbrought on by a combination of weather issues, generally poor economic conditions in agriculture, and diseases, likehoof and mouth and mad cow, that reduce demand for seed. If the oversupply extends into fiscal 2002, ouroperating results would suffer.
To protect against changes in market prices, we generally enter into purchase contracts for grains, bird seed andgrass seed to cover up to approximately one-third of the purchase requirements for a selling season. Since we hedgeonly a portion of our purchase requirements, if market prices for grains increase, our cost of production wouldincrease. In contrast, if market prices for grains decrease because of a lack of demand, we may end up purchasinggrains and seeds pursuant to the purchase contracts at prices above market.

27
Garden Products depends on a few customers, including Wal*Mart, Lowes and Home Depot, for a significantportion of its net sales.
Garden Products’ largest customer is Wal*Mart, which accounted for approximately 31%, 36% and 32% of itsnet sales for fiscal 2001, fiscal 2000 and fiscal 1999, respectively. Garden Products’ second largest customer isHome Depot, which accounted for approximately 11%, 7% and 12% of its net sales for fiscal 2001, fiscal 2000 andfiscal 1999, respectively. Sales to Lowe’s accounted for approximately 9%, 7% and 8% of its net sales for fiscal2001, fiscal 2000 and fiscal 1999, respectively. The market share of these three retailers in the lawn and gardenindustry has increased during the last several years.
During fiscal 2000, Wal*Mart began to have certain products delivered to its internal distribution centers ratherthan directly to stores, which adversely affected our revenue from these products. Subsequent to the fiscal 2000year end, Wal*Mart informed Central of a number of significant changes in its lawn and garden supplies purchasingprograms and procedures for the coming year. These include Wal*Mart’s decision to purchase certain lawn andgarden supplies directly from a number of manufacturers whose lawn and garden supplies had previously been soldthrough Central; a change from “store door” deliveries of many of the lawn and garden supplies formerly deliveredby Central to individual Wal*Mart stores to a new procedure whereby Central will ship these products to Wal*Martdistribution centers; and Wal*Mart’s decision not to have Central personnel perform lawn and garden suppliesmerchandising functions inside Wal*Mart stores. As a result of these factors, and the closing of 13 distributioncenters associated with the Garden Products restructuring, Garden Product’s sales of lawn and garden supplies toWal*Mart in 2001 declined significantly. The distribution facility closures coupled with the absence of ourdistributing Scotts products in 2001 has also adversely impacted other customer relationships.
The loss of, or significant adverse change in, the relationship between us and Wal*Mart, Home Depot orLowe’s could cause our net sales and income from operations to decline. The loss of or reduction in orders fromany significant customer, losses arising from customer disputes regarding shipments, fees, merchandise condition orrelated matters, or our inability to collect accounts receivable from any major customer could reduce our incomefrom operations.
Our net sales and operating income from distributing other company’s garden products decreased significantly infiscal 2001 due to the termination of our distribution relationship with Scotts and may continue to decrease in thefuture.
From October 1, 1995 to September 30, 1999, we distributed Solaris product nationwide, pursuant to anexclusive distribution agreement. Sales of products purchased from Solaris, previously our largest supplier,accounted for approximately 37% of Garden Product’s net sales and 27% of Central’s net sales during fiscal 1999.In January 1999, Pharmacia sold its Solaris lawn and garden business exclusive of its Roundup® herbicide productsfor consumer use to Scotts and entered into a separate, long-term, exclusive agreement pursuant to which Pharmaciacontinues to make Roundup herbicide products for consumer use and Scotts markets the products. BeginningOctober 1, 1999, Scotts began to distribute Ortho® and Roundup® products through a system that involved acombination of distributors, of which we were the largest, as well as through direct sales by Scotts to certain majorretailers. In addition, Scotts began to sell Miracle-Gro® directly to certain retailers.
Effective September 30, 2000, Scotts discontinued its distribution relationship with Central. The affectedproducts included Scotts®, Ortho® and Miracle-Gro® products and consumer Roundup® products manufactured byPharmacia Corporation (formerly known as Monsanto Company) for which Scotts acts as Pharmacia’s exclusivesales agent. For Central’s fiscal year ended September 30, 2000, the revenue attributable to the affected productswas approximately $176 million. The gross profit associated with these sales in fiscal 2000 was estimated to be$27 million based on historical customer profitability. Due to the termination of the Scotts’ distribution relationship,we took actions to downsize our lawn and garden distribution operations to reflect anticipated business levels for thefiscal year 2001. As a result, we recorded charges of $27.5 million in the fiscal year ending September 30, 2000.We cannot assure you that our lawn and garden distribution operations will be able to operate profitably at thereduced revenue levels forecasted for fiscal 2002. If our current downsizing efforts are not successful, we may beforced to record additional charges in fiscal 2002, which would decrease our operating results further.
28
The sale of the Solaris business by Pharmacia, the expiration of the Solaris Agreement and termination of theScotts distribution relationship subject our business to significant uncertainties. These include the resolution of allpayments due between us and Pharmacia under the Solaris Agreement, such as the amounts receivable fromPharmacia for cost reimbursements and payments for cost reductions; the amounts payable to Pharmacia forinventory; and responsibility for obsolete inventory and for non-payment by Solaris' sub- agents. Scotts andPharmacia have each initiated litigation against Central arising out of the prior distribution relationship. In addition,Central has filed suit against Scotts and Pharmacia seeking damages and injunctive relief as well as restitution for,among other things, breach of contract and violations of the antitrust laws by Scotts and Pharmacia. Because of theuncertainties inherent in complex litigation, it is not currently possible to make an assessment of the potentialimpact, losses or gains that may arise out of these cases individually or collectively. Central believes that, in theaggregate, the reconciliation of all accounts and claims with Pharmacia and Scotts, as described above in“Item 3. Legal Proceedings,” will not result in additional charges to Central. Further, Central believes it hassubstantial counterclaims and rights of offset against both Scotts and Pharmacia, as well as meritorious defenses,and intends to vigorously contest both suits. However, there can be no assurance that the resolution of this litigationwill not have a material adverse effect on its results of operations, financial position and/or cash flows.
The loss of the Arch Pool Chemicals’ business may necessitate the closure of additional garden distribution centers.
In 2001, Arch Pool Chemicals notified Garden Products that it will discontinue its distribution relationship withseveral of our Garden Product and deliver its product directly to retailers. For fiscal 2001, the revenue attributableto the affected products was approximately $50.5 million. The gross profit associated with these sales in fiscal 2001was approximately $8.0 million. If we are unable to offset the loss of gross profit as a result of the terminationthrough expense reductions and other business growth, our operating income would be adversely impacted and wemay be required to close additional underutilized garden distribution centers.
Risks Relating to Pet Products
Pet Products depends on a few customers, including PETsMART and Petco, for a significant portion of its net sales.
Pet Products’ largest customer is PETsMART, which accounted for approximately 7%, 7% and 6% of PetProducts’ net sales for fiscal 2001, fiscal 2000 and fiscal 1999, respectively. Pet Products’ second largest customeris Petco, which accounted for approximately 6%, 8% and 5% of Pet Products’ net sales for fiscal 2001, fiscal 2000and 1999, respectively. The loss of, or significant adverse change in, the relationship between Pet Products andPETsMART or Petco could have a material adverse effect on Pet Products’ business and financial results. The lossof or reduction in orders from any significant customer, losses arising from customer disputes regarding shipments,fees, merchandise condition or related matters, or Pet Products’ inability to collect accounts receivable from anymajor customer could have a material adverse impact on our business and financial results.
An increase in market prices for grains could have a negative impact on our operating income.
Pet Products’ financial results depend to a large extent on the cost of raw materials and the ability of PetProducts to pass along to its customers increases in these costs. In particular, our Kaytee subsidiary is exposed tofluctuation in market prices for commodity grains. Historically, market prices for commodity grains have fluctuatedin response to a number of factors, including changes in United States government farm support programs, changesin international agricultural and trading policies and weather conditions during the growing and harvesting seasons.In the event of any increases in raw materials costs, Pet Products would be required to increase sales prices for itsproducts in order to avoid margin deterioration. There can be no assurance as to the timing or extent of PetProducts’ ability to implement future price adjustments in the event of increased raw material costs or as to whetherany price increases implemented by Pet Products may affect the volumes of future shipments.
To protect against changes in market prices, we generally enter into purchase contracts for grains and bird seedto cover up to approximately one-third of the purchase requirements for a selling season. Since we hedge only aportion of our purchase requirements, if market prices for grains increase, our cost of production would increase.

29
The majority of our pet supply distribution sales are made to independent pet retailers, whose market share hasbeen eroded by the growth of national specialty pet stores.
Historically, a majority of our pet supply distribution sales have been made to independent pet retailers. Inrecent years, these independent pet retailers have experienced severe competition from and a loss of market share tonational specialty pet retailers, like PETsMART and Petco, and mass merchants, like Wal*Mart, Kmart and Target.The future success of our pet supply distribution business will depend on our ability to offer competitive costs andvalue-added services to independent pet dealers and to increase sales to national specialty pet retailers and massmerchants. If independent pet retailers continue to lose market share to national specialty pet retailers and we areunable to expand our business with these pet retailers, Pet Product’s net sales will decline and our operating incomewill suffer.
The loss of the Kal Kan dog food business may necessitate the closure of certain pet distribution centers.
Central entered into a Master Services Agreement in May 2000 pursuant to which Kal Kan Foods, Inc. grantedCentral exclusive nationwide distribution rights for certain of its pet food products. Under the agreement, Central'sduties included providing account servicing support to Kal Kan in its direct-sell program to PETsMART as well asthe right to distribute the same products on a buy-sell basis to independent pet supply retailers throughout the UnitedStates, with certain exceptions. Effective November 2001, Kal Kan terminated its distribution relationship with PetProducts. The gross profit associated with these sales in fiscal 2001 was approximately $6.7 million. The loss of theKal Kan business contributed to the decision to close two smaller pet branches during the first quarter of fiscal 2002with a third facility closure planned for February 2002. If we are unable to offset the loss of gross profit as a resultof the termination through expense reductions and other business growth, our operating income would be adverselyimpacted and we may be required to close additional underutilized pet distribution centers.
Item 7A. Quantitative and Qualitative Disclosure About Market Risk
Central is exposed to market risks, which include changes in U.S. interest rates and commodity prices and, to alesser extent, foreign exchange rates. Central does not engage in financial transactions for trading or speculativepurposes.
Interest Rate Risk. The interest payable on Central’s bank lines of credit is based on variable interest rates andtherefore affected by changes in market interest rates. If interest rates on existing variable rate debt had changed by10% compared to actual rates, interest expense would have increased or decreased by approximately $1.4 millionand $1.5 million for the years ended September 29, 2001 and September 30, 2000, respectively. In addition, Centralhas fixed income investments consisting of cash equivalents and short-term investments in marketable debtsecurities, which are also affected by changes in market interest rates. Central does not use derivative financialinstruments in its investment portfolio.
Commodity Prices. Central is exposed to fluctuation in market prices for grains and grass seed. To mitigate riskassociated with increases in market prices and commodity availability, Central enters into contracts for grains, birdseed and grass seed purchases. Such contracts are primarily entered into to ensure commodity availability to theCompany in the future. As of September 29, 2001, the Company had entered into fixed seed purchase commitmentsfor fiscal 2002 totaling approximately $37.8 million. A 10% change in the market price for grain and grass seedwould result in an additional pretax gain or loss of $3.8 million related to the contracts outstanding as of September29, 2001. As of September 30, 2000, the Company had entered into fixed seed purchase commitments for fiscal2001 totaling approximately $85.1 million. A 10% change in the market price for grain and grass seed would haveresulted in an additional pretax gain or loss of $8.5 million related to the contracts outstanding as of September 30,2000.
Foreign Currency Risks. Central has minimal sales outside of the United States and, therefore, has only minimalexposure to foreign currency exchange risks. Purchases made from foreign vendors are primarily made in U.S.dollars and, therefore, the Company has only minimal exposure to foreign currency exchange risk. Central does nothedge against foreign currency risks and believes that foreign currency exchange risk is immaterial.

30
Item 8. Financial Statements and Supplementary Data
INDEX TO CONSOLIDATED FINANCIAL STATEMENTS
Central Garden & Pet Company
Independent Auditors’ Report...................................................................................................................................... 31
Consolidated Balance Sheets, September 29, 2001 and September 30, 2000............................................................ 32
Consolidated Statements of Income for Fiscal Years Ended September 29, 2001, September 30, 2000and September 25, 1999 ............................................................................................................................................... 33
Consolidated Statements of Shareholders’ Equity for Fiscal Years Ended September 29, 2001September 30, 2000 and September 25, 1999 ............................................................................................................. 34
Consolidated Statements of Cash Flows for Fiscal Years Ended September 29, 2001,September 30, 2000 and September 25, 1999 ............................................................................................................. 35
Notes to Consolidated Financial Statements for Fiscal Years Ended September 29, 2001,September 30, 2000 and September 25, 1999 ............................................................................................................. 36
31
INDEPENDENT AUDITORS’ REPORT
Board of DirectorsCentral Garden & Pet CompanyLafayette, California
We have audited the accompanying consolidated balance sheets of Central Garden & Pet Company andsubsidiaries (the “Company”) as of September 29, 2001 and September 30, 2000, and the related consolidatedstatements of income, shareholders’ equity and cash flows for each of the fiscal years in the three-year period endedSeptember 29, 2001. These financial statements are the responsibility of the Company’s management. Ourresponsibility is to express an opinion on these financial statements based on our audits.
We conducted our audits in accordance with auditing standards generally accepted in the United States ofAmerica. Those standards require that we plan and perform the audit to obtain reasonable assurance about whetherthe financial statements are free of material misstatement. An audit includes examining, on a test basis, evidencesupporting the amounts and disclosures in the financial statements. An audit also includes assessing the accountingprinciples used and significant estimates made by management, as well as evaluating the overall financial statementpresentation. We believe that our audits provide a reasonable basis for our opinion.
In our opinion, such consolidated financial statements present fairly, in all material respects, the financialposition of Central Garden & Pet Company and subsidiaries as of September 29, 2001 and September 30, 2000, andthe results of their operations and their cash flows for each of the fiscal years in the three-year period endedSeptember 29, 2001 in conformity with accounting principles generally accepted in the United States of America.
December 7, 2001San Francisco, California

32
CENTRAL GARDEN & PET COMPANY
CONSOLIDATED BALANCE SHEETS
September 29,2001
September 30,2000
(dollars in thousands)
ASSETSCurrent assets:
Cash and cash equivalents ...................................................................................... $ 8,292 $ 5,685Accounts receivable, less allowance for doubtful
accounts of $14,464 and $8,050 ....................................................................... 141,791 151,190Inventories............................................................................................................... 217,902 242,617Prepaid expenses and other assets. ......................................................................... 35,776 20,658
Total current assets. ....................................................................................... 403,761 420,150Land, buildings, improvements and equipment:
Land......................................................................................................................... 4,977 5,194Buildings and improvements. ................................................................................. 60,421 56,554Transportation equipment....................................................................................... 5,753 6,138Machinery and warehouse equipment.................................................................... 65,966 59,325Office furniture and equipment. ............................................................................. 32,845 31,335
Total. .............................................................................................................. 169,962 158,546Less accumulated depreciation and amortization. ................................................. 61,164 46,806
Land, buildings, improvements andequipment—net. ....................................................................................... 108,798 111,740
Goodwill ....................................................................................................................... 371,987 382,294Other assets. .................................................................................................................. 32,080 33,234
Total. .............................................................................................................. $916,626 $947,418
LIABILITIES AND SHAREHOLDERS’ EQUITYCurrent liabilities:
Notes payable. ......................................................................................................... $119,423 $129,239Accounts payable .................................................................................................... 127,884 121,705Accrued expenses.................................................................................................... 38,412 42,801Current portion of long-term debt .......................................................................... 7,052 5,277
Total current liabilities .................................................................................. 292,771 299,022Long-term debt ............................................................................................................. 151,623 148,242Deferred income taxes and other long-term obligations ............................................. 16,917 36,207Commitments and contingencies ................................................................................. — —Shareholders’ equity:
Class B stock ........................................................................................................... 16 16Common stock ........................................................................................................ 305 304Additional paid-in capital ....................................................................................... 526,410 525,793Retained earnings.................................................................................................... 73,411 82,661Treasury stock ......................................................................................................... (144,827) (144,827)
Total shareholders’ equity............................................................................. 455,315 463,947
Total ............................................................................................................... $916,626 $947,418
See notes to consolidated financial statements.

33
CENTRAL GARDEN & PET COMPANY
CONSOLIDATED STATEMENTS OF INCOME
Fiscal Year Ended
September 29,2001
September 30,2000
September 25,1999
(in thousands, except per share amounts)
Net sales .......................................................................................... $1,122,999 $1,350,878 $1,531,615Cost of goods sold and occupancy................................................. 784,282 1,010,106 1,187,722
Gross profit................................................................................ 338,717 340,772 343,893Selling, general and administrative
expenses..................................................................................... 328,226 298,839 286,471Other charges .................................................................................. — 27,156 2,708
Income from operations............................................................ 10,491 14,777 54,714Interest expense .............................................................................. (23,247) (23,140) (12,680)Interest income................................................................................ 164 589 593Other income................................................................................... 1,631 1,176 1,106
Income (loss) before income taxes........................................... (10,961) (6,598) 43,733Income taxes ................................................................................... (1,711) 5,215 19,243
Net income (loss)............................................................................ $ (9,250) $ (11,813) $ 24,490
Net income (loss) per common share:
Basic .......................................................................................... $ (0.50) $ (0.63) $ 0.90
Diluted ....................................................................................... $ (0.50) $ (0.63) $ 0.89
Weighted average shares outstanding:
Basic .......................................................................................... 18,402 18,786 27,328
Diluted ....................................................................................... 18,402 18,786 27,437
See notes to consolidated financial statements.

34
CENTRAL GARDEN & PET COMPANY
CONSOLIDATED STATEMENTS OF SHAREHOLDERS’ EQUITY
Class B Stock Common Stock Treasury StockShares Amount Shares Amount
AdditionalPaid-inCapital
RetainedEarnings
RestrictedStock
DeferredCompensation Shares Amount Total
(in thousands, except share amounts)
Balance, September 26, 1998 1,661,762 $16 29,718,530 $298 $519,933 $69,984 $(39) (72,000) $ (1,418) $588,774
Amortization, restricted stockdeferred compensation........... 39 39
Tax benefit from exercise ofstock options ......................... . 120 120
Conversion of Class B stockinto common stock................. (843) 843 —
Issuance of common stock........ 463,992 4 4,005 4,009Treasury stock purchases .......... (10,779,350) (121,705) (121,705)Net income ................................ 24,490 24,490
Balance, September 25, 1999 ... 1,660,919 16 30,183,365 302 524,058 94,474 — (10,851,350) (123,123) 495,727
Tax benefit from exercise ofstock options ......................... . 14 14
Conversion of Class B stockinto common stock................. (3,157) — 3,157 — —
Issuance of common stock........ 230,899 2 1,721 1,723Treasury stock purchases .......... (2,890,900) (21,704) (21,704)Net income (loss) ...................... (11,813) (11,813)
Balance, September 30, 2000 ... 1,657,762 16 30,417,421 304 525,793 82,661 — (13,742,250) (144,827) 463,947
Tax benefit from exercise ofstock options ......................... . 95 95
Conversion of Class B stockinto common stock................. (2,300) — 2,300 — —
Issuance of common stock........ 112,752 1 522 523Net income (loss) ...................... (9,250) (9,250)
Balance, September 29, 2001 ... 1,655,462 $16 30,532,473 $305 $526,410 $73,411 $— (13,742,250) $(144,827) $455,315
See notes to consolidated financial statements.
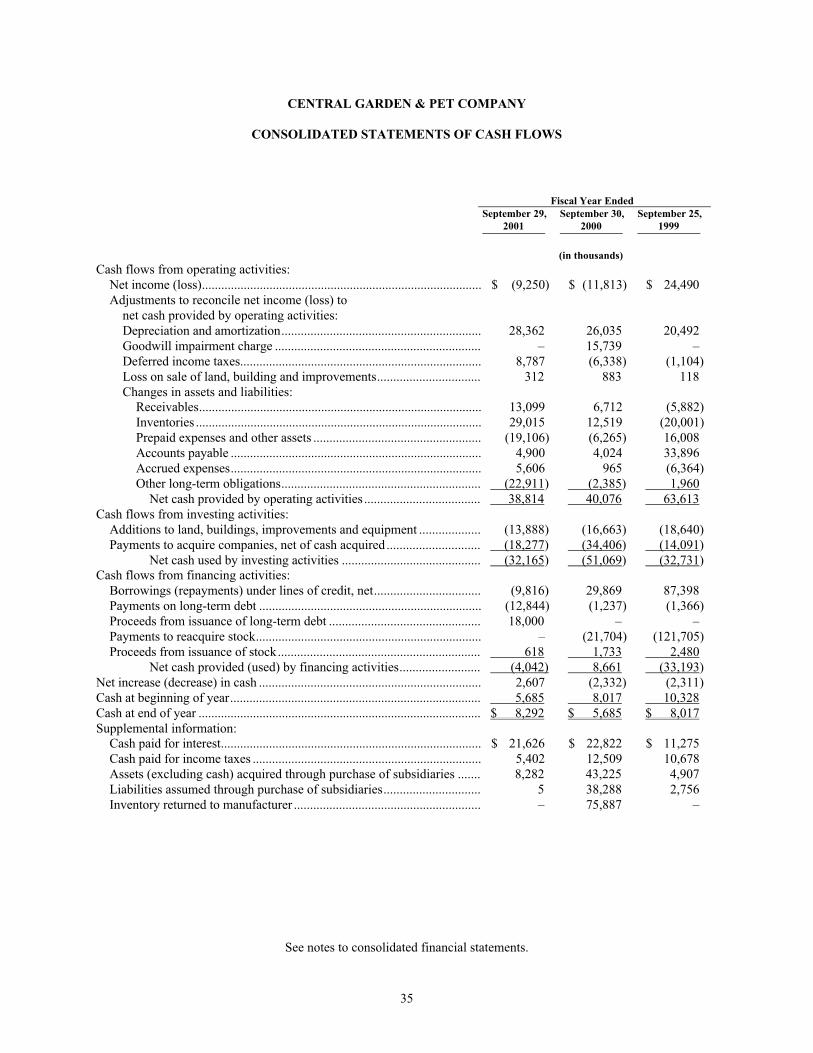
35
CENTRAL GARDEN & PET COMPANY
CONSOLIDATED STATEMENTS OF CASH FLOWS
Fiscal Year EndedSeptember 29,
2001September 30,
2000September 25,
1999
(in thousands)
Cash flows from operating activities:Net income (loss)....................................................................................... $ (9,250) $ (11,813) $ 24,490Adjustments to reconcile net income (loss) to
net cash provided by operating activities:Depreciation and amortization.............................................................. 28,362 26,035 20,492Goodwill impairment charge ................................................................ – 15,739 –Deferred income taxes........................................................................... 8,787 (6,338) (1,104)Loss on sale of land, building and improvements................................ 312 883 118Changes in assets and liabilities:
Receivables........................................................................................ 13,099 6,712 (5,882)Inventories ......................................................................................... 29,015 12,519 (20,001)Prepaid expenses and other assets .................................................... (19,106) (6,265) 16,008Accounts payable .............................................................................. 4,900 4,024 33,896Accrued expenses.............................................................................. 5,606 965 (6,364)Other long-term obligations.............................................................. (22,911) (2,385) 1,960
Net cash provided by operating activities .................................... 38,814 40,076 63,613Cash flows from investing activities:
Additions to land, buildings, improvements and equipment ................... (13,888) (16,663) (18,640)Payments to acquire companies, net of cash acquired ............................. (18,277) (34,406) (14,091)
Net cash used by investing activities ........................................... (32,165) (51,069) (32,731)Cash flows from financing activities:
Borrowings (repayments) under lines of credit, net................................. (9,816) 29,869 87,398Payments on long-term debt ..................................................................... (12,844) (1,237) (1,366)Proceeds from issuance of long-term debt ............................................... 18,000 – –Payments to reacquire stock...................................................................... – (21,704) (121,705)Proceeds from issuance of stock............................................................... 618 1,733 2,480
Net cash provided (used) by financing activities......................... (4,042) 8,661 (33,193)Net increase (decrease) in cash ..................................................................... 2,607 (2,332) (2,311)Cash at beginning of year.............................................................................. 5,685 8,017 10,328Cash at end of year ........................................................................................ $ 8,292 $ 5,685 $ 8,017Supplemental information:
Cash paid for interest................................................................................. $ 21,626 $ 22,822 $ 11,275Cash paid for income taxes ....................................................................... 5,402 12,509 10,678Assets (excluding cash) acquired through purchase of subsidiaries ....... 8,282 43,225 4,907Liabilities assumed through purchase of subsidiaries.............................. 5 38,288 2,756Inventory returned to manufacturer .......................................................... – 75,887 –
See notes to consolidated financial statements.

36
CENTRAL GARDEN & PET COMPANY
NOTES TO CONSOLIDATED FINANCIAL STATEMENTS
Fiscal Years Ended September 29, 2001,September 30, 2000 and September 25, 1999
1. Organization and Significant Accounting Policies
Organization — Central Garden & Pet Company, a Delaware corporation, and subsidiaries (the “Company” or“Central”), is a national manufacturer, supplier and merchandiser of lawn and garden and pet supply products. TheCompany offers an array of proprietary branded lawn and garden and pet supply products.
Basis of Consolidation and Presentation — The consolidated financial statements include the accounts of theCompany. The Company’s shares of the earnings of its minority interest in equity-method investees has beenrecorded under the caption “Other income.” All significant intercompany balances and transactions have beeneliminated.
Use of Estimates — The preparation of financial statements in conformity with accounting principles generallyaccepted in the United States of America requires that management make estimates and assumptions that affect thereported amounts of assets and liabilities and disclosure of contingent assets and liabilities as of the date of thefinancial statements and the reported amounts of revenues and expenses during the reporting period includingaccounts receivable and inventory valuation and goodwill lives. Actual results could differ from those estimates.
Revenue Recognition — Sales are recorded, net of estimated returns, discounts and volume-based rebateincentives, when merchandise is shipped, title passes to the customer and the Company has no further obligations toprovide services related to such merchandise. The Company’s current practice on product returns generally is toaccept and credit the return of unopened cases of products from customers where the quantity is small, where theproduct has been misshipped or the product is defective. Sales also include amounts billed directly to customersrelated to shipping and handling.
Cost of goods sold and occupancy consist of costs to acquire or manufacture inventory, certain indirectpurchasing, merchandise handling and storage costs, as well as allocations of certain facility costs, including rent,payroll, property taxes, security, utilities, insurance and maintenance.
Advertising Costs — The Company expenses the costs of advertising as incurred. Advertising expenses were$14.9 million, $16.7 million and $14.6 million in fiscal 2001, 2000 and 1999, respectively.
Income Taxes are accounted for under the liability method in accordance with Statement of FinancialAccounting Standards (“SFAS”) No. 109, Accounting for Income Taxes. Deferred income taxes result primarilyfrom bad debt allowances, inventory write-downs, depreciation and nondeductible reserves.
Cash and cash equivalents include all highly liquid debt instruments purchased with a maturity of three monthsor less at the date of acquisition.
Inventories, which primarily consist of garden products and pet supplies finished goods are stated at the lowerof FIFO cost or market. Cost includes certain indirect purchasing, merchandise handling and storage costs includingcertain salary and data processing costs incurred to acquire or manufacture inventory, costs to unload, process andput away shipments received in order to prepare them to be picked for orders, and certain overhead costs. Theamounts of such costs capitalized to inventory are computed based on an estimate of costs related to theprocurement and processing of inventory to prepare it for sale compared to total product purchases.
Long-lived assets — The Company reviews its long-lived assets for potential impairment based on a review ofprojected undiscounted cash flows associated with these assets. Long-lived assets are included in impairment
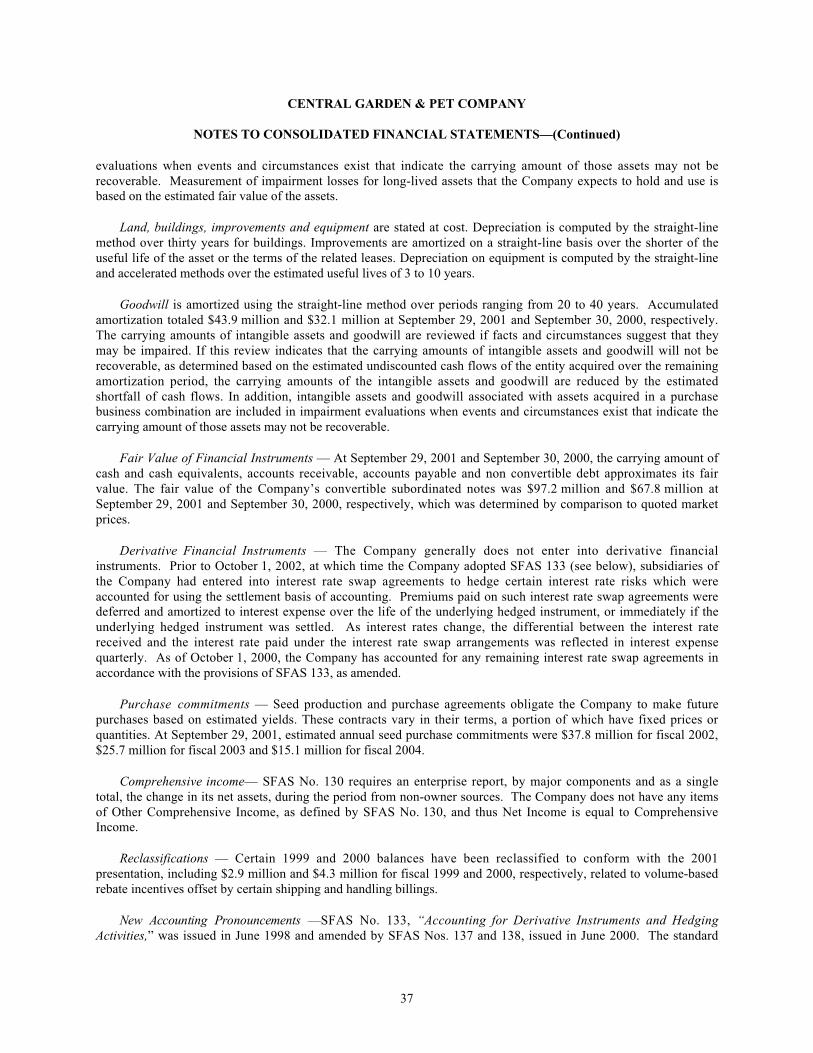
CENTRAL GARDEN & PET COMPANY
NOTES TO CONSOLIDATED FINANCIAL STATEMENTS—(Continued)
37
evaluations when events and circumstances exist that indicate the carrying amount of those assets may not berecoverable. Measurement of impairment losses for long-lived assets that the Company expects to hold and use isbased on the estimated fair value of the assets.
Land, buildings, improvements and equipment are stated at cost. Depreciation is computed by the straight-linemethod over thirty years for buildings. Improvements are amortized on a straight-line basis over the shorter of theuseful life of the asset or the terms of the related leases. Depreciation on equipment is computed by the straight-lineand accelerated methods over the estimated useful lives of 3 to 10 years.
Goodwill is amortized using the straight-line method over periods ranging from 20 to 40 years. Accumulatedamortization totaled $43.9 million and $32.1 million at September 29, 2001 and September 30, 2000, respectively.The carrying amounts of intangible assets and goodwill are reviewed if facts and circumstances suggest that theymay be impaired. If this review indicates that the carrying amounts of intangible assets and goodwill will not berecoverable, as determined based on the estimated undiscounted cash flows of the entity acquired over the remainingamortization period, the carrying amounts of the intangible assets and goodwill are reduced by the estimatedshortfall of cash flows. In addition, intangible assets and goodwill associated with assets acquired in a purchasebusiness combination are included in impairment evaluations when events and circumstances exist that indicate thecarrying amount of those assets may not be recoverable.
Fair Value of Financial Instruments — At September 29, 2001 and September 30, 2000, the carrying amount ofcash and cash equivalents, accounts receivable, accounts payable and non convertible debt approximates its fairvalue. The fair value of the Company’s convertible subordinated notes was $97.2 million and $67.8 million atSeptember 29, 2001 and September 30, 2000, respectively, which was determined by comparison to quoted marketprices.
Derivative Financial Instruments — The Company generally does not enter into derivative financialinstruments. Prior to October 1, 2002, at which time the Company adopted SFAS 133 (see below), subsidiaries ofthe Company had entered into interest rate swap agreements to hedge certain interest rate risks which wereaccounted for using the settlement basis of accounting. Premiums paid on such interest rate swap agreements weredeferred and amortized to interest expense over the life of the underlying hedged instrument, or immediately if theunderlying hedged instrument was settled. As interest rates change, the differential between the interest ratereceived and the interest rate paid under the interest rate swap arrangements was reflected in interest expensequarterly. As of October 1, 2000, the Company has accounted for any remaining interest rate swap agreements inaccordance with the provisions of SFAS 133, as amended.
Purchase commitments — Seed production and purchase agreements obligate the Company to make futurepurchases based on estimated yields. These contracts vary in their terms, a portion of which have fixed prices orquantities. At September 29, 2001, estimated annual seed purchase commitments were $37.8 million for fiscal 2002,$25.7 million for fiscal 2003 and $15.1 million for fiscal 2004.
Comprehensive income— SFAS No. 130 requires an enterprise report, by major components and as a singletotal, the change in its net assets, during the period from non-owner sources. The Company does not have any itemsof Other Comprehensive Income, as defined by SFAS No. 130, and thus Net Income is equal to ComprehensiveIncome.
Reclassifications — Certain 1999 and 2000 balances have been reclassified to conform with the 2001presentation, including $2.9 million and $4.3 million for fiscal 1999 and 2000, respectively, related to volume-basedrebate incentives offset by certain shipping and handling billings.
New Accoun ting Pro no uncements —SFAS No. 133, “Accounting for Derivative Instruments and HedgingActivities,” was issued in June 1998 and amended by SFAS Nos. 137 and 138, issued in June 2000. The standard

CENTRAL GARDEN & PET COMPANY
NOTES TO CONSOLIDATED FINANCIAL STATEMENTS—(Continued)
38
establishes accounting and reporting standards for derivative instruments, including certain derivative instrumentsembedded in other contracts and for hedging activities. Under the standard, certain contracts that were not formerlyconsidered derivatives may now meet the definition of a derivative. The Company adopted the standard effectiveOctober 1, 2000. The adoption of SFAS No. 133, as amended by SFAS Nos. 137 and 138, did not have a materialimpact on the financial position or results of operations of the Company because the Company, with the exception ofminimal interest rate swaps, did not have derivative instruments which require valuation in the financial statements.
In June 2001, the Financial Accounting Standards Board (FASB) issued SFAS No. 141, “BusinessCombinations” and SFAS No. 142, “Goodwill and Other Intangible Assets.” SFAS No. 141 requires that allbusiness combinations initiated after June 30, 2001 be accounted for under the purchase method and addresses theinitial recognition and measurement of goodwill and other intangible assets acquired in a business combination.SFAS No. 142 addresses the initial recognition and measurement of intangible assets acquired outside of a businesscombination and the accounting for goodwill and other intangible assets subsequent to their acquisition. SFASNo. 142 provides that intangible assets with finite useful lives be amortized and that goodwill and intangible assetswith indefinite lives will not be amortized, but will rather be tested at least annually for impairment. The Companyintends to early adopt SFAS No. 142 for its fiscal year beginning September 30, 2001. Upon adoption of SFAS No.142, the Company will stop the amortization of goodwill with a net carrying value of $372.0 million atSeptember 29, 2001 and annual amortization of $11.6 million that resulted from business combinations initiatedprior to the adoption of SFAS No. 141. The Company will evaluate such goodwill under the SFAS No. 142transitional impairment test and has not yet determined whether or not there is an impairment loss. Any transitionalimpairment loss will be recognized as a change in accounting principle.
In June 2001, the FASB issued SFAS No. 143, “Accounting for Asset Retirement Obligations,” and in October2001 issued SFAS No. 144, “Accounting for the Impairment of Disposal of Long-Lived Assets.” These Statementswill be effective for the Company’s fiscal year 2003. The Company has not determined the impact, if any, that theseStatements will have on its consolidated financial statements.
2. Other Charges
Activity in fiscal 2001, 2000 and 1999 related to other charges was as follows (in millions):
Cash Non Cash
Severance
ExitRelated
and Other
AssetCarrying
ValueAdjustments Total
Reserve balance September 26, 1998 ....................................... $ 0.0 $ 0.9 $ 0.0 $ 0.9
Fiscal 1999 other charges .......................................................... 0.6 0.4 1.7 2.7Severance paid ........................................................................... (0.2) (0.2)Costs paid .................................................................................. (0.3) (0.3)Assets carrying value adjustments ............................................ (1.7) (1.7)Reserve balance September 25, 1999 ....................................... 0.4 1.0 0.0 1.4
Fiscal 2000 other charges .......................................................... 1.1 8.2 17.9 27.2Severance paid ........................................................................... (1.1) (1.1)Costs paid .................................................................................. (0.1) (0.1)Assets carrying value adjustments ............................................ (17.9) (17.9)Reserve balance September 30, 2000 ....................................... 0.4 9.1 0.0 9.5
Severance paid ........................................................................... (0.4) (0.4)Costs paid................................................................................... (8.8) (8.8)Reserve balance September 29, 2001 ....................................... $ 0.0 $ 0.3 $ 0.0 $ 0.3
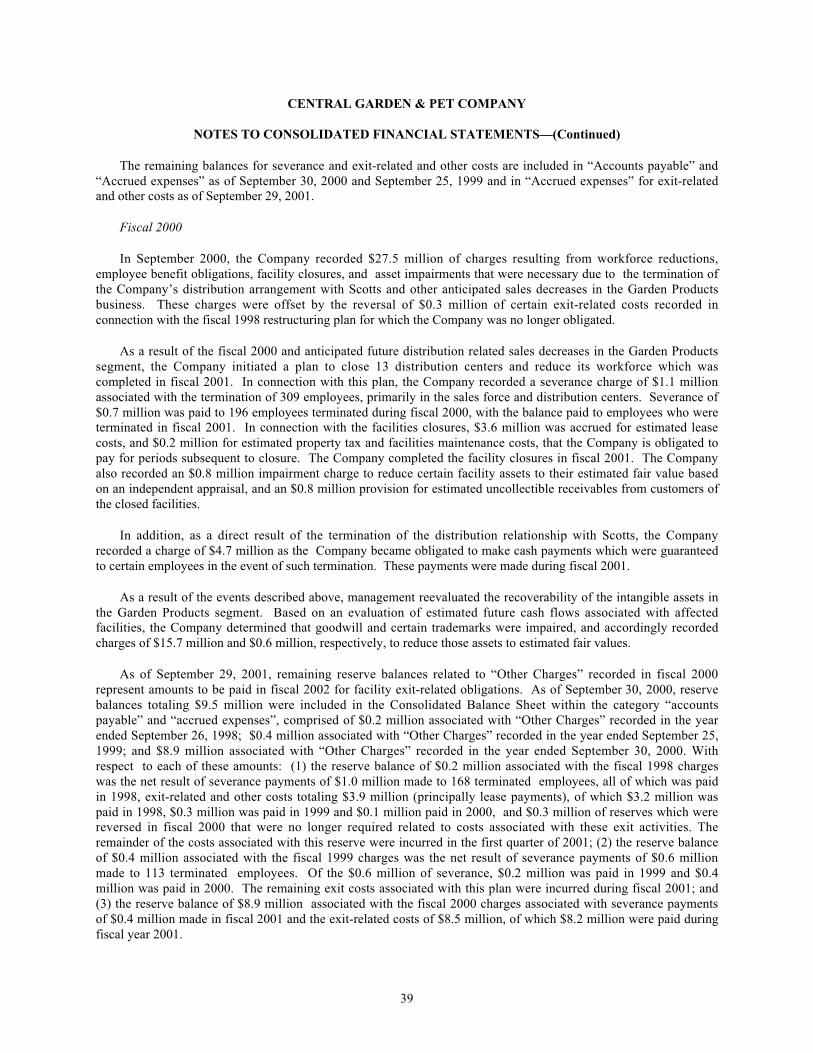
CENTRAL GARDEN & PET COMPANY
NOTES TO CONSOLIDATED FINANCIAL STATEMENTS—(Continued)
39
The remaining balances for severance and exit-related and other costs are included in “Accounts payable” and“Accrued expenses” as of September 30, 2000 and September 25, 1999 and in “Accrued expenses” for exit-relatedand other costs as of September 29, 2001.
Fiscal 2000
In September 2000, the Company recorded $27.5 million of charges resulting from workforce reductions,employee benefit obligations, facility closures, and asset impairments that were necessary due to the termination ofthe Company’s distribution arrangement with Scotts and other anticipated sales decreases in the Garden Productsbusiness. These charges were offset by the reversal of $0.3 million of certain exit-related costs recorded inconnection with the fiscal 1998 restructuring plan for which the Company was no longer obligated.
As a result of the fiscal 2000 and anticipated future distribution related sales decreases in the Garden Productssegment, the Company initiated a plan to close 13 distribution centers and reduce its workforce which wascompleted in fiscal 2001. In connection with this plan, the Company recorded a severance charge of $1.1 millionassociated with the termination of 309 employees, primarily in the sales force and distribution centers. Severance of$0.7 million was paid to 196 employees terminated during fiscal 2000, with the balance paid to employees who wereterminated in fiscal 2001. In connection with the facilities closures, $3.6 million was accrued for estimated leasecosts, and $0.2 million for estimated property tax and facilities maintenance costs, that the Company is obligated topay for periods subsequent to closure. The Company completed the facility closures in fiscal 2001. The Companyalso recorded an $0.8 million impairment charge to reduce certain facility assets to their estimated fair value basedon an independent appraisal, and an $0.8 million provision for estimated uncollectible receivables from customers ofthe closed facilities.
In addition, as a direct result of the termination of the distribution relationship with Scotts, the Companyrecorded a charge of $4.7 million as the Company became obligated to make cash payments which were guaranteedto certain employees in the event of such termination. These payments were made during fiscal 2001.
As a result of the events described above, management reevaluated the recoverability of the intangible assets inthe Garden Products segment. Based on an evaluation of estimated future cash flows associated with affectedfacilities, the Company determined that goodwill and certain trademarks were impaired, and accordingly recordedcharges of $15.7 million and $0.6 million, respectively, to reduce those assets to estimated fair values.
As of September 29, 2001, remaining reserve balances related to “Other Charges” recorded in fiscal 2000represent amounts to be paid in fiscal 2002 for facility exit-related obligations. As of September 30, 2000, reservebalances totaling $9.5 million were included in the Consolidated Balance Sheet within the category “accountspayable” and “accrued expenses”, comprised of $0.2 million associated with “Other Charges” recorded in the yearended September 26, 1998; $0.4 million associated with “Other Charges” recorded in the year ended September 25,1999; and $8.9 million associated with “Other Charges” recorded in the year ended September 30, 2000. Withrespect to each of these amounts: (1) the reserve balance of $0.2 million associated with the fiscal 1998 chargeswas the net result of severance payments of $1.0 million made to 168 terminated employees, all of which was paidin 1998, exit-related and other costs totaling $3.9 million (principally lease payments), of which $3.2 million waspaid in 1998, $0.3 million was paid in 1999 and $0.1 million paid in 2000, and $0.3 million of reserves which werereversed in fiscal 2000 that were no longer required related to costs associated with these exit activities. Theremainder of the costs associated with this reserve were incurred in the first quarter of 2001; (2) the reserve balanceof $0.4 million associated with the fiscal 1999 charges was the net result of severance payments of $0.6 millionmade to 113 terminated employees. Of the $0.6 million of severance, $0.2 million was paid in 1999 and $0.4million was paid in 2000. The remaining exit costs associated with this plan were incurred during fiscal 2001; and(3) the reserve balance of $8.9 million associated with the fiscal 2000 charges associated with severance paymentsof $0.4 million made in fiscal 2001 and the exit-related costs of $8.5 million, of which $8.2 million were paid duringfiscal year 2001.

CENTRAL GARDEN & PET COMPANY
NOTES TO CONSOLIDATED FINANCIAL STATEMENTS—(Continued)
40
Fiscal 1999
In September 1999, the Company recorded other charges totaling $2.7 million associated with the expiration ofthe Solaris Agreement, workforce reductions, facility closures.
Of the $2.7 million charge, the Company established a $0.1 million reserve for estimated non-collectibleamounts due from distributors involved in the Solaris program, and a $0.1 million charge for post-closure facilitylease obligations of the Company’s facility which warehoused only inventory received under the Solaris Agreementwhich was closed upon termination of the Solaris Agreement.
The Company initiated a plan for closure of three distribution centers as well as a workforce reduction whichwas expected to be completed by the end of the second quarter of fiscal 2000. Also included in the $2.7 millioncharge is $1.6 million related to such closures and workforce reductions in the former distribution segment. As partof this plan, the Company recorded a severance charge of $0.6 million for workforce reductions. The severancecharge relates to the termination of 113 employees, primarily in the sales force and distribution centers andassociated back-office functions. Severance for 51 employees was paid during fiscal 1999. Also related to suchclosures, a charge of $0.4 million was recorded for other exit-related costs, consisting primarily of lease costs,property and other facility costs required to be paid subsequent to the termination of operations. In addition, $0.3million was required to write off the carrying value of certain facility assets which will no longer be used and areexpected to be disposed of during the first half of fiscal 2000. $0.9 million of the $1.6 million of other chargesrelated to these closures and workforce reductions recorded in September 1999 is included in accrued expenses as ofSeptember 25, 1999. These costs were paid primarily in fiscal 2000, with certain lease obligations paid in fiscal2001.
The Company initiated a plan to dispose of a building and certain facility assets in the Garden Products segmentwhich have not operated at the level of profitability required by the Company. Also included in the $2.7 millioncharge is $1.2 million required to reduce the $3.0 million carrying value of the building which was being held fordisposal during fiscal 2001 to its estimated net realizable value in accordance with SFAS No. 121. The charge wasbased on the comparison of the net carrying cost of this facility and assets compared with current market values, lesscosts to sell. The operations of this facility are included in the Company’s operations for fiscal 2001, and resulted ina pretax loss of approximately $0.2 million.
3. Acquisitions
Fiscal 2001
In October 2000, the Company’s Pennington subsidiary acquired the Rebel and Lofts lines of grass seed (“Loftsand Rebel”) from KRB Seed Company, LLC (“KRB”), for approximately $8 million in cash. Lofts and Rebelrepresented a portion of a business which KRB acquired out of bankruptcy. The purchase price approximated thefair market value of the tangible assets acquired. The Company also signed perpetual licensing agreements underwhich the Company will make royalty payments to KRB over the term of the licensing agreements. The acquisitionwas accounted for under the purchase method. Royalty payments will be recorded as expense as they are incurred.The results of operations associated with this acquisition have been included in the Company’s results of operationssince October 2000. Sales of approximately $16 million attributable to Lofts and Rebel were included in net salesfor fiscal 2001. Operating information prior to acquisition by the Company is not available and, accordingly, hasnot been reflected in the following unaudited pro forma results of operations for fiscal 2000.

CENTRAL GARDEN & PET COMPANY
NOTES TO CONSOLIDATED FINANCIAL STATEMENTS—(Continued)
41
Fiscal 200 0
In September 2000, Central’s Pennington subsidiary acquired All-Glass Aquarium Co., Inc., a leadingmanufacturer and marketer of aquariums and related products, based in Franklin, Wisconsin and its Oceanic systemssubsidiary in Dallas, Texas for approximately $10 million, which was recorded as a liability in the ConsolidatedBalance sheet as of September 30, 2000, and was subsequently paid during the three months ended December 30,2000. The operations of this business have been included in the Company’s results of operations since October 1,2000.
In March 2000, Central acquired the AMDRO® and IMAGE® consumer product lines from AmericanCyanamid, the agricultural products division of American Home Products Corporation for approximately $28million. The purchase price exceeded the fair market value of net assets acquired by approximately $27 million,which was recorded as goodwill and is being amortized on a straight line basis over 20 years.
In March 2000, Central’s Norcal Pottery Products, Inc. subsidiary (“Norcal”) acquired White’s Pottery, L.P., animporter and distributor of terra cotta pottery products for approximately $2 million. The purchase price exceededthe fair market value of net assets acquired by approximately $1 million, which was recorded as goodwill and isbeing amortized on a straight line basis over 20 years.
In January 2000, Central’s Pennington subsidiary acquired Unicorn Laboratories. Unicorn serves the U.S.animal health and lawn and garden industries as a private label and branded manufacturer of lawn, garden andanimal health chemical products for approximately $15 million. The purchase price exceeded the fair market valueof net assets acquired by approximately $14 million, which was recorded as goodwill and is being amortized on astraight line basis over 40 years.
In January 2000, Central’s Pennington subsidiary acquired an equity stake in Cedar Works, a manufacturer ofbird feeders for approximately $6 million. The purchase price exceeded the fair market value of net assets acquiredby approximately $4 million, which was recorded as goodwill and is being amortized on a straight line basis over 40years.
Fiscal 199 9
In January 1999, the Company acquired Norcal Pottery Products, Inc., an importer and distributor of lawn andgarden pottery products. Under the terms of the agreement, the Company paid approximately $14 million in cashand 115,634 shares of common stock at a value of approximately $2 million. The purchase price exceeded the fairmarket value of net assets acquired by approximately $14 million, which was recorded as goodwill and is beingamortized on a straight-line basis over 40 years.
The fiscal 2001, 2000 and 1999 acquisitions have been accounted for under the purchase method and have beenincluded in the Company’s consolidated statements of income from date of acquisition. The value of stock issued inrelation to the above acquisitions has been determined by using the average daily closing market price of theCompany’s stock prior to the closing of such acquisitions as required under the acquisition agreements.

CENTRAL GARDEN & PET COMPANY
NOTES TO CONSOLIDATED FINANCIAL STATEMENTS—(Continued)
42
Unaudited Pro Forma Results of Operations — The following table summarizes on a pro forma basis thecombined results of operations of the Company and its subsidiaries for fiscal year 2000 as if the fiscal year 2000acquisitions were made on September 26, 1999. The pro forma results of operations also reflect pro formaadjustments for the amortization of goodwill and additional interest expense which would have been incurred.Although this pro forma combined information includes the results of operations of the acquisitions, it does notnecessarily reflect the results of operations that would have occurred had the acquisitions been managed by theCompany prior to their acquisition.
Fiscal Year EndedSeptember 30,
2000(unaudited)
(in thousands,except per share
amounts)
Net sales ................................................................................................................................................. $1,420,637Gross profit ............................................................................................................................................ 359,688Income from operations......................................................................................................................... 22,878Income before taxes............................................................................................................................... (2,266)Net income............................................................................................................................................. (9,213)
Net income per share:Basic ................................................................................................................................................ (0.49)Diluted ............................................................................................................................................. (0.49)
Weighted average common shares outstanding:Basic ................................................................................................................................................ 18,786Diluted ............................................................................................................................................. 18,786
4. Concentration of Credit Risk and Significant Customers and Suppliers
Customer Concentration — Approximately 46%, 48% and 49% of the Company’s net sales for fiscal years2001, 2000 and 1999, respectively, were derived from sales to the Company’s top ten customers. The Company’slargest customer accounted for approximately 21%, 25% and 24% of the Company’s net sales for fiscal years 2001,2000 and 1999, respectively. The Company’s second largest customer accounted for approximately 7%, 5% and 9%of the Company’s net sales for fiscal years 2001, 2000 and 1999, respectively. The Company’s third largestcustomer accounted for approximately 6%, 5% and 6% of the Company’s net sales for fiscal years 2001, 2000 and1999. The loss of, or significant adverse change in, the relationship between the Company and these three customerscould have a material adverse effect on the Company’s business and financial results. The loss of or reduction inorders from any significant customer, losses arising from customer disputes regarding shipments, fees, merchandisecondition or related matters, or the Company’s inability to collect accounts receivable from any major customercould have a material adverse impact on the Company’s business and financial results. As of September 29, 2001and September 30, 2000, accounts receivable from the Company’s top ten customers comprised 47% and 31%,respectively, of the Company’s total accounts receivable, including 15% and 10% from the Company’s largestcustomer.
Supplier Concentration — While the Company purchases products from over 1,000 different manufacturers andsuppliers, approximately 15%, 19% and 40% of the Company’s net sales in fiscal years 2001, 2000 and 1999,respectively, were derived from products purchased from the Company’s five largest suppliers. The Companybelieves that approximately 27% of the Company’s net sales during fiscal year 1999 were derived from sales ofproducts purchased from Solaris. As discussed in Note 7, the Solaris Agreement expired on September 30, 1999.
CENTRAL GARDEN & PET COMPANY
NOTES TO CONSOLIDATED FINANCIAL STATEMENTS—(Continued)
43
The Company believes that approximately 14% of the Company’s net sales during fiscal year 2000 were derivedfrom sales of products purchased from Scotts. Scotts discontinued its distribution relationship with the Company asof September 30, 2000.
5. Notes Payable
The Company has a line of credit providing for aggregate borrowings of up to $200 million which expires onJuly 12, 2002. The available amount under the line of credit fluctuates based upon a specific asset-borrowing base.At September 29, 2001 and September 30, 2000, balances of $83.1 million and $114.5 million, respectively, wereoutstanding under this agreement, bearing interest at a rate based on the prime rate (7.1% at September 29, 2001 and9.5% at September 30, 2000) or LIBOR plus 2% at the Company’s option. Available borrowing capacity atSeptember 29, 2001 and September 30, 2000 was $16.8 million and $5.1 million, respectively. This line is securedby substantially all of the Company’s assets, and contains certain financial covenants requiring maintenance ofminimum levels of net worth and working capital, places a ceiling on the Company’s treasury stock purchases anddoes not allow the Company to pay dividends. The line also requires the lender’s prior written consent to anyacquisition of a business.
The Company also has available through its Pennington subsidiary an $85 million line of credit as ofSeptember 29, 2001, which increased from $60 million in fiscal 2000, and expires on September 30, 2003. As ofSeptember 29, 2001 and September 30, 2000, the Company had $31.6 million and $10 million, respectively, ofborrowings under this line of credit facility. Available borrowing capacity at September 29, 2001 and September30, 2000 was $53.4 million and $50.0 million, respectively. Interest related to this line is based on a rate eitherequal to the prime rate or LIBOR plus .875%, at the Company’s option. The line of credit contains certain restrictivefinancial covenants.
The Company also has available through its All-Glass Aquarium subsidiary a $10 million line of credit, whichexpires on September 30, 2005. As of September 29, 2001, the Company had $4.6 million of borrowings under thisline of credit facility. Available borrowing capacity at September 29, 2001 was $5.4 million. Interest related to thisline is based on a rate equal to the prime rate less .5%. The line of credit is secured by a General Business SecurityAgreement and contains certain restrictive financial covenants.

CENTRAL GARDEN & PET COMPANY
NOTES TO CONSOLIDATED FINANCIAL STATEMENTS—(Continued)
44
6. Long-Term Debt
Long-term debt consists of the following:
September 29,2001
September 30,2000
(in thousands)Convertible subordinated notes, interest at 6% payable semi-annually, principal
due 2003; convertible at the option of the holder into shares of commonstock of the Company, at any time prior to redemption or maturity, at aconversion price of $28.00 per share (equal to a conversion rate of 35.7143shares per $1,000 principal amount of notes) ................................................... $115,000 $115,000
Promissory note, interest at 7% with annual principal and interest payments of$5,550,289 through 2004……………………….. ............................................ 14,566 18,800
Note payable to bank, interest at floating rates; payable in monthly principalpayments of $60,000 plus interest with unpaid balance dueSeptember 30, 2005............................................................................................ 13,775 _
Industrial development revenue bonds due in semi-annual sinking fundInstallments beginning 2003; bearing interest at floating rates, secured byletter of credit collateralized by Plant and equipment ...................................... 4,390 4,390
Note payable to bank, interest at floating rates; payable in monthly principalpayments of $58,000 plus interest with unpaid balance dueSeptember 30, 2005............................................................................................ 2,800 _
Industrial development revenue bonds due in annual sinking fund installmentsof $305,000 to $310,000 through July 2010, bearing interest at floatingrates, secured by an unconditional letter of credit ............................................ 2,780 3,085
Mortgage note payable, interest at floating rates; payable in monthly principaland interest installments of $60,000 with unpaid balance due 2004................ _ 2,610
Note payable to bank, interest at floating rates; payable in monthly principalinstallments of $100,000 plus interest with unpaid balance due 2002............. _ 2,000
Mortgage note payable to bank, interest based on a formula (4.1% atSeptember 29, 2001), principal and interest due in monthly installmentsthrough March 2012.......................................................................................... . 1,520 1,615
Industrial development revenue bonds due in annual sinking fund installmentsof $300,000 through December 2005, bearing interest at floating rates,secured by an unconditional letter of credit ...................................................... 1,500 1,830
Mortgage note payable to bank, interest at floating rates; payable in monthlyprincipal and interest installments of $6,250 with unpaid balance due 2004 .. _ 1,431
Industrial development revenue bonds due in annual sinking fund installmentsranging from $130,000 to $195,000 through July 2005, bearing interest atfloating rates, secured by an unconditional letter of credit............................... 715 910
Mortgage note payable to bank, interest based on a formula (4.1% atSeptember 29, 2001), principal and interest due in monthly installmentsthrough December 2019..................................................................................... 969 994
Industrial development revenue bonds due in quarterly sinking fundinstallments of $30,000, with a final principal installment of $90,000 dueMarch 2004, bearing interest at floating rates, secured by an unconditionalletter of credit ..................................................................................................... 350 480
Other notes payable .................................................................................................. . 310 374Total ........... .................................................................................................... 158,675 153,519
Less current portion of long-term debt ..................................................................... 7,052 5,277Total.......................................................................................................... . $151,623 $148,242

CENTRAL GARDEN & PET COMPANY
NOTES TO CONSOLIDATED FINANCIAL STATEMENTS—(Continued)
45
Principal repayments on long-term debt are scheduled as follows:
(in thousands)
Fiscal year:2002.................................................................................................................................................... $ 7,0522003................................................................................................................................................... . 7,5192004.................................................................................................................................................... 122,9542005.................................................................................................................................................... 13,5142006.................................................................................................................................................... 1,071Thereafter........................................................................................................................................... 6,565
Total............... ...................................................................................................................... . $ 158,675
7. Commitments and Contingencies
The Company has operating lease agreements principally for office and warehouse facilities and equipment.Such leases have remaining terms, inclusive of renewal options, of 1 to 8 years. Rental expense was $19,933,000,$23,433,000 and $20,477,000 for fiscal years 2001, 2000 and 1999, respectively.
Certain facility leases have renewal options and provide for additional rent based upon increases in theConsumer Price Index.
Aggregate minimum annual payments on non-cancelable operating leases at September 29, 2001 are as follows:
(in thousands)
Fiscal year:2002.................................................................................................................................................... $ 17,5032003.................................................................................................................................................... 11,6532004.................................................................................................................................................... 9,2952005.................................................................................................................................................... 6,8492006.................................................................................................................................................... 3,435Thereafter .......................................................................................................................................... 1,694
Total....................................................................................................................................... $ 50,429
The Solaris Agreement — The Company entered into an agreement effective October 1, 1995 with The SolarisGroup (“Solaris”), a strategic business unit of Monsanto Company (subsequently renamed Pharmacia Corporation),the manufacturer of Ortho®, Round-up® and Green Sweep® lawn and garden products (the “Solaris Agreement”).Under the Solaris Agreement, which had a four year term, the Company, in addition to serving as the master agentand master distributor of Solaris products, provided a wide range of value-added services including logistics, orderprocessing and fulfillment, inventory distribution and merchandising. However, Solaris continued to negotiate itssales prices directly with its direct sales accounts. The Solaris Agreement provided for the Company to bereimbursed for costs incurred in connection with services provided to Solaris’ direct sales accounts and to receivepayments based on the growth of sales of Solaris products. The Company was also entitled to share with Solaris inthe economic benefits of certain cost reductions, to the extent achieved.
In January 1999, Pharmacia sold its Solaris lawn and garden business exclusive of its Roundup® herbicideproducts for consumer use to The Scotts Company (“Scotts”) and entered into a separate, long-term, exclusiveagreement pursuant to which Pharmacia continues to make Roundup herbicide products for consumer use and Scottsmarkets the products. Beginning October 1, 1999, Scotts began to distribute Ortho® and Roundup® productsthrough a system that involved a combination of distributors, of which we were the largest, as well as through directsales by Scotts to certain major retailers. In addition, Scotts began to sell Miracle-Gro® directly to certain retailers.

CENTRAL GARDEN & PET COMPANY
NOTES TO CONSOLIDATED FINANCIAL STATEMENTS—(Continued)
46
Effective September 30, 2000, Scotts discontinued its distribution relationship with Central. The affectedproducts included Scotts®, Ortho® and Miracle-Gro® products and consumer Roundup® products manufactured byPharmacia for which Scotts acts as Pharmacia’s exclusive sales agent. For Central’s fiscal year ended September30, 2000, the revenue attributable to the affected products was approximately $176 million.
Due to the termination of the Scotts’ distribution relationship, the Company took actions to downsize its lawnand garden distribution operations to reflect anticipated business levels for the fiscal year 2001. As a result, theCompany recorded charges of $27.5 million in the fiscal year ending September 30, 2000. See Note 2, “OtherCharges.”
The sale of the Solaris business by Pharmacia, the expiration of the Solaris Agreement and termination of theScotts distribution relationship subject our business to significant uncertainties. These include the resolution of allpayments due between us and Pharmacia under the Solaris Agreement, such as the amounts receivable fromPharmacia for cost reimbursements and payments for cost reductions; the amounts payable to Pharmacia forinventory; and responsibility for obsolete inventory and for non-payment by Solaris’ sub-agents. Scotts andPharmacia have each initiated litigation against Central arising out of the prior distribution relationship. In addition,Central has filed suit against Scotts and Pharmacia seeking damages and injunctive relief as well as restitution for,among other things, breach of contract and violations of the antitrust laws by Scotts and Pharmacia. Because of theuncertainties inherent in complex litigation, it is not currently possible to make an assessment of the potentialimpact, losses or gains that may arise out of these cases individually or collectively. Central believes that, in theaggregate, the reconciliation of all accounts and claims with Pharmacia and Scotts will not result in additionalcharges to Central. Further, Central believes it has substantial counterclaims and rights of offset against both Scottsand Pharmacia, as well as meritorious defenses, and intends to vigorously contest both suits. However, there can beno assurance that the resolution of this litigation will not have a material adverse effect on Central’s results ofoperations, financial position and/or cash flows.
In December 1997, the Company acquired all of the stock of TFH Publications, Inc. In connection with thetransaction, the Company made a $10 million loan to the sellers, which was evidenced by a Promissory Note. InSeptember 1998, the prior owners of TFH brought suit against the Company and certain executives of the Companyfor damages and relief from their obligations under the Promissory Note, alleging, among other things, that theCompany’s failure to properly supervise the TFH management team had jeopardized their prospects of achievingcertain earnouts. The Company believes that these allegations are without merit. The Company counterclaimedagainst the prior owners for enforcement of the Promissory Note, damages and other relief, alleging, among otherthings, fraud, misrepresentation and breach of fiduciary duty by the prior owners of TFH. These actions, Herbert R.Axelrod and Evelyn Axelrod v. Central Garden & Pet Company; Glen S. Axelrod; Gary Hersch; William E. Brown;Robert B. Jones; Glen Novotny; and Neill Hines, Docket No. MON-L-5100-99, and TFH Publications, Inc. v.Herbert Axelrod et al., Docket No. L-2127-99 (consolidated cases), are in the New Jersey Superior Court. The caseis currently in pretrial discovery and is scheduled for trial in June 2002.
During the course of discovery in this action, the Company has become aware of certain information whichsuggests that prior to the acquisition of TFH by the Company, certain records of TFH were prepared in an inaccuratemanner which resulted in underpayment of taxes by certain individuals. Those individuals could be liable for backtaxes, interest, and penalties. In addition, even though all of the events occurred prior to the acquisition of TFH bythe Company, there is a possibility that TFH could be liable for penalties for events which occurred under priormanagement. The Company believes that TFH has strong defenses available to the assertion of any penalties againstTFH. The Company cannot predict whether TFH will be required to pay any such penalties. In the event that TFHwere required to pay penalties, the Company would seek compensation from the prior owners.
In March 2001, the prior owners of TFH also brought a separate action in federal court seeking to enforce whatthey alleged was an “arbitration award” made by an accountant concerning the closing balance sheet of TFH. Theprior owners contended that the decisions by the accountant concerning the closing balance sheet entitled them toadditional monies under the purchase price provisions of the Stock Purchase Agreement. The federal court held that

CENTRAL GARDEN & PET COMPANY
NOTES TO CONSOLIDATED FINANCIAL STATEMENTS—(Continued)
47
the accountant did not make any monetary award. The federal court entered a judgment enforcing the decisionsmade by the accountant concerning the closing balance sheet of TFH, but the court did not, and refused to, enter amonetary award. See Evelyn M. Axelrod, et al. v. Central Garden & Pet Company, Civil Action No. 01-1262(MLC) U.S.D.C. of New Jersey. The prior owners have argued in the consolidated civil actions pending in the NewJersey Superior Court that the judgment by the federal court entitles them to additional monies under the purchaseprice provision of the Stock Purchase Agreement. The New Jersey Superior Court has stated that it will not, at thistime, enter a monetary award, but that it, like the federal court, will confirm the decisions made by the accountantconcerning the closing balance sheet of TFH. The New Jersey Superior Court has not yet issued a written Order onits rulings, but the Company anticipates such an Order shortly. The Company believes that it has defenses to theclaims by the prior owner for additional monies under the purchase price provisions of the Stock PurchaseAgreement, and that the prior owners’ claims are subject to or will be offset by the Company’s claims against theprior owners.
The Company, based on consultation with legal counsel, does not believe that the outcome of the above matterswill have a material adverse impact on its operations, financial position, or cash flows.
On August 2, 2000, a fire destroyed the Company's leased warehouse space in Phoenix, Arizona, and anadjoining warehouse space leased by a third party. The adjoining warehouse tenant has filed a lawsuit seeking torecover for property damage from the fire. Local residents have also filed a purported class action lawsuit allegingclaims for bodily injury and property damage as a result of the fire. The building owner and nearby businesses havealso presented claims for property damage and business interruption but have not filed lawsuits. In addition, theArizona Department of Environmental Quality is monitoring the cleanup operations and has asked the Company, thebuilding owner and the adjoining warehouse tenant to assess whether the fire and fire suppression efforts may havecaused environmental impacts to soil, groundwater and/or surface water. The United States EnvironmentalProtection Agency has also requested information relating to the fire. The overall amount of the damages to allparties caused by the fire, and the overall amount of damages which the Company may sustain as a result of the fire,have not been quantified. At the time of the fire, the Company maintained property insurance covering losses to theleased premises, the Company's inventory and equipment, and loss of business income. The Company alsomaintained insurance providing $51 million of coverage (with no deductible) against third party liability. TheCompany believes that this insurance coverage will be available with respect to third party claims against theCompany if parties other than the Company are not found responsible. The precise amount of the damages sustainedin the fire, the ultimate determination of the parties responsible and the availability of insurance coverage are likelyto depend on the outcome of complex litigation, involving numerous claimants, defendants and insurancecompanies.
8. Income Taxes
The provision for income taxes consists of the following:
Fiscal Year Ended
September 29,2001
September 30,2000
September 25,1999
Current: (in thousands)
Federal .............................................................................. $ (9,151) $ 9,544 $ 16,796State. ................................................................................. (1,347) 2,009 3,551
Total.............................................................................. (10,498) 11,553 20,347
Deferred .................................................................................... 8,787 (6,338) (1,104)Total.............................................................................. $ (1,711) $ 5,215 $ 19,243

CENTRAL GARDEN & PET COMPANY
NOTES TO CONSOLIDATED FINANCIAL STATEMENTS—(Continued)
48
A reconciliation of the statutory federal income tax rate with the Company’s effective income tax rate is asfollows:
Fiscal Year Ended
September 29,2001
September 30,2000
September 25,1999
Statutory rate........................................................................... 35% 35% 35%State income taxes, net of federal benefit .............................. 1.8 (8.5) 5Nondeductible expenses, primarily goodwill ........................ (20.4) (103.5) 5Other........................................................................................ (0.9) (1.0) (1)Effective tax rate..................................................................... 15.5% (78.0)% 44%
Deferred income taxes reflect the impact of “temporary differences” between amounts of assets and liabilitiesfor financial reporting purposes and such amounts as measured by tax laws. The tax effect of temporary differencesand carryforwards which give rise to deferred tax assets and liabilities are as follows:
September 29, 2001 September 30, 2000
DeferredTax
Assets
DeferredTax
Liabilities
DeferredTax
Assets
DeferredTax
Liabilities
Current: (in thousands)
Allowance for doubtful accounts receivable.................... $4,364 $1,910Inventory write-downs...................................................... 5,906 7,852Prepaid expenses. .............................................................. $1,942 $1,364Nondeductible reserves..................................................... 1,548 4,750State taxes.......................................................................... 1,616 258Other. ................................................................................. 565 1,102
Current 12,383 3,558 15,614 1,622Noncurrent:
Depreciation and amortization.......................................... 15,927 11,106Joint venture income. ........................................................ 416 634Net operating loss.............................................................. 213Other. ................................................................................. 490 386
Noncurrent. ............................................................................... 703 16,343 – 12,126Total. .......................................................................... $13,086 $19,901 $15,614 $13,748
As of September 29, 2001, the Company had a state net operating loss carryforward of approximately$2.4 million which expires in 2010.
9. Shareholders’ Equity
At September 29, 2001, there were 80,000,000 shares of common stock ($0.01 par value) authorized, of which16,790,223 were outstanding.
At September 29, 2001, there were 3,000,000 shares of Class B stock ($0.01 par value) authorized, of which1,655,462 were outstanding. The voting powers, preferences and relative rights of the Class B stock are identical tocommon stock in all respects except that (i) the holders of common stock are entitled to one vote per share and theholders of Class B stock are entitled to the lesser of ten votes per share or 49% of the total votes cast, (ii) stockdividends on common stock may be paid only in shares of common stock and stock dividends on Class B stock maybe paid only in shares of Class B stock and (iii) shares of Class B stock have certain conversion rights and aresubject to certain restrictions on ownership and transfer. Each share of Class B stock is convertible into one share of

CENTRAL GARDEN & PET COMPANY
NOTES TO CONSOLIDATED FINANCIAL STATEMENTS—(Continued)
49
common stock, at the option of the holder. Additional shares of Class B stock may only be issued with majorityapproval of the holders of the common stock and Class B stock, voting as separate classes.
At September 29, 2001, there were 1,000,000 shares of preferred stock ($0.01 par value) authorized, of whichnone were outstanding.
In August 1998, the Company’s Board of Directors authorized a program for the Company to repurchase up to$25 million of common shares. In several subsequent authorizations, the Company’s Board of Directors increasedsuch authorization up to $155 million of common shares as of December 1, 1999. As of September 29, 2001, theCompany had repurchased approximately 13.7 million shares of its common stock for an aggregate price ofapproximately $143.8 million under this program.
In 1993, the Company adopted the Omnibus Equity Incentive Plan (the “Plan”) which, through September 29,2001, has provided for the grant of options to key employees and consultants of the Company for the purchase of upto an aggregate of 4.8 million shares of common stock of the Company. The Plan is administered by theCompensation Committee of the Board of Directors, comprised of outside independent directors only, whodetermine individual awards to be granted, vesting and exercise of share conditions.
In 1996, the Company adopted the Nonemployee Director Stock Option Plan (the “Director Plan”) whichprovides for the grant of options to nonemployee directors of the Company. In June 2001, the Board of Directors ofthe Company conditionally amended the Director Plan, subject to shareholder approval at the 2002 Annual Meeting,to increase the number of shares authorized for issuance under the Director Plan to 200,000 shares and to revise theannual awards to provide for an option to purchase $100,000 of the Company’s common stock and a restricted stockgrant for $10,000 of the Company’s common stock. In June 2001, the Board also granted each nonemployee directoran option to purchase 7,000 shares of the Company’s common stock and a restricted stock grant for 1,000 shares ofcommon stock outside the Director Plan.
The Company sponsors several 401(k) plans which cover substantially all employees. The Company accruedcontributions of $860,000, $1,030,000 and $987,000 for fiscal years 2001, 2000 and 1999, respectively.
From 1997 until 2001, the Company maintained an employee discount stock purchase plan for eligibleemployees. Under such plan, participants could use up to 15% of their annual compensation up to certain dollarlimitations, whichever was higher, to purchase, through payroll deductions, the Company’s common stock at the endof six-month periods ending June 30 and December 31 of each plan year for 85% of the lower of the beginning orending stock price for the applicable six-month period of each plan year. The remaining shares authorized under theplan were issued to employees during 2001, and the Company does not currently expect to authorize additionalshares under the plan.
Additional Stock Plan Information - The Company continues to account for its stock-based awards using theintrinsic value method in accordance with Accounting Principles Board No. 25, Accounting for Stock Issued toEmployees, and its related interpretations.
SFAS No. 123, Accounting for Stock-Based Compensation, requires the disclosure of pro forma net earningsand earnings per share had the Company adopted the fair value method as of the beginning of fiscal 1997. Thesecalculations require subjective assumptions, including future stock price volatility and expected time to exercise,which greatly affect the calculated values. The Company’s calculations were made using the Black-Scholes optionpricing model with the following weighted average assumptions: expected life of four years from date of grant;stock volatility, 55% in fiscal 2001, 57% in fiscal 2000 and 64% in fiscal 1999; risk free interest rates, 3.98% infiscal 2001, 5.29% in fiscal 2000 and 4.6% in fiscal 1999; and no dividends during the expected term.

CENTRAL GARDEN & PET COMPANY
NOTES TO CONSOLIDATED FINANCIAL STATEMENTS—(Continued)
50
The Company’s calculations are based on a single option valuation approach and forfeitures are recognized asthey occur. If the computed fair values of the fiscal 2001, fiscal 2000, fiscal 1999, fiscal 1998 and fiscal 1997awards had been amortized to expense in the consolidated financial statements over the vesting period of the awards,pro forma net earnings would have been as follows:
Fiscal Year Ended
September 29, 2001 September 30, 2000 September 25, 1999
As reported:Net (loss) earnings (in thousands) .................................. $ (9,250) $(11,813) $24,490Net (loss) earnings per common share:
Basic......................................................................... $ (0.50) $ (0.63) $ 0.90Diluted...................................................................... $ (0.50) $ (0.63) $ 0.89
Pro forma:Net (loss) earnings (in thousands) ................................... $(13,094) $(16,067) $20,849Net earnings (loss) per common share:
Basic......................................................................... $ (0.71) $ (0.86) $ 0.76Diluted...................................................................... $ (0.71) $ (0.86) $ 0.76
However, the impact of outstanding non-vested stock options granted prior to fiscal 1997 has been excludedfrom the pro forma calculation; accordingly, the fiscal 2001, fiscal 2000 and fiscal 1999 pro forma adjustments arenot indicative of future period pro forma adjustments, when the calculation will apply to all stock options.
Option activity under the Plan, Director Plan and to nonemployee directors outside the Director Plan is asfollows:
Number ofOptions
WeightedAverage
Exercise Price
Balance at September 26, 1998...................................................................... 2,115,553 $17.83
Granted (weighted average fair value of $7.26) ............................................ 1,929,224 13.45Exercised......................................................................................................... (159,867) 4.36Cancelled......................................................................................................... (974,915) 22.85
Balance at September 25, 1999...................................................................... 2,909,995 14.35
Granted (weighted average fair value of $3.90) ............................................ 493,170 8.21Exercised......................................................................................................... (48,617) 4.86Cancelled......................................................................................................... (194,600) 14.14
Balance at September 30, 2000...................................................................... 3,159,948 13.55
Granted (weighted average fair value of $2.95) ............................................ 576,750 6.85Exercised......................................................................................................... (40,939) 2.75Cancelled......................................................................................................... (801,200) 13.15
Balance at September 29, 2001...................................................................... 2,894,559 12.48
Exercisable at September 25, 1999 ................................................................ 467,651 15.04
Exercisable at September 30, 2000 ................................................................ 836,579 15.20
Exercisable at September 29, 2001 ................................................................ 1,391,644 15.03

CENTRAL GARDEN & PET COMPANY
NOTES TO CONSOLIDATED FINANCIAL STATEMENTS—(Continued)
51
Options OutstandingSeptember 29, 2001
Options ExercisableSeptember 29, 2001
Range ofExercise Prices
Number ofOptions
Outstanding
WeightedAverage
RemainingContractualLife (Years)
WeightedAverage
Exercise PriceNumber of Options
Exercisable
WeightedAverage
Exercise Price
$1.30 – $4.99 56,331 2.0 $ 2.19 46,384 $ 2.385.00 – 9.99 1,003,170 2.4 7.46 5,000 6.81
10.00 – 14.99 1,198,800 1.0 13.57 887,450 13.4015.00 – 19.99 303,784 1.6 16.44 187,810 16.7620.00 – 24.99 300,000 1.2 21.13 240,000 21.1325.00 – 33.94 32,474 0.7 27.48 25,000 26.50
$1.30 – $33.94 2,894,559 1.6 $12.47 1,391,644 $15.03
10. Earnings Per-Share
Th e follow in g is a r eco nciliation of th e n um erator s and deno min ato rs of th e bas ic an d d ilu ted earn in gs per -s har e(EPS ) comp utations :
Fiscal Year EndedSeptember 29, 2001
Fiscal Year EndedSeptember 30, 2000
Fiscal Year EndedSeptember 25, 1999
Income SharesPer
Share Income SharesPer
Share Income SharesPer
Share(dollars and shares in thousands)
Basic EPS:Net income (loss)available to
common stock ......... $(9,250) 18,402 $(0.50) $(11,813) 18,786 $(0.63) $24,490 27,328 $0.90
Effect of dilutivesecurities:
Options topurchase
common stock ......... 109
Diluted EPS: Net income (loss)attributed to
commonshareholders.............
_______$(9,250)
______18,402 $(0.50)
_______$(11,813)
______18,786 $(0.63)
_______$24,490
______27,437 $0.89

CENTRAL GARDEN & PET COMPANY
NOTES TO CONSOLIDATED FINANCIAL STATEMENTS—(Continued)
52
11. Quarterly Financial Data – unaudited (dollars and shares in thousands)
Fiscal 20011st Quarter 2nd Quarter 3rd Quarter 4th Quarter
Sales (1).................................................... $212,058 $322,807 $341,866 $246,268Gross profit (1)......................................... 64,780 97,484 103,385 73,068Net income (loss)..................................... (4,452) 2,694 7,664 (15,156)
Net income (loss) per common share:Basic ..................................................... $ (0.24) $ 0.15 $ 0.42 $ (0.82)Diluted.................................................. $ (0.24) $ 0.15 $ 0.38 $ (0.82)
Weighted average shares outstanding:Basic ..................................................... 18,334 18,405 18,433 18,443Diluted.................................................. 18,334 18,465 22,598 18,443
Fiscal 20001st Quarter 2nd Quarter 3rd Quarter 4th Quarter
Sales (1).................................................... $217,842 $381,591 $451,378 $300,067Gross profit (1)......................................... 57,479 97,425 112,322 73,546Net income (loss)..................................... (6,475) 12,095 12,875 (30,308)
Net income (loss) per common share:Basic ..................................................... $ (0.33) $ 0.65 $ 0.69 $ (1.63)Diluted.................................................. $ (0.33) $ 0.58 $ 0.61 $ (1.63)
Weighted average shares outstanding:Basic ..................................................... 19,389 18,572 18,640 18,543Diluted.................................................. 19,389 22,769 22,850 18,543
_______________
(1) Reflects the reclassification of $1.2 million for each of the first three quarters of fiscal 2001 and $1.3 million,$1.4 million, $1.0 million and $0.6 million for the first, second, third and fourth quarters of fiscal 2000,respectively, attributable to the net effect of reclassifying certain shipping and handling billings and volume-based rebate incentives. See Note 1.
12. Transactions with Related Parties
The Company leased certain warehouse facilities and equipment from related entities which had been controlledby the Company’s principal shareholder. Rental expense under these leases totaled $99,000 annually in fiscal year1999. During fiscal year 1999, the Company’s principal shareholder disposed of these assets.
During fiscal 2001, 2000 and 1999, subsidiaries of the Company purchased $2.1 million, $1.9 million and$1.5 million, respectively, of products from Bio Plus, Inc., a company that produces granular peanut hulls. As ofSeptember 29, 2001, the Company owed Bio Plus, Inc. $20,721 for such purchases. Such amounts were included inaccounts payable as of that date. A director and executive officer of the Company is a minority shareholder and adirector of Bio Plus, Inc.

CENTRAL GARDEN & PET COMPANY
NOTES TO CONSOLIDATED FINANCIAL STATEMENTS—(Continued)
53
13. Business Segment Data
Operating segments are defined as components of an enterprise about which separate financial information isavailable that is evaluated regularly by the chief operating decision maker, or decision making group, in decidinghow to allocate resources and in assessing performance. The Company’s chief operating decision making group iscomprised of the Chief Executive Officer and the lead executives of each of the Company’s operating segments.The lead executive for each operating segment is also a member of a Strategy Board that manages the profitability ofeach respective segment’s various product lines and business. The operating segments are managed separatelybecause each segment represents a strategic business unit that offers different products or services. The chiefoperating decision making group evaluates performance based on profit or loss from operations The Company’sCorporate division is included in the presentation of reportable segment information since certain revenues andexpenses of this division are not allocated separately to the three operating segments. Segment assets exclude cashequivalents, short-term investments, deferred taxes and goodwill.
Effective September 30, 2000, Scotts discontinued its distribution relationship with the Company, whichsignificantly impacted the Company’s distribution businesses. In December 2000, the Company cancelled theproposed spin-off of its garden distribution business and adopted a plan to reorganize its garden and pet businesses.Under the reorganization plan, the Company’s garden products and distribution businesses became one operatingunit and its pet products and distribution businesses became another operating unit.
Consistent with the above changes, management has determined that the reportable segments of the Companyare Garden Products and Pet Products, based on the level at which the chief operating decision making groupreviews the results of operations to make decisions regarding performance assessment and resource allocation. Thisrepresents a change in the segments reported in the Company’s fiscal 2000 Annual Report filed on Form 10-K.
The Garden Products segment consists of Pennington Seed, Matthews Four Seasons, Grant’s, Norcal Potteryand AMBRANDS. Products manufactured or designed and sourced are products found typically in the lawn andgarden sections of mass merchandisers, warehouse-type clubs, home improvement centers and nurseries and includegrass seed, bird seed, clay pottery, outdoor wooden planters and trellises, ant control and animal repellents. Theseproducts are sold directly to retailers and to distributors. The Garden Products segment is also a national distributorof lawn and garden products. This segment also operates 20 distribution centers across the United States. Theirproducts are sold to independent retailers, national retail chains, grocery stores and mass merchants.
The Pet Products segment consists of Four Paws Products, TFH Publications, Wellmark, Kaytee, IslandAquarium and All-Glass Aquarium. These companies are engaged in the manufacturing, delivery and sale of petsupplies, books and food principally to independent pet distributors and retailers, national specialty pet stores, massmerchants and bookstores. The Pet Products segment is also a national distributor of pet supply products. Thissegment also operates 10 distribution centers across the United States. Their products are sold to independentretailers, national retail chains, grocery stores and mass merchants.
The Corporate division includes expenses associated with corporate functions and projects, certain employeebenefits and nonoperating items such as interest income, interest expense, goodwill amortization, intersegmenteliminations, and net other charges of $27.2 million associated with Garden Products for fiscal 2000 and$2.7 million associated with Garden Products for fiscal 1999.

CENTRAL GARDEN & PET COMPANY
NOTES TO CONSOLIDATED FINANCIAL STATEMENTS—(Continued)
54
Financial information relating to the Company’s business segments, based upon the new reportable segments,for each of the three most recent fiscal years is presented in the table below.
2001 2000 1999
(in thousands)
Net salesGarden Products..................................................................... $ 676,773 $ 923,742 $1,129,544Pet Products............................................................................ 519,147 484,959 457,331Corporate, eliminations and all other .................................... (72,921) (57,823) (55,260)
Total net sales .......................................................................... $1,122,999 $1,350,878 $1,531,615
Intersegment salesGarden Products..................................................................... $ 29,787 $ 33,630 $ 20,679Pet Products............................................................................ 43,134 24,193 34,581Corporate, eliminations and all other .................................... (72,921) (57,823) (55,260)
Total intersegment sales.......................................................... $ 0 $ 0 $ 0
Income (loss) from operations before other chargesGarden Products..................................................................... $ 7,436 $ 37,097 $ 50,744Pet Products............................................................................ 34,865 32,305 25,286Corporate, eliminations and all other .................................... (31,810) (27,469) (18,608)
Total income from operations before other charges ........... 10,491 41,933 57,422Other charges ............................................................................. 27,156 2,708
Interest expense...................................................................... (23,247) (23,140) (12,680)Interest income....................................................................... 164 589 593Other income ......................................................................... 1,631 1,176 1,106Income taxes........................................................................... 1,711 (5,215) (19,243)
Net income (loss) ...................................................................... $ (9,250) $ (11,813) $ 24,490
AssetsGarden Products..................................................................... $ 289,701 $ 306,805 $ 396,213Pet Products............................................................................ 221,977 246,978 197,396Corporate, eliminations and all other .................................... 404,948 393,635 362,221
Total assets ............................................................................... $ 916,626 $ 947,418 $ 955,830
Depreciation and amortizationGarden Products..................................................................... $ 6,185 $ 6,410 $ 4,845Pet Products............................................................................ 10,758 8,002 5,921Corporate, eliminations and all other .................................... 11,419 11,623 9,726
Total depreciation and amortization..................................... $ 28,362 $ 26,035 $ 20,492
Expenditures for long-lived assetsGarden Products..................................................................... $ 5,111 $ 6,261 $ 4,219Pet Products............................................................................ 7,206 8,246 13,515Corporate, eliminations and all other .................................... 1,571 2,156 906
Total expenditures for long-lived assets................................ $ 13,888 $ 16,663 $ 18,640

55
Item 9. Changes in and Disagreements with Accountants on Accounting and Financial Disclosure
None.
PART III
Item 10. Directors and Executive Officers of the Registrant
The information required by this item is incorporated by reference from Central’s Definitive Proxy Statementfor its 2002 Annual Meeting of Stockholders under the captions “Election of Directors” and “Section 16(a)Beneficial Ownership Reporting Compliance.” See also Item 1 above.
Item 11. Executive Compensation
The information required by this item is incorporated by reference from Central’s Definitive Proxy Statementfor its 2002 Annual Meeting of Stockholders under the caption “Executive Compensation.”
Item 12. Security Ownership of Certain Beneficial Owners and Management
The information required by this item is incorporated by reference from Central’s Definitive Proxy Statementfor its 2002 Annual Meeting of Stockholders under the caption “Ownership of Management and PrincipalStockholders.”
Item 13. Certain Relationships and Related Transactions
The information required by this item is incorporated by reference from Central’s Definitive Proxy Statementfor its 2002 Annual Meeting of Stockholders under the captions “Compensation Committee Interlocks and InsiderParticipation” and “Transactions with the Company.”
PART IV
Item 14. Exhibits, Financial Statement Schedules and Reports on Form 8-K
(a) The following documents are filed as part of this report:
(1) Consolidated Financial Statements of the Company are included in Part II, Item 8:
Independent Auditors’ Report
Consolidated Balance Sheets
Consolidated Statements of Income
Consolidated Statements of Shareholders’ Equity
Consolidated Statements of Cash Flows
Notes to Consolidated Financial Statements

56
(2) Supplementary Consolidated Financial Statement Schedule as of and for the fiscal years endedSeptember 29, 2001, September 30, 2000 and September 25, 1999:
Independent Auditors’ Report on Supplementary Consolidated FinancialStatement Schedule
Schedule II - Valuation and Qualifying Accounts
All other schedules are omitted because of the absence of conditions under which they are required orbecause the required information is included in the consolidated financial statements or notes thereto.
(3) Exhibits:
See attached Exhibit Index.
(b) The Company did not file any reports on Form 8-K during the fourth quarter of fiscal 2001.

57
SIGNATURES
Pursuant to the requirements of Section 13 or 15(d) of the Securities Exchange Act of 1934, the registrant hasduly caused this report to be signed on its behalf by the undersigned, thereunto duly authorized.
Date: December 20, 2001
CENTRAL GARDEN & PET COMPANY
By /s/ William E. Brown William E. Brown Chairman of the Board
Pursuant to the requirements of the Securities Exchange Act of 1934, this report has been signed below by thefollowing persons on behalf of the registrant and in the capacities indicated.
Signature Capacity Date
/s/ William E. Brown Chairman and Chief Executive December 20, 2001William E. Brown Officer (Principal Executive Officer)
/s/ Lee D. Hines, Jr. Director, Vice President and December 20, 2001Lee D. Hines, Jr. Chief Financial Officer
(Principal Financial Officer)
/s/ Robert B. Jones Vice President December 20, 2001Robert B. Jones (Principal Accounting Officer)
/s/ Glenn W. Novotny Director December 20, 2001Glenn W. Novotny
/s/ John B. Balousek Director December 20, 2001John B. Balousek
/s/ Daniel P. Hogan, Jr. Director December 20, 2001Daniel P. Hogan, Jr.
/s/ Brooks M. Pennington, III Director December 20, 2001Brooks M. Pennington, III
/s/ Bruce A. Westphal Director December 20, 2001Bruce A. Westphal

58
INDEPENDENT AUDITORS’ REPORT
The Board of Directors of Central Garden & Pet Company:
We have audited the accompanying consolidated balance sheets of Central Garden & Pet Company andsubsidiaries (the “Company”) as of September 29, 2001 and September 30, 2000 and the related consolidatedstatements of income, shareholders’ equity and cash flows for each of the fiscal years in the three-year period endedSeptember 29, 2001, and have issued our report thereon dated December 7, 2001; such report is included elsewherein this Form 10-K. Our audits also included the supplementary consolidated financial statement schedule of theCompany listed in Item 14(a)(2). This supplementary consolidated financial statement schedule is the responsibilityof the Company’s management. Our responsibility is to express an opinion based on our audits. In our opinion,such supplementary consolidated financial statement schedule, when considered in relation to the basic consolidatedfinancial statements taken as a whole, presents fairly in all material respects the information set forth therein.
San Francisco, CaliforniaDecember 7, 2001

59
SCHEDULE II
CENTRAL GARDEN & PET COMPANY
VALUATION AND QUALIFYING ACCOUNTSAs of and for the Fiscal Years Ended September 29, 2001,
September 30, 2000 and September 25, 1999
Column A Column B Column C Column D Column EAdditions
Description
Balances atBeginningof Period
Charged toCosts andExpenses
Charged toOther
Accounts Deductions
Balances atEnd ofPeriod
AMOUNTS DEDUCTED FROM ASSETS TOWHICH THEY APPLY:Year ended September 25, 1999 Allowance for doubtful accounts receivable................. 6,458 4,909 – 5,224 6,143 Year ended September 30, 2000 Allowance for doubtful accounts receivable................. 6,143 3,572 314 1,979 8,050 Year ended September 29, 2001 Allowance for doubtful accounts receivable................. 8,050 9,302 – 2,888 14,464

60
EXHIBIT INDEX
Set forth below is a list of exhibits that are being filed or incorporated by reference into this Form 10-K:
ExhibitNumber Exhibit
3.1 Third Amended and Restated Certificate of Incorporation (Incorporated by reference from Exhibit 3.1to Registration Statement No. 33-98544).
3.1.1 Certificate of Amendment of Third Amended and Restated Certificate of Incorporation (Incorporatedby reference from Exhibit 3.1.1 to Registration Statement No. 333-46437).
3.2 Copy of Registrant’s Bylaws (Incorporated by reference from Exhibit 3.2 to Registration Statement No.33-48070).
4.1 Specimen Common Stock Certificate (Incorporated by reference from Exhibit 4.1 to RegistrationStatement No. 33-48070).
4.2 Indenture dated as of November 15, 1996 between the Company and Chemical Trust Company ofCalifornia, as Trustee, including the form of Notes (Incorporated by reference from Exhibit 4.2 toRegistration Statement No. 333-21603).
10.1 Supplementary Retirement Benefit Agreement for Key Employees between Central Garden & PetSupply Company and Glenn W. Novotny dated as of July 1, 1991 (Incorporated by reference fromExhibit 10.12 to Registration Statement No. 33-48070).
10.2 Form of Indemnification Agreement between Registrant and Executive Officers and Directors(Incorporated by reference from Exhibit 10.18 to Registration Statement No. 33-48070).
10.3 Loan and Security Agreement by and among Congress Financial Corporation (Western) and CentralGarden & Pet Company, Matthews Redwood and Nursery Supply, Inc., Four Paws Products, Ltd. andEzell Nursery Supply, Inc., dated December 17, 1997 (Incorporated by reference from Exhibit 10 to theCompany’s Quarterly Report on Form 10-Q for the quarter ended June 27, 1998).
10.4 Amendment No. 8 to Loan and Security Agreement by and among Congress Financial Corporation(Western) and Central Garden & Pet Company, Matthews Redwood and Nursery Supply, Inc., FourPaws Products, Ltd. and Ezell Nursery Supply, Inc., dated May 12, 2000 (Incorporated by referencefrom Exhibit 10.6.1 to the Company’s Quarterly Report on Form 10-Q for the quarter ended June 24,2000).
10.5 Intercreditor Agreement between Congress Financial Corporation (Western) and Monsanto Corporationdated as of January 28, 1994 (Incorporated by reference to Exhibit 10.32.1 to the Company’s AnnualReport on Form 10-K for the fiscal year ended December 26, 1993).
10.6 Master Agreement by and between The Solaris Group, a Strategic Business Unit of MonsantoCompany, and the Company dated July 21, 1995 (Incorporated by reference to Exhibit 10.66 to theCompany’s Quarterly Report on Form 10-Q for the quarter ended June 25, 1995).
10.7 Exclusive Agency and Distributor Agreement by and between The Solaris Group and the Companydated July 21, 1995 (Incorporated by reference to Exhibit 10.68 to the Company’s Quarterly Report onForm 10-Q for the quarter ended June 25, 1995).
10.8 Compensation Agreement by and between The Solaris Group and Central Garden & Pet Companydated July 21, 1995 (Incorporated by reference to Exhibit 10.69 to the Company’s Quarterly Report onForm 10-Q for the quarter ended June 25, 1995).
10.9 Amended and Restated Asset Purchase Agreement among Novartis Inc. and the Company dated as ofFebruary 3, 1997, as amended by Amendment No. 1 thereto, dated as of April 22, 1997, andAmendment No. 2 thereto, dated as of May 23, 1997 (Incorporated by reference to Exhibit 1.2 to theCompany’s Report on Form 8-K dated May 26, 1997).

61
ExhibitNumber Exhibit
10.10 Stock Purchase Agreement dated as of December 5, 1997 among the Company and the shareholders ofT.F.H. Publications, Inc. (Incorporated by reference to Exhibit 1.2 to the Company’s Report on Form 8-K/A dated December 18, 1997)
10.11 1993 Omnibus Equity Incentive Plan, as amended (Incorporated by reference to Exhibits 4.1 to theCompany’s Registration Statements Nos. 33-7236, 33-89216, 333-1238 and 333-41931).
10.12 Nonemployee Director Equity Incentive Plan, as amended June 8, 2001.
10.13 Employment Agreement dated as of February 27, 1998 between Pennington Seed, Inc. of Delaware andBrooks Pennington III (Incorporated by reference from Exhibit 10.20 to the Company’s Form 10-K/Afor the fiscal year ended September 26, 1998).
12 Statement re Computation of Ratios of Earnings to Fixed Charges
21 List of Subsidiaries
23 Independent Auditors’ Consent
____________________

EXHIBIT 12
CENTRAL GARDEN & PET COMPANY
COMPUTATION OF RATIOS OF EARNINGS TO FIXED CHARGES
(dollars in thousands)
September 27,1997
September 26,1998
September 25,1999
September 30,2000
September 29,2001
Income (loss) before income taxes......... $ 30,368 $ 58,095 $ 43,733 $ (6,598) $ (10,961)Fixed charges (1) .................................... 7,609 8,807 13,755 24,841 24,863
Total earnings and fixed charges........ 37,977 66,902 57,488 18,243 13,902
Fixed charges (1) .................................... $ 7,609 $ 8,807 $ 13,755 $ 24,841 $ 24,863
Ratio of earnings to fixed charges.......... 4.99 7.60 4.18 0.73 0.56
(1) Fixed charges consist of interest expense incurred and the portion of rental expense under operating leasesdeemed by the Company to be representative of the interest factor.