secure trust bank plc · pdf filesecure trust bank plc secure trust bank plc annual report...
TRANSCRIPT

SECURE TRUST BANK PLC
Secure Trust Bank PLC
Annual Report & Accounts 2015
Straightforward transparent banking
Registered Number 00541132

Contents
SECURE TRUST BANK PLC
1 Introduction
2 Group strategy, values and business model
11 Financial and operational highlights
13 Chairman’s statement
14 Chief Executive’s statement
20 Strategic report: Business review
27 Strategic report: Financial review
30 Strategic report: Principal risks and uncertainties
35 Strategic report: Capital, leverage and liquidity
38 Culture
41 Board of Directors
42 Directors’ report
45 Directors’ responsibility statement
46 Corporate Governance statement
50 Remuneration report
53 Independent Auditor’s report
55 Consolidated statement of comprehensive income
56 Consolidated statement of financial position
57 Company statement of financial position
58 Consolidated statement of changes in equity
59 Company statement of changes in equity
60 Consolidated statement of cash flows
61 Company statement of cash flows
62 Notes to the consolidated financial statements
113 Five year summary
114 Corporate contacts & advisers

Achieving our ambitions
SECURE TRUST BANK PLC 1
Secure Trust Bank PLC (‘the Bank’) is a well-established UK bank, having been incorporated in 1954 and has been a subsidiary of
the Arbuthnot Banking Group since 1985.
The Bank successfully listed on the Alternative Investment Market (AIM) in 2011. The Bank has increased its portfolio in recent
years, acquiring the Everyday Loans Group (ELG) and the V12 Finance Group in 2012 and 2013 respectively as well as the trade
and certain assets of the Debt Managers Group in 2013. In 2014 the Bank developed solutions for the small and medium sized
enterprise (SME) market providing Real Estate Finance, Asset Finance and Commercial Finance. These portfolios have enjoyed
significant growth in new business during 2015. On 4 December 2015, the Bank agreed to the conditional sale of ELG at a
significant profit, which could be reinvested to accelerate the Group’s growth prospects and secure new income streams. The Bank
and its subsidiaries are referred to as ‘the Group’.
Trusted products
The core business of the Bank is the provision of banking services predominantly being a range of consumer and SME lending
solutions and savings products. The Group is committed to providing customers with straightforward transparent banking solutions,
coupled with great service and delivered by friendly and professional staff.
“Friendly and professional service. Very efficient too - couldn't be happier.”
“Excellent customer service from start to finish.”
FEEFO (the Feedback Forum) is the global ratings and reviews provider used by the world's most trusted brands. It collects
reviews from our customers ensuring that we receive feedback that the Bank can trust to be genuine and thus act upon. Quotes
received were taken from feedback received in 2015. FEEFO satisfaction level is currently 96%.
Investors in people
The Bank operates from its head office in Solihull, West Midlands and had 773 full time equivalent employees at 31 December
2015. The Bank achieved the Investors in People Silver Accreditation in 2014, less than a year after achieving the Bronze
standard. The Bank also operates a number of award schemes for its staff, which are designed to foster customer service
excellence, outstanding achievement and more efficient processes.
Innovative products for consumers
The Bank continues to develop its portfolio of products in the Retail sector, building successful new relationships with a number of
leading furniture, leisure and household high street brands. Under our V12 brand, the Bank continues to deliver prime retail lending
through an increasing number of online, mail order or in-store channels. Our established Motor Finance business has also evolved,
including lending to the prime market sector. With the exception of a £10 option to purchase fee, all motor loans are now fee free to
the consumer.
Partner for businesses
The Bank strengthened its position in the SME market during 2015. It has continued to grow its residential, investment and
development portfolio within the Real Estate Finance sector and has an ongoing pipeline of potential new business. The Bank’s
partnership with Haydock Finance, an established Asset Finance provider, has enabled us to build a successful relationship in its
first full year. The Commercial Finance team continues to build strong, professional relationships, enabling us to increase the size
of the portfolio with a range of tailored solutions.
Stable funding profile
The Bank’s lending is predominantly funded by customer deposits. From 2013 the Bank was permitted to draw down facilities
under the Funding for Lending Scheme (FLS). FLS monies are maintained as a liquidity buffer, above that required to support
lending, reflecting the Bank’s cautious approach to risk.

Group strategy, values and business model
SECURE TRUST BANK PLC 2
Group strategy
The Bank’s aim is to ensure that UK customers are able to access through it the financial products they need. In doing so, the Bank
is committed to providing customers with straightforward transparent banking solutions. The strategy is to grow the loan portfolios
within the consumer and business market sectors through niche product offerings. The growth is to be delivered through a strategy
of organic growth with selective acquisitions.
The strategic aim is to deploy capital within both the consumer and business market sectors in a manner that will deliver a
shareholder return reflective of the Bank’s risk appetite.
The strategic aims are presented under three strategic themes adopted by the Group which are to Grow, Sustain and Love. The
individual components of this strategy comprise:
Grow To maximise shareholder value through strong lending growth by delivering great customer outcomes in
both our existing and new markets.
Sustain To protect the reputation, integrity and sustainability of the Bank for all of our customers and
stakeholders via prudent balance sheet management, investment for growth and robust risk and
operational control. Controlled growth is one of the top strategic priorities for the Bank.
Love To ensure that the fair treatment of customers is central to corporate culture and that the Bank is a
highly rewarding environment for all staff and one where they can enjoy progressive careers.
Values
To achieve this strategy, the Bank has adopted a number of shared values and beliefs. It is our vision to build the best bank in
Britain and to help us achieve that we have chosen six values which underpin the way we do business and the behaviour we
expect from all of our staff. They set a clear path for both management and staff on how they must work towards the achievement
of the mission and vision. The shared values of the Group are:
Customer focused Good customer outcomes are at the heart of everything we do.
Risk aware Understanding of risk keeps our customers and us safe and secure.
Change orientated Embracing change and implementing good ideas gives us a competitive advantage.
Teamwork Companies achieve more when they work well together.
Ownership Personal responsibility and taking tasks through to completion benefits the individual as well as
customers.
Performance driven Secure Trust Bank will only become the best bank in Britain by each employee taking personal
accountability for their performance.
These values are used in evaluating an individual’s personal performance and their contribution to the achievement of the strategy
of the Bank.

Group strategy, values and business model
SECURE TRUST BANK PLC 3
Business model Business finance
Real Estate Finance
Launched in 2013, Real Estate Finance provides finance to enable commercial and residential real estate development and
investment.
What we do
The twin purposes of the Real Estate Finance business are to finance remedies to the undersupply of housing stock in the UK and
to allow property investors to invest. The business supports small to medium sized enterprises (“SMEs”) over a financing term of up
to five years with prudent loan to value levels.
The Real Estate Finance team is staffed by experienced bankers with proven property lending expertise. The team provides full
support to customers and introducers over the life of the products.
How we do it
There are five main products available for our customers; residential development, commercial development, residential
investment, commercial investment as well as mixed development. The current route to market is via introducers who are served by
a team of Real Estate Finance regional managers. The speed of decision making and flexibility of deal structuring are key factors to
the strength of the business. There is no geographic or individual counterparty concentration risk to the lending.

Group strategy, values and business model
SECURE TRUST BANK PLC 4
Business model Business finance
Asset Finance
Launched in December 2014, Asset Finance provides finance for plant, machinery and commercial vehicle purchases by SMEs.
What we do
The Asset Finance business provides funding to support SME businesses in acquiring commercial assets, such as building
equipment, commercial vehicles and manufacturing equipment, and who may not be adequately served by the traditional banks.
How we do it
The Asset Finance business is operated via a partnership with Haydock Finance. Haydock are a well-established asset finance
company operating across the UK. Haydock are providing a full business process outsourcing service to the Bank.
The current route to market is via introducers who are supported by an internal marketing resource and a targeted web and social
media presence.
Facilities offered are hire purchase and finance lease arrangements with terms of up to five years.

Group strategy, values and business model
SECURE TRUST BANK PLC 5
Business model Business finance
Commercial Finance
Launched in late 2014, Commercial Finance provides SMEs with invoice finance solutions, providing companies with the funding
needed to secure growth. It provides customers with local decision makers and experts, whilst allowing businesses to reap the
rewards of working with a bank that supports them.
What we do
The Commercial Finance business specialises in providing a full range of invoice financing solutions to UK businesses including
invoice factoring and discounting.
The business has been successful in acquiring a wide range of clients across the whole of the UK with a broad variety of funding
requirements and solutions.
Commercial Finance dovetails into the broader SME lending proposition which has been developed by the Bank. The business also
provides SME commercial owner occupiers with finance to buy the property they trade from.
How we do it
The business has built a strong team of proven business development, credit and operational professionals who have delivered a
robust and compliant operational model which has already received plaudits and award nominations in the market. The business
operates from a centre in Manchester but provides national coverage via teams throughout the network who can service the
national introducer market and existing clients.
The Commercial Finance business uses a well-established operating system in order to give top quality service to its customers
and to enable quick decision making and strong risk management.

Group strategy, values and business model
SECURE TRUST BANK PLC 6
Business model Consumer finance
Personal Lending
The Group offers fixed rate, fixed term loans through its Moneyway brand as well as having a high street presence through the
everydayloans brand.
What we do
The Bank is well established in personal unsecured lending, having been lending for over 35 years, with Moneyway being the Bank’s Personal Lending brand. During 2012 the Company acquired Everyday Loans which helped to build a significant presence for the Bank in the area of personal lending. The personal loans which the Group offers are fixed rate, fixed term products which are unsecured. Loan terms are between 12 months and 60 months with advances varying from £500 to £15,000. Loans are provided to customers for a variety of purposes which might include, for example, home improvements, personal debt consolidation and the purchase of vehicles. On 4 December 2015, the Company agreed to the conditional sale of ELG at a significant profit, meaning that going forward the Bank will focus its Personal Lending through its Moneyway brand. How we do it
Distribution of the Group’s personal loans is through brokers, existing customers and affinity partners, and targeted to UK-resident customers who are either employed or self-employed. Loans are made to individuals over 21 years of age with an annual income generally over £20,000. The Group, through its brand Moneyway, offers loans via the internet and a phone service utilising an experienced team of UK based advisers. The Group has broadened its online distribution capabilities in the personal lending segment and operates significant introducer relationships, including with Shop Direct. The business utilises automated underwriting systems which, in addition to providing significant cost advantages, ensure that consistent credit decisions are made which improves ongoing performance monitoring and future policy decision making. Differential pricing that reflects the credit risk of the underlying customer is standard for the Group. These systems have enabled the business to control risk whilst retaining the speed of service needed to support introducers. Everyday Loans is a provider of unsecured loans to a customer base predominantly in lower income groups and also offers any purpose unsecured loans to tenants as well as homeowners. Everyday Loans operates through a network of offices where loans are originated, serviced and collected. Applications are made by phone or online.

Group strategy, values and business model
SECURE TRUST BANK PLC 7
Business model Consumer finance
Motor Finance
Finance is arranged through motor dealerships and brokers and involves fixed rate, fixed term hire purchase arrangements,
predominantly on used cars.
What we do
The Bank’s Motor Finance business began lending in 2008 under the Moneyway brand and provides hire purchase lending products to a wide range of customers including those who might otherwise be declined by other finance companies. The Bank helps customers to get on the road as well as helping introducers to sell more cars. Motor Finance loans are fixed rate, fixed term hire purchase agreements and are secured against the vehicle being financed. Only passenger vehicles with certain features meet our lending criteria, which have now evolved to include an engine size of up to three and a half litres, an age ranging from new to a maximum of 12 years old by the end of the hire purchase agreement and with a maximum mileage of 100,000 miles. The majority of vehicles financed are used cars. Finance term periods are up to 60 months with a maximum loan size of £20,000. Moneyway agreements attract only a nominal £10 option to purchase fee and are otherwise fee free. Customers are either private individuals or self-employed small business users. During 2015 Moneyway began to lend into the prime motor sector and thus operated across a much wider breadth of the risk curve. In the prime sector the maximum loan amount increases to £25,000. How we do it
The Bank distributes its Motor Finance products via UK motor dealers, brokers and internet introducers. New dealer relationships are established by our UK-wide Motor Finance sales team with all introducers subject to a strict vetting policy, which is reviewed on a regular basis. The motor business has a dedicated sales team responsible for all aspects of the management of the introducer relationships. The technology platform used allows Moneyway to manage all aspects of the motor business, from introducer set up and application capture through to underwriting, pay-out and agreement servicing. Motor lending is administered in the Group head office in Solihull; however the UK motor dealers and brokers are UK-wide.

Group strategy, values and business model
SECURE TRUST BANK PLC 8
Business model Consumer finance
Retail Finance
Includes lending products for in-store and online retailers to enable consumer purchases.
What we do
The Bank’s Retail Finance business commenced lending in 2009 and provides unsecured, prime lending products to the UK customers of its retail partners to facilitate the purchase of a wide range of consumer products across in-store, mail order and online channels. The acquisition of the V12 Finance Group in January 2013 was complementary to the Group’s existing retail finance proposition and the V12 management team continued in the business. V12 Retail Finance has provided finance in co-operation with their retail partners for more than 20 years. The acquisition enabled the Group to integrate its existing retail lending business with that of the V12 Finance Group to generate synergistic benefits from the use of a Group-wide point of sale system. The majority of the Bank’s retail partners are now on the V12 platform. Retail Finance products are unsecured, fixed rate and fixed term loans of up to 84 months in duration with a maximum loan size of £25,000. The average new loan is for £800 over an 18 month term. Lending is restricted to UK residents who are either employed or self-employed. The finance products are either interest bearing or have promotional credit subsidised by retailers, allowing customers to spread the cost of purchases into more affordable monthly payments or paying later for the goods. How we do it
The Group operates an online eCommerce service to retailers, providing finance to customers through an industry-leading online paperless processing system. This includes allowing customers to digitally sign their credit agreements, thereby speeding up the pay-out process, and removing the need to handle and copy sensitive personal documents through electronic identity verification. The Group serves retailers across a broad range of retail sectors including cycle, music, furniture, outdoor/leisure, electronics, dental, jewellery and football season tickets. The Group provides finance to customers of a large number of retailers including household names such as Evans Cycles, PC World, AO.com, Jessops, Halfords, DFS and Watchfinder. Partnerships are also in place with a number of affinity partners including Creative United and ACTSmart. Retail lending is administered in V12 Retail Finance’s offices in Cardiff and its dedicated retail lending team aims to provide a quality service to both retailers and customers.

Group strategy, values and business model
SECURE TRUST BANK PLC 9
Business model Current account and OneBill
What we do
The current account is a simple and transparent bank account which has been designed to help customers manage their money and keep control of their finances by only letting them spend the money they have available each month. The account does not have an overdraft facility so the account holders can only spend money that they have available. In 2015, the Bank closed this account to new business. The account comes with a prepaid card, onto which money must be loaded before it can be used, similar to a ‘pay as you go’ mobile phone top-up. Customers generally make sure that they have enough money in their current account to cover direct debits, standing orders and any other regular payments, with the remaining money transferred onto their card to spend at over 30 mill ion outlets, for online and telephone purchases and to make cash withdrawals at ATMs showing the MasterCard® acceptance mark. OneBill is a household budgeting product, which was closed in 2009 but continues to provide a service to the existing customer base. How we do it
The account holder can register for the online and telephone banking service which gives access to their account 24 hours a day, 7 days a week and allows the free movement of money to and from their current account and prepaid card. The fees are simple and transparent with no hidden or unexpected charges. For example, there are no charges should a direct debit or standing order payment fail. Customers welcome the transparent monthly account management fee, in return for which credit interest is paid at base rate.

Group strategy, values and business model
SECURE TRUST BANK PLC 10
Business model Savings
The Bank offers notice deposits and deposit bonds with competitive interest rates.
What we do
The Bank’s savings accounts consist of notice accounts, fixed term bonds and deposit accounts. Secure Trust Bank savings accounts are simple in design and the interest rates offered are competitive and provide value for money. Deposit accounts can be opened for as little as £1 and withdrawals can be made without notice or loss of interest. The notice deposit accounts are made available in periods ranging from 60 days to 183 days, with the majority at the 120 day term, depending on the Group’s funding requirements. Fixed Price Deposit Bonds are launched when required to achieve the desired maturity profiles of the Group. How we do it
By virtue of a focus on higher margin lending, the absence of large fixed overheads in the form of a branch network and a policy of not cross-subsidising loss making products with profitable ones, the Bank is able to offer competitive rates and has been successful in attracting term deposits from a wide range of personal and non-personal customers. This provides a funding profile which gives additional financial security to the business.
Methods of attracting deposits include product information on price comparison websites (such as Moneysupermarket), best buy tables and newspaper articles about the deposit accounts offered by the Group.
All savings products are administered in the Group head office in Solihull. The Bank is a member of the Financial Services Compensation Scheme (FSCS).

Financial and operational highlights
SECURE TRUST BANK PLC 11
Financial highlights
Operating income 2015: £132.5m 2014: £97.9m 2013: £79.0m 2012: £47.0m
Underlying profit before tax * 2015: £39.3m 2014: £33.3m 2013: £25.2m 2012 £16.6m
Profit before tax 2015: £36.5m 2014: £26.1m 2013: £17.1m 2012: £17.2m
Total capital ratio 2015: 13.9% 2014: 19.0% 2013: 14.6% 2012: 16.4% (based on Total Risk Exposure)
Loan to deposit ratio 2015: 104%** 2014: 102%** 2013: 90% 2012: 75%
Earnings per share 2015: 157.8p 2014: 122.3p 2013: 78.3p 2012: 108.9p
Total assets 2015: £1,247.4m 2014: £782.3m 2013: £525.9m 2012: £474.6m
* Before acquisition costs, fair value amortisation, costs associated with share based payments, Arbuthnot Banking Group
management charges and income from acquired portfolios.
** This excludes the UK Treasury Bills borrowed from the Bank of England under the Funding for Lending Scheme, which have
subsequently been pledged as part of a sale and repurchase agreement. If these were included the loan to deposit ratio would be
100% (2014: 100%).
All figures above include the results and balances of ELG.
New business
volumes
Loans and advances to
customers
2015 2015
£m £m
Real Estate Finance 270.6 368.0
Asset Finance 72.8 70.7
Commercial Finance 27.6 29.3
Personal Lending 135.9 188.6
Motor Finance 85.7 165.7
Retail Finance 293.9 220.4
Other 16.7 32.2
903.2 1,074.9
Loans and advances
to customers 2015: £1,074.9m 2014: £622.5m 2013: £391.0m 2012: £297.6m
Total customer lending balances across the STB Group increased by 73% to £1,074.9 million.
Customer numbers increased 33% to 570,759.
All figures above include the results and balances of ELG.
The Customer Service Excellence Award, introduced by the Cabinet Office was renewed in 2015. The Bank has also received
various awards including Best Savings Provider, Best Challenger Bank and Best Charity Saving Account Provider from Savings
Champion during 2015.
The Bank continues to enjoy the favourable conditions in the retail deposits market and it raised over £333 million from deposit
bonds in one to seven year maturities.

Financial and operational highlights
SECURE TRUST BANK PLC 12
In 2015 the Bank has significantly increased the size of its SME lending proposition in the Real Estate Finance, Asset Finance and
Commercial Finance businesses. Each of these businesses provides funding to small and medium sized businesses. The
Consumer Finance business has also seen excellent growth in new lending volumes particularly in the Retail Finance space. The
ongoing growth in the lending book has driven record levels of profits and underlying earnings.

Chairman’s statement
SECURE TRUST BANK PLC 13
I am pleased to report that Secure Trust Bank made further progress during 2015. Our commitment to offering outstanding
customer service and providing good outcomes for customers via our straightforward transparent banking solutions remains at the
forefront of our proposition. Customer satisfaction levels have been consistently high and the appeal of our products and services
saw overall customer numbers continuing to expand from 429,507 to 570,759 during 2015, an increase of 33%.
Our strategy of growing our overall customer lending balances whilst simultaneously expanding into secured SME lending is being
successfully implemented. Overall customer lending grew by 73%. As at the year end 53% of the balances are in unsecured
consumer lending (2014: 70%) and 44% are in SME lending (2014: 23%). Our long term ambition remains to have a diverse and
growing lending portfolio that is balanced across consumer finance, SME finance and residential mortgage assets.
In December 2015 we announced the sale of ELG to Non Standard Finance PLC. Their unsolicited approach at a compelling
valuation presented an attractive option to accelerate our strategy of proportionately reducing our exposure to personal unsecured
loan products whilst we invest in our strongly growing Motor, Retail and SME lending activities. The Board therefore believes that
the disposal is in the interests of the Group and represents an excellent opportunity to realise value for shareholders and for
reinvestment into STB's existing profitable consumer and business lending divisions, in line with the Group's stated ambition to
shift, over time, the majority of the Group's balance sheet lending into secured lending assets.
Our management philosophy of exercising prudence in respect of capital, funding and lending remains unchanged. The Bank
remains well capitalised and liquidity and interest basis risks continue to be mitigated by our strategy to broadly match lending and
deposits of the same tenor and term. The Bank’s funding and capital positions will be significantly strengthened upon the
completion of the sale of ELG. There are significant organic and external business development opportunities. As ever, we will
exercise discipline and caution when considering any potential acquisitions.
I am confident that the Group will continue to demonstrate sustainable growth over the coming period. The Board proposes to pay
a final dividend of 55 pence per share. This, when added to the interim dividend of 17 pence would mean a full year dividend of 72
pence per share. If approved, the final dividend will be paid on 6 May 2016 to shareholders on the register as at 8 April 2016.
The sale of the ELG, when completed, will result in significant profit and cash being generated for the benefit of the Group. We
estimate the transaction will give rise to a post-tax profit of circa £115 million. Given this sizeable gain, the Board intends to
propose a special interim dividend of £30 million following completion of the sale. The timing of any such interim dividend will
depend on when the sale completes and receipt of the sale proceeds by the Company. Completion includes regulatory approval of
the change of control, transfer of ownership and inclusion of the gain within the Company’s capital reserves. The Board would, in
the normal course, also review the financial position and prospects of the Company further before formally declaring any such
special dividend. However, the Board believes that, following payment of the special dividend, the Company would retain sufficient
capital resources to support its ongoing growth.
Finally my Board and I would like to thank all of our employees for their commitment and hard work during 2015. At the end of
2015, Carol Sergeant retired as a Non-Executive Director having made an important contribution to the development of the Bank. I
would like to express my gratitude to Carol and to my fellow directors for their support during the year.
Sir Henry Angest Chairman
16 March 2016

Chief Executive’s statement
SECURE TRUST BANK PLC 14
2015 has been another year of progress across the Secure Trust Bank Group. We have proactively managed the shape of the
group and the composition of the asset portfolio finishing the year, as intended, with a good balance between consumer and SME
lending assets. Notwithstanding the ongoing investment in the new SME division, the growth and strong performance of the lending
book has driven record levels of profits and underlying earnings. The combination of these profits and the significant one off gain
arising upon completion of the ELG divestment will provide a strong capital base and the continuing ability to pay progressive
dividends. In addition, as noted in the Chairman’s statement the Board intends to propose a one-off special dividend of £30 million
following completion of the ELG disposal.
Customer base increasing against background of high satisfaction levels
We are serving a record number of customers across our savings, motor finance, retail point of sale finance, unsecured personal
lending, asset finance, invoice finance and real estate finance markets. Across the Group the total customer base grew by 33%
during 2015 to 570,759.
We remain committed to delivering consistently good outcomes for our existing and future customers and specifically design our
products to be as easy as possible for customers to understand and appropriate for their needs. From a conduct and behaviour
perspective we do not cross subsidise losses on some products with super profits on others. Nor do we discriminate between
customers by, for example, offering lower deposit rates to existing loyal customers than to new ones. We believe this is the
appropriate way to interact with our customers for the long term benefit of all parties.
We continue to measure customer satisfaction in a number of ways, including being the only bank that uses FEEFO (Feedback
Forum). This rich data reflects how our customers actually experience us and given its importance this remains the first thing we
discuss at our weekly management meeting. I am pleased to note that we have consistently achieved customer satisfaction ratings
in excess of 90% across all of our products during the year.
For the fourth year running we received confirmation that the Fairbanking Foundation had renewed our 4 star mark in respect of our
current account product. We remain the only bank in the UK to hold the Customer Service Excellence award (CSE) which was
reaffirmed in 2015. This award was introduced by the Cabinet Office in 2010 to replace the Kite Mark. The CSE is a strong
independent endorsement of the way customer focus is embedded in the culture of the business and the improvements we
continue to make to our products and services.
We are pleased with these external accolades and the high customer satisfaction scores but are in no way complacent. We remain
highly focused on improving our existing service and products and introducing new ones via the targeted investment in people,
systems and processes.
Controlling growth
The Board's top strategic priority is, as ever, to safeguard the reputation and sustainability of STB through prudent balance sheet
management, investment for growth and robust risk and operational controls. The regulatory environment has continued to evolve
in 2015 and we have proactively responded by investing further in our ‘Three Lines of Defence’ business model. Our Credit Risk,
Operational Risk and Internal Audit capabilities continue to be enhanced. Our consumer facing businesses are all now regulated by
the Financial Conduct Authority (FCA) reflecting the transfer of regulation from the Office of Fair Trading to the FCA.
All aspects of risk are monitored closely with particular attention paid to the performance of our lending book. Our impairment levels
have remained below the level which we had assumed within our pricing models when originating the business. We continue to
adopt a robust and dynamic formulaic approach to impairment provisioning. Where appropriate, the Group has looked to support
customers who are in financial difficulty and we seek to engage in early communication with borrowers experiencing difficulty in
meeting their repayments.
Regulatory environment
Notwithstanding regular calls for greater competition from media, consumer groups and politicians, tangible progress to create a
more proportionate approach to the regulation of non-systemic banks in 2015 has been limited. The overall tone especially from
Government and the Prudential Regulation Authority (PRA) / Bank of England is encouraging. I hope to see words and actions
becoming more aligned in the coming period and I appreciate the work that has commenced in this regard.
Despite the Competition and Markets Authority (CMA) clearly acknowledging some of the root causes of the ineffective competition
in UK Banking, their provisional findings and possible remedies were largely superficial in nature. Notwithstanding the initial

Chief Executive’s statement
SECURE TRUST BANK PLC 15
disappointment, I have drawn confidence from the significant and sustained pressure the Treasury Select Committee (TSC) has put
on the CMA to reconsider their initial findings. I believe that in response to this, in January 2016 the CMA announced that it was
extending its review into Retail Banking competition. In February 2016 it was widely reported that the National Audit Office (NAO)
had added to this pressure via a report they issued which referred to the CMA investigation into banking and stated ‘the ability of
the CMA to present a credible market analysis and formulate effective remedies, if appropriate, will have a significant effect on its
reputation’. The timescales for the next CMA report are unclear but we are tracking developments very closely.
Secure Trust Bank and the British Bankers Association have continued to campaign throughout 2015 for a level competitive playing
field. It is clear that key stakeholders now better understand the barriers to growth faced by small and challenger banks. In late
2015 the Bank of England published a paper making the case to the EU for a more proportionate approach to bank regulation. This
was echoed in February by Andrea Enria, chairman of the European Banking Authority (EBA) who said, “I acknowledge the
framework is fiendishly complicated, especially for banks with very simple business models. Regulators have a duty to ask if
simpler ways can be found to achieve the same outcomes… the complexity of regulation should match the complexity of business
models”. As noted above the TSC continues to promote the competition agenda and in the final quarter of 2015 the Chancellor
announced that he had formed a Challenger Bank High Level Advisory Group comprising senior HM Treasury officials and the
CEOs of the challenger banks. This group will aim to work with HM Treasury to bring about the changes needed to create a more
level playing field which will enable more effective competition across the broader market.
We will continue to closely monitor the operating and regulatory environment and adapt our business model to mitigate risk and
maximise opportunities going forward. I remain confident that the regulatory environment will further evolve and a more
proportionate approach will be applied to smaller banks. This will help us to make greater progress with our strategic plans and
offer more of our existing and new products to a larger number of consumer and SME customers.
Prudent funding profile
Our funding strategy is unchanged. We seek to limit exposure to short term wholesale funding and interbank markets and to
broadly match fixed term fixed rate customer lending with customer deposits of the same tenor and interest rate basis. This helps
us to minimise maturity transformation and interest rate basis risk. During 2015 our lending activities were again funded primarily by
customer deposits with only very modest use made of the Funding for Lending scheme. Our year end loan to deposit ratio was
104% (2014: 102%). To achieve a broadly matched asset to liability position we increased the average tenor of our deposits over
the year with fixed term deposits rising to 57% of total deposits. This compares to 54% as at 31 December 2014. Our overall cost of
funds have benefitted from market forces which have enabled us to replace maturing term deposits with new deposits of the same
tenor but at lower fixed rates.
At the time of writing the outlook for interest rates suggests they will remain low for an extended period. I do not anticipate negative
interest rates in the UK. Whilst such a move would not directly impact on STB, given our funding structure, lower or negative base
rates would be very injurious to the largest banks and the small building societies. Overall I envisage funding conditions remaining
benign for the foreseeable future.
Robust capital ratios and modest leverage
Our year end Common Equity Tier 1 (CET1) Capital levels remain healthy and reflect the successful deployment of capital raised in
the second half of 2014. On a solo-consolidated basis the CET1 ratio of 13.6% compares with the 2014 year end position of 18.7%.
As at 31 December 2015 STB's leverage ratio was 10.4% (excluding the expected capital gain from the ELG disposal), which
reduced over the year as the capital raised in H2 2014 was invested in the strong growth in customer loan balances. This ratio is
comfortably ahead of minimum requirements.
The estimated impact of the ELG transaction is to increase the CET1 ratio to 24% and the leverage ratio to 18% (as at 31
December 2015).This serves to highlight the scope we have to increase our lending activities whilst remaining modestly leveraged.
Profit levels and return on equity building
Including discontinued operations, the Group’s operating income grew by 35% to a record level of £132.5m (2014: £97.9m) whilst
operating costs, which continue to be robustly managed, rose 27% to £71.7m from £56.5m in 2014, with the cost: income ratio of
51.3% (2014: 51.4%) remaining stable notwithstanding the very significant investment in the new SME division. Loan impairments
of £24.3m (2014: £15.3m) rose by 59% which compares to the 73% growth in customer lending balances to £1,074.9m (2014:
£622.5m). The level of impairments remains below the levels expected when the loans were originated.

Chief Executive’s statement
SECURE TRUST BANK PLC 16
Pre-tax profits, including ELG, for 2015 of £36.5m are 40% higher than the prior year of £26.1m. The underlying profit for 2015 of
£39.3m represents an 18% increase on the £33.3m underlying profit before tax in 2014.
In order to support the creation of the SME division additional capital of £50m was raised in H2 2014 and as a result STB entered
2015 with very significant capital surpluses. The mathematical impact of this is to dampen returns on equity whilst this surplus
equity is deployed. As expected, as 2015 progressed the return on equity improved albeit the overall return for the full year is
21.8% (2014: 23.1%).
Customer lending activities grew as planned
Once again, strong double digit growth was achieved across the group's loan portfolio in 2015. Total new business lending volumes
grew 67% to £903.2m (2014: £540.9m) which translated to an increase of 73% in overall balance sheet lending assets to
£1,074.9m (2014: £622.5m).
Our strategy was to focus growth in our consumer finance lending in Retail Finance and Motor Finance with a more tempered
approach to unsecured personal loans. Reflecting this, the Retail Finance point of sale business, net of provisions, grew strongly as
intended, with balances at 31 December 2015 increasing 89% to £220.4m (2014: £116.7m). Our Retail Finance business has
evolved as our balance sheet has strengthened. In addition to a very strong position in the cycle and music sectors, we have been
able to pitch for, and win, larger retailer relationships across the leisure and home furnishing sectors. As a result we are writing a
broader spectrum of business including increased levels of interest bearing lending. This lending has higher levels of impairments
compared with interest free finance and this is factored into our pricing to ensure we achieve our targeted risk adjusted return.
Motor Finance lending balances, net of provisions, grew 20% to £165.7m at 31 December 2015 (2014: £137.9m). This business,
which focuses on the near prime market segment, continues to service the majority of the Top 100 UK car dealer groups and
enjoys extremely strong relationships with a number of specialist motor intermediaries. We have written greater volumes of prime
lending during 2015. The early indications are that this is attractive business so we will be increasing our activities at this end of the
market.
Personal unsecured lending balances, net of provisions, increased by 4% to £188.6m at 31 December 2015 (2014: £181.4m). We
have previously highlighted our unease at the competitive dynamics in the highly prime end of the personal unsecured loan market
and had tempered our appetite as a result. During H2 2015 the Financial Policy Committee at the Bank of England began
expressing their concerns. I do not find this surprising noting some of the larger lenders are now offering prime five year unsecured
personal loans at rates which are lower than a typical standard variable rate mortgage. Our focus going forward will remain on
returns rather than dramatic personal unsecured loan book growth.
The Group’s SME lending operations have also grown as planned. Real Estate Finance increased by 175% to £368.0m at 31
December 2015 (2014: £133.8m). This lending is split roughly equally between residential development funding and residential
investment finance. STB has a very limited appetite for commercial property lending as we recognise the difficulties lending to this
sector has caused to some banks in the past. Our experience in the residential development space thus far is that the properties
being developed are selling faster and for higher prices than anticipated when we made the original loans. This is obviously a
positive feature albeit it does mean that loans are being repaid sooner than scheduled. 2015 saw significant fiscal changes in the
buy to let (BTL) property market with changes to tax relief on interest payments made by individuals / couples and the introduction
of a 3% stamp duty surcharge on BTL properties for landlords with 15 or fewer units. It is unclear how these changes will affect the
housing market in the near term. The range of possibilities include; 1) smaller amateur landlords flooding the market with properties
for sale, 2) rents being increased to mitigate the financial impact of the changes, 3) individuals and couples moving portfolios into
incorporated structures, 4) professional landlords and corporates unaffected by these changes buying up stock put on the market
by amateurs, 5) a mix of all these possibilities. Our residential investment lending is not regulated mortgage lending and is not
targeted at amateur landlords; as such the professionals and corporates we lend to could benefit from these taxation changes. In
the short term while we wait for the impacts of the BTL changes on the housing market to become clearer and given the potential
uncertainties arising from the EU referendum we have tempered our lending to residential property developers, especially in
Central London. We remain confident about the medium term prospects of this sector given fundamental supply and demand
dynamics.
In its first full year of operation, Secure Trust Bank Commercial Finance, the invoice finance division of the Bank, funded over
£220m of customers’ invoices. Customer lending balances, net of provisions grew 486% to £29.3m at 31 December 2015 (2014:
£5.0m). Our customer proposition is relationship focused which means this division will take time to achieve critical mass as we are
being very selective with the clients being accepted in the early stages of this business.

Chief Executive’s statement
SECURE TRUST BANK PLC 17
The Asset Finance strategic partnership with Haydock Finance has proven to be very successful thus far, with clear benefits to both
parties. Haydock are a long established and very well regarded asset finance company operating across the UK. They provide a
full business process outsourcing service to STB. This is governed by a detailed operating agreement which includes auditing and
oversight arrangements. All of the lending written fully conforms to STB's credit policies and risk appetite and is assessed by STB
staff based in Haydock's premises. Customer lending balances, net of provisions grew 1,471% to £70.7m at 31 December 2015
(2014: £4.5m).
Disposal of Everyday Loans Group
In December 2015 we announced the proposed sale of ELG to Non Standard Finance PLC (NSF) following an unsolicited
approach for a total consideration and debt repayment of £235 million. We did not set out to sell ELG and all things being equal
would be very happy to continue owning and developing the business. However the nature of the acquirer and the agreed
consideration is such that the transaction should work well for ELG staff whilst allowing accelerated development of other parts of
the STB Group. The NSF executive is extremely experienced in the non-prime segment of the unsecured personal loan market and
has very impressive track records at their previous businesses. They are focused on a growth agenda and will be looking to serve a
wider range of customers via a broader range of products than the STB risk appetite would allow. There is no question that there is
a huge non-standard market that requires the important services and access to credit that ELG provides. Under NSF’s ownership I
expect ELG to grow considerably, which I would hope will benefit ELG staff and NSF shareholders, which will include STB, alike.
The decision to sell ELG demonstrates the Board’s willingness to make and execute decisions which we believe are in the best
longer term interests of shareholders. As stated previously we estimate the post-tax profit on the sale of ELG will be in the region of
£115 million and this will be recognised in 2016. Subject to the transaction completing as expected the Board have decided to
retain the majority of this one off profit to support the strategic priorities detailed below whilst also proposing a special dividend
payment of £30 million. While in the short term the sale is expected to reduce earnings, given the disposal of ELG's profit streams,
we are confident that the proceeds can be reinvested to accelerate the Group's growth prospects and secure new income streams.
Fee based accounts
Current account customer numbers further declined during 2015 reflecting the reduced focus on this product whilst we
concentrated our investment in more profitable areas. Consistent with trends seen in 2014 customer satisfaction levels remained
high but achieving significant growth in customer numbers has been difficult, in part because the operational costs arising from
accessing the payments infrastructure make the product appear to be uncompetitive compared with 'free if in credit' current
accounts from other banks. In December 2015 the High Street banks, under pressure from HM Government, launched basic bank
account propositions to open up access to banking to underserved communities. We are monitoring the impact of these
developments on our current account proposition which remains an immaterial part of our business model.
As expected, the OneBill customer numbers continue to decline over time, following its closure to new accounts in 2009, with
£6.5m of income generated in 2015 compared with £7.1m in 2014.
Debt Managers
The markets for debt collection agencies remained difficult during 2015. Many lenders reported improving impairments trends as
fewer customers defaulted. Debt purchasers have therefore been less active which has impacted on the volume of business they
have placed with debt collectors. Given these dynamics Debt Managers did not trade profitably in 2015 and incurred a modest loss
before tax of £0.5m. This is a market which is undergoing structural changes heavily influenced by the transition of regulatory
oversight from the OFT to the FCA. Debt Managers has now received full FCA authorisation and we believe it is one of the first
debt collection agencies to be authorised. Given the relatively benign outlook for the UK economy, barring a shock, we anticipate
that market conditions will remain tough and have adapted the Debt Managers business to reflect the subdued market.
Our people
I am delighted that following another in-depth review and external assessment of the Group, we have retained the Customer
Service Excellence standard. This Government standard of excellence for customer service benchmarks us against other high-
performing organisations. I am very proud of the feedback received about our teams’ professionalism, honesty and positivity about
working at the Bank, as well as our ethics towards customers. These demonstrate the investments that we have made in creating
the right culture and following a clear set of company values.

Chief Executive’s statement
SECURE TRUST BANK PLC 18
It is also rewarding to receive various new awards including Best Savings Provider from Savings Champion. They provide
independent and unbiased information on the UK savings market.
Our charitable activities have meant we have raised in excess of £50,000 over a 2 year period for Birmingham Children’s Hospital,
through a number of organised events, including an annual flagship cycling event. Our team has also been involved in ward
decorating during the Christmas period. I again applaud my colleagues for both their charitable work and sheer commitment to
delivering great service in a very friendly manner to our customers throughout the year.
Our ongoing overall growth continues to support job security and create career progression opportunities for our team. This is
reflected in full time equivalent employee numbers rising to 773 during the year (2014: 625).
Strategic priorities
Secure Trust Bank PLC undertook its IPO in November 2011 to provide access to the capital it required to support a clear growth
strategy focused on three strategic priorities: (i) organic growth, (ii) diversification and (iii) M&A activity. In the four years since, the
Bank has diligently executed its strategy as reflected in the growth in customer numbers of 309% (2011: 139,693, 2015: 570,759),
growth in customer lending balances of 690% (2011: £136m, 2015: £1,075m), creation of a new SME division, acquisitions of V12
Retail Finance, Debt Managers and the acquisition, investment in and subsequent sale of ELG. Statutory profits before tax have
increased 400% from £7.3m in 2011 to £36.5m in 2015.
Evaluating the effectiveness of this strategy, I note that at the time of the IPO the Bank had shareholders’ equity of circa £19.6m.
The IPO raised £10m of additional capital and shareholders subsequently invested a further £71.5m of capital (circa £19m in
December 2012, £49m in June 2014 and £3.5m in November 2014). At the year-end shareholders’ equity stood at £141.2m.
Following the completion of the sale of ELG, and prior to the impact of any final and special dividends payable during 2016,
shareholders’ equity will increase to circa £226m. In simple terms assuming completion of the ELG sale, in the period from IPO to
date, the Company has been able to use the circa £101m of equity brought forward, plus that invested by shareholders, to create
additional equity of £163m. This is represented in the increased shareholders’ equity of £125m and dividends paid since IPO of
£37.8m.
Looking ahead we see plenty of opportunities to progress this three pronged growth strategy whilst proactively adapting the
business model to reflect market conditions. However in the short term there is likely to be considerable uncertainty ahead of the
UK’s vote on EU membership. STB operates only in the UK and has no direct exposure to the EU economy. The UK economy is
services led and the majority of this is internally generated. We have no way of knowing the outcome of the referendum so it is
prudent to proceed with caution whilst clarity on this very important issue emerges. STB enters this uncertain period with very
significant capital reserves, a short duration loan book and a broadly matched funding profile that minimises liquidity risks. We
believe we are very well placed to navigate any uncertainty that may arise from the referendum and are constantly monitoring
developments.
Our working assumption is that matters will settle down quite quickly after the referendum because that will be in the best interests
of all concerned. This will allow us to continue to progress our strategy with certainty. We will continue to prioritise the growth of our
Retail Point of Sale and Motor propositions in the Consumer Finance sector whilst tempering our appetite for unsecured personal
loans. As stated above this is an area we feel is showing signs of overheating with some lenders now offering unsecured loans at
cheaper margins than some secured mortgage lending. That does not feel sustainable to us. We believe we have a very strong
proposition in Retail Finance and see considerable scope to further increase the number of retailers we work with. During 2015 we
wrote a limited volume of prime Motor Finance business in order to assess the attractiveness of this sector of the market. The initial
indications are positive. We intend to write higher volumes of prime Motor Finance going forward. As most of the prime dealers
commit to financing partnerships in Q4 each year, whilst we will write more prime Motor Finance in 2016, there will not be a step
change in volumes until 2017, assuming the market dynamics remain broadly stable.
The diversification into SME lending has proved successful thus far. As at 31 December 2015 SME customer lending balances
stood at £468.0m representing 44% of the total lending book. In their first full year of operation Real Estate Finance and Asset
Finance traded well and in aggregate provided a material profit contribution. Invoice Finance, as expected, incurred losses as it
scales and builds up critical mass. We expect Invoice Finance to turn profitable this summer.
We see plenty of opportunity to expand our SME activities further in the coming years. Demand for asset finance to fund business
investment and demand for invoice finance to help fund working capital cycles is strong. This is likely to remain the case given the
ongoing growth of the UK economy. In Real Estate Finance, the residential investment assets have performed well reflecting strong
demand for rental properties. Our lending here is not regulated mortgages and we do not expect to be directly impacted by the BTL

Chief Executive’s statement
SECURE TRUST BANK PLC 19
taxation changes announced in 2015. On the residential development side, those units being built which are nearing completion
have been selling faster and for higher prices than anticipated when the loans were granted. The Government has reiterated its
commitment to doubling the rate of house building in the UK. Mortgage finance is readily available and with the economy continuing
to grow and interest rates remaining low, consumers are able to obtain and service mortgages. These are clearly positive
dynamics. However, in the short term whilst we wait for the impacts of the BTL changes on the housing market to become clearer
and given the potential uncertainties arising from the UK EU referendum we have tempered our residential development lending
appetite.
Our longer term ambition remains to grow a broad based portfolio, balanced across consumer finance, SME finance and residential
mortgage lending. During 2015 we have recruited a number of key personnel to develop our mortgage proposition. We will not be
competing in the mass market low LTV low margin products dominated by the High Street banks. Instead our focus will be on
specialist lending where we expect to compete against other challenger banks that are generating attractive returns from their
mortgage lending. As we develop our proposition here we are mindful of the Basel Committee proposals in respect of standardised
capital methodologies and the recent BTL taxation and stamp duty changes. We anticipate entering the mortgage market in the
second half of 2016 and will provide a further update in due course.
We see a constant flow of M&A opportunities and give serious consideration to a number of these. Given the significant capital
surpluses at our disposal we have an appetite to potentially acquire businesses that would enhance the growth of our consumer
and SME lending activities. Shareholders know that we will continue to exercise discipline, caution and prudence when assessing
M&A opportunities and remain extremely focused on ensuring such activity is in the long term interests of shareholders, staff and
customers.
Current trading and outlook
There has been no material change to the underlying performance of the business in the early months of 2016. We continue to see
potential to grow our lending portfolio in line with our ambition and have a clear growth strategy and a pipeline of organic and
external new business opportunities.
I am optimistic that the increasingly vocal support for a more proportionate approach to regulation from a wide range of parties
including the Treasury Select Committee, the Competition and Markets Authority, The Bank of England and latterly the European
Banking Authority, will result in tangible changes to make it possible for smaller banks to compete more effectively with the
dominant incumbents across a broader range of products. I am continuing to lobby extensively for the creation of a truly level
competitive playing field as I firmly believe it is in best interests of UK consumers and SMEs to have a much greater choice and
less concentration in the UK banking market.
As ever STB will seek to maximise the value of any opportunities that may arise. Whilst the pace of the UK economic recovery has
slowed the economy continues to expand. Low inflation and a strong jobs market are sustaining high levels of consumer
confidence, which should benefit our Motor and Retail Finance businesses. The UK continues to have a chronic shortage of
housing and notwithstanding the short term uncertainties arising from taxation changes in the BTL market; fundamental supply and
demand factors will further drive the need for an increase in the UK's housing stock. We expect consumer and business confidence
and demand for credit from businesses to moderate ahead of the EU referendum before recovering thereafter. So whilst we are
adopting a more cautious stance ahead of the referendum, we believe that our business model, coupled with significantly increased
capital resources, is extremely well positioned to make further positive progress during 2016.
Paul Lynam Chief Executive Officer
16 March 2016

Strategic report - Business review
SECURE TRUST BANK PLC 20
This section of the Report and Accounts contains the Strategic Report required by the Companies Act 2006 to be prepared by the directors of the Bank. It describes the component parts of the Group’s business; the principal risks and uncertainties; the development and performance of the business during the financial year; and the position of the business at the end of the year. Financial and other key performance indicators are used where appropriate. Reference is made to and additional explanations provided about amounts that are included in the Group’s Accounts.
Business finance Real Estate Finance
Revenue and lending performance vs prior years
Real Estate Finance lending revenue 2015 £20.3 million 2014 £2.4 million 2013 £0.1 million Real Estate Finance lending balance at 31 December 2015 £368.0 million 2014 £133.8 million 2013 £1.8 million 2015 performance
The Real Estate Finance business continued to show significant growth during 2015, increasing its book by 175% to £368m which led to an eightfold increase in revenue in the year. This reflected the strong pipeline of business brought in from 2014, coupled with the impact of increasing our complement of experienced Real Estate professionals and broadening the geographical profile beyond the South East. The business continues to focus primarily on residential property, with the book being evenly split between investment and development deals. Credit Performance has also been encouraging, with no losses arising so far. In addition, we have also seen a number of residential development deals written in 2014 reaching a successful conclusion and being repaid ahead of expectations. Looking forward
The current book provides a base for further growth in revenues in 2016, and the business retains a strong appetite for well-structured transactions, but without stretching its agreed risk positions. Market conditions are kept under close scrutiny to ensure we can respond quickly to any changes that may occur.

Strategic report - Business review
SECURE TRUST BANK PLC 21
Business finance Asset Finance
Revenue and lending performance vs prior years
Asset Finance lending revenue 2015 £2.4 million 2014 £nil 2013 £nil
Asset Finance lending balance
at 31 December 2015 £70.7 million 2014 £4.5 million 2013 £nil
2015 performance
The Asset Finance business has been in place for the whole of 2015, compared to just one month in 2014. Overall gross new
lending was £72.8m in 2015, exceeding the target set for the business for the year. The overall yield from this new business was in
line with target, contributing to the revenue growing to £2.4m in the year. Credit performance has been encouraging with no losses
recorded to date.
Looking forward
The focus will remain in building the book in partnership with Haydock Finance, whilst maintaining excellent service levels and
credit quality. We will continue to investigate products that complement the current profile, provided they are within our risk appetite
and meet return requirements.

Strategic report - Business review
SECURE TRUST BANK PLC 22
Business finance Commercial Finance
Revenue and lending performance vs prior years
Commercial Finance lending revenue 2015 £1.6 million 2014 £0.1 million 2013 £nil
Commercial Finance lending balance
at 31 December 2015 £29.3 million 2014 £5.0 million 2013 £nil
2015 performance
The end of 2015 sees the first full 12 month trading period for the Commercial Finance business and we are already in the top 20
providers of Asset Based Lending facilities in the UK, with facilities agreed in excess of £55m. This progress has been underpinned
by a growing reputation for flexibility but above all else, for having a customer centric approach. We have handpicked a team of
twenty people and whilst the Head Office is domiciled in Manchester we have both origination and client servicing capability across
the UK. Credit performance has been encouraging with no losses recorded to date.
Looking forward
It has been a key strategic objective to foster strong relationships with the professional community and specifically those involved in
the Private Equity market. This has enabled us to build the portfolio with a range of tailored lending solutions which are genuinely
solution led. New technology will increasingly allow us to enhance the client experience and at the same time ensure that we have
a fully compliant process.

Strategic report - Business review
SECURE TRUST BANK PLC 23
Consumer finance Personal Lending Revenue and lending performance vs prior years
Personal Lending revenue 2015 £57.9 million 2014 £49.4 million 2013 £41.8 million
Personal Lending balance at 31 December 2015 £188.6 million 2014 £181.4 million 2013 £159.2 million 2015 performance
The Group’s lending operations continued to grow in a controlled way, with new personal lending volumes in the year, including Everyday Loans, increasing to £135.9 million from £127.7 million in the previous year, an increase of 6%. This generated an increase in personal lending balances during the year, which at the year end, including Everyday Loans, totalled £188.6 million (December 2014: £181.4 million). The growth in Group personal lending new business volumes has again not been at the expense of price or quality. Income from personal lending increased by 5% to £57.9 million whilst impairment losses were £12.3 million compared to £9.9 million in 2014. In November 2015, the Group agreed to the conditional sale of ELG to Non Standard Finance Plc for an expected post tax profit of approximately £115 million. At the year end, lending balances in the continuing operation under the Moneyway brand were £74.3 million (2014: £87.5 million) and income during the year increased by 14% to £17.2 million. Impairment losses were £4.8 million compared to £3.3 million in 2014. The levels of credit impairments on all portfolios have been below the levels priced for when the loans were originated. The credit risks in the lending book are continually scrutinised with this data being used to inform changes in risk appetites and pricing. Looking forward
Following the conditional sale of ELG, the Group will continue to provide personal loans under its Moneyway brand through its
existing network of experienced UK based advisors.
Strategic report - Business review
SECURE TRUST BANK PLC 24
Consumer finance Motor Finance Lending performance v prior years
Motor Finance lending revenue 2015 £33.3 million 2014 27.2 million 2013 £23.0 million Motor Finance lending balance at 31 December 2015 £165.7 million 2014 £137.9 million 2013 £114.7 million 2015 performance
New business volumes for motor lending increased from £71.4 million to £85.7m, an increase of 20% year on year. This generated a significant increase in lending assets during the year. Income has increased by 22% to £33.3 million. 2015 growth has been achieved through a combined focus on widening the lending parameters and criteria of our product as well as restructuring our offer to create a wholly transparent product for consumers based around fixed rates and the removal of all fees with the exception of a £10.00 option to purchase fee at the end of the agreement. This approach supported our growth and contributed to Moneyway receiving the prestigious awards in the industry for subprime lender of the year (Motor Finance Awards) and Treating Customers Fairly (F and I Awards). Moneyway has also continued to establish strong relationships with all our customers whilst promoting our brand. 2015 saw an increase in the sales headcount from 7 to11 with a wider geographical coverage than ever before. Impairment losses for the year increased from £3.9 million to £7.3 million. This reflects the continued growth and maturity of the loan book, and refinement of the provisioning methodology, as the Bank moves closer to IFRS 9 implementation. Looking Forward
Into 2016 Moneyway will complete the launch of the prime product across all our introducer channels to complement our non-prime products providing introducers with a true “one stop shop” solution and a product for every customer. Operational processes will continue to evolve by introducing enhanced technology to provide a prime service across the entire risk curve. Our “one stop shop approach” will create a true point of difference in the market as we will operate across a wider reach of the risk curve. This will enable us to offer a product for every customer and our intermediaries a first string solution that we could not offer before. This strategy is designed to enable us to widen our reach of supporting dealers and intermediaries and will be our primary strategy towards achieving further growth. One stop shop will continue to be supported by exceptional operational service using technology to enable us to offer a prime service across the entire risk curve within which we operate.
Strategic report - Business review
SECURE TRUST BANK PLC 25
Consumer finance Retail Finance Revenue and lending performance vs prior years
Retail Finance revenue 2015 £24.2 million 2014 £13.6 million 2013 £8.3 million
Retail Finance balance at 31 December 2015 £220.4 million 2014 £116.7 million 2013 £70.1 million 2015 performance
The three largest sub-markets for retail finance are the provision of finance for the purchase of sports and leisure equipment (including cycles), furniture and consumer electronics. Cycle finance has seen positive new business levels influenced by the success of British cyclists in the Tour de France, the Olympics and Paralympics. The Retail Finance business has continued to grow strongly, with new lending volumes increasing to £293.9 million (an increase of 90% on the previous year). Each of the core business sectors (sports and leisure, furniture and consumer electronics) have contributed towards this growth which has been achieved through a combination of gaining increased market share and sector growth (as seen in the cycle market). This growth has generated a significant increase in lending assets during the year, which at the year end totalled £220.4 million (December 2015: £116.7 million). Income from retail lending increased by 78% to £24.2 million. Impairment losses were well controlled at £5.2 million in 2015. Looking forward
The Group plans continued growth in Retail Finance during 2016 with the focus on acquiring increased market share within its existing target markets. A number of initiatives are underway to further enhance systems capabilities to ensure that quality of service to both retailers and customers is maintained as the business continues to expand. To further support the maintenance of service levels the business intends to continue the expansion of its workforce whilst investing in additional office and support facilities.

Strategic report - Business review
SECURE TRUST BANK PLC 26
Savings
Savings balances vs prior years
Notice deposits 2015 £405 million 2014 £239 million 2013 £207 million
Deposit bonds 2015 £589 million 2014 £331 million 2013 £193 million Current/sight accounts 2015 £39 million 2014 £38 million 2013 £36 million 2015 performance
The Bank’s customer deposits primarily comprise notice deposits, term deposits and fee-based accounts, being fee-based current accounts and OneBill accounts. At 31 December 2015 customer deposits totalled £1,033 million. This represents an increase of £425 million since the last year end. The Bank’s notice deposits totalled £405 million at the year end (December 2014: £239 million). New 120 day notice accounts were introduced during the year and were successful, raising additional new deposits of £95 million predominantly during the second half of the year. During the year, the Bank launched further fixed rate deposit bonds, with one to seven year maturities which enable it to match broadly the new lending activities. These again were very successful as the Group raised new deposits of over £333 million, achieving its desired funding maturity profile. At the year end term deposit bond balances totalled £589 million.

Strategic report - Financial review
SECURE TRUST BANK PLC 27
Summarised income statement 2015 2015 2015 2014 2014 2014
Continuing operations
Discontinued operations
Total Continuing operations
Discontinued operations
Total
Income statement £million £million £million £million £million £million
Interest, fee and commission income 117.4 40.7 158.1 79.5 34.3 113.8
Interest, fee and commission expense (25.3) (0.3) (25.6) (15.8) (0.1) (15.9)
Operating income 92.1 40.4 132.5 63.7 34.2 97.9
Impairment losses (16.8) (7.5) (24.3) (8.7) (6.6) (15.3)
Operating expenses (50.5) (21.2) (71.7) (37.5) (19.0) (56.5)
Profit before tax 24.8 11.7 36.5 17.5 8.6 26.1
Costs of acquisition - - - 0.2 - 0.2
Fair value amortisation 0.9 0.9 1.8 4.4 0.9 5.3
Share based incentive scheme 0.7 - 0.7 1.5 - 1.5
Net ABG management recharges 0.3 - 0.3 0.2 - 0.2
Underlying adjustments to profit 1.9 0.9 2.8 6.3 0.9 7.2
Underlying profit before tax 26.7 12.6 39.3 23.8 9.5 33.3
Tax (5.5) (2.3) (7.8) (3.6) (2.0) (5.6)
Tax on underlying adjustments (0.4) (0.1) (0.5) (1.4) (0.2) (1.6)
Underlying tax (5.9) (2.4) (8.3) (5.0) (2.2) (7.2)
Profit after tax 19.3 9.4 28.7 13.9 6.6 20.5
Underlying adjustments after tax 1.5 0.8 2.3 4.9 0.7 5.6
Underlying profit after tax 20.8 10.2 31.0 18.8 7.3 26.1
Underlying basic earnings per share
(pence) 114.3 56.1 170.4 112.3 43.5 155.8
Income analysis
Operating income increased by 35% to £132.5 million. Growth was achieved through increased levels of activity in all lending
sectors. At £903 million, new lending volumes increased in total by £362 million representing an increase of 67% on 2014. New
lending volumes in Real Estate Finance, Asset Finance and Commercial Finance increased by £230 million and, Personal Lending,
Motor Finance and Retail Finance businesses increased in total by £162 million, representing increases of 164% and 46%
respectively on 2014.
Real Estate Finance income increased by 712% to £20.3 million during the year with Asset Finance and Commercial Finance
businesses generating income of £2.4 million and £1.6 million respectively in their first full year of trading. Income from Retail
Finance under the V12 brand increased by 78% to £24.2m, through maintaining a strong position in existing retail markets whilst
establishing new relationships in the home furnishing and leisure sectors. Motor Finance income increased by 22% to £33.3 million
as the Bank increased its activities in prime lending. The Bank intends to create further diversified and balanced growth in its
lending portfolios during 2016.
Income from the current account with a prepaid card declined in 2015 following the Bank’s decision to close the product to new
accounts during 2015. The decline in income from the OneBill product following its closure to new accounts in 2009 continued as
expected.
Impairment losses during the year were £24.3 million (2014: £15.3 million). This increase is broadly in line with overall growth in
consumer lending balances and is also partly driven by a refinement in provisioning methodology as the Bank moves closer to
IFRS9 implementation in the Motor and Personal Lending portfolios.

Strategic report - Financial review
SECURE TRUST BANK PLC 28
Operating expenses have increased, in line with expectations, as significant investments have been made in the infrastructure and
human capital of the Group to achieve our growth targets within the Group’s risk appetite. This investment will continue to generate
further returns in the future.
Underlying profit before tax was £39.3 million, which is an increase of 18% on 2014. Underlying profit removes the effects from the
income statement of acquisition costs, fair value amortisation arising from acquisitions, share option scheme costs and net ABG
management recharges.
The key financial and operational indicators of the Group are shown on page 11.
Taxation
The effective underlying tax rate is 21.1% (2014: 21.5%), which is broadly in line with the weighted average corporate tax rate
during the year. The prior year’s tax rate reflected the effects of acquisition adjustments relating to deferred tax. The Bank’s
effective tax rate will increase in 2016 as a result of the new Bank Corporation tax surcharge of 8%, which is effective from 1
January 2016.
Distributions to shareholders
The directors recommend the payment of a final dividend of 55 pence per share which, together with the interim dividend of 17
pence per share paid on 18 September 2015, represents a total dividend for the year of 72 pence per share (2014: 68 pence per
share).
The Board is also proposing to pay a special dividend of 165 pence per share for 2016. The dividend is dependent on the completion of the sale of ELG, which includes regulatory approval of the change of control, transferral of ownership and the inclusion of the gain within the Company’s capital resources. Following completion, the Board would also review the financial position and prospects of the Company further before declaring any such special dividend.
Earnings per share
Detailed disclosures of earnings per ordinary share are shown in Note 11 to the financial statements. Basic earnings per share
increased by 29% to 157.8 pence per share (2014: 122.3p), whilst the underlying basic earnings per share increased by 9% to
170.4 pence per share (2014: 155.8p per share).
Summarised balance sheet
2015 2015 2015 2014
Continuing operations
Discontinued operations
Total Total
£million £million £million £million
Assets
Cash and balances at central banks 131.8 - 131.8 81.2
Debt securities held-to-maturity 3.8 - 3.8 16.3
Loans and advances to banks 9.8 1.7 11.5 39.8
Loans and advances to customers 960.6 114.3 1,074.9 622.5
Other assets 22.9 2.5 25.4 22.5
1,128.9 118.5 1,247.4 782.3
Liabilities
Due to banks 35.0 - 35.0 15.9
Deposits from customers 1,033.1 - 1,033.1 608.4
Other liabilities 29.4 8.7 38.1 33.1
1,097.5 8.7 1,106.2 657.4
The total assets of the Group increased by 59% to £1,247.4 million reflecting the continued growth in both Business and Consumer
lending. Real Estate Finance lending balances increased by 175% to £368.0 million at the year-end after just 2 years of lending.

Strategic report - Financial review
SECURE TRUST BANK PLC 29
Asset Finance lending balances increased from £4.5 million to £70.7 million and Commercial Finance from £5.0 million to £29.3
million in their first full year. During the year the Retail Finance business increased lending balances by 89% to close at £220.4
million, as the Group continues to profit from the synergistic benefits of aligning its Retail Finance businesses under the V12 brand.
Motor Finance increased its portfolio size by 20% to £165.7 million through continued growth in the number of dealer relationships
and through developing its prime lending offering. Everyday Lending Group personal lending balances increased by 22% during the
year prior to its divestment (subject to FCA approval) from the group.
Customer deposits grew by 70% during the year to close at £1,033.1 million, to fund the increased lending balances. The Group
also held £35.0 million of wholesale deposits at the year-end, following the sale and repurchase of FLS Treasury Bills.
Funding for Lending Scheme
In 2013 the Bank was admitted to the Funding for Lending Scheme (FLS). The FLS is a scheme launched by the Bank of England
and HM Treasury, designed initially to incentivise banks and building societies to boost their lending to UK households and SME’s.
The FLS does this by facilitating funding to banks and building societies for an extended period, at below current market rates, with
both the price and quantity of funding provided linked to the institution’s performance in lending to the SME sector.

Strategic report – Principal risks and uncertainties
SECURE TRUST BANK PLC 30
The monitoring and control of risks is a fundamental part of the management process. The Board considers that the principal risks
inherent in the Group’s business are credit, market, liquidity, operational, capital, conduct and regulatory risks. A description of the
risk management policies in these areas is set out in Note 5 to the financial statements.
A short description of the principal risks, the ways in which the Group’s management seek to manage these risks and some
examples of developments that took place in 2015 are set out below.
Risk appetite
The risk appetite statements below have been approved by the Board:
Profitability
We are profit and growth oriented whilst seeking to maintain a conservative and controlled risk profile. The Bank manages credit
risk through a pricing for risk model which drives a potential return on equity in excess of 20% on aggregate.
Financial Strength
Our financial strength is safeguarded by a strong capital base and a prudent approach to liquidity management. Capital levels will
not fall below the Individual Capital Guidance (“ICG”) requirements.
Liquidity is maintained at a level above the Overall Liquidity Adequacy Requirement (see ‘Liquidity risk’ below) with all loans funded
typically by retail deposits.
Conduct with Customers & Reputation
As a result of the way we conduct our business we seek to avoid negative outcomes by consistently treating our customers fairly.
We are straightforward and fair with our customers and seek to achieve excellent customer service standards. Our aim is to be
seen as a sound and professional business in the marketplace. We have no appetite for reputational risk arising from the way in
which we or our partners behave.
We seek to remain compliant with all relevant regulatory requirements.
Business Processes and Our People
Our appetite for operational risk is to have well defined, scalable and controlled processes, running on robust and resilient systems,
effective delivery of change and business continuity management.
We do not tolerate operational losses above our pillar 1 capital requirement.
Risk appetite measures
The Board Risk Committee uses a set of measures to assess the Group’s position against its risk appetite. These measures are
also cascaded to individual business units for monitoring and reporting purposes. The key measures are set out in the relevant
sections below.
Credit risk
Credit risk is the risk that a counterparty will be unable to pay amounts in full, when due. Counterparties include the consumers to
whom the Group lends unsecured and the small and medium sized enterprises to whom the Group lends secured as well as the
market counterparties with whom the Group deals.
This risk is managed through the Group’s internal controls and credit risk policies. The risk is monitored by the Credit Risk
Committee, with oversight provided by the Board Risk Committee. Larger exposures are also approved by the Arbuthnot Banking
Group Risk Committee.

Strategic report – Principal risks and uncertainties
SECURE TRUST BANK PLC 31
For STB, credit risk arises principally from its lending activities. Details of exposures, concentration risk, allowances for impairment
and arrears are given in Notes 5, 13 and 14. At the year-end, 94% of loans and advances to customers by value were neither past
due nor impaired, compared with 89% at 31 December 2014.
Credit risk also arises in respect of the Group’s loans and advances to banks, and counterparty risk is monitored using the ratings
of the respective counterparties. Further details are given in Notes 5 and 12.
Across the different product markets in which the Group operates, credit risk management oversee the application of the Group ’s
risk related policies and consider the impact of market changes and business opportunities. At the end of the financial year the
Group was within risk appetite across a range of measures covering bad debt rates, concentration risk and automated credit
decisioning.
Key developments during 2015 in the credit risk management of the consumer and commercial business areas of the Group are
described below.
Consumer credit risk
In 2015, the Group commissioned a market leading risk consultancy to review its near prime Motor Finance credit risk
management. This work will result in more appropriate risk based pricing.
The Group has also developed its methodology for its unsecured personal loan businesses. These changes are expected to deliver
more accurate credit risk assessment and improved risk based pricing, whilst maintaining credit quality.
Retail Finance has seen considerable growth from both existing retailers and new additions to the retail panel. The addition of new
retailers, coupled with significant growth from existing introducers and buoyant consumer confidence resulted in significant year on
year growth. This growth has been managed through the existing scorecard and rule set without compromising credit quality. The
performance of all the consumer portfolios continue to be monitored closely through monthly Credit Committee governance
meetings which review scorecard and rule performance and new application quality and delinquency trends.
Commercial credit risk
The growth in lending to the SME sector has been built around strong risk management practices. The Group has employed
experienced bankers who have operated through both positive and challenging economic cycles, and have brought their
experience to bear alongside the application of robust risk governance, credit appetite and lending policies.
For Real Estate Finance and Commercial Finance, lending decisions are made on an individual transaction basis, using expert
judgement and assessment against criteria set out in the lending policies. Asset Finance lending is outsourced to Haydock
Finance, who operate in line with the Group’s credit policies and risk appetite. Secure Trust Bank employees based in Haydock’s
premises assess this lending for compliance with policy. A programme to develop probability of default (PD) modelling for each of
the SME businesses commenced in 2015 and is expected to be delivered in the second half of 2016. These models will be IFRS 9
compliant.
With the SME businesses in the early stage of their growth, impairments and arrears have been minimal to date. Of particular note
is the positive performance of the Real Estate Finance book, where property developments financed have seen repayments
achieved both ahead of time and above expected valuations, in part assisted by the positive housing market throughout 2015.
Management continue to closely monitor the SME portfolios and the external events and environment that could impact on each of
them.
Future development – implementation of IFRS 9
The new accounting standard governing the impairment of financial assets, IFRS 9, is effective for annual reporting periods
beginning on or after 1 January 2018. The standard fundamentally changes the calculation and recognition of credit losses, by
introducing the requirement to base impairment provisions on expected credit losses over the life of the financial asset. It also
requires credit losses to be recognised for all loans, in contrast to the current standard (IAS 39) which requires recognition of losses
only when there is evidence of impairment. The models used to calculate expected credit losses need to include forward looking
factors including macro-economic variables.

Strategic report – Principal risks and uncertainties
SECURE TRUST BANK PLC 32
The key differences between the two approaches are:
Status of loan Current standard (IAS 39) New standard (IFRS 9, effective from 1
January 2018)
No evidence of specific impairment No specific impairment charge, but
assessed at portfolio level for collective
impairment
Charge for expected credit loss applied
for all loans, based on probability of
default over a 12 month period
Evidence of significant increase in credit
risk, but not impaired
No specific impairment charge, but
assessed at portfolio level for collective
impairment
Charge for expected credit loss applied,
based on lifetime probability of default
Impaired Specific impairment charge applied,
equating to lifetime credit losses
Charge for expected credit loss applied,
based on lifetime probability of default
The Group has initiated a project to develop and implement the modelling, data, processes, systems and disclosures required to
comply with IFRS 9. The Group intends to run the provision modelling and accounting processes over the course of 2017 to assess
the impact of the standard.
Market risk
Market risk is the risk that the value of, or revenue generated from, the Group’s assets and liabilities is impacted as a result of
market movements. For Secure Trust Bank Group this is primarily limited to interest rate risk.
This is managed by the STB treasury function and overseen by the Board Assets and Liabilities Committee (ALCO). The policy is
not to take significant unmatched own account positions in any market. The key measure used to monitor the risk is the Interest
Rate Risk Sensitivity Gap, information about which is provided in Note 5. The Group was within its appetite for this risk at the year-
end.
The principal currency in which the Bank operates is Sterling, although a small number of transactions are completed in US Dollars
and Euro in the Commercial Finance business. All such currency exposures are fully hedged using short term swaps of no more
than 30 days in length, which ensures that the Group and the Bank have no exposures to currency fluctuations.
Liquidity risk
Liquidity risk is the risk that the Group cannot meet its liabilities as they fall due, due to insufficient liquid assets.
The Group takes a conservative approach to managing its liquidity profile, by closely monitoring and remaining within risk appetite
limits, and holding high quality liquid assets; primarily UK Treasury Bills and the Bank of England Reserve Account. The Group is
primarily funded by retail customer deposits, having limited exposure to the wholesale lending markets. ALCO oversees liquidity
risk and monitors the activities of management in managing liquidity risk. ALCO meets monthly to review liquidity risk against set
thresholds and risk indicators including early warning indicators, liquidity risk tolerance levels and Individual Liquidity Adequacy
Assessment Process (ILAAP) metrics as described below.
The primary measures used by management to assess the adequacy of liquidity are the Overall Liquidity Adequacy Requirement
(OLAR), which is the Board’s own view of the Group’s liquidity needs as set out in the ILAAP, and the regulatory requirement to
meet the Liquidity Coverage Ratio (LCR). The Group has maintained liquidity in excess of the OLAR throughout 2015.
The LCR regime has applied to the Group from 1 October 2015, requiring management of net 30 day cash outflows as a proportion
of high quality liquid assets. STB has set a more prudent internal limit. The actual LCR has significantly exceeded both limits
throughout the year.
ALCO also uses the funding to loan ratio to assess liquidity adequacy, against a minimum target. The ratio exceeded this minimum
target throughout the year.
Strategic report – Principal risks and uncertainties
SECURE TRUST BANK PLC 33
Operational risk
Operational risk is the risk that the Group may be exposed to financial losses from inadequate or failed internal processes, people
and systems or from external events.
The Group has a defined set of Operational Risk Appetite measures covering such matters as operational losses, IT resilience, information security, complaints and more generally the level of operational risks the Group is prepared to accept. These appetite measures are cascaded to individual business units which monitor and track their level of risks within their local governance forums. In 2015, the Group invested in resource, expertise and systems to support the development of its operational risk capabilities. A formal Operational Risk Management System is being introduced along with an enhanced Operational Risk Framework covering all the key principles for the sound management of Operational Risk as defined by the Basel Committee. Key areas of focus in 2015 have been:
Developing and clearly defining the governance structure and procedures over how key business decisions are made and
operational risks are managed, controlled and escalated within the business;
Developing our systems and controls over the management of our third party suppliers and how the services they support
are maintained, secured and improved;
Enhancing our IT systems so that they are resilient in order to continue to provide the service expectations of our
customers;
Developing our Business Continuity Plans so that they are robust and responsive to a range of potential internal and
external issues the Group could face;
Managing change effectively and ensuring any new developments meet the high standards set for our customers and the
services we provide.
In 2016 we will continue to monitor the effectiveness of our controls and respond to new and emerging threats to the business.
Cyber risk
There is an increased risk that the Group is subject to cyber risk within its operational processes. This is the risk that the businesses within the Group are subject to some form of disruption arising from an interruption to its IT and data infrastructure. The Group continues to improve its defences against cyber risk through the use of enhanced monitoring and response tools and procedures.
Capital risk
Capital risk is the risk that the Group will have insufficient capital resources to support the business.
The Group adopts a conservative approach to managing its capital and at least annually assesses the robustness of the capital
requirements as part of the Group’s Individual Capital Adequacy Process (ICAAP), which is then aggregated into the Arbuthnot
Banking Group’s ICAAP. Stringent stress tests are performed to ensure that capital resources are adequate over a future three
year horizon.
At the year-end, the Common Equity Tier 1 (CET1) Ratio was 13.6% (2014: 18.7%) and the Leverage Ratio was 10.4% (2014:
14.7%) on a solo-consolidated basis. Both ratios are significantly higher than regulatory requirements. The decreases in the ratios
are driven by the growth in assets, and therefore total risk exposure, over the year. The solo-consolidated capital resources
increased slightly to £138.9m at 31 December 2015 (31 December 2014: £123.4m).
The conditional sale of ELG is expected to significantly increase the Group’s capital ratios, providing a very strong capital base and
enabling further growth of lending portfolios. In assessing the Group’s future capital position, management is mindful of the Basel
Committee proposals relating to standardised risk weighting and is watching developments closely. Further details of the Group’s
capital position are provided in the capital, leverage and liquidity section of the Strategic Report.
Conduct risk
Conduct risk reflects the potential for customers (and the business) to suffer financial loss or other detriment through the actions
and decisions made by the business and its staff.

Strategic report – Principal risks and uncertainties
SECURE TRUST BANK PLC 34
We define conduct risk as the risk that STB’s products / services, and the way they are delivered, result in poor outcomes for
customers or markets in which we operate, or harm to STB. This could be as a direct result of poor or inappropriate execution of
our business activities or behaviour from our staff.
The Group takes a principles based approach and includes retail and commercial customers in its definition of ‘customer’, which
covers all business units and both regulated and unregulated activities.
In 2015, management embedded a Conduct Risk Management Framework in the business. This is a set of activities establishing
the governance and oversight protocols, providing training and awareness on the Conduct Risk Policy, and enhancing and
developing relevant key risk indicators (KRIs). Conduct risk exposure is managed via monthly review and challenge of KRIs at the
Customer Focus Committee, which was set up to oversee complaints, FEEFO and Customer Service Excellence (CSE) as well as
conduct risk. Conduct risk management information is also reviewed at Executive Committee meetings at product level, at STB
ExCo and STB Board. The KRIs vary across the business units to reflect the relevant conduct risks. The business units’ KRIs are
aggregated for measurement against the Group’s risk appetite.
Senior Managers Regime
A new regime, to enhance the accountability of individuals operating in banks, insurers and PRA-authorised investment firms, was
implemented in the Financial Services (Banking Reform) Act 2013 and commenced from 7 March 2016. This regime was proposed
in the Parliamentary Commission on Banking Standards Report (June 2013) and replaced the Approved Persons regime.
The new requirements introduce conduct rules which apply to all bank employees and additional rules for senior management. A
specific Senior Manager Regime applies to the Bank’s Board members and certain executive and senior managers, requiring these
individuals to have regulatory approval, specific prescribed responsibilities and ongoing assessment by the Bank to ensure these
persons remain “fit and proper”. A further Certification Regime applies to other employees who pose a “risk of significant harm” to
the firm, requiring the fit and proper test to be applied before the individual commences the role and then on an ongoing basis.
The Bank has embraced the new regime and made the changes required to comply. Senior Manager functions have been mapped
across, responsibilities allocated and job descriptions amended where required. Training has been delivered across the Bank and
an annual certification framework put in place. Changes to governance arrangements that have resulted from the change in regime
are set out in the Corporate Governance statement beginning on page 46. Secure Trust Bank submitted its application for the
“grandfathering application” on 2 February 2016, setting out responsibilities for existing Approved Persons who migrated to their
equivalent Senior Management Functions on 7 March 2016.
Regulatory Risk
Regulatory risk is the risk that the Group fails to be compliant with all relevant regulatory requirements. This could occur if the
Group failed to interpret, implement and embed processes and systems to address regulatory requirements, emerging risks, key
focus areas and initiatives or deal properly with new laws and regulations.
The Group seeks to manage regulatory risks through the following elements of the Group wide risk management framework:
Governance and control processes for new products and services;
Advice and guidance on the application and interpretation of laws and regulations applicable to the Group’s products, new
initiatives and projects;
Investment in the infrastructure and ongoing enhancement of the regulatory training programme.
Additional training has been delivered for key focus areas in 2015 including:
Vulnerable customers and complaints handling;
Horizon scanning to identify regulatory developments which are managed through impact assessment and implementation
programmes;
Liaison with regulatory bodies regarding authorisations and permissions;
Information requests and reporting requirements;
Consumer Rights Act implementation;
Risk based monitoring and assurance programmes to ensure the Group remains compliant with regulatory requirements.

Strategic report – Capital, leverage and liquidity
SECURE TRUST BANK PLC 35
Capital
The Group’s capital management policy is focused on optimising shareholder value over the long-term. Processes exist to ensure
that capital is allocated to achieve targeted risk adjusted returns whilst ensuring appropriate surpluses are held above the minimum
regulatory requirements. The Board reviews the capital position at every Board meeting.
In accordance with the EU’s Capital Requirements Directive (CRD) and the required parameters set out in the EU’s Capital
Requirements Regulation (CRR), the Group’s Internal Capital Adequacy Assessment Process (ICAAP), which is aggregated into
the Arbuthnot Banking Group’s ICAAP, is embedded in the risk management framework of the Group. It is subject to ongoing
updates and revisions where necessary, but as a minimum an annual review is undertaken as part of the business planning
process. The ICAAP brings together the risk management framework, including stress testing using a range of scenarios, and the
financial disciplines of business planning and capital management.
Not all material risks can be mitigated by capital, but where capital is appropriate the Board has adopted a ‘Pillar I plus’ approach to
determine the level of capital the Group needs to hold. This method takes the Pillar I capital formula calculations as a starting point,
and then considers whether each of the calculations delivers a sufficient capital sum adequate to cover anticipated risks. Where it
is considered that the Pillar I calculations do not reflect the risk, an additional capital add-on in Pillar 2 is applied, as per the
Individual Capital Guidance (ICG) issued to the Bank by the PRA.
The Group’s regulatory capital is divided into:
Common Equity Tier 1 which comprises shareholders’ funds, after deducting intangible assets and deferred tax assets
which have arisen due to losses.
Tier 2 which comprises the collective allowance for impairment.
The ICAAP includes a summary of the capital required to mitigate the identified risks in its regulated entities and the amount of
capital that the Group has available. All regulated entities within the Group have complied during the financial year with all of the
externally imposed capital requirements to which they are subject.
The Group operates the standardised approach to credit risk, whereby risk weightings are applied to the Group’s on and off
balance sheet exposures. The weightings applied are those stipulated in the CRR.
The Group is required by the PRA to report its capital on a solo consolidated basis. The solo-consolidated group includes all
entities where a solo consolidation waiver has been received from the PRA; this excludes the V12 Finance Group and the Debt
Managers Group. At the year end the solo-consolidated group had the following capital resources and Total Risk Exposure (TRE).
In accordance with CRR, the TRE reflects both credit risks and operational risks.
2015 2014
£m £m
Capital
Common Equity Tier 1 (CET1) capital 135.8 121.4
Total Tier 2 capital 3.1 2.0
Total capital 138.9 123.4
Total Risk Exposure (TRE) 998.6 649.2
2015 2014
% %
CRD IV ratios
Common Equity Tier 1 (CET1) capital (solo consolidated) 13.6 18.7
Leverage ratio 10.4 14.7
The increase in CET1 capital has been driven by retained profit marginally offset by an increase in intangibles. An analysis of CET1
capital can be found in Note 6 to the financial statements.
Total Risk Exposure has increased by 54% to £998.6 million reflecting the significant growth in both Business Finance and
Consumer Lending.

Strategic report – Capital, leverage and liquidity
SECURE TRUST BANK PLC 36
The CET1 capital ratio is the ratio of CET1 divided by the TRE and was 13.6% at the year end. This compares to 18.7% at the end
of 2014 again reflecting the growth in lending resulting in an increase in TRE during 2015. The conditional sale of ELG is expected
to increase the CET1 capital ratio and provide additional capital for future planned growth.
Leverage
The Basel III framework introduced a relatively simple, transparent, non-risk based leverage ratio to act as a supplementary
measure to the risk-based capital requirements. The leverage ratio is intended to restrict the build-up of leverage in the banking
sector to avoid destabilising deleveraging processes that can damage the broader financial system and the economy, whilst
reinforcing the risk-based requirements with a complementary simple, non-risk based ‘backstop’ measure.
The Basel III leverage ratio is defined by the CRR as Tier 1 capital divided by on and off sheet asset exposure values, expressed
as a percentage. The minimum leverage ratio requirement of 4% will be imposed on the Bank from 2018, subject to a review in
2017.
As shown in the table above, the Bank has a leverage ratio at 31 December 2015 of 10.4%, comfortably ahead of the minimum
requirement.
Liquidity
The Group continues to manage its liquidity on a conservative basis by holding high quality liquid assets (HQLA) and utilising
predominantly retail funding from customer deposits, with only limited funding coming from the wholesale markets. In December
2012, Secure Trust Bank was admitted as a participant in the Bank of England’s Sterling Money Market Operations under the
Sterling Monetary Framework, to participate in the Discount Window Facility. From July 2013, the Group was permitted to draw
down facilities under the Funding for Lending Scheme (FLS). FLS monies are maintained as a liquidity buffer, above that required
to support lending.
At 31 December 2015 and throughout the year, the Group had significant surplus liquidity over the minimum requirements due to its
stock of HQLA, in the form of the Bank of England Reserve Account and Bank of England Treasury Bills. As shown in the table
below, total liquid assets increased by 20% to £147.1 million, with the HQLA balance of £135.6m representing a proportional
increase from 67% to 92% of total liquid assets.
2015 2014
£m £m
Liquid assets
Aaa - Aa3 135.6 82.5
A1 - A3 6.2 19.8
Unrated 5.3 20.0
147.1 122.3
Less assets held for sale (1.7) -
Statutory balance sheet total 145.4 122.3
The Group has no liquid asset exposures outside of the United Kingdom and no amounts that are either past due or impaired.
The Liquidity Coverage Ratio (LCR), introduced by the Basel Committee on Banking Supervision in 2013, applied to the Group
from 1 October 2015. The objective of the LCR is to promote the short term resilience of the liquidity risk profile of banks, by
ensuring that they have an adequate stock of unencumbered high-quality liquid assets that can be converted easily and
immediately in private markets into cash to meet their liquidity needs for a 30 calendar day liquidity stress scenario.
The PRA completed its consultation on the minimum LCR requirements to apply in the United Kingdom in 2015, and set levels
marginally higher than those prescribed in the CRR during the transition period. The PRA have set the minimum at 80% from 1
October 2015, 90% from 1 January 2017 and 100% from 1 January 2018, coming into line with the CRR at this point.
The Group’s LCR, and other measures used by management to manage liquidity risk, are described in the Principal Risks and
Uncertainties section of the Strategic Report.

Strategic report – Capital, leverage and liquidity
SECURE TRUST BANK PLC 37
By order of the Board Neeraj Kapur Chief Financial Officer
16 March 2016

Culture
SECURE TRUST BANK PLC 38
The culture of the Group has been aligned with the Group’s values, which are detailed on page 2. The Group aims for its
employees to be both customer and colleague centric, innovative and inspiring, whilst being compliant, safe and trustworthy.
We have invested in our Business Leadership Development Programme for all our people leaders and in cultural shaping and
embedding sessions for all employees. This is also extended to all new employees at their induction to the business. Business
Leadership centres on improving customer focused performance through the successful application of management tools and
employee engagement.
We are moving forward rapidly and recognise that our leadership team must develop its knowledge and apply new skills in order to
take a full and proactive role in our Grow, Sustain and Love Strategy.
Customer outcomes
Customer focus is at the heart of what the Group does and how our employees behave. Our products are consistently
straightforward in their design and aim to offer value to our customers. This has attracted a significant increase in customers to the
Bank, with overall customer numbers increasing during the year by more than 33% to 570,759 by the end of 2015.
Following an in-depth review and external assessment of the Group, we have retained the Customer Service Excellence standard.
This means that our customer service has been shown to meet Government standards of excellence, as benchmarked against
other high-performing organisations. The Customer Service Excellence standard tests areas that are most important for our
customers, such as delivery, timeliness, information, professionalism and staff attitude. It also tests whether the Bank understands
the needs of its customers and how satisfied they are with the service they receive. An independent external assessor carried out
on-site reviews to examine our documents, reports and research. During the final assessment the assessor met with customers,
partners and staff to ask about the services we provide, the partnerships we have and improvements that are being made.
Following the site visit, the assessor presented recommendations to a panel of judges. The assessor was particularly impressed
with our staff and commented about their professionalism, honesty and positivity about working here, as well as our customer
ethics.
The bank has also received various awards including Best Savings Provider, Best Challenger Bank and Best Charity Saving
Account Provider from Savings Champion, as well as other awards for our Motor Finance business and an industry award for
individual achievement.
The Bank utilises Feefo, which is an independent online review system, in order to obtain customer feedback on its consumer
facing products. The ratings and comments made by the customers who reply to the request are monitored by senior management
of the Bank. If there are any poor or bad ratings received, attempts are made to contact the customer, in order to resolve any
issues. Service improvement ideas received via Feefo from customers are also considered by the Bank. The ratings and comments
are available on the Group’s websites, www.securetrustbank.com and www.moneyway.co.uk.
Active partners for business
The Group continues to foster strong, mutually beneficial relationships, with stakeholders and business introducers. The underlying
philosophy is to make it as easy as possible for introducers to do business with us and to continually seek to improve the ways we
work together. This approach to relationships has contributed to the renewal of a number of contracts with key partners including
the Association of Cycle Traders and Evans Cycles. It is also a major factor in the gaining of substantial new business partnerships
including those with a number of high profile football clubs and Halfords. The move into SME finance has also allowed us to provide
more support to businesses in the UK.
Investors in People award
Secure Trust Bank currently holds the highly coveted Investors in People (IIP) Silver Accreditation. Only 5.7% of IIP accredited
organisations achieve Silver and we are extremely proud to be one of the prestigious few. The Investors in People Standard is a
framework of best practice, awarded to well-run organisations that meet set criteria in areas including learning and development
and leadership skills as well as recognition and reward. The review process involved numerous members of the Secure Trust Bank
team being picked at random for an interview with the assessor, in which they were asked about areas including how they felt
about the Bank, learning and development opportunities and business strategy. The assessment saw the motivation and
enthusiasm of the team shine through, acknowledging that the strategy and values of the Bank have been effectively embedded
throughout all operations. Other areas for acknowledgement included the strong focus on the development of leadership and
management capabilities, the range of means by which employees are asked for their views and opinions on key matters, and

Culture
SECURE TRUST BANK PLC 39
strong and our impressive record of delivering effective learning, training and development opportunities and the open, transparent
and trusting culture of the business.
Employee support
The success enjoyed by the Group is also creating numerous opportunities for our staff as evidenced by average Group full time
equivalent employee numbers increasing from 608 to 706 during 2015. Each new employee gets a structured induction and
development framework, whilst all employees have clear performance objectives aligned to the Group’s strategy and values.
Financial support and study time allowances are also helping more than a quarter of Secure Trust Bank’s employees to take
academic qualifications ranging from apprenticeships to Masters Degrees. The majority of promotions continue to go to internal
staff which evidences the opportunities within the Group. As the size of the Group increases these opportunities will further expand.
Secure Trust Bank celebrates exceptional performance by awarding monthly Customer Service Excellence Awards and Be Valued
Awards, of which over 679 had been given to staff during the year. Individuals are also recognised through the annual ‘Outstanding
Achievers’ award.
On a quarterly basis, the Chief Executive Officer reviews employee suggestions for improving performance, efficiency and
effectiveness, and awards a cash prize for the best suggestion. There have been 207 ‘bright ideas’ submitted during 2015.
Professional qualifications
Employees are able to obtain professional qualifications through the Bank’s association with the ifs University College. These
qualifications include Diplomas and Certificates in Retail Banking Conduct of Business and Team Leading, Customer Service and
Financial Services apprenticeships.
The ifs University College is a registered educational charity incorporated by Royal Charter. It has a remit to provide the financial
services industry with a skilled, effective and competent workforce whilst also promoting a better understanding of finance amongst
consumers. The ifs is the only educational body with a specific focus on finance that has the power to award its own degrees. Its
formal qualifications range from A-Level equivalents for the 14-19 age group, to degree and Masters programmes for financial
professionals. The ifs also offers professional development, competence maintenance and executive education programmes
through its alumni membership service.
Employee Council
The Bank operates an Employee Council, which has employee representatives from each department of the Bank. The Council
meets on a regular basis to encourage a two way process of communication between employees and directors. The aim of the
Employee Council is to promote employee engagement and give representatives the opportunity to represent the views of the
employees in a forum which can make a positive difference.
Charitable and environmental considerations
The Bank raised over £50,000 over a 2 year period for its nominated charity, Birmingham Children’s Hospital, through a number of
organised events, including sponsored parachute jumps, abseiling, dress down days, various running events and an annual
flagship cycling event. Riders of all abilities cycled across the Warwickshire countryside on three pre-set routes of 15k, 50k and
100k.
The Group tries to limit its footprint on the environment through the use of energy saving initiatives, recycling consumables and
encouraging greener travel methods for its employees.
Employee opinion
The ‘Your Voice’ employee survey is one of the most important ways the Bank has to examine what we are doing well and what we can do to improve and engage with you in a number of vital areas. To do this, feedback is addressed at both a corporate and a local level. A campaign of ‘Bring it to the 4’ has been used to address the results of the ‘Your Voice’ survey where we identified areas for improvement. These broadly fall into the four pillars of: Fair Deal, Giving Something Back, Personal Growth and Wellbeing.

Culture
SECURE TRUST BANK PLC 40
At a corporate level we are continually working on initiatives we have in place and those that will be considered for development in order to address these areas. We provide regular communication to all employees, keeping them up to date with our progress. While this campaign is running at a corporate level, it is also imperative that the results and associated actions are interpreted at a local departmental and business level in each of the Group businesses.

Board of Directors
SECURE TRUST BANK PLC 41
Board of Directors Sir Henry Angest LLL, Hon.F.UHI - Non-executive Chairman
Sir Henry Angest is Chairman and Chief Executive of Arbuthnot Banking Group PLC as well as Chairman of Arbuthnot Latham & Co., Limited. He gained extensive national and international experience as an executive of The Dow Chemical Company and Dow Banking Corporation. He was Chairman of the Banking Committee of the London Investment Banking Association and a director of the Institute of Directors. He is a Past Master of the Worshipful Company of International Bankers. Sir Henry is appointed by Arbuthnot Banking Group to the board of Secure Trust Bank. Sir Henry is chairman of the Remuneration and Nomination Committees. Paul Lynam ACIB, AMCT, Fifs - Chief Executive Officer
Paul Lynam joined Secure Trust Bank in September 2010, having spent 22 years working for NatWest and RBS. He is a Fellow of the ifs University College and an Associate of the Chartered Institute of Bankers and the Association of Corporate Treasurers. Paul was the Managing Director, Banking, running RBS/NatWest’s SME banking business across the UK and spent four years as the Managing Director of Lombard North Central PLC, running the largest asset finance and leasing business in Europe. Paul is the chairman of the British Bankers Association Challenger Bank Panel and a member of the Assets and Liabilities and Risk Committees. Neeraj Kapur BEng, ACGI, FCA, CF, FCIBS - Chief Financial Officer
Neeraj Kapur has over 25 years’ financial services experience spent in both the accounting and banking industries. He is a Chartered Banker, a Fellow of the Institute of Chartered Accountants in England & Wales, and Council and Chair of the ICAEW Financial Services Faculty. Neeraj qualified as a Chartered Accountant with Arthur Andersen, and spent 11 years working in professional practice before joining RBS in 2001. He has undertaken a number of roles which included Chief Financial Officer of Lombard North Central PLC. Neeraj was appointed to the board of Secure Trust Bank on 31 May 2011. Neeraj is a member of the Assets and Liabilities Committee. Andrew Salmon ACA - Non-executive director
Andrew Salmon joined Arbuthnot Banking Group PLC in 1997 and is its Chief Operating Officer and Head of Business Development. He was previously a director of Hambros Bank Limited and qualified as a Chartered Accountant with KPMG. Andrew is appointed by Arbuthnot Banking Group to the board of Secure Trust Bank. Andrew is a member of the Audit, Assets and Liabilities, Remuneration, Risk and Nominations Committees. The Rt Hon Lord Forsyth of Drumlean PC Kt - Independent non-executive director
Michael Forsyth is a director of J&J Denholm and Denholm Logistics, former Chairman of Hyperion Insurance Group, and former Deputy Chairman of JP Morgan UK and Evercore Partners International. He was appointed to the Privy Council in 1995, knighted in 1997, and joined the House of Lords in 1999. He was a member of the House of Commons for 14 years and served in Government for 10 years, latterly as a Cabinet Minster. Michael Forsyth was appointed to the board of Secure Trust Bank on 1 March 2014. Michael is a member of the Audit, Nomination and Remuneration Committees. Paul Marrow ACIB - Independent non-executive director
Paul Marrow has over 40 years’ banking experience and has over the last decade been responsible for the Commercial Banking and Specialist Corporate Banking business divisions of RBS Group in the UK. Paul is currently the Chairman of JCB Finance Limited, a joint venture between J C Bamford Excavators Limited and RBS Group, and a non-executive director of Arbuthnot Latham & Co., Limited. Paul was appointed to the board of Secure Trust Bank on 3 March 2011. Paul is chairman of the Audit and Risk Committees and a member of the Nomination and Remuneration Committees. Alan Karter LLB (Hons) - Company Secretary
Alan Karter is a Scottish and English qualified solicitor. He was a partner at the international law firm Simmons & Simmons until 2012. While in private practice he advised the Bank on its listing on AIM in 2011. He joined Arbuthnot Banking Group PLC as Head of Legal Affairs in 2012 and was appointed Company Secretary of Secure Trust Bank on 31 August 2014.

Directors’ report
SECURE TRUST BANK PLC 42
Report and financial statements
The directors submit their report, the related Strategic Report and the audited financial statements of Secure Trust Bank PLC (the ‘Company’) for the year ended 2015. The ‘Group’ includes the Company and its subsidiaries. The Strategic Report is set out beginning on page 20.
Principal activities and review
The principal activity of the Group is banking including deposit taking and secured and unsecured lending.
Results and dividend
The results for the year are shown on page 55. The profit for the year after taxation attributable to equity holders of the Company amounted to £28.7 million (2014: £20.5 million). An analysis of the movement in profit after taxation between the current and preceding year is contained in the Financial Review beginning on page 27.
The directors recommend the payment of a final dividend of 55 pence per share which, together with the interim dividend of 17 pence per share paid on 18 September 2015, represents total dividends for the year of 72 pence per share (2014: 68 pence per share). The final dividend, if approved by members at the Annual General Meeting, will be paid on 6 May 2016 to shareholders on the register at the close of business on 8 April 2016.
The Board is also proposing to pay a special dividend of 165 pence per share for 2016. The dividend is dependent on the completion of the sale of ELG, which includes regulatory approval of the change of control, transferral of ownership and the inclusion of the gain within the Company’s capital resources. Following completion, the Board would also review the financial position and prospects of the Company further before declaring any such special dividend.
Dividend Policy
The directors have recently reviewed the dividend policy of the Company. The following sets out the dividend policy of the Company following the review.
The directors have adopted a progressive dividend policy which takes into account the Company’s capital requirements, earnings and cash flow in the long term and has regard to the provisions of the Relationship Agreement between the Company and Arbuthnot Banking Group PLC.
It is intended that a dividend will be declared by the Company at the time of publishing the Company’s interim and year-end results. The Company generally will pay an interim dividend in September which is determined and approved by the directors in conjunction with the approval and announcement of the interim results for the half year; and a final dividend which is recommended by the directors and approved by shareholders at the Annual General Meeting each year.
As a public company, the shares in which are listed on the AIM market of the London Stock Exchange, the dividends are paid to shareholders on the register at a set record date. The record and payment dates are set in conjunction with the Company’s brokers having regard to Stock Exchange requirements.
Payment of all dividends is restricted to profits available for distribution which are determined in accordance with company law. Subject to compliance with all legal requirements the amount of the dividend is set by the directors. The directors will have regard to current and projected capital, liquidity, earnings and market expectations in determining the amount of the dividend. All dividends must be declared and paid in compliance with all applicable laws and the Articles of Association of the Company. On occasion, the Company may declare and pay a special dividend resulting from special circumstances. Any such special dividend will be approved in accordance with the dividend policy of the Company, having regard to the particular circumstances such as timing of announcement.
Future developments
The Strategic Report as well as the Chairman’s Statement and the Chief Executive’s Statement contain a fair review of likely future trends and factors that might affect the development, performance and position of the Group.
Share capital
The share capital of the Company comprises ordinary shares with a nominal value of 40p each. As at 16 March 2016 the Company had 18,191,894 ordinary shares in issue. Each ordinary share entitles the holder to one vote.
No shares were issued during 2015.

Directors’ report
SECURE TRUST BANK PLC 43
Substantial shareholders
As at 16 March 2016 the Company was aware of the following substantial holdings in its issued ordinary share capital:
Ordinary
shares
Percentage of ordinary share
capital
Arbuthnot Banking Group PLC 9,444,538 51.92
Steven A Cohen 1,510,412 8.30
Ruffer 1,124,979 6.18
Threadneedle Investments 935,490 5.14
Unicorn Asset Management 929,420 5.11
Standard Life Investments 794,918 4.37
Directors and their share interests
The directors of the Company are Sir Henry Angest, Lord Forsyth of Drumlean, Neeraj Kapur, Paul Lynam, Paul Marrow and Andrew Salmon. Carol Sergeant was a director throughout 2015 but retired as a director on 31 December 2015. All the directors, other than Carol Sergeant, served on the Board throughout the financial year and up to the date of signing these financial statements. Biographical information about each director is shown on page 41.
Paul Lynam retires under Article 82 of the Articles of Association and, being eligible, offers himself for re-election. Paul Lynam has a service agreement with the Company.
According to the information kept under Section 3 of the Disclosure and Transparency Rules 2006, the directors and their beneficial interests, and that of their families, in the ordinary shares of the Company at the dates shown were as follows:
Beneficial interests At 1 January
2015
Acquired during the year
following the exercise of
options Sold during the
year
At 31 December 2015 and
16 March 2016
Neeraj Kapur 1,000 - - 1,000
Paul Lynam 9,110 - - 9,110
Paul Marrow 5,440 - - 5,440
Andrew Salmon 7,500 - - 7,500
Carol Sergeant* 6,600 - - 6,600
*Retired as a director on 31 December 2015.
Apart from the interests disclosed above, no director was interested at any time during the year in the share capital of Group companies.
Sir Henry Angest, Paul Lynam and Andrew Salmon are directors of the ultimate parent company Arbuthnot Banking Group PLC and their interests in the share capital and share options of group companies are shown in the Directors’ Report of that company.
Board Committees
The report of the Remuneration Committee which begins on page 50 will be the subject of an Ordinary Resolution at the Annual General Meeting.
Information on the Audit, Nomination, Risk and Assets and Liabilities Committees is included in the Corporate Governance statement beginning on page 46.

Directors’ report
SECURE TRUST BANK PLC 44
Employment policies and equal opportunities
The Group is an inclusive and equal opportunities employer that relies on HR specialists to ensure compliance with all applicable laws governing employment practices and to advise on all HR policies and practices, including recruitment and selection, training and career development, and promotion and retirement. Group policies seek to create a workplace that has an open atmosphere of trust, honesty and respect. Harassment or discrimination of any kind is not tolerated. This principle applies to all aspects of employment from recruitment and promotion, through to termination and all other terms and conditions of employment.
Employee communications and involvement
The Group has processes in place for communicating with its employees. Employee communications include information about the performance of the Group, on major matters affecting their work, employment or workplace and to encourage employees to get involved in social or community events. These communications aim to achieve a common awareness for all employees of the financial and economic factors affecting the performance of the Group.
Political donations and expenditure
The Group made no political donations and incurred no political expenditure during the year (2014: nil).
Auditor
KPMG LLP was reappointed as auditor at the Annual General Meeting held in 2015. A resolution for its reappointment as auditor will be proposed at the 2016 Annual General Meeting. KPMG LLP has indicated its willingness to continue in office.
Each director in office at the date of this Directors’ Report confirms that so far as the director is aware, there is no relevant audit information of which the Company’s auditor is unaware and each director has taken all the steps that they ought to have taken as a director to make themselves aware of any relevant audit information and to establish that the Company’s auditor is aware of that information.
Going concern
In assessing the Group as a going concern, the directors have given consideration to the factors likely to affect its future performance and development, the Group’s financial position and the principal risks and uncertainties facing the Group, as set out in the Strategic Report, including the Group’s exposure to credit, liquidity and market risk and the mechanisms for dealing with these risks. The Group uses various short- and medium-term forecasts to monitor future capital and liquidity requirements and these include stress testing assumptions to identify the headroom on regulatory compliance measures.
The directors are satisfied that the Company and the Group have adequate resources to continue to operate for the foreseeable future as going concerns. For this reason they continue to adopt the going concern basis in preparing these financial statements.
Annual General Meeting
The next Annual General Meeting of the Company will be held on 4 May 2016.
At the Annual General Meeting a special resolution will be proposed authorising the Company to make market purchases of ordinary shares within the limits set out in the resolution. The resolution is in a similar form to that proposed at the 2015 Annual General Meeting. The directors have no present intention of exercising the authority granted by the resolution, but regard it as a useful tool to have available.
By order of the Board
A J Karter Secretary
16 March 2016

Directors’ responsibility statement
SECURE TRUST BANK PLC 45
The directors are responsible for preparing the Annual Report and the Group and parent company financial statements in accordance with applicable law and regulations. Company law requires the directors to prepare group and parent company financial statements for each financial year. As required
by the AIM Rules of the London Stock Exchange they are required to prepare the group financial statements in accordance with
IFRSs as adopted by the EU and applicable law and have elected to prepare the parent company financial statements on the same
basis.
Under company law the directors must not approve the financial statements unless they are satisfied that they give a true and fair
view of the state of affairs of the group and parent company and of their profit or loss for that period. In preparing each of the group
and parent company financial statements, the directors are required to:
select suitable accounting policies and then apply them consistently;
make judgements and estimates that are reasonable and prudent;
state whether they have been prepared in accordance with IFRSs as adopted by the EU; and
prepare the financial statements on the going concern basis unless it is inappropriate to presume that the group and the
parent company will continue in business.
The directors are responsible for keeping adequate accounting records that are sufficient to show and explain the parent
company's transactions and disclose with reasonable accuracy at any time the financial position of the parent company and enable
them to ensure that its financial statements comply with the Companies Act 2006. They have general responsibility for taking such
steps as are reasonably open to them to safeguard the assets of the group and to prevent and detect fraud and other irregularities.
The directors are responsible for the maintenance and integrity of the corporate and financial information included on the
Company's website. Legislation in the UK governing the preparation and dissemination of financial statements may differ from
legislation in other jurisdictions.

Corporate Governance statement
SECURE TRUST BANK PLC 46
Secure Trust Bank has a strong and effective Corporate Governance framework. The Board endorses the principles of openness,
integrity and accountability which underlie good corporate governance and takes into account the provisions of the UK Corporate
Governance Code in so far as they are considered appropriate to the Group’s size and circumstances. Moreover, the Group
contains businesses authorised to undertake regulated business under the Financial Services and Markets Act 2000 which are
regulated by the Prudential Regulatory Authority and the Financial Conduct Authority. Accordingly, the Group operates to the high
standards of corporate accountability and regulatory compliance appropriate for such businesses.
The implementation in 2016 of the new individual accountability regime in the United Kingdom in respect of regulated financial
services businesses has caused the Group to review its governance arrangements and the responsibilities of senior managers
within the Group for particular areas of activity. Further details of the new regime are given in the Principal Risks and Uncertainties
section of the Strategic Review.
During 2015 the Group reviewed its governance arrangements and made some changes, which are reflected in the Governance
Manual which captures in one place the principal elements of the governance arrangements applicable to the Group. The
Governance Manual is reviewed by the Board and updated regularly.
This section of the Report and Accounts summarises key elements of the governance arrangements applicable to the Group.
The Board
The Group is led and controlled by an effective Board of Directors which, at the year end, comprised Sir Henry Angest (Non-
Executive Chairman), Paul Lynam (Chief Executive Officer), Neeraj Kapur (Chief Financial Officer), and three other non-executive
directors. Carol Sergeant, one of the independent non-executive directors, retired as a director on 31 December 2015. Under the
Company’s Articles of Association and pursuant to the Relationship Agreement between the Company and its parent company,
Arbuthnot Banking Group PLC (“ABG”), one third of the directors are appointed by ABG, one third of the directors are full time
executive directors and one third of the directors are independent directors. Sir Henry Angest and Andrew Salmon were appointed
as directors by ABG.
The Board meets regularly throughout the year. Substantive agenda items have briefing papers, which are circulated in a timely
manner before each meeting. The Board ensures that it is supplied with all the information that it requires and requests, in a form
and of a quality to enable it to fulfil its duties.
In addition to determining and overseeing the implementation of the strategy of the Company and of the Group and exercising
oversight of executive management, certain items are reserved for decision by the Board. These matters include material
acquisitions and disposals, the issue of capital and any transactions outside the ordinary course.
The Company Secretary is responsible for ensuring that Board processes and procedures are appropriately followed and support
effective decision making. All directors have access to the Company Secretary’s advice and services and directors may obtain
independent professional advice in the course of their duties, if necessary, at the Company’s expense.
The Board has delegated certain of its responsibilities to individual executives and to committees. The standing committees of the
Board are described below.
Audit Committee
Membership of the Audit Committee is limited to non-executive directors and the current Audit Committee comprises Paul Marrow
as Chairman, Andrew Salmon and Lord Forsyth, who was appointed in January 2016. Carol Sergeant was a member of the Audit
Committee throughout 2015 until her retirement as a director on 31 December 2015.
The primary responsibilities of the Audit Committee are to review arrangements established by the directors for compliance with
regulatory and financial reporting requirements, monitor the integrity of the Group and subsidiary statutory accounts, oversee the
work of the external auditors, monitor and review the scope, results and effectiveness of the Company’s internal audit function and
liaise with the Audit Committee of ABG.
The Audit Committee’s responsibilities include reviewing the Group’s system of internal control and the process for evaluating and
monitoring risk. The Committee also considers any other matters which might have a financial impact on the Company, including
the Group’s arrangement by which staff may, in confidence, raise concerns about possible improprieties in matters of financial
reporting or other matters. The Audit Committee has the authority to obtain any information it requires from any employee or

Corporate Governance statement
SECURE TRUST BANK PLC 47
external party, and at least once a year meets with the Company’s external auditors and internal audit function without any
executive directors being present.
Over the course of the year, the Audit Committee has overseen the establishment of an effective internal audit function and
approved the Group’s internal audit plan. The timely resolution of issues raised by internal audit has been closely monitored and
the performance in 2015 has been very encouraging. The Committee has also tracked improvements in the Group’s reconciliation
processes, which have seen differences significantly reduced without requiring material write-offs.
The Committee also reviews the appointment, terms of engagement, independence and objectivity of the external auditors,
including the level of non-audit services provided, and ensures that there is an appropriate and independent audit relationship. The
Audit Committee provides a forum for discussing with the Group’s external auditors their report on the annual accounts. During
2015 and 2016 there has been particular engagement with the external auditors on key areas of judgement in relation to the
audited accounts, leading to an enhanced audit process. The Group has also implemented recommendations made by the external
auditors in relation to their audit of the accounts for earlier years.
The present auditors have held office since 2009 and the senior statutory auditor changed in 2012.
Risk Committee
The Risk Committee is chaired by Paul Marrow and its other members are Paul Lynam and Andrew Salmon. Paul Marrow replaced
Andrew Salmon as chairman of the Risk Committee with effect from 26 January 2016. This change was prompted by changes in
governance arising from the implementation of the individual accountability regime.
The primary responsibilities of the Risk Committee are to approve specific risk policies for the Company and its subsidiaries;
approve trading positions in excess of the limits set by the management of the Group; oversee the development, implementation
and maintenance of the Group’s overall risk management framework and its risk appetite, strategy, principles and policies; oversee
the Group’s risk exposures, risk/return and proposed improvements to the Group’s risk management framework; oversee
adherence to the risk principles, policies and standards adopted by the wider group; and keep the wider group regularly informed of
any risk issues or breaches faced by the Group which may affect the wider group.
During 2015 the Risk Committee has overseen developments in the Group’s operational and conduct risk management capability,
including the strengthening of the team and improvements to systems and processes. These improvements are discussed in more
detail in the Principal Risks and Uncertainties section of the Strategic Report, beginning on page 30.
The Committee has also focused during the year on the ongoing challenges of cyber-crime, the robustness of the Group’s
information security processes and the changes in risk profile brought about by the new SME business streams.
Assets and Liabilities Committee
The Assets and Liabilities Committee (ALCO) is responsible for implementing and controlling the liquidity and asset and liability
management risk appetite established by the Board. The Committee is also responsible for ensuring the high level financial control
over the Bank’s balance sheet and the associated risks undertaken in the course of its business. The Committee sets and controls
capital deployment, treasury strategy guidelines and limits focusing on the effects of the future plans and strategy on STB’s assets
and liabilities. ALCO is chaired by Paul Lynam and its members are a mix of directors (STB and ABG) and senior management
(from the Bank and from the wider group). The committee meets monthly.
Remuneration Committee
Membership of the Remuneration Committee is limited to non-executive directors of the Company. The members of the Committee
are Sir Henry Angest (Chairman of the Committee), Paul Marrow, Lord Forsyth and Andrew Salmon. Carol Sergeant was a
member of the Committee until her retirement as a director on 31 December 2015. Lord Forsyth and Andrew Salmon were
appointed as members of the Committee with effect from 1 January 2016. The Remuneration Committee meets on an ad hoc basis
when required. It met twice in 2015.
The Remuneration Committee has responsibility for producing recommendations on the overall remuneration policy for directors
and for setting the remuneration of individual executive directors, both for review by the Board. Remuneration is set having regard
to any roles that may be performed by such directors as directors of any other group companies. The Committee applies the
Company’s remuneration policy and monitors its implementation, reviews the Remuneration Report, considers and if thought fit
awards any incentives to be offered under long term and share incentive schemes and pension arrangements, subject to the
achievement of specific criteria. Members of the Committee do not vote on their own remuneration.
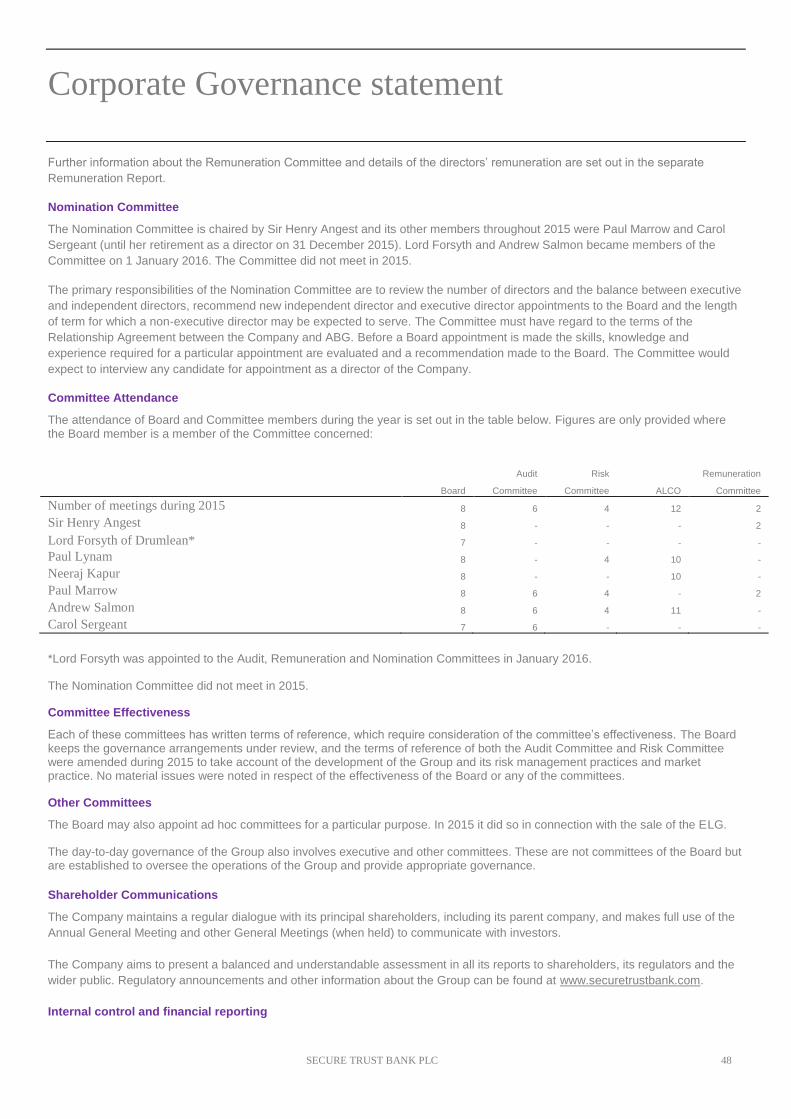
Corporate Governance statement
SECURE TRUST BANK PLC 48
Further information about the Remuneration Committee and details of the directors’ remuneration are set out in the separate
Remuneration Report.
Nomination Committee
The Nomination Committee is chaired by Sir Henry Angest and its other members throughout 2015 were Paul Marrow and Carol
Sergeant (until her retirement as a director on 31 December 2015). Lord Forsyth and Andrew Salmon became members of the
Committee on 1 January 2016. The Committee did not meet in 2015.
The primary responsibilities of the Nomination Committee are to review the number of directors and the balance between executive
and independent directors, recommend new independent director and executive director appointments to the Board and the length
of term for which a non-executive director may be expected to serve. The Committee must have regard to the terms of the
Relationship Agreement between the Company and ABG. Before a Board appointment is made the skills, knowledge and
experience required for a particular appointment are evaluated and a recommendation made to the Board. The Committee would
expect to interview any candidate for appointment as a director of the Company.
Committee Attendance
The attendance of Board and Committee members during the year is set out in the table below. Figures are only provided where the Board member is a member of the Committee concerned:
Audit Risk Remuneration Board Committee Committee ALCO Committee
Number of meetings during 2015 8 6 4 12 2
Sir Henry Angest 8 - - - 2
Lord Forsyth of Drumlean* 7 - - - -
Paul Lynam 8 - 4 10 -
Neeraj Kapur 8 - - 10 -
Paul Marrow 8 6 4 - 2
Andrew Salmon 8 6 4 11 -
Carol Sergeant 7 6 - - -
*Lord Forsyth was appointed to the Audit, Remuneration and Nomination Committees in January 2016.
The Nomination Committee did not meet in 2015.
Committee Effectiveness
Each of these committees has written terms of reference, which require consideration of the committee’s effectiveness. The Board keeps the governance arrangements under review, and the terms of reference of both the Audit Committee and Risk Committee were amended during 2015 to take account of the development of the Group and its risk management practices and market practice. No material issues were noted in respect of the effectiveness of the Board or any of the committees.
Other Committees
The Board may also appoint ad hoc committees for a particular purpose. In 2015 it did so in connection with the sale of the ELG.
The day-to-day governance of the Group also involves executive and other committees. These are not committees of the Board but are established to oversee the operations of the Group and provide appropriate governance.
Shareholder Communications
The Company maintains a regular dialogue with its principal shareholders, including its parent company, and makes full use of the
Annual General Meeting and other General Meetings (when held) to communicate with investors.
The Company aims to present a balanced and understandable assessment in all its reports to shareholders, its regulators and the
wider public. Regulatory announcements and other information about the Group can be found at www.securetrustbank.com.
Internal control and financial reporting

Corporate Governance statement
SECURE TRUST BANK PLC 49
The Board has overall responsibility for the Group’s system of internal control and for reviewing its effectiveness. Such a system is
designed to manage rather than eliminate risk of failure to achieve business objectives and can only provide reasonable but not
absolute assurance against the risk of material misstatement or loss.
The Board has adopted a Group Risk Appetite Statement which sets out the Board’s attitude to risk and internal control. Key risks
identified by the directors are formally reviewed and assessed at least once a year by the Board and are also reviewed by the Risk
Committee at its meetings. Key business risks are also identified, evaluated and managed by operating management on an
ongoing basis. The Board and the Risk Committee also receive regular reports on any risk matters. Significant risks identified in
connection with the development of new activities are considered by the Board and the Risk Committee in conjunction with the
approval of any such new activity.
The effectiveness of the internal control system is reviewed regularly by the Board and the Audit Committee, which also receives
reports of reviews undertaken by the internal audit function. The Audit Committee also receives reports from the external auditors,
KPMG LLP, which include details of internal control matters that they have identified. Certain aspects of the system of internal
control are also subject to regulatory supervision, the results of which are monitored closely by the Board.
During 2015 the Group continued to develop its internal audit function.
By order of the Board
A J Karter Secretary
16 March 2016

Remuneration report
SECURE TRUST BANK PLC 50
Remuneration Committee
Membership of the Remuneration Committee is limited to non-executive directors. The present members of the Committee are Sir
Henry Angest (Chairman), Lord Forsyth, Paul Marrow and Andrew Salmon. Carol Sergeant ceased to be member of the Committee
on her retirement as a director on 31 December 2015. Lord Forsyth and Andrew Salmon were appointed as members of the
Committee with effect from 1 January 2016.
The Committee has responsibility for producing recommendations on the overall remuneration policy for directors and for setting
the remuneration of individual executive directors, both for review by the Board. Remuneration is set having regard to any roles that
may be performed by such directors as directors of any other Group companies. The Committee applies the Company’s
remuneration policy and monitors its implementation, reviews the Remuneration Report, considers and, if thought fit, awards any
incentives to be offered under the Company’s Share Option Scheme, other long-term incentive schemes and pension
arrangements, subject to the achievement of specific criteria. Members of the Committee do not vote on their own remuneration.
The Committee also deals with remuneration related issues under the Prudential Regulation Authority’s Remuneration Code
applicable to the Group.
Remuneration policy
The Remuneration Committee determines the remuneration of individual directors having regard to the size and nature of the
business; the importance of attracting, retaining and motivating management of the appropriate calibre without paying more than is
necessary for this purpose; remuneration data for comparable positions; the need to align the interests of executives with those of
shareholders; and an appropriate balance between current remuneration and longer term performance-related rewards. The
remuneration package can comprise a combination of basic annual salary and benefits (including pension), a discretionary annual
bonus award related to the Committee’s assessment of the contribution made by the executive during the year and longer term
incentives, including executive share options and similar awards. Pension benefits take the form of annual contributions paid by the
Company to individual money purchase schemes. The Remuneration Committee reviews salary levels each year based on the
performance of the Group during the preceding financial period. This review does not necessarily lead to increases in salary levels.
The Board reviewed and approved the group remuneration policy at its meeting in November 2015. There were no changes to the
policy in 2015. This is a group policy that applies to the parent company (Arbuthnot Banking Group) and to the Group.
During 2015 the Group implemented applicable provisions required under the Prudential Regulation Authority’s Remuneration
Code having regard to the treatment of the Group under the Remuneration Code and disapplied provisions that it is permitted to
disapply (deferral over a three to five year period; performance adjustment (or malus); delivery in shares or share-based
instruments; and retention of shares/instruments). The Company and its subsidiaries are all considered to be Tier III institutions,
due to the size of their relevant total assets. The Company is therefore satisfied that the so called bonus cap does not currently
apply to it, and expects this to remain the case in light of the recent announcement by the PRA and FCA in relation to their
application of the guidelines issued by the European Banking Authority in December 2015. The Company also understands that the
principle of proportionality has been accepted and this is expected to mean that the Company can continue to disapply parts of the
Remuneration Code. Shareholders passed a resolution at the Annual General Meeting in 2014 permitting discretionary bonuses to
be up to two times annual basic salary and if the so called bonus cap were to apply to the Company that permission would continue
to apply. No director received a bonus of more than one times salary during 2015.
Directors’ service contracts
Paul Lynam and Neeraj Kapur both have service contracts terminable at any time on 12 months’ notice in writing by either party.
Lord Forsyth and Paul Marrow have service contracts terminable at any time on three months’ notice in writing by either party. Sir
Henry Angest and Andrew Salmon have service contracts with Arbuthnot Banking Group PLC and their details are disclosed in the
financial statements of that company.
Share Option Scheme
On 17 October 2011 the Company established The Secure Trust Bank Share Option Scheme (the “Share Scheme”) which is
administered by the Remuneration Committee. A detailed description of the Share Scheme, including Scheme Conditions, is
contained in Note 27 of the financial statements.

Remuneration report
SECURE TRUST BANK PLC 51
The market price for each ordinary share at the Company’s year-end was 3,288p. The highest and lowest market price for each
ordinary share during the year was 3,385p and 2,740p respectively.
Phantom Share Option Scheme
On 16 March 2015 the Remuneration Committee approved the establishment of a four year Phantom Share Option Scheme (the
“Phantom Scheme”), to provide effective long-term incentive. Under the scheme, no actual shares would be issued by the
Company, and those granted awards under it would be entitled to a payment by reference to the increase in the value of an
ordinary share in the Company over an initial value determined by the Remuneration Committee. For those who are granted
awards under the new scheme who were employed in November 2014, the four years commenced from that date and the initial
value was set at £25 per ordinary share, being the price at which the shares resulting from the exercise of the first tranche of share
options under the Share Scheme were sold in November 2014. As at 31 December 2015 there were 326,917 (2014: nil) phantom
share options awarded to scheme members. An accrual, based on the market price per ordinary share at the Company’s year-end
has been included in staff costs detailed in Note 8. The Phantom Scheme is, similarly to the Share Scheme, subject to the
achievement of objective performance conditions as determined by the Remuneration Committee. The scheme is a cash settled
long-term incentive scheme and operates to motivate, incentivise and assist in the retention of the services of individuals who are
regarded as important to the successful performance of the business and increasing shareholder value.
Directors' emoluments
This part of the remuneration report is audited information. 2015 2014
£000 £000
Salary and fee payments (including bonuses and benefits in kind) 2,091 1,674
Gains from the exercise of share options - 5,659
Pension contributions 60 60
2,151 7,393
Gains from
the exercise of
Salary/fees Bonus Benefits Pension share options Total
2015 2014 2015 2014 2015 2014 2015 2014 2015 2014 2015 2014
£000 £000 £000 £000 £000 £000 £000
M Forsyth 55 42 - - - - - - - - 55 42
N Kapur 275 213 175 150 22 18 25 25 - 629 497 1,035
P Lynam 900 600 500 500 24 21 35 35 - 2,515 1,459 3,671
P Marrow 85 80 - - - - - - - - 85 80
A Salmon - - - - - - - - - 2,515 - 2,515
C Sergeant 55 50 - - - - - - - - 55 50
1,370 985 675 650 46 39 60 60 - 5,659 2,151 7,393
The salaries of Sir Henry Angest and Andrew Salmon are paid by Arbuthnot Banking Group PLC and disclosed in the Arbuthnot
Banking Group PLC consolidated financial statements. The cost of the provision of the services of Sir Henry Angest and Andrew
Salmon, of £60,000 and £45,000 respectively, have been recharged to the Company in accordance with the Services and
Relationship Agreements created at the time of the IPO in 2011 (2014: £60,000 and £45,000 respectively).
The emoluments of the highest paid director were £1,459,000 for the year ended 31 December 2015 (2014: £3,671,000), including
contributions made to a money purchase scheme of £35,000 (2014: £35,000).
Phantom Options of 187,500 and 31,250 were awarded to Paul Lynam and Neeraj Kapur respectively during 2015.
The benefits in kind include private medical health insurance and car allowances.
The Remuneration Committee carefully considers all factors in determining the bonuses awarded to directors each year. The
bonuses awarded to Neeraj Kapur and Paul Lynam by the Remuneration Committee were made in recognition of both the
performance of the business as well as each individual’s performance during the year. Under the existing bonus scheme 25% of

Remuneration report
SECURE TRUST BANK PLC 52
their annual bonus is deferred each year and is paid out in the subsequent year following approval by the Remuneration
Committee. The deferred part of the 2014 bonus has been approved and will be released in March 2016.
Retirement benefit contributions are being paid for two directors who served during 2015 (2014: Two).
Sir Henry Angest Chairman of the Remuneration Committee
16 March 2016

Independent Auditor’s report
to the members of Secure Trust Bank PLC
SECURE TRUST BANK PLC 53
We have audited the financial statements of Secure Trust Bank PLC for the year ended 31 December 2015 set out on pages 55 to 112. The financial reporting framework that has been applied in their preparation is applicable law and International Financial Reporting Standards (IFRSs) as adopted by the EU and, as regards the parent company financial statements, as applied in accordance with the provisions of the Companies Act 2006. In addition to our audit of the financial statements, the directors have engaged us to audit the information in the Directors' Remuneration Report that is described as having been audited, which the directors have decided to prepare (in addition to that required to be prepared) as if the company were required to comply with the requirements of Schedule 8 to The Large and Medium-sized Companies and Groups (Accounts and Reports) Regulations 2008 (SI 2008 No. 410) made under the Companies Act 2006. This report is made solely to the company's members, as a body, in accordance with Chapter 3 of Part 16 of the Companies Act 2006 and, in respect of the separate opinion in relation to the Directors' Remuneration Report and reporting on corporate governance, on terms that have been agreed. Our audit work has been undertaken so that we might state to the company's members those matters we are required to state to them in an auditor's report and, in respect of the separate opinion in relation to the Directors' Remuneration Report, those matters that we have agreed to state to them in our report, and for no other purpose. To the fullest extent permitted by law, we do not accept or assume responsibility to anyone other than the company and the company's members, as a body, for our audit work, for this report, or for the opinions we have formed. Respective responsibilities of directors and auditor
As explained more fully in the Directors' Responsibilities Statement set out on page 45, the directors are responsible for the preparation of the financial statements and for being satisfied that they give a true and fair view. Our responsibility is to audit, and express an opinion on, the financial statements in accordance with applicable law and International Standards on Auditing (UK and Ireland). Those standards require us to comply with the Auditing Practices Board's Ethical Standards for Auditors. Scope of the audit of the financial statements
A description of the scope of an audit of financial statements is provided on the Financial Reporting Council's website at www.frc.org.uk/auditscopeukprivate. Opinion on financial statements
In our opinion:
the financial statements give a true and fair view of the state of the group's and of the parent company's affairs as at 31 December 2015 and of the group's profit for the year then ended;
the group financial statements have been properly prepared in accordance with IFRSs as adopted by the EU;
the parent company financial statements have been properly prepared in accordance with IFRSs as adopted by the EU and as applied in accordance with the provisions of the Companies Act 2006;
the financial statements have been prepared in accordance with the requirements of the Companies Act 2006. Opinion on other matters prescribed by the Companies Act 2006 and under the terms of our engagement
In our opinion:
the part of the Directors' Remuneration Report which we were engaged to audit has been properly prepared in accordance with Schedule 8 to The Large and Medium-sized Companies and Groups (Accounts and Reports) Regulations 2008 made under the Companies Act 2006, as if those requirements were to apply to the company; and
the information given in the Strategic Report and the Directors' Report for the financial year for which the financial statements are prepared is consistent with the financial statements.

Independent Auditor’s report
to the members of Secure Trust Bank PLC
SECURE TRUST BANK PLC 54
Matters on which we are required to report by exception
We have nothing to report in respect of the following: Under the Companies Act 2006 and under the terms of our engagement we are required to report to you if, in our opinion:
adequate accounting records have not been kept by the parent company, or returns adequate for our audit have not been received from branches not visited by us; or
the parent company financial statements and the part of the Directors' Remuneration Report which we were engaged to audit are not in agreement with the accounting records and returns; or
certain disclosures of directors' remuneration specified by law are not made; or
we have not received all the information and explanations we require for our audit. Andrew Walker (Senior Statutory Auditor) for and on behalf of KPMG LLP, Statutory Auditor
Chartered Accountants One Snowhill Snow Hill Queensway Birmingham B4 6GH
16 March 2016
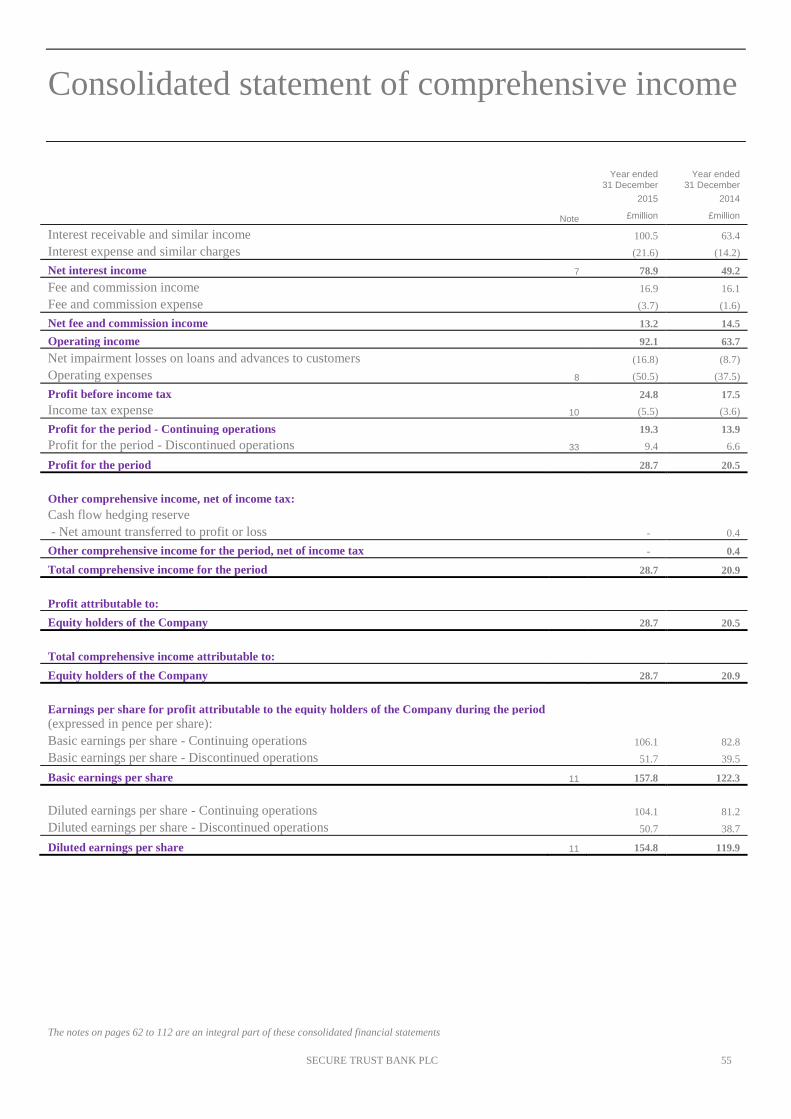
Consolidated statement of comprehensive income
The notes on pages 62 to 112 are an integral part of these consolidated financial statements
SECURE TRUST BANK PLC 55
Year ended
31 December Year ended
31 December
2015 2014
Note £million £million
Interest receivable and similar income 100.5 63.4
Interest expense and similar charges (21.6) (14.2)
Net interest income 7 78.9 49.2
Fee and commission income 16.9 16.1
Fee and commission expense (3.7) (1.6)
Net fee and commission income 13.2 14.5
Operating income 92.1 63.7
Net impairment losses on loans and advances to customers (16.8) (8.7)
Operating expenses 8 (50.5) (37.5)
Profit before income tax 24.8 17.5
Income tax expense 10 (5.5) (3.6)
Profit for the period - Continuing operations 19.3 13.9
Profit for the period - Discontinued operations 33 9.4 6.6
Profit for the period 28.7 20.5
Other comprehensive income, net of income tax:
Cash flow hedging reserve
- Net amount transferred to profit or loss - 0.4
Other comprehensive income for the period, net of income tax - 0.4
Total comprehensive income for the period 28.7 20.9
Profit attributable to:
Equity holders of the Company 28.7 20.5
Total comprehensive income attributable to:
Equity holders of the Company 28.7 20.9
Earnings per share for profit attributable to the equity holders of the Company during the period
(expressed in pence per share):
Basic earnings per share - Continuing operations 106.1 82.8
Basic earnings per share - Discontinued operations 51.7 39.5
Basic earnings per share 11 157.8 122.3
Diluted earnings per share - Continuing operations 104.1 81.2
Diluted earnings per share - Discontinued operations 50.7 38.7
Diluted earnings per share 11 154.8 119.9

Consolidated statement of financial position
The notes on pages 62 to 112 are an integral part of these consolidated financial statements
SECURE TRUST BANK PLC 56
At 31 December
2015 2014
Note £million £million
ASSETS
Cash and balances at central banks 131.8 81.2
Loans and advances to banks 12 9.8 39.8
Loans and advances to customers 13 960.6 622.5
Debt securities held-to-maturity 15 3.8 16.3
Property, plant and equipment 18 8.5 8.1
Intangible assets 16 7.0 8.2
Deferred tax assets 24 0.3 1.0
Other assets 20 7.1 5.2
Assets held for sale 33 118.5 -
Total assets 1,247.4 782.3
LIABILITIES AND EQUITY
Liabilities
Due to banks 21 35.0 15.9
Deposits from customers 22 1,033.1 608.4
Current tax liabilities 3.2 3.6
Other liabilities 23 26.2 29.5
Liabilities held for sale 33 8.7 -
Total liabilities 1,106.2 657.4
Equity attributable to owners of the parent
Share capital 26 7.3 7.3
Share premium 79.3 79.3
Retained earnings 54.4 38.1
Revaluation reserve 0.2 0.2
Total equity 141.2 124.9
Total liabilities and equity 1,247.4 782.3
The financial statements on pages 55 to 112 were approved by the Board of Directors on 16 March 2016 and were signed on its
behalf by:
P Lynam - Chief Executive Officer
N Kapur - Chief Financial Officer

Company statement of financial position
The notes on pages 62 to 112 are an integral part of these consolidated financial statements
SECURE TRUST BANK PLC 57
At 31 December
2015 2014
Note £million £million
ASSETS
Cash and balances at central banks 131.8 81.2
Loans and advances to banks 12 9.2 37.9
Loans and advances to customers 13 932.7 500.1
Debt securities held-to-maturity 15 3.8 16.3
Property, plant and equipment 18 4.2 3.7
Intangible assets 16 3.2 1.3
Investments 17 3.7 3.7
Deferred tax assets 24 0.6 0.3
Other assets 20 146.0 116.2
Total assets 1,235.2 760.7
LIABILITIES AND EQUITY
Liabilities
Due to banks 21 36.4 15.9
Deposits from customers 22 1,033.1 608.4
Current tax liabilities 0.3 1.5
Other liabilities 23 30.2 22.2
Total liabilities 1,100.0 648.0
Equity attributable to owners of the parent
Share capital 26 7.3 7.3
Share premium 79.3 79.3
Retained earnings 48.6 26.1
Total equity 135.2 112.7
Total liabilities and equity 1,235.2 760.7
The Company has elected to take the exemption under section 408 of the Companies Act 2006 not to present the parent company
profit and loss account. The profit for the parent company for the year is presented in the Company Statement of Changes in
Equity.
The financial statements on pages 55 to 112 were approved by the Board of Directors on 16 March 2016 and were signed on its
behalf by:
P Lynam - Chief Executive Officer
N Kapur - Chief Financial Officer
Registered number: 00541132

Consolidated statement of changes in equity
The notes on pages 62 to 112 are an integral part of these consolidated financial statements
SECURE TRUST BANK PLC 58
Share capital
Share premium
Revaluation reserve
Cash flow hedging reserve
Retained earnings Total
£million £million £million £million £million £million
Balance at 1 January 2014 6.3 28.2 0.2 (0.4) 27.3 61.6
Total comprehensive income for the period
Profit for 2014 - - - - 20.5 20.5
Other comprehensive income, net of income tax
Cash flow hedging reserve
- Net amount transferred to profit and loss - - - 0.4 - 0.4
Total other comprehensive income - - - 0.4 - 0.4
Total comprehensive income for the period - - - 0.4 20.5 20.9
Transactions with owners, recorded directly in equity
Contributions by and distributions to owners
Dividends - - - - (10.2) (10.2)
Charge for share based payments - - - - 0.5 0.5
Issue of ordinary shares 1.0 52.3 - - - 53.3
Transaction costs on issue of shares - (1.2) - - - (1.2)
Total contributions by and distributions to owners 1.0 51.1 - - (9.7) 42.4
Balance at 31 December 2014 7.3 79.3 0.2 - 38.1 124.9
Total comprehensive income for the period
Profit for 2015 - - - - 28.7 28.7
Other comprehensive income, net of income tax
Total comprehensive income for the period - - - - 28.7 28.7
Transactions with owners, recorded directly in equity
Contributions by and distributions to owners
Dividends - - - - (12.6) (12.6)
Charge for share based payments - - - - 0.2 0.2
Total contributions by and distributions to owners - - - - (12.4) (12.4)
Balance at 31 December 2015 7.3 79.3 0.2 - 54.4 141.2

Company statement of changes in equity
The notes on pages 62 to 112 are an integral part of these consolidated financial statements
SECURE TRUST BANK PLC 59
Share capital
Share premium
Cash flow hedging reserve
Retained earnings Total
£million £million £million £million £million
Balance at 1 January 2014 6.3 28.2 (0.4) 12.8 46.9
Total comprehensive income for the period
Profit for 2014 - - - 23.0 23.0
Cash flow hedging reserve
- Net amount transferred to profit or loss - - 0.4 - 0.4
Total other comprehensive income - - 0.4 - 0.4
Total comprehensive income for the period - - 0.4 23.0 23.4
Transactions with owners, recorded directly in equity
Contributions by and distributions to owners
Dividends - - - (10.2) (10.2)
Charge for share based payments - - - 0.5 0.5
Issue of ordinary shares 1.0 52.3 - - 53.3
Transaction costs on issue of shares - (1.2) - - (1.2)
Total contributions by and distributions to owners 1.0 51.1 - (9.7) 42.4
Balance at 31 December 2014 7.3 79.3 - 26.1 112.7
Total comprehensive income for the period
Profit for 2015 - - - 34.9 34.9
Total comprehensive income for the period - - - 34.9 34.9
Transactions with owners, recorded directly in equity
Contributions by and distributions to owners
Dividends - - - (12.6) (12.6)
Charge for share based payments - - - 0.2 0.2
Total contributions by and distributions to owners - - - (12.4) (12.4)
Balance at 31 December 2015 7.3 79.3 - 48.6 135.2

Consolidated statement of cash flows
The notes on pages 62 to 112 are an integral part of these consolidated financial statements
SECURE TRUST BANK PLC 60
Year ended
31 December Year ended
31 December
2015 2014
Note £million £million
Cash flows from operating activities
Profit for the year 19.3 13.9
Adjustments for:
Income tax expense 10 5.5 3.6
Depreciation of property, plant and equipment 18 0.5 0.4
Amortisation of intangible assets 16 1.3 1.2
Impairment losses on loans and advances to customers 16.8 8.7
Share based compensation 0.2 0.5
Cash flows from operating profits before changes in operating assets and liabilities 43.6 28.3
Changes in operating assets and liabilities:
- net decrease in debt securities held to maturity 12.5 -
- net decrease/(increase) in loans and advances to banks 15.0 (11.3)
- net increase in loans and advances to customers (448.8) (227.7)
- net (increase)/decrease in other assets (2.6) 2.9
- net increase in amounts due to banks 19.1 15.8
- net increase in deposits from customers 424.7 171.8
- net decrease in other liabilities (6.0) (1.3)
Income tax paid (4.2) (0.8)
Net cash inflow/(outflow) from operating activities 53.3 (22.3)
Cash flows from investing activities
Purchase of property, plant and equipment 18 (1.1) (3.5)
Purchase of computer software 16 (2.3) (0.8)
Net cash flows from investing activities (3.4) (4.3)
Cash flows from financing activities
Net inflow on issue of share capital - 52.1
Dividends paid (12.6) (10.2)
Net cash flows from financing activities (12.6) 41.9
Net increase in cash and cash equivalents - Continuing operations 37.3 15.3
Net increase in cash and cash equivalents - Discontinued operations - 0.7
Cash and cash equivalents at 1 January 106.0 90.0
Cash and cash equivalents at 31 December 28 143.3 106.0

Company statement of cash flows
The notes on pages 62 to 112 are an integral part of these consolidated financial statements
SECURE TRUST BANK PLC 61
Year ended
31 December Year ended
31 December
2015 2014
Note £million £million
Cash flows from operating activities
Profit for the year 34.9 23.0
Adjustments for:
Income tax expense 2.0 4.8
Depreciation of property, plant and equipment 18 0.3 0.2
Amortisation of intangible assets 16 0.3 0.3
Impairment losses on loans and advances to customers 17.1 8.7
Share based compensation 0.2 0.5
Cash flows from operating profits before changes in operating assets and liabilities 54.8 37.5
Changes in operating assets and liabilities:
- net decrease in debt securities held to maturity 12.5 -
- net decrease/(increase) in loans and advances to banks 15.0 (11.3)
- net increase in loans and advances to customers (449.7) (224.9)
- net increase in other assets (29.8) (15.2)
- net increase in amounts due to banks 20.5 15.8
- net increase in deposits from customers 424.7 171.8
- net increase in other liabilities 7.7 7.0
Income tax paid (3.2) (2.9)
Net cash inflow/(outflow) from operating activities 52.5 (22.2)
Cash flows from investing activities
Purchase of property, plant and equipment 18 (0.8) (3.4)
Purchase of computer software 16 (2.2) (0.7)
Net cash flows from investing activities (3.0) (4.1)
Cash flows from financing activities
Net inflow on issue of share capital - 52.1
Dividends paid (12.6) (10.2)
Net cash flows from financing activities (12.6) 41.9
Net increase in cash and cash equivalents 36.9 15.6
Cash and cash equivalents at 1 January 104.1 88.5
Cash and cash equivalents at 31 December 28 141.0 104.1

Notes to the consolidated financial statements
SECURE TRUST BANK PLC 62
1. Accounting policies
The principal accounting policies applied in the preparation of these consolidated financial statements are set out below. These
policies have been consistently applied to all the years presented, unless otherwise stated.
1.1 Reporting entity
Secure Trust Bank PLC is a company incorporated in the United Kingdom (referred to as ‘the Company’). The registered address
of the Company is One Arleston Way, Solihull, West Midlands, B90 4LH. The consolidated financial statements of the Company
as at and for the year ended 31 December 2015 comprise Secure Trust Bank PLC and its subsidiaries (together referred to as ‘the
Group’ and individually as ‘subsidiaries’). The Group is primarily involved in banking and financial services.
1.2 Basis of presentation
The Group’s consolidated financial statements and the Company’s financial statements have been prepared in accordance with
International Financial Reporting Standards (IFRSs as adopted or early adopted by the Group and endorsed by the EU) and the
Companies Act 2006 applicable to companies reporting under IFRS. They have been prepared under the historical cost
convention, as modified by the revaluation of land and buildings and financial instruments at fair value through profit or loss. The
consolidated financial statements are presented in pounds sterling, which is the Group’s functional and presentational currency.
The preparation of financial statements in conformity with IFRS requires the use of certain critical accounting estimates. It also
requires management to exercise its judgement in the process of applying the Group’s accounting policies. The areas involving a
higher degree of judgement or complexity or areas where assumptions and estimates are significant to the consolidated financial
statements are disclosed in Note 2.
The directors have assessed, in the light of current and anticipated economic conditions, the Group's ability to continue as a going
concern. The directors confirm they are satisfied that the Company and the Group have adequate resources to continue in business
for the foreseeable future. For this reason, they continue to adopt the 'going concern' basis for preparing accounts.
The consolidated financial statements were authorised for issue by the Board of Directors on 16 March 2016.
The following International Financial Reporting Standards have been issued which are not yet effective and which have not been
adopted early:
IFRS 9 ‘Financial instruments’ (effective for annual periods beginning after 1 January 2018). This is the IASB’s
replacement of IAS 39 ‘Financial Instruments: Recognition and Measurement’. Phase one of this standard deals with the
classification and measurement of financial assets and represents a significant change from the existing requirements in
IAS 39. The standard contains three primary measurement categories for financial assets: ‘amortised cost’, ‘fair value
through other comprehensive income’ and ‘fair value through profit or loss’ and eliminates the existing categories of
'held to maturity', 'available for sale' and 'loans and receivables'. Phase two of the standard covers impairment, with a new
expected loss impairment model that will require expected credit losses to be accounted for from when financial
instruments are first recognised and lowers the threshold for the recognition of full lifetime expected losses. Phase three
covers general hedge accounting and introduces a substantially reformed model for hedge accounting with enhanced
disclosure about risk management activity. The new model aligns the accounting treatment with risk management
activities. The expected impact of this standard on the Group is set out in Principal risks and uncertainties beginning on
page 30.
IFRS 15 ‘Revenue from contracts with customers’ (effective for annual periods beginning after 1 January 2018). This
standard replaces a number of existing standards and interpretations and applies to contracts with customers, but does not
apply to insurance contracts, financial instruments or lease contracts, which are in the scope of other IFRSs. It also does
not apply if two companies in the same line of business exchange non-monetary assets to facilitate sales to other parties.
The standard specifies how and when an IFRS reporter will recognise revenue as well as requiring such entities to
provide users of financial statements with more informative relevant disclosures. It introduces a new revenue recognition
model that recognises revenue either at a point in time or over time. The model features a principles-based five-step
model to be applied to all contracts with customers. This standard is unlikely to have a material impact on the Group.

Notes to the consolidated financial statements
SECURE TRUST BANK PLC 63
IFRS 16, ‘Leases’ (effective from 1 January 2019). The standard sets out the principles for the recognition, measurement,
presentation and disclosure of leases for both parties to a contract i.e. the customer (‘lessee’) and the supplier (‘lessor’).
IFRS 16 replaces the previous leases standard, IAS 17 Leases, and related interpretations. IFRS 16 eliminates the
classification of leases as either operating leases or finance leases for a lessee. Instead all leases are treated in a similar
way to finance leases applying IAS 17. Leases are ‘capitalised’ by recognising the present value of the lease payments
and showing them either as lease assets (right-of-use assets) or together with property, plant and equipment. If lease
payments are made over time, a company also recognises a financial liability representing its obligation to make future
lease payments. The most significant effect of the new requirements in IFRS 16 will be an increase in lease assets and
financial liabilities. Accordingly, for companies with material off balance sheet leases, there will be a change to key
financial metrics derived from the company’s assets and liabilities (for example, leverage ratios).
The above standards have not yet been endorsed by the EU.
1.3 Consolidation
Subsidiaries
Subsidiaries are all investees controlled by the Group. The Group controls an investee when it is exposed, or has rights, to variable
returns from its involvement with the investee and has the ability to affect those returns through its power over the investee.
Subsidiaries are fully consolidated from the date on which control is transferred to the Group.
The acquisition method of accounting is used to account for the acquisition of subsidiaries by the Group. The cost of an
acquisition is measured as the fair value of the assets given, equity instruments issued and liabilities incurred or assumed at the
date of exchange plus costs directly attributable to the acquisition. Identifiable assets acquired and liabilities and contingent
liabilities assumed in a business combination are measured initially at their fair values at the acquisition date, irrespective of the
extent of any non-controlling interest. The excess of the cost of acquisition over the fair value of the Group’s share of the
identifiable net assets acquired is recorded as goodwill. If the cost of acquisition is less than the fair value of the net assets of the
subsidiary acquired, the difference is recognised directly in the Statement of Comprehensive Income.
The parent company’s investments in subsidiaries are recorded at cost less, where appropriate, provision for impairment in value.
Inter-company transactions, balances and unrealised gains and losses on transactions between Group companies are eliminated.
Accounting policies of subsidiaries have been changed where necessary to ensure consistency with the policies adopted by the
Group.
Non-current assets held for sale and discontinued operations
Subsidiaries are de-consolidated from the date that control ceases. Under IFRS5, the Group classifies a non-current asset as held-
for-sale if its carrying amount will be recovered mainly through selling the asset rather than through usage. The classification also
applies to disposal groups, which are a group of assets and liabilities which an entity intends to dispose of in a single transaction.
The conditions for a non-current asset or disposal group to be classified as held-for-sale are as follows:
the assets must be available for immediate sale in their present condition and its sale must be highly probable;
the asset must be currently marketed actively at a price that is reasonable in relation to its current fair value;
the sale should be completed, or expected to be so, within a year from the date of the classification; and
the actions required to complete the planned sale will have been made, and it is unlikely that the plan will be significantly
changed or withdrawn.
1.4 Interest income and expense
Interest income and expense are recognised in the Statement of Comprehensive Income for all instruments measured at amortised
cost and held to maturity using the effective interest method.
The effective interest method calculates the amortised cost of a financial asset or a financial liability and allocates the interest
income or interest expense over the relevant period. The effective interest rate is the rate that discounts estimated future cash
payments or receipts through the expected life of the financial instrument or, when appropriate, a shorter period to the net carrying
amount of the financial asset or financial liability. When calculating the effective interest rate, the Group takes into account all
contractual terms of the financial instrument but does not consider future credit losses. The calculation includes all fees paid or
received between parties to the contract that are an integral part of the effective interest rate, transaction costs and all other
premiums or discounts.

Notes to the consolidated financial statements
SECURE TRUST BANK PLC 64
Once a financial asset or a group of similar financial assets has been written down as a result of an impairment loss, interest
income is recognised using the rate of interest used to discount the future cash flows for the purpose of measuring the impairment
loss.
1.5 Net fee and commission income
Fees and commissions which are not considered integral to the effective interest rate are generally recognised on an accruals basis
when the service has been provided. Fees and commissions income consists principally of weekly and monthly fees from the
OneBill and Current Account products, arrears fees in the Everyday Loans business along with associated insurance commissions
and commissions earned on debt collection activities in the Debt Managers business. Fee and commission expenses consist
primarily of fees and commission relating to the Current Account product.
1.6 Financial assets and financial liabilities
The Group classifies its financial assets at fair value through profit or loss, loans and receivables or held-to-maturity and classifies
its financial liabilities as other financial liabilities. Management determines the classification of its investments at initial
recognition. A financial asset or financial liability is measured initially at fair value plus, for an item not at fair value through
profit or loss, transaction costs that are directly attributable to its acquisition or issue.
(a) Financial assets at fair value through profit or loss
This category comprises derivative financial instruments which are utilised by the Group for hedging purposes. Financial assets at
fair value through profit or loss are initially recognised on the date from which the Group becomes a party to the contractual
provisions of the instrument. Subsequent measurement of financial assets held in this category are carried at fair value through
profit or loss.
(b) Loans and receivables
Loans and receivables are non-derivative financial assets with fixed or determinable payments that are not quoted in an active
market. They arise when the Group provides money, goods or services directly to a debtor with no intention of trading the
receivable. Loans are recognised when the funds are advanced to customers. Loans and receivables are carried at amortised cost
using the effective interest method (see below).
(c) Held-to-maturity
Held-to-maturity investments are non-derivative financial assets with fixed or determinable payments and fixed maturities that the
Group’s management has the positive intention and ability to hold to maturity. Held-to-maturity investments are carried at
amortised cost using the effective interest method.
(d) Other financial liabilities
Other financial liabilities are non-derivative financial liabilities with fixed or determinable payments. Other financial liabilities are
recognised when cash is received from the depositors. Other financial liabilities are carried at amortised cost using the effective
interest method. The fair value of other liabilities repayable on demand is assumed to be the amount payable on demand at the
Statement of Financial Position date.
Derecognition
Financial assets are derecognised when the rights to receive cash flows from the financial assets have expired or where the Group
has transferred substantially all of the risks and rewards of ownership. In transactions in which the Group neither retains nor
transfers substantially all the risks and rewards of ownership of a financial asset and it retains control over the asset, the Group
continues to recognise the asset to the extent of its continuing involvement, determined by the extent to which it is exposed to
changes in the value of the transferred asset. There have not been any instances where assets have only been partially
derecognised. The Group derecognises a financial liability when its contractual obligations are discharged, cancelled or expire.
Amortised cost measurement
The amortised cost of a financial asset or financial liability is the amount at which the financial asset or financial liability is
measured at initial recognition, minus principal payments, plus or minus the cumulative amortisation using the effective interest
method of any difference between the initial amount recognised and the maturity amount, minus any reduction for impairment.
Fair value measurement
Fair value is the price that would be received to sell an asset or paid to transfer a liability in an orderly transaction between market
participants at the measurement date. The fair value of assets and liabilities traded in active markets are based on current bid and
offer prices respectively. If the market for a financial instrument is not active the Group establishes a fair value by using an

Notes to the consolidated financial statements
SECURE TRUST BANK PLC 65
appropriate valuation technique. These include the use of recent arm's length transactions, reference to other instruments that are
substantially the same for which market observable prices exist, net present value and discounted cash flow analysis. 1.7 Foreign currencies
Transactions in foreign currencies are initially recorded at the rates of exchange prevailing on the dates of the transactions.
Monetary assets and liabilities denominated in foreign currencies are retranslated into the Company’s functional currency at the
rates prevailing on the balance sheet date. Exchange differences arising on the settlement of monetary items, and on the
retranslation of monetary items, are included in the profit and loss account for the period. 1.8 Derivative financial instruments and hedge accounting
For the Group, these comprise cash flow hedges. These are recognised at their fair value and are shown in the Statement of
Financial Position as assets when their face value is positive and as liabilities when their face value is negative.
Cash flow hedges are used to hedge against fluctuations in future cash flows from interest rate movements on variable rate
customer deposits. On initial purchase the derivative is valued at fair value and then the effective portion of the change in the fair
value of the hedging instrument is recognised in equity (cash flow hedging reserve) until the gain or loss on the hedged items is
realised, when it is amortised; the ineffective portion of the hedging instrument is recognised immediately in profit or loss.
On initial designation of the hedge, the Group formally documents the relationship between the hedging instruments and the
hedged items, including the risk management objective and strategy in undertaking the hedge, together with the method that will
be used to assess the effectiveness of the hedging relationship. The Group makes an assessment, both at the inception of the hedge
relationship as well as on an ongoing basis, as to whether the hedging instruments are expected to be highly effective in offsetting
the changes in the fair value or cash flows of the respective hedged items during the period for which the hedge is designated, and
whether the actual results of each hedge are within a range of 80-125%. The Group makes an assessment for a cash flow hedge of
a forecast transaction, as to whether the forecast transaction is highly probable to occur and presents an exposure to variations in
cash flows that could ultimately affect profit or loss.
If a hedging derivative expires or is sold, terminated, or exchanged, or the hedge no longer meets the criteria for cash flow hedge
accounting, or the hedge designation is revoked, then hedge accounting is discontinued prospectively. In a discontinued hedge of a
forecast transaction the cumulative amount recognised in other comprehensive income from the period when the hedge was
effective is reclassified from equity to profit or loss as a reclassification adjustment when the forecast transaction occurs and
affects profit or loss. If the forecast transaction is no longer expected to occur, then the balance in other comprehensive income is
reclassified immediately to profit or loss as a reclassification adjustment. 1.9 Offsetting financial instruments
Financial assets and liabilities are offset and the net amount reported in the Statement of Financial Position when there is a legally
enforceable right to offset the recognised amounts and there is an intention to settle on a net basis, or realise the asset and settle
the liability simultaneously.
1.10 Impairment of financial assets
Assets carried at amortised cost
On an ongoing basis the Group assesses whether there is objective evidence that a financial asset or group of financial assets is
impaired. Objective evidence is the occurrence of a loss event, after the initial recognition of the asset, that impacts on the
estimated future cash flows of the financial asset or group of financial assets, and can be reliably estimated.
The criteria that the Group uses to determine that there is objective evidence of an impairment loss include, but are not limited to,
the following:
Delinquency in contractual payments of principal or interest;
Breach of financial covenants or contractual obligations;
Cash flow difficulties experienced by the borrower; and
Initiation of bankruptcy proceedings.
If there is objective evidence that an impairment loss on loans and receivables or held-to-maturity investments carried at amortised
cost has been incurred, the amount of the loss is measured as the difference between the asset’s carrying amount and the present
value of estimated future cash flows discounted at the financial asset’s original effective interest rate. The carrying amount of the
asset is reduced through the use of an allowance account and the amount of the loss is recognised in the Statement of
Comprehensive Income. If a loan or held-to-maturity investment has a variable interest rate, the discount rate for measuring any
impairment loss is the current effective interest rate determined under the contract.

Notes to the consolidated financial statements
SECURE TRUST BANK PLC 66
The Group considers evidence of impairment for loans and advances at both a specific asset and collective level. All individually
significant loans and advances are assessed for specific impairment. Those found not to be specifically impaired are then
collectively assessed for any impairment that has been incurred but not yet identified. In assessing collective impairment the
Group uses historical trends of the probability of default, emergence period, the timing of recoveries and the amount of loss
incurred, adjusted for management’s judgement as to whether current economic and credit conditions are such that the actual
losses are likely to be significantly different to historic trends.
When a loan is uncollectible, it is written off against the related provision for loan impairment. Such loans are written off after all
the necessary procedures have been completed and the amount of the loss has been determined. Subsequent recoveries of amounts
previously written off decrease the amount of the provision for loan impairment in the Statement of Comprehensive Income.
A customer’s account may be modified to assist customers who are in or have recently overcome financial difficulties and have
demonstrated both the ability and willingness to meet the current or modified loan contractual payments. Loans that have
renegotiated or deferred terms, resulting in a substantial modification to the cash flows, are no longer considered to be past due
but are treated as new loans recognised at fair value, provided the customers comply with the renegotiated or deferred terms.
1.11 Intangible assets
(a) Goodwill
Goodwill represents the excess of the cost of the acquisition over the fair value of the Group’s share of the net identifiable assets
acquired at the date of acquisition. Goodwill is held at cost less accumulated impairment losses and is deemed to have an infinite
life.
The Group reviews the goodwill for impairment at least annually or when events or changes in economic circumstances indicate
that impairment may have taken place. Impairment losses are recognised in the Statement of Comprehensive Income if the
carrying amount exceeds the recoverable amounts.
(b) Computer software
Acquired computer software licences are capitalised on the basis of the costs incurred to acquire and bring to use the specific
software. These costs are amortised on the basis of the expected useful lives, which are between three to ten years.
Costs associated with developing or maintaining computer software programs are recognised as an expense as incurred unless it is
probable that the expenditure will enable the asset to generate future economic benefits in excess of its originally assessed
standard of performance.
(c) Other intangibles
The acquisition of subsidiaries is accounted for in accordance with IFRS 3 ‘Business Combinations’, which requires the
recognition of the identifiable assets acquired and liabilities assumed at their acquisition date fair values. As part of this process, it
is necessary to recognise certain intangible assets which are separately identifiable and which are not included on the acquiree’s
balance sheet.
Other intangible assets include trademarks, customer relationships, broker relationships and technology. The intangible assets
recognised as part of the Everyday Loans and V12 Finance Group acquisitions have been recorded at fair value and are being
amortised over their expected useful lives, which are between five and ten years, apart from Everyday Loans broker relationships,
which are being amortised over three years. The intangible asset relating to Everyday Loans has been reclassified as an asset held
for sale and has not been amortised since the conditional sale was agreed.
1.12 Property, plant and equipment
Property is held at historic cost as modified by subsequent revaluations less depreciation. The Group has elected under IAS 16.31
to measure its property at fair value. Revaluations are kept up to date such that the carrying amount does not differ materially from
its fair value as required by IAS 16.34. Revaluation of assets and any subsequent disposal are addressed through the revaluation
reserve and any changes are transferred to retained earnings.
Plant and equipment is stated at historical cost less depreciation. Historical cost includes expenditure that is directly attributable to
the acquisition of the items. Depreciation is calculated using the straight-line method to allocate their cost to their residual values
over their estimated useful lives, which are subject to regular review:

Notes to the consolidated financial statements
SECURE TRUST BANK PLC 67
Land not depreciated
Freehold buildings 50 years
Leasehold improvements shorter of life of lease or 7 years
Computer equipment 3 to 5 years
Other equipment 5 to 10 years
Gains and losses on disposals are determined by comparing proceeds with carrying amounts. These are included in the Statement
of Comprehensive Income.
1.13 Leases
(a) As a lessor
Assets leased to customers under agreements which transfer substantially all the risks and rewards of ownership, with or without
ultimate legal title, are classified as finance leases. When assets are held subject to finance leases, the present value of the lease
payments is recognised as a receivable. The difference between the gross receivable and the present value of the receivable is
recognised as unearned finance income. Lease income is recognised over the term of the lease using the net investment method,
which reflects a constant periodic rate of return.
(b) As a lessee
Rentals made under operating leases are recognised in the Statement of Comprehensive Income on a straight-line basis over the
term of the lease.
1.14 Cash and cash equivalents
For the purposes of the Statement of Cash Flows, cash and cash equivalents comprise cash in hand and demand deposits, and cash
equivalents comprise highly liquid investments which are convertible into cash with an insignificant risk of changes in value with
a maturity of three months or less at the date of acquisition, including certain loans and advances to banks and short-term highly
liquid debt securities.
1.15 Employee benefits
(a) Post-retirement obligations
The Group contributes to defined contribution schemes for the benefit of certain employees. The schemes are funded through
payments to insurance companies or trustee-administered funds at the contribution rates agreed with individual employees. The
Group has no further payment obligations once the contributions have been paid. The contributions are recognised as an employee
benefit expense when they are due. Prepaid contributions are recognised as an asset to the extent that a cash refund or a reduction
in the future payments is available. There are no post-retirement benefits other than pensions.
(b) Share-based compensation
The fair value of equity settled share-based payment awards are calculated at grant date and recognised over the period in which
the employees become unconditionally entitled to the awards (the vesting period). The amount is recognised as personnel
expenses in profit and loss, with a corresponding increase in equity. The Group adopts a Black-Scholes valuation model in
calculating the fair value of the share options as adjusted for an attrition rate of members of the scheme and a probability of pay-
out reflecting the risk of not meeting the terms of the scheme over the vesting period. The number of share options that are
expected to vest are reviewed at least annually.
The fair value of cash settled share-based payments is recognised as personnel expenses in the profit or loss with a corresponding
increase in liabilities over the vesting period. The liability is remeasured at each reporting date and at settlement date based on the
fair value of the options granted, with a corresponding adjustment to personnel expenses.
When share-based payments are changed from cash settled to equity settled and there is no change in the fair value of the
replacement award, it is seen as a modification to the terms and conditions on which the equity instruments were granted and is
not seen as the settlement and replacement of the instruments. Accordingly, the liability in the Statement of Financial Position is
reclassified to equity and the prospective charge to the profit or loss from the modification reflects the spreading of the initial
grant date fair value of the award over the remaining vesting period in line with the policy on equity settled awards.
1.16 Share issue costs
Incremental costs directly attributable to the issue of an equity instrument are deducted from the initial measurement of the equity
instruments. Costs associated with the listing of shares are expensed immediately.

Notes to the consolidated financial statements
SECURE TRUST BANK PLC 68
1.17 Taxation
Current income tax which is payable on taxable profits is recognised as an expense in the period in which the profits arise.
Deferred tax is provided in full on temporary differences arising between the tax bases of assets and liabilities and their carrying
amounts in the consolidated financial statements. Deferred tax is determined using tax rates (and laws) that have been enacted or
substantially enacted by the Statement of Financial Position date and are expected to apply when the related deferred tax asset is
realised or the deferred tax liability is settled.
Deferred tax assets and liabilities are offset if there is a legally enforceable right to offset current tax assets and liabilities, and they
relate to taxes levied by the same tax authority on the same taxable entity, or on different tax entities, when they intend to settle
current tax liabilities and assets on a net basis or their tax assets and liabilities will be realised simultaneously.
Deferred tax assets are recognised where it is probable that future taxable profits will be available against which the temporary
differences can be utilised.
1.18 Dividends
Dividends on ordinary shares are recognised in equity in the period in which they are approved.
1.19 Significant items
Items which are material by both size and nature (i.e. outside of the normal operating activities of the Group) are treated as
significant items and disclosed separately on the face of the Statement of Comprehensive Income. The separate reporting of these
items helps to provide an indication of the Group’s underlying business performance.
1.20 Funding for Lending Scheme
Under the applicable International Accounting Standard, IAS 39, if a security is lent under an agreement to return it to the
transferor, as is the case for eligible securities lent by institutions to the Bank of England under the FLS, then the security is not
derecognised because the transferor retains all the risks and rewards of ownership. The UK Treasury Bills borrowed from the
Bank of England under the FLS are not recognised on the Statement of Financial Position of the institution until such time as they
are subject to a repurchase agreement with a third party, as they will not meet the criteria for derecognition by the Bank of
England. When the UK Treasury Bills are pledged as part of a sale and repurchase agreement with a third party, amounts
borrowed from the third party are recognised on the Statement of Financial Position.

Notes to the consolidated financial statements
SECURE TRUST BANK PLC 69
2. Critical judgements and estimates
The Group makes certain judgements and estimates which affect the reported amounts of assets and liabilities. Critical judgements
and the assumptions used in calculating estimates are continually evaluated and are based on historical experience and other
factors, including expectations of future events that are believed to be reasonable under the circumstances.
2.1 Impairment losses on loans and advances to customers
The Group reviews its loan portfolios to assess impairment at least on a half-yearly basis. The basis for evaluating impairment
losses is described in accounting policy 1.10. In determining whether an impairment loss should be recorded in the Statement of
Comprehensive Income, the Group makes judgements as to whether there is any observable data indicating that there is a
measurable decrease in the estimated future cash flows from a portfolio of loans before the decrease can be identified with an
individual loan in that portfolio. This evidence may include observable data indicating that there has been an adverse change in
the payment status of borrowers in a group, or national or local economic conditions that correlate with defaults on assets in the
Group. Loans and advances are identified as impaired by taking account of the age of the debt’s delinquency and the product type.
The impairment provision is calculated by applying a percentage rate to the balance of different ages and categories of impaired
debt. The methodology and assumptions used for estimating both the amount and timing of future cash flows are reviewed
regularly to reduce any differences between loss estimates and recent actual loss experience.
Within the Real Estate Finance and Asset Finance businesses, accounts which are impaired are assessed against the discounted
cashflows expected to arise in order to identify any impairment provisions. Collective provisions are assessed only to the extent
that there is sufficient data to justify an inherent level of losses within the current portfolios.
For specific Invoice Finance clients assessment is made as to the collectability of outstanding invoices in relation to the amounts
lent against them. If there is a deficit against outstanding invoices then other security is considered in terms of value and
collectability. If there is an overall shortfall then the unsecured amount is assessed as to whether a provision is required. For
collective provisions a view of the overall level of non-collectability in the portfolio is taken. The level of provision required is
under review as the product is new to the Bank therefore data is developing, so we have estimated a level appropriate based on
other data available in the industry.
Where financial assets are individually evaluated for impairment, management uses their best estimates in calculating the net
present value of future cash flows. Management has to make judgements on the financial position of the counterparty and the net
realisable value of collateral (where held), in determining the expected future cash flows.
In assessing collective impairment the Group uses historical trends of the probability of default, the timing of recoveries and the
amount of loss incurred, adjusted for management’s judgement as to whether current economic and credit conditions are such that
the actual losses are likely to be significantly different to historic trends.
As described in Note 1.10, certain customers’ accounts may be modified to such an extent that they are no longer considered to be
past due but, rather, are treated as new loans. There is judgement involved in determining the level of modification that results in
this reassessment and with regard to the fair value at which the renegotiated loans are recorded. The Group makes these
judgements based on analyses of the loans involved and consideration of market rates of interest.
To the extent that the default rates differ from those estimated by 10%, the allowance for impairment on loans and advances
would change by an estimated £5.1 million.
2.2 Share Option Scheme valuations
The valuation of the equity settled Share Option Scheme was determined at the original grant date of 2 November 2011 using
Black-Scholes valuation models. In the opinion of the directors the terms of the scheme are such that there remains a number of
key uncertainties to be considered when calculating the probability of pay-out, which are set out below. The directors also
considered the probability of option holder attrition prior to the vesting dates, details of which are also set out below.
Uncertainties in the regulatory environment continue. Any tightening of capital requirements will impact on the ability of the
Company to exploit future market opportunities and furthermore may inhibit its ability to maintain the required growth in
distributions. Taking these into account, the probability of pay-out has been judged as 100% for the remaining share options
(SOS2) which vest on 2 November 2016.

Notes to the consolidated financial statements
SECURE TRUST BANK PLC 70
Although one participant in the Share Option Scheme left the Company during 2012 and was consequently withdrawn from the
Scheme, the directors consider that there is no further uncertainty surrounding whether the remaining participants will all still be
in situ and eligible at the vesting date. Therefore the directors have assumed no attrition rate for the remaining share options over
the scheme period.
The valuation of the cash settled Share Option Scheme was determined at 31 December 2015 using Black-Scholes valuation
models. In the opinion of the directors the terms of the scheme are such that there remains a number of key uncertainties to be
considered when calculating the probability of pay-out, which are considered to be similar to those set out above.
2.3 Average life of lending
IAS 39 requires interest earned from lending to be measured under the effective interest rate method. The effective interest rate is
the rate that exactly discounts estimated future cash receipts or payments through the expected life of the financial instrument or,
when appropriate, a shorter period to the net carrying amount of the financial asset.
Management must therefore use judgement to estimate the expected life of each instrument and hence the expected cash flows
relating to it. The accuracy of these estimates would therefore be affected by unexpected market movements resulting in altered
customer behaviour, inaccuracies in the models used compared to actual outcomes and incorrect assumptions.
2.4 PPI Provisioning
The Group provides for its best estimate of redress payable in respect of historical sales of PPI, by considering the likely future
uphold rate for claims, in the context of confirmed issues and historical experience. The likelihood of potential new claims is
projected forward to 2018, as management believe this to be an appropriate time horizon, recognising the significant decline in
recent claims experience and the increasing subjectivity beyond that. The accuracy of these estimates would be affected, were
there to be a significant change in either the number of future claims or, the incidence of claims upheld by the Financial
Ombudsman. The amounts are included within accruals.

Notes to the consolidated financial statements
SECURE TRUST BANK PLC 71
3. Maturity analysis of consolidated assets and liabilities
The table below shows the contractual maturity analysis of the Group's assets and liabilities as at 31 December 2015:
Due within
one year
Due after more than
one year Total
At 31 December 2015 £million £million £million
ASSETS
Cash and balances at central banks 131.8 - 131.8
Loans and advances to banks 9.8 - 9.8
Loans and advances to customers 439.7 520.9 960.6
Debt securities held-to-maturity 3.8 - 3.8
Property, plant and equipment - 8.5 8.5
Intangible assets - 7.0 7.0
Deferred tax assets - 0.3 0.3
Other assets 7.1 - 7.1
Assets held for sale 118.5 - 118.5
Total assets 710.7 536.7 1,247.4
LIABILITIES
Due to banks 35.0 - 35.0
Deposits from customers 563.3 469.8 1,033.1
Current tax liabilities 3.2 - 3.2
Other liabilities 22.5 3.7 26.2
Liabilities held for sale 8.7 - 8.7
Total liabilities 632.7 473.5 1,106.2
The table below shows the contractual maturity analysis of the Group's assets and liabilities as at 31 December 2014:
Due within
one year
Due after more than
one year Total
At 31 December 2014 £million £million £million
ASSETS
Cash and balances at central banks 81.2 - 81.2
Loans and advances to banks 39.8 - 39.8
Loans and advances to customers 220.7 401.8 622.5
Debt securities held-to-maturity 16.3 - 16.3
Property, plant and equipment - 8.1 8.1
Intangible assets - 8.2 8.2
Deferred tax assets 1.0 - 1.0
Other assets 5.2 - 5.2
Total assets 364.2 418.1 782.3
LIABILITIES
Due to banks 15.9 - 15.9
Deposits from customers 342.4 266.0 608.4
Current tax liabilities 3.6 - 3.6
Other liabilities 25.2 4.3 29.5
Total liabilities 387.1 270.3 657.4
The directors do not consider that the behavioural maturity is significantly different to the contractual maturity.
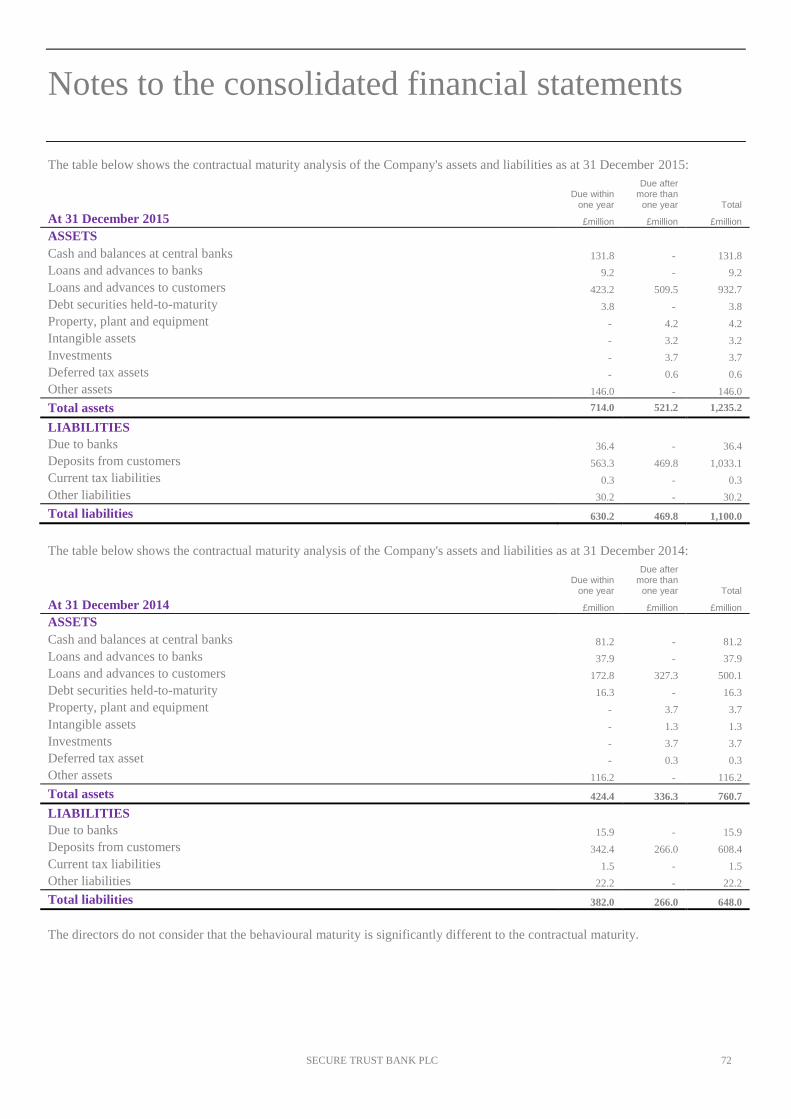
Notes to the consolidated financial statements
SECURE TRUST BANK PLC 72
The table below shows the contractual maturity analysis of the Company's assets and liabilities as at 31 December 2015:
Due within
one year
Due after more than
one year Total
At 31 December 2015 £million £million £million
ASSETS
Cash and balances at central banks 131.8 - 131.8
Loans and advances to banks 9.2 - 9.2
Loans and advances to customers 423.2 509.5 932.7
Debt securities held-to-maturity 3.8 - 3.8
Property, plant and equipment - 4.2 4.2
Intangible assets - 3.2 3.2
Investments - 3.7 3.7
Deferred tax assets - 0.6 0.6
Other assets 146.0 - 146.0
Total assets 714.0 521.2 1,235.2
LIABILITIES
Due to banks 36.4 - 36.4
Deposits from customers 563.3 469.8 1,033.1
Current tax liabilities 0.3 - 0.3
Other liabilities 30.2 - 30.2
Total liabilities 630.2 469.8 1,100.0
The table below shows the contractual maturity analysis of the Company's assets and liabilities as at 31 December 2014:
Due within
one year
Due after more than
one year Total
At 31 December 2014 £million £million £million
ASSETS
Cash and balances at central banks 81.2 - 81.2
Loans and advances to banks 37.9 - 37.9
Loans and advances to customers 172.8 327.3 500.1
Debt securities held-to-maturity 16.3 - 16.3
Property, plant and equipment - 3.7 3.7
Intangible assets - 1.3 1.3
Investments - 3.7 3.7
Deferred tax asset - 0.3 0.3
Other assets 116.2 - 116.2
Total assets 424.4 336.3 760.7
LIABILITIES
Due to banks 15.9 - 15.9
Deposits from customers 342.4 266.0 608.4
Current tax liabilities 1.5 - 1.5
Other liabilities 22.2 - 22.2
Total liabilities 382.0 266.0 648.0
The directors do not consider that the behavioural maturity is significantly different to the contractual maturity.

Notes to the consolidated financial statements
SECURE TRUST BANK PLC 73
4. Classification of financial assets and liabilities
The tables below set out the Group's financial assets and financial liabilities into the respective classifications:
Held to maturity
Loans and receivables
Other financial
assets and liabilities
Total carrying amount Fair value Fair value
hierarchy level At 31 December 2015 £million £million £million £million £million
Cash and balances at central banks - 131.8 - 131.8 131.8 Level 1
Loans and advances to banks - 9.8 - 9.8 9.8 Level 2
Loans and advances to customers - 960.6 - 960.6 960.6 Level 3
Debt securities held-to-maturity 3.8 - - 3.8 3.8 Level 1
Other financial assets - - 2.9 2.9 2.9 Level 3
Assets held for sale - - 118.5 118.5 118.5 Level 3
3.8 1,102.2 121.4 1,227.4 1,227.4
Due to banks - - 35.0 35.0 35.0 Level 2
Deposits from customers - - 1,033.1 1,033.1 1,033.1 Level 3
Other financial liabilities - - 13.8 13.8 13.8 Level 3
Liabilities held for sale - - 8.7 8.7 8.7 Level 3
- - 1,090.6 1,090.6 1,090.6
Held to maturity Loans and
receivables
Other financial
assets and liabilities
Total carrying amount Fair value Fair value
hierarchy level At 31 December 2014 £million £million £million £million £million
Cash - 81.2 - 81.2 81.2 Level 1
Loans and advances to banks - 39.8 - 39.8 39.8 Level 2
Loans and advances to customers - 622.5 - 622.5 630.1 Level 3
Debt securities held-to-maturity 16.3 - - 16.3 16.3 Level 1
16.3 743.5 - 759.8 767.4
Due to banks - - 15.9 15.9 15.9 Level 2
Deposits from customers - - 608.4 608.4 617.7 Level 3
Other financial liabilities - - 17.8 17.8 17.8 Level 3
- - 642.1 642.1 651.4
All assets and liabilities are carried at amortised cost. Therefore the fair value hierarchy noted above relates to the disclosure in
this note only.
The directors consider that the fair value of financial assets and liabilities is not materially different to their carrying value, with
the exception of assets and liabilities held for sale, which are disclosed in note 33.

Notes to the consolidated financial statements
SECURE TRUST BANK PLC 74
The tables below set out the Company's financial assets and financial liabilities into the respective classifications:
Held to maturity
Loans and receivables
Other financial
assets and liabilities
Total carrying amount Fair value Fair value
hierarchy level At 31 December 2015 £million £million £million £million £million
Cash and balances at central banks - 131.8 - 131.8 131.8 Level 1
Loans and advances to banks - 9.2 - 9.2 9.2 Level 2
Loans and advances to customers - 932.7 - 932.7 932.7 Level 3
Debt securities held-to-maturity 3.8 - - 3.8 3.8 Level 1
Other financial assets - - 142.7 142.7 142.7 Level 3
3.8 1,073.7 142.7 1,220.2 1,220.2
Due to banks - - 36.4 36.4 36.4 Level 2
Deposits from customers - - 1,033.1 1,033.1 1,033.1 Level 3
Other financial liabilities - - 8.3 8.3 8.3 Level 3
- - 1,077.8 1,077.8 1,077.8
Held to maturity Loans and
receivables
Other financial
assets and liabilities
Total carrying amount Fair value Fair value
hierarchy level At 31 December 2014 £million £million £million £million £million
Cash and balances at central banks - 81.2 - 81.2 81.2 Level 1
Loans and advances to banks - 37.9 - 37.9 37.9 Level 2
Loans and advances to customers - 500.1 - 500.1 507.6 Level 3
Debt securities held-to-maturity 16.3 - - 16.3 16.3 Level 1
16.3 619.2 - 635.5 643.0
Due to banks - - 15.9 15.9 15.9 Level 2
Deposits from customers - - 608.4 608.4 617.7 Level 3
Other financial liabilities - - 15.5 15.5 15.5 Level 3
- - 639.8 639.8 649.1
All assets and liabilities are carried at amortised cost. Therefore the fair value hierarchy noted above relates to the
disclosure in this note only
The directors consider that the fair value of assets and liabilities is not materially different to their carrying value.
Fair value classification
The tables above include the fair values and fair value hierarchies of the Group and Company’s financial assets and liabilities. The
Group measures fair value using the following fair value hierarchy that reflects the significance of the inputs used in making
measurements:
• Level 1: Quoted prices in active markets for identical assets or liabilities
• Level 2: Inputs other than quoted prices included within Level 1 that are observable for the asset or liability, either
directly (i.e. as prices) or indirectly (i.e. derived from prices).
• Level 3: Inputs for the asset or liability that are not based on observable market data (unobservable inputs).
Details of the measurement of the fair values is disclosed below:
Cash and balances at central banks
The fair value of cash and balances at central banks was calculated based upon the present value of the expected future principal
and interest cash flows. The rate used to discount the cash flows was the market rate of interest at the balance sheet date.
At the end of December 2015 the fair value of cash and balances at central banks was calculated to be equivalent to their carrying
value.

Notes to the consolidated financial statements
SECURE TRUST BANK PLC 75
Loans and advances to banks
The fair value of loans and advances to banks was calculated based upon the present value of the expected future principal and
interest cash flows. The rate used to discount the cash flows was the market rate of interest at the balance sheet date.
At the end of December 2015 the fair value of loans and advances to banks was calculated to be equivalent to their carrying value.
Loans and advances to customers
The fair value of loans and advances to customers was calculated based upon the present value of the expected future principal
and interest cash flows. Prudent assumptions were applied regarding the risk of default. The rate used to discount the cash flows
was the credit adjusted market rate of interest at the balance sheet date.
Debt securities held-to-maturity
The fair value of debt securities held-to-maturity was calculated based upon the present value of the expected future principal and
interest cash flows. The rate used to discount the cash flows was the market rate of interest at the balance sheet date.
At the end of December 2015 the fair value of debt securities held-to-maturity was calculated to be equivalent to their carrying
value.
Due to banks
The fair value of amounts due to banks was calculated based upon the present value of the expected future principal and interest
cash flows. The rate used to discount the cash flows was the market rate of interest at the balance sheet date.
At the end of December 2015 the fair value of amounts due to banks was calculated to be equivalent to their carrying value due to
the short maturity term of the amounts due.
Deposits from customers
The fair value of deposits from customers was calculated based upon the present value of the expected future principal and interest
cash flows. The rate used to discount the cash flows was the market rate of interest at the balance sheet date for the notice deposits
and deposit bonds, given that the Group offers competitive interest rates on its savings products.
Other financial liabilities
The fair value of other financial liabilities was calculated based upon the present value of the expected future principal cash flows.
At the end of December 2015 the fair value of other financial liabilities was calculated to be equivalent to their carrying value due
to the short maturity term of the other liabilities. The other financial liabilities include all other liabilities other than non-interest
accruals.

Notes to the consolidated financial statements
SECURE TRUST BANK PLC 76
5. Financial risk management
Strategy
By their nature, the Group’s activities are principally related to the use of financial instruments. The directors and senior
management of the Group have formally adopted a Group Risk Appetite Statement which sets out the Board’s attitude to risk and
internal controls. Key risks identified by the directors are formally reviewed and assessed at least once a year by the Board, in
addition to which key business risks are identified, evaluated and managed by operating management on an ongoing basis by
means of procedures such as physical controls, credit and other authorisation limits and segregation of duties. The Board also
receives regular reports on any risk matters that need to be brought to its attention. Significant risks identified in connection with
the development of new activities are subject to consideration by the Board. There are budgeting procedures in place and reports
are presented regularly to the Board detailing the results of each principal business unit, variances against budget and prior year,
and other performance data.
A more detailed description of the risk governance structure is contained in the Corporate Governance Statement beginning on
page 46.
The principal risks inherent in the Group’s business are credit, market, liquidity and operational risk.
(a) Credit risk
The Company and Group take on exposure to credit risk, which is the risk that a counterparty will be unable to pay amounts in full
when due. A formal Credit Risk Policy has been agreed by the Board whilst credit risk is monitored on a monthly basis by the
Credit Risk Committee which reviews performance of key portfolios including new business volumes, collections performance,
provisioning levels and provisioning methodology. A credit risk department within the Bank ensures that the Credit Risk Policy is
being adhered to, implements risk tools to manage credit risk and evaluates business opportunities and the risks and opportunities
they present to the Bank whilst ensuring the performance of the Bank’s existing portfolios is in line with expectations.
The Group structures the levels of credit risk it undertakes by placing limits on the amount of risk accepted in relation to
individual borrowers or groups of borrowers. Such risks are monitored on a revolving basis and subject to an annual or more
frequent review. The limits on the level of credit risk are approved periodically by the Board of Directors and actual exposures
against limits monitored daily.
Impairment provisions are provided for losses that have been incurred at the Statement of Financial Position date. Significant
changes in the economy could result in losses that are different from those provided for at the Statement of Financial Position
date. Management therefore carefully manages its exposures to credit risk as they consider this to be the most significant risk to
the business.
Exposure to credit risk is managed through regular analysis of the ability of borrowers and potential borrowers to meet interest
and capital repayment obligations and by changing these lending limits where appropriate. Exposure to credit risk is also managed
in part by obtaining collateral. The assets undergo a scoring process to mitigate risk and are monitored by the Board. Disclosures
relating to arrears on loans and advances to customers are disclosed in Note 13.
The Board monitors the ratings of the counterparties in relation to the Group’s loans and advances to banks. Disclosures of these
at the year end are contained in Note 12. There is no direct exposure to the Eurozone and peripheral Eurozone countries.
Motor Finance loans are secured against motor vehicles. The new SME lending products, Real Estate Finance and Asset Finance
loans, are secured against property and tangible assets respectively. Details of the collateral held in respect of these loans are
detailed in Note 13.

Notes to the consolidated financial statements
SECURE TRUST BANK PLC 77
The maximum exposure to credit risk for the Company and the Group was as follows:
Group Company
2015 2014 2015 2014
£million £million £million £million
Credit risk exposures relating to on-balance sheet assets are as follows:
Cash and balances at central banks 131.8 81.2 131.8 81.2
Loans and advances to banks 9.8 39.8 9.2 37.9
Loan and advances to customers 960.6 622.5 932.7 500.1
Debt securities held-to-maturity 3.8 16.3 3.8 16.3
Trade receivables 1.5 0.9 1.4 0.6
Amounts due from related companies 1.3 0.8 142.0 114.6
Assets held for sale 118.5 - - -
Credit risk exposures relating to off-balance sheet assets are as follows:
Loan commitments 138.6 96.0 138.6 96.0
At 31 December 1,365.9 857.5 1,359.5 846.7
The above table represents the maximum credit risk exposure (net of impairment) to the Company and Group at 31 December
2015 and 2014 without taking account of any collateral held or other credit enhancements attached. For on-balance-sheet assets,
the exposures are based on the net carrying amounts as reported in the Statement of Financial Position.
Concentration risk
Management assesses the potential concentration risk from geographic, product and individual loan concentration. Due to the well
diversified nature of the Group’s lending operations the directors do not consider there to be a material exposure arising from
concentration risk. The increase in lending balances and loan commitments in the London region is principally due to the increase
in Real Estate Finance activities during the year. This lending does not give rise to a material exposure due to the security held
against each individual loan. The concentration by product and location of the Group and Company’s lending to customers and
loan commitments are detailed below:

Notes to the consolidated financial statements
SECURE TRUST BANK PLC 78
Group
Loans and advances to customers
Loan commitments
2015 2015 2015 2014 2015 2014
Continuing operations
Discontinued operations Total Total
Continuing operations and Total Total
£million £million £million £million £million £million
Concentration by product:
Business lending
Real estate finance 368.0 - 368.0 133.8 109.0 95.8
Asset finance 70.7 - 70.7 4.5 20.1 -
Commercial finance 29.3 - 29.3 5.0 9.3 -
Unsecured lending:
Personal lending 74.3 114.3 188.6 181.4 - -
Motor 165.7 - 165.7 137.9 0.2 0.2
Retail 220.4 - 220.4 116.7 - -
Other 32.2 - 32.2 43.2 - -
At 31 December 960.6 114.3 1,074.9 622.5 138.6 96.0
Concentration by region:
East Anglia 89.4 10.4 99.8 41.3 28.1 7.2
East Midlands 41.4 11.3 52.7 36.0 1.1 -
London 300.6 17.0 317.6 177.5 55.0 41.6
North East 24.5 - 24.5 36.4 0.6 17.6
North West 73.4 7.6 81.0 60.9 4.9 -
Northern Ireland 8.3 15.6 23.9 8.6 - -
Scotland 62.7 3.0 65.7 42.4 2.0 -
South East 125.5 5.8 131.3 82.2 28.4 17.8
South West 44.2 8.4 52.6 34.7 4.4 10.5
Wales 35.1 5.3 40.4 25.7 1.4 -
West Midlands 59.0 4.9 63.9 44.1 4.0 1.3
Yorkshire and the Humber 52.4 13.5 65.9 32.7 3.0 -
Overseas 44.1 11.5 55.6 - 5.7 -
At 31 December 960.6 114.3 1,074.9 622.5 138.6 96.0
The above table relates to the location of the borrower. The majority of the overseas borrowers are Real Estate Finance clients.
All of the property secured against Real Estate Finance loans is based in the United Kingdom.

Notes to the consolidated financial statements
SECURE TRUST BANK PLC 79
Company
Loans and advances to
customers
Loan commitments
2015 2014 2015 2014
£million £million £million £million
Concentration by product:
Business lending
Real estate finance 368.0 133.7 109.0 95.8
Asset finance 70.7 4.5 20.1 -
Commercial finance 29.3 5.0 9.3 -
Unsecured lending:
Personal lending 74.3 87.6 - -
Motor 165.7 137.9 0.2 0.2
Retail 220.4 116.7 - -
Other 4.3 14.7 - -
At 31 December 932.7 500.1 138.6 96.0
Concentration by region:
East Anglia 87.0 35.6 28.1 7.2
East Midlands 39.4 24.7 1.1 -
London 297.5 149.3 55.0 41.6
North East 23.2 17.8 0.6 17.6
North West 69.9 43.5 4.9 -
Northern Ireland 7.8 6.0 - -
Scotland 59.5 36.0 2.0 -
South East 122.2 74.5 28.4 17.8
South West 42.6 29.2 4.4 10.5
Wales 33.5 20.6 1.4 -
West Midlands 56.4 32.4 4.0 1.3
Yorkshire and the Humber 50.0 30.5 3.0 -
Overseas 43.7 - 5.7 -
At 31 December 932.7 500.1 138.6 96.0
Forbearance
Secure Trust Bank does not reschedule contractual arrangements where customers default on their repayments. Under its Treating
Customers Fairly (TCF) policies, however, the Company may offer the customer the option to reduce or defer payments for a
short period. If the request is granted, the account continues to be monitored in accordance with the Group’s impairment
provisioning policy. Such debts retain the customer’s normal contractual payment due dates and will be treated the same as any
other defaulting cases for impairment purposes. Arrears tracking will continue on the account with any impairment charge being
based on the original contractual due dates for all products.
The Everyday Loans policy on forbearance is that a customer’s account may be modified to assist customers who are in or, have
recently overcome, financial difficulties and have demonstrated both the ability and willingness to meet the current or modified
loan contractual payments. These may be modified by way of a reschedule or deferment of repayments. Rescheduling of debts
retains the customers’ contractual due dates, whilst the deferment of repayments extends the payment schedule up to a maximum
of four payments in a twelve month period. As at 31 December 2015 the gross balance of rescheduled loans included in the
Consolidated Statement of Financial Position was £14.9 million, with an allowance for impairment on these loans of £1.0 million.
The gross balance of deferred loans was £3.4 million with an allowance for impairment on these of £0.6 million. (31 December
2014: the gross balance of rescheduled loans was £14.7 million, with an allowance for impairment of £1.0 million. The gross
balance of deferred loans was £3.0 million with an allowance for impairment of £0.4 million).

Notes to the consolidated financial statements
SECURE TRUST BANK PLC 80
(b) Market risk
Market risks arise from open positions in interest rate and currency products, all of which are exposed to general and specific
market movements. The Group and Company have no significant exposures to foreign currencies and therefore there is no
significant currency risk.
Interest rate risk
Interest rate risk is the potential adverse impact on the Company and Group’s future cash flows from changes in interest rates and
arises from the differing interest rate risk characteristics of the Company and Group’s assets and liabilities. In particular, fixed rate
savings and borrowing products expose the Group to the risk that a change in interest rates could cause either a reduction in
interest income or an increase in interest expense relative to variable rate interest flows. The Group seeks to ‘match’ interest rate
risk on either side of the Statement of Financial Position. However, this is not a perfect match and interest rate risk is present on
money market deposits of a fixed rate nature, fixed rate loans and fixed rate savings products. The Group monitors the interest rate
mismatch on a daily basis in conjunction with liquidity and capital.
The interest rate mismatch is monitored, throughout the maturity bandings of the book on a parallel scenario for 50 and 200 basis
points movements. The Group considers the 50 and 200 basis points movement to be appropriate for scenario testing given the
current economic outlook and industry expectations. This typically results in a pre-tax mismatch of £1.0m or less (2014: £0.8m or
less) for the Company and Group, with the same impact to equity pre-tax.
Interest rate sensitivity gap
The following tables summarise the re-pricing periods for the assets and liabilities in the Company and Group, including
derivative financial instruments which are principally used to hedge exposure to interest rate risk. Items are allocated to time
bands by reference to the earlier of the next contractual interest rate re-price and the maturity date.

Notes to the consolidated financial statements
SECURE TRUST BANK PLC 81
Group Within 3 months
More than 3 months
but less than 6
months
More than 6 months
but less than 1
year
More than 1 year but
less than 5 years
More than 5 years
Non interest bearing Total
As at 31 December 2015 £million £million £million £million £million £million £million
ASSETS
Cash and balances at central banks 131.8 - - - - - 131.8
Loans and advances to banks 9.8 - - - - - 9.8
Debt securities held-to-maturity 3.8 - - - - - 3.8
Loans and advances to customers 163.4 138.4 172.2 520.9 - (34.3) 960.6
Other assets - - - - - 22.9 22.9
Assets held for sale 118.5 - - - - - 118.5
Total assets 427.3 138.4 172.2 520.9 - (11.4) 1,247.4
LIABILITIES AND EQUITY
Due to banks - 35.0 - - - - 35.0
Deposits from customers 97.9 371.0 94.4 432.0 37.8 - 1,033.1
Other liabilities - - - - - 29.4 29.4
Liabilities held for sale 8.7 - - - - - 8.7
Equity - - - - - 141.2 141.2
Total liabilities and equity 106.6 406.0 94.4 432.0 37.8 170.6 1,247.4
Interest rate sensitivity gap 320.7 (267.6) 77.8 88.9 (37.8) (182.0)
Cumulative gap 320.7 53.1 130.9 219.8 182.0 -
Group Within 3 months
More than 3 months
but less than 6
months
More than 6 months
but less than 1
year
More than 1 year but
less than 5 years
More than 5 years
Non interest bearing Total
As at 31 December 2014 £million £million £million £million £million £million £million
ASSETS
Cash 81.2 - - - - - 81.2
Loans and advances to banks 24.8 15.0 - - - - 39.8
Loans and advances to customers 102.1 69.9 114.2 366.8 0.2 (30.7) 622.5
Debt securities held-to-maturity 16.3 - - - - - 16.3
Other assets - - - - - 22.5 22.5
Total assets 224.4 84.9 114.2 366.8 0.2 (8.2) 782.3
LIABILITIES AND EQUITY
Due to banks 15.9 - - - - - 15.9
Deposits from customers 248.9 18.2 37.3 236.5 29.7 37.8 608.4
Other liabilities - - - - - 33.1 33.1
Equity - - - - - 124.9 124.9
Total liabilities and equity 264.8 18.2 37.3 236.5 29.7 195.8 782.3
Impact of derivative instruments (20.0) 20.0 - - - -
Interest rate sensitivity gap (60.4) 86.7 76.9 130.3 (29.5) (204.0)
Cumulative gap (60.4) 26.3 103.2 233.5 204.0 -

Notes to the consolidated financial statements
SECURE TRUST BANK PLC 82
Company Within 3 months
More than 3 months
but less than 6
months
More than 6 months
but less than 1
year
More than 1 year but
less than 5 years
More than 5 years
Non interest bearing Total
As at 31 December 2015 £million £million £million £million £million £million £million
ASSETS
Cash and balances at central banks 131.8 - - - - - 131.8
Loans and advances to banks 9.2 - - - - - 9.2
Debt securities held-to-maturity 3.8 - - - - - 3.8
Loans and advances to customers 145.7 133.2 164.9 509.5 - (20.6) 932.7
Other assets - - - - - 157.7 157.7
Total assets 290.5 133.2 164.9 509.5 - 137.1 1,235.2
LIABILITIES AND EQUITY
Due to banks - 35.0 - - - 1.4 36.4
Deposits from customers 97.9 371.0 94.4 432.0 37.8 - 1,033.1
Other liabilities - - - - - 30.5 30.5
Equity - - - - - 135.2 135.2
Total liabilities and equity 97.9 406.0 94.4 432.0 37.8 167.1 1,235.2
Interest rate sensitivity gap 192.6 (272.8) 70.5 77.5 (37.8) (30.0)
Cumulative gap 192.6 (80.2) (9.7) 67.8 30.0 -
Company Within 3 months
More than 3 months
but less than 6
months
More than 6 months
but less than 1
year
More than 1 year but
less than 5 years
More than 5 years
Non interest bearing Total
As at 31 December 2014 £million £million £million £million £million £million £million
ASSETS
Cash and balances at central banks 81.2 - - - - - 81.2
Loans and advances to banks 22.9 15.0 - - - - 37.9
Loans and advances to customers 59.6 43.9 69.2 345.9 0.3 (18.8) 500.1
Debt securities held-to-maturity 16.3 - - - - - 16.3
Other assets - - - - - 125.2 125.2
Total assets 180.0 58.9 69.2 345.9 0.3 106.4 760.7
LIABILITIES AND EQUITY
Due to banks 15.9 - - - - - 15.9
Deposits from customers 248.9 18.2 37.3 236.5 29.7 37.8 608.4
Other liabilities - - - - - 23.7 23.7
Equity - - - - - 112.7 112.7
Total liabilities and equity 264.8 18.2 37.3 236.5 29.7 174.2 760.7
Impact of derivative instruments (20.0) 20.0 - - - -
Interest rate sensitivity gap (104.8) 60.7 31.9 109.4 (29.4) (67.8)
Cumulative gap (104.8) (44.1) (12.2) 97.2 67.8 -

Notes to the consolidated financial statements
SECURE TRUST BANK PLC 83
(c) Liquidity risk
Liquidity risk is the risk that the Group will encounter difficulty in meeting obligations associated with its financial liabilities that
are settled by delivering cash or another financial asset.
The Group’s approach to managing liquidity is to ensure, as far as possible, that it will always have sufficient liquidity to meet its
liabilities when due, under both normal and stressed conditions, without incurring unacceptable losses or risking damage to the
Group’s reputation. The liquidity requirements of the Group are met through withdrawing funds from its Bank of England
Reserve Account to cover any short-term fluctuations and, longer term funding to address any structural liquidity requirements.
The Company has a formal governance structure in place to manage and mitigate liquidity risk on a day to day basis. The Board
sets and approves the Company’s liquidity risk management strategy. The Assets and Liabilities Committee (‘ALCO’),
comprising senior executives of the Company, monitors liquidity risk. Key liquidity risk management information is reported by
the Treasury function and monitored by the Chief Executive Officer and Chief Financial Officer on a daily basis. The ALCO
meets monthly to review liquidity risk against set thresholds and risk indicators including early warning indicators, liquidity risk
tolerance levels and ILAAP metrics.
The Group relies on deposits from customers. During the current year the Company issued over £172 million of fixed rate deposit
bonds to customers over terms ranging from 1 to 7 years. These were issued to broadly match the term lending by the Company.
The PRA requires a firm to maintain at all times liquidity resources which are adequate, both as to amount and quality, to ensure
that there is no significant risk that its liabilities cannot be met as they fall due. There is also a requirement that a firm ensures its
liquidity resources contain an adequate buffer of high quality, unencumbered assets (i.e. Government Securities in the liquidity
asset buffer); and it maintains a prudent funding profile. The liquidity assets buffer is a pool of highly liquid assets that can be
called upon to create sufficient liquidity to meet liabilities on demand, particularly in a period of liquidity stress. The liquidity
resources outside the buffer must either be marketable assets with a demonstrable secondary market that the firm can access, or a
credit facility that can be activated in times of stress.
The Group has a Board approved ILAAP. The liquidity buffer required by the ILAAP has been put in place and maintained since
that time. Liquidity resources outside of the buffer are made up of deposits placed at the Bank of England. The ILAAP is updated
annually.
The Liquidity Coverage Ratio (LCR) regime has applied to the Group from 1 October 2015, requiring management of net 30 day
cash outflows as a proportion of high quality liquid assets. STB has set a more prudent internal limit. The actual LCR has
significantly exceeded both limits throughout the year.
The Group is exposed to daily calls on its available cash resources from current accounts, maturing deposits and loan draw-downs.
The Group maintains significant cash resources to meet all of these needs as they fall due.
The matching and controlled mismatching of the maturities and interest rates of assets and liabilities is fundamental to the
management of the Group. It is unusual for banks to be completely matched, as transacted business is often of uncertain term and
of different types.
The maturities of assets and liabilities and the ability to replace, at an acceptable cost, interest bearing liabilities as they mature are
important factors in assessing the liquidity of the Group and its exposure to changes in interest rates.
The key measure used by the Group for managing liquidity risk is the ratio of net liquid assets to deposits from customers. For this
purpose net liquid assets are considered to be loans and advances to banks and cash and balances at central banks. At the year end
this ratio was 14.1% (2014: 19.9%).

Notes to the consolidated financial statements
SECURE TRUST BANK PLC 84
The tables below analyse the contractual undiscounted cash flows for the Group's financial liabilities and assets into relevant
maturity groupings:
Carrying amount
Gross nominal
inflow/ (outflow)
Not more than 3
months
More than 3 months
but less than 1
year
More than 1 year but less than
5 years More than
5 years
At 31 December 2015 £million £million £million £million £million £million
Non-derivative financial liabilities
Due to banks (35.0) (35.0) (35.0) - - -
Deposits from customers (1,033.1) (1,078.0) (442.9) (142.7) (449.5) (42.9)
Other financial liabilities (13.8) (13.8) (13.8) - - -
Liabilities held for sale (8.7) (8.7) (8.7) - - -
(1,090.6) (1,135.5) (500.4) (142.7) (449.5) (42.9)
Non-derivative financial assets
Cash and balances at central banks 131.8 131.8 131.8 - - -
Loans and advances to banks 9.8 9.8 9.8 - - -
Debt securities held to maturity 3.8 3.8 3.8 - - -
Loans and advances to customers 960.6 1,194.5 130.8 335.6 728.1 -
Other financial assets 2.9 2.9 2.9 - - -
Assets held for sale 118.5 118.5 118.5
1,227.4 1,461.3 397.6 335.6 728.1 -
Liquidity mismatch 136.8 325.8 (102.8) 192.9 278.6 (42.9)
Carrying amount
Gross nominal
inflow/ (outflow)
Not more than 3
months
More than 3 months
but less than 1
year
More than 1 year but less than
5 years More than
5 years
At 31 December 2014 £million £million £million £million £million £million
Non-derivative financial liabilities
Due to banks (15.9) (15.9) (15.9) - - -
Deposits from customers (608.4) (635.2) (87.3) (257.6) (255.0) (35.3)
Other financial liabilities (17.8) (17.8) (17.8) - - -
(642.1) (668.9) (121.0) (257.6) (255.0) (35.3)
Non-derivative financial assets
Cash and balances at central banks 81.2 81.2 81.2 - - -
Loans and advances to banks 39.8 39.8 24.8 15.0 - -
Debt securities held to maturity 16.3 16.3 11.3 5.0 - -
Loans and advances to customers 622.5 788.4 109.9 186.2 486.1 6.2
759.8 925.7 227.2 206.2 486.1 6.2
Liquidity mismatch 117.7 256.8 106.2 (51.4) 231.1 (29.1)

Notes to the consolidated financial statements
SECURE TRUST BANK PLC 85
The tables below analyse the contractual undiscounted cash flows for the Company's financial liabilities and assets into relevant
maturity groupings:
Carrying amount
Gross nominal
inflow/ (outflow)
Not more than 3
months
More than 3 months but less than 1
year
More than 1 year but
less than 5 years
More than 5 years
At 31 December 2015 £million £million £million £million £million £million
Non-derivative financial liabilities
Due to banks (36.4) (36.4) (36.4) - - -
Deposits from customers (1,033.1) (1,078.0) (442.9) (142.7) (449.5) (42.9)
Other financial liabilities (8.3) (8.3) (8.3) - - -
(1,077.8) (1,122.7) (487.6) (142.7) (449.5) (42.9)
Non-derivative financial assets
Cash and balances at central banks 131.8 131.8 131.8 - - -
Loans and advances to banks 9.2 9.2 9.2 - - -
Debt securities held to maturity 3.8 3.8 3.8 - - -
Loans and advances to customers 932.7 1,160.9 127.1 321.7 712.1 -
Other assets 1.4 1.4 1.4 - - -
1,078.9 1,307.1 273.3 321.7 712.1 -
Liquidity mismatch 1.1 184.4 (214.3) 179.0 262.6 (42.9)
Carrying amount
Gross nominal
inflow/ (outflow)
Not more than 3
months
More than 3 months but less than 1
year
More than 1 year but
less than 5 years
More than 5 years
At 31 December 2014 £million £million £million £million £million £million
Non-derivative financial liabilities
Due to banks (15.9) (15.9) (15.9) - - -
Deposits from customers (608.4) (635.2) (87.3) (257.6) (255.0) (35.3)
Other financial liabilities (15.5) (15.5) (15.5) - - -
(639.8) (666.6) (118.7) (257.6) (255.0) (35.3)
Non-derivative financial assets
Cash and balances at central banks 81.2 81.2 81.2 - - -
Loans and advances to banks 37.9 37.9 22.9 15.0 - -
Loans and advances to customers 500.1 622.5 68.2 172.5 381.8 -
Debt securities held to maturity 16.3 16.3 11.3 5.0 - -
635.5 757.9 183.6 192.5 381.8 -
Liquidity mismatch (4.3) 91.3 64.9 (65.1) 126.8 (35.3)

Notes to the consolidated financial statements
SECURE TRUST BANK PLC 86
The maturities of assets and liabilities and the ability to replace, at an acceptable cost, interest bearing financial liabilities as they
mature are important factors in assessing the liquidity of the Company and Group and its exposure to changes in interest rates and
exchange rates.
Other financial liabilities, as shown above, do not include non-interest accruals as these are not classed as financial liabilities.
(d) Operational risk (unaudited)
Operational risk is the risk of direct or indirect loss arising from a wide variety of causes associated with the Group’s processes,
personnel, technology and infrastructure, and from external factors other than the risks identified above. Operational risks arise
from all of the Group’s operations.
The Group’s objective is to manage operational risk so as to balance the avoidance of financial losses and damage to the Group’s
reputation with overall cost effectiveness and innovation. In all cases, the Group’s policy requires compliance with all applicable
legal and regulatory requirements.
The Corporate Governance statement beginning on page 46 describes the Group’s system of internal controls which are used to
mitigate against operational risk. An operational risk department within the Bank also supports and provides assurance to the
business in recognising, assessing and managing risk. Compliance with Group standards is supported by a programme of periodic
reviews undertaken by an internal audit function. The results of the internal audit reviews are discussed with the Company’s
senior management with summaries submitted to the Group Audit Committee.

Notes to the consolidated financial statements
SECURE TRUST BANK PLC 87
6. Capital management
The Group’s capital management policy is focused on optimising shareholder value, in a safe and sustainable manner. There is a
clear focus on delivering organic growth and ensuring capital resources are sufficient to support planned levels of growth. The
Board regularly reviews the capital position.
In accordance with the EU's Capital Requirements Directive IV (CRD IV) and the required parameters set out in the EU’s Capital
Requirements Regulation (CRR), the Group’s Internal Capital Adequacy Assessment Process (ICAAP), which is aggregated into
the Arbuthnot Banking Group’s ICAAP, is embedded in the risk management framework of the Group and is subject to ongoing
updates and revisions when necessary. However, at a minimum, the ICAAP is updated annually as part of the business planning
process. The ICAAP is a process that brings together the management framework (i.e. the policies, procedures, strategies, and
systems that the Group has implemented to identify, manage and mitigate its risks) and the financial disciplines of business
planning and capital management.
Not all material risks can be mitigated by capital, but where capital is appropriate the Board has adopted a ‘Pillar 1 plus’ approach
to determine the level of capital the Group needs to hold. This method takes the Pillar 1 capital formula calculations (standardised
approach for credit, market and operational risk) as a starting point, and then considers whether each of the calculations delivers a
sufficient capital sum adequately to cover management’s anticipated risks. Where it is considered that the Pillar 1 calculations do
not reflect the risk, an additional capital add-on in Pillar 2 should be applied, as per the Individual Capital Guidance (ICG) issued
by the PRA.
Pillar 3 complements the minimum capital requirements (Pillar 1) and the supervisory review process (Pillar 2). Its aim is to
encourage market discipline by developing a set of disclosure requirements which would allow market participants to assess key
pieces of information on a firm’s capital, risk exposures and risk assessment processes. Pillar 3 disclosures for the Arbuthnot
Banking Group for the year ended 31 December 2015 are published as a separate document on the Arbuthnot Banking Group
website.
The following table shows the regulatory capital resources as managed by the solo-consolidated Group: 2015 2014
£million £million
Tier 1
Share capital 7.3 7.3
Share premium 79.3 79.3
Retained earnings 53.1 38.7
Revaluation reserve 0.2 0.2
Goodwill (0.3) (0.3)
Intangible assets net of attributable deferred tax (3.8) (2.8)
Deferred tax assets due to losses - (1.0)
Common Equity Tier 1 capital 135.8 121.4
Tier 2
Collective allowance for impairment of loans and advances 3.1 2.0
Total Tier 2 capital 3.1 2.0
Own Funds 138.9 123.4
Reconciliation to total equity:
Goodwill and other intangible assets net of attributable deferred tax 4.1 3.1
Collective allowance for impairment of loans and advances (3.1) (2.0)
Deferred tax assets due to losses - 1.0
Net cumulative profits/(losses) of non-solo consolidated entities 1.3 (0.6)
Total equity 141.2 124.9

Notes to the consolidated financial statements
SECURE TRUST BANK PLC 88
The Group forms part of the Arbuthnot Banking Group’s ICAAP which includes a summary of the capital required to mitigate the
identified risks in its regulated entities and the amount of capital that the Group has available. The PRA sets ICG for each UK
bank calibrated by reference to its Capital Resources Requirement, broadly equivalent to 8% of risk weighted assets and thus
representing the capital required under Pillar 1 of the Basel III framework. The ICAAP is a key input into the PRA's ICG setting
process, which addresses the requirements of Pillar 2 of the Basel III framework. The PRA's approach is to monitor the available
capital resources in relation to the ICG requirement. The Group maintains an extra internal buffer and capital ratios are reviewed
on a monthly basis to ensure that external and internal requirements are adhered to.
7. Net interest income
2015 2014
£million £million
Cash and balances at central banks 0.7 0.3
Loans and advances to banks 0.2 0.1
Loans and advances to customers 99.6 62.8
Debt securities held-to-maturity - 0.2
Interest receivable and similar income 100.5 63.4
Deposits from customers (21.6) (14.2)
Interest expense and similar charges (21.6) (14.2)
Net interest income 78.9 49.2
Net interest income shown above excludes £39.2 million (2014: £30.2 million) of interest on loans and advances to customers in
respect of discontinued operations, as shown in note 33.
In the previous year £0.2 million of interest income arising from debt securities held-to-maturity was included as interest income
on loans and advances to banks.

Notes to the consolidated financial statements
SECURE TRUST BANK PLC 89
8. Operating expenses
2015 2015 2015 2014 2014 2014
Continuing Discontinued Total Continuing Discontinued Total
£million £million £million £million £million £million
Staff costs, including those of directors:
Wages and salaries 24.7 10.0 34.7 16.4 9.3 25.7
Social security costs 2.6 1.1 3.7 1.3 1.1 2.4
Pension costs 0.7 0.6 1.3 0.4 0.5 0.9
Share based payment transactions 1.4 - 1.4 1.5 - 1.5
Depreciation of property, plant and equipment (Note
18) 0.5 0.1 0.6 0.4 0.1 0.5
Amortisation of intangible assets (Note 16) 1.4 0.9 2.3 1.2 1.3 2.5
Operating lease rentals 1.2 0.8 2.0 0.7 0.9 1.6
Other administrative expenses 18.0 7.7 25.7 15.6 5.8 21.4
Total operating expenses 50.5 21.2 71.7 37.5 19.0 56.5
2015 2014
Remuneration of the auditor and its associates, excluding VAT, was as follows: £'000 £'000
Fees payable to the Company's auditor for the audit of the Company's annual accounts 190 138
Fees payable to the Company's auditor for other services:
The audit of the Company's subsidiaries, pursuant to legislation 122 115
Audit related assurance services 21 17
Tax advisory services 49 47
Corporate finance services - 115
All other non-audit services 146 292
528 724
All other non-audit services incurred during 2014 included £183,000 relating to advice received on the transitioning of consumer
credit licencing from the Office of Fair Trading to the Financial Conduct Authority.
9. Average number of employees
2015 2014
Directors 7 7
Management 78 69
Administration 621 532
Total 706 608

Notes to the consolidated financial statements
SECURE TRUST BANK PLC 90
10. Income tax expense
2015 2015 2015 2014 2014 2014
Continuing operations
Discontinued operations Total
Continuing operations
Discontinued operations Total
Current taxation £million £million £million £million £million £million
Corporation tax charge - current year 5.4 2.5 7.9 3.3 1.9 5.2
Corporation tax charge - adjustments in respect of
prior years 0.6 (1.0) (0.4) - - -
6.0 1.5 7.5 3.3 1.9 5.2
Deferred taxation
Deferred tax charge - current year (0.5) (0.1) (0.6) 0.2 - 0.2
Deferred tax charge - adjustments in respect of prior
years - 0.9 0.9 0.1 0.1 0.2
(0.5) 0.8 0.3 0.3 0.1 0.4
Income tax expense 5.5 2.3 7.8 3.6 2.0 5.6
Tax reconciliation
Profit before tax 24.8 11.7 36.5 17.5 8.6 26.1
Tax at 20.25% (2014: 21.5%) 5.0 2.4 7.4 3.8 1.8 5.6
Permanent differences (0.3) - (0.3) (0.2) - (0.2)
Prior period adjustments 0.8 (0.1) 0.7 - 0.2 0.2
Income tax expense for the year 5.5 2.3 7.8 3.6 2.0 5.6
At 31 December 2015 the Group had accumulated tax losses of £nil (2014: £5.0 million). These tax losses were recovered in the
current year, consequently the Group has no longer recognised a deferred tax asset (2014: £1.0 million).
On 2 July 2013 the Government substantively enacted a reduction in the main rate of UK corporation tax from 23% to 21% with
effect from 1 April 2014 and then from 21% to 20% with effect from 1 April 2015. Further reductions to 19% (effective from 1
April 2017) and to 18% (effective 1 April 2020) were substantively enacted on 26 October 2015.This will reduce the Company’s
future current tax charge accordingly.
11. Earnings per ordinary share
Basic
Basic earnings per ordinary share are calculated by dividing the profit attributable to equity holders of the parent of £28.7 million
(2014: £20.5 million) by the weighted average number of ordinary shares 18,191,894 (2014: 16,725,876) in issue during the year.
Diluted
Diluted earnings per ordinary share are calculated by dividing the profit attributable to equity holders of the parent of £28.7
million (2014: £20.5 million) by the weighted average number of ordinary shares in issue during the year, as noted above, as well
as the number of dilutive share options in issue during the year.
The number of dilutive shares in issue at the year end was 352,147, being based on the number of options granted of 460,419, the
exercise price of 720 pence per option and the average share price during the year of 3,061.75 pence.

Notes to the consolidated financial statements
SECURE TRUST BANK PLC 91
12. Loans and advances to banks
2015 2014
Group £million £million
Placements with banks included in cash and cash equivalents (Note 28) 9.8 24.8
Other loans and advances to banks - 15.0
9.8 39.8
Included within loans and advances to banks are amounts placed with Arbuthnot Latham & Co., Limited, a related company, of
£5.3 million (31 December 2014: £20.0 million).
Moody's long-term ratings: 2015 2014
Group £million £million
A1 0.1 -
A2 (1.4) 19.8
A3 5.8 -
No rating 5.3 20.0
9.8 39.8
The £1.4 million negative balance above represents an overdraft attributable to continuing operations. When amounts included in
loans and advances to banks attributable to discontinued operations are taken into account, the overall balance is in credit.
2015 2014
Company £million £million
Placements with banks included in cash and cash equivalents 3.9 22.9
Other loans and advances to banks included in cash and cash equivalents 5.3 -
Cash and cash equivalents (Note 28) 9.2 22.9
Other loans and advances to banks - 15.0
9.2 37.9
Moody's long-term ratings: 2015 2014
Company £million £million
A1 0.1 -
A2 - 17.9
A3 3.8 -
No rating 5.3 20.0
9.2 37.9
None of the loans and advances to banks are either past due or impaired.

Notes to the consolidated financial statements
SECURE TRUST BANK PLC 92
13. Loans and advances to customers
2015 2014
Group £million £million
Gross loans and advances 994.9 656.6
Less: allowances for impairment on loans and advances (Note 14) (34.3) (34.1)
960.6 622.5
The fair value of loans and advances to customers is shown in Note 4. For a maturity profile of loans and advances to customers,
refer to Note 3.
Loans and advances to customers include finance lease receivables as follows:
2015 2014
Group £million £million
Gross investment in finance lease receivables:
- No later than 1 year 121.4 80.2
- Later than 1 year and no later than 5 years 244.0 164.4
- Later than 5 years 0.9 -
366.3 244.6
Unearned future finance income on finance leases (109.0) (81.2)
Net investment in finance leases 257.3 163.4
The net investment in finance leases may be analysed as follows:
- No later than 1 year 73.3 46.0
- Later than 1 year and no later than 5 years 183.2 117.4
- Later than 5 years 0.8 -
257.3 163.4
Loans and advances to customers can be further summarised as follows:
2015 2015 2014 2014
Group £million % £million %
Neither past due nor impaired 939.1 94.4% 581.9 88.7%
Past due but not impaired - 0.0% 0.3 0.0%
Past due up to 90 days and impaired 24.8 2.5% 30.3 4.6%
Past due after 90 days and impaired 31.0 3.1% 44.1 6.7%
Gross 994.9 100.0% 656.6 100.0%
Less: allowance for impairment (34.3) (34.1)
Net 960.6 622.5
Gross amounts of loans and advances to customers that were past due up to 90 days were as follows:
2015 2014
Group £million £million
Past due up to 30 days 16.5 22.6
Past due 30 - 60 days 5.5 5.3
Past due 60 - 90 days 2.8 2.7
Total 24.8 30.6
Interest income on loans classified as impaired totalled £6.0 million (31 December 2014: £3.1 million).

Notes to the consolidated financial statements
SECURE TRUST BANK PLC 93
2015 2014
Company £million £million
Gross loans and advances 953.3 518.1
Less: allowances for impairment on loans and advances (Note 14) (20.6) (18.0)
932.7 500.1
The fair value of loans and advances to customers is shown in Note 4.
For a maturity profile of loans and advances to customers, refer to Note 3.
2015 2014
Company £million £million
Gross investment in finance lease receivables
No later than 1 year 103.9 61.9
Later than 1 year and no later than 5 years 232.3 151.4
Later than 5 years 0.9 -
337.1 213.3
Unearned future finance income on finance leases (103.3) (75.4)
Net investment in finance leases 233.8 137.9
The net investment in finance leases may be analysed as follows:
No later than 1 year 60.3 32.1
Later than 1 year and no later than 5 years 172.7 105.8
Later than 5 years 0.8 -
233.8 137.9
The prior year finance lease receivables have been restated, as certain of the Company's loans and advances to customers have been
reclassified as finance leases. These changes had no effect on net assets or profits of the prior period.
Loans and advances to customers can be further summarised as follows:
2015 2015 2014 2014
Company £million % £million %
Neither past due nor impaired 916.0 96.1% 461.7 89.1%
Past due up to 90 days and impaired 24.5 2.6% 26.2 5.1%
Past due after 90 days and impaired 12.8 1.3% 30.2 5.8%
Gross 953.3 100.0% 518.1 100.0%
Less: allowance for impairment (20.6) (18.0)
Net 932.7 500.1
Gross amounts of loans and advances to customers that were past up to 90 days were as follows:
2015 2014
Company £million £million
Past due up to 30 days 16.3 20.4
Past due 30 - 60 days 5.5 4.0
Past due 60 - 90 days 2.7 1.8
Total 24.5 26.2
The majority of the loans are unsecured personal loans with an average size at inception of £5,000; therefore the portfolio does not
have a significant concentration to any individuals, sectors or geographic locations.
At 31 December 2015 loans and advances to customers of £56.4 million were pre-positioned under the Bank of England’s
Funding for Lending Scheme and were available for use as collateral within the scheme (2014: £11.5 million).

Notes to the consolidated financial statements
SECURE TRUST BANK PLC 94
At 31 December 2015, £36.0 million of UK Treasury Bills were drawn under the Funding for Lending Scheme (2014: £15.0
million). During the year, these Treasury Bills were pledged as part of a sale and repurchase agreement with an original maturity
period of six months (2014: three months). Monies arising as a result are disclosed in note 21.
£0.2 million (2014: £0.2 million) is a standard mortgage loan secured upon residential property and this is neither past due nor
impaired. The residential property over which the mortgage loan is secured has a fair value of £0.2 million based on other recent
property sales, and a loan to value ratio of 72% (2014: 76%).
£368.0 million (2014: £133.7 million) of the loans are secured upon residential or commercial property and these are neither past
due nor impaired. All loans secured are at a loan to value ratio of less than 80%. All property valuations at loan inception, and the
majority of development stage valuations, are performed by independent Chartered Surveyors, who perform their work in
accordance with the Royal Institution of Chartered Surveyors Valuation – Professional Standards.
£165.7 million (2014: £137.9 million) of the loans are secured against motor vehicles where the security is discharged when the
buyer exercises an option to buy the goods at a predetermined price at the end of the loan term. Management’s estimate of the fair
value of the motor vehicles was £127.1 million (2014: £109.5 million), giving a loan to value ratio of 130.4% (2014: 125.9%).

Notes to the consolidated financial statements
SECURE TRUST BANK PLC 95
14. Allowances for impairment of loans and advances
A reconciliation of the allowance accounts for losses on loans and advances is as follows:
Group 2015 2014
Specific allowances for impairment £million £million
At 1 January 32.1 25.5
Provision for impairment losses 24.3 15.1
Loans written off during the year as uncollectible (19.4) (8.5)
Transfer to assets held for sale (4.7) -
At 31 December 32.3 32.1
Collective allowances for impairment
At 1 January 2.0 1.6
Provision for impairment losses 1.1 0.4
Transfer to assets held for sale (1.1) -
At 31 December 2.0 2.0
Total allowances for impairment 34.3 34.1
Company 2015 2014
Specific allowances for impairment £million £million
At 1 January 16.9 21.9
Provision for impairment losses 16.5 8.5
Release of allowance for impairment on the sale of debt (12.1) (12.5)
Loans written off during the year as uncollectible (2.8) (1.0)
At 31 December 18.5 16.9
Collective allowances for impairment
At 1 January 1.1 1.0
Provision for impairment losses 1.0 0.1
At 31 December 2.1 1.1
Total allowances for impairment 20.6 18.0
15. Debt securities held-to-maturity
Debt securities of £3.8 million (31 December 2014: £16.3 million) represent UK Treasury Bills. The Group’s intention is to hold
them to maturity and, therefore, they are stated in the Statement of Financial Position at amortised cost.
All of the debt securities held-to-maturity had a rating agency designation at 31 December 2015, based on Moody’s long-term
ratings of Aa1. None of the debt securities held-to-maturity are either past due or impaired.

Notes to the consolidated financial statements
SECURE TRUST BANK PLC 96
16. Intangible assets
Goodwill Computer
software
Other intangible
assets Total
Group £million £million £million £million
Cost or valuation
At 1 January 2014 1.0 6.5 7.3 14.8
Additions - 0.8 - 0.8
At 31 December 2014 1.0 7.3 7.3 15.6
Additions - 2.3 - 2.3
Transfer to assets held for disposal - (0.3) (5.1) (5.4)
At 31 December 2015 1.0 9.3 2.2 12.5
Accumulated amortisation
At 1 January 2014 - (2.7) (2.2) (4.9)
Amortisation charge - (1.1) (1.4) (2.5)
At 31 December 2014 - (3.8) (3.6) (7.4)
Amortisation charge - (1.2) (1.1) (2.3)
Transfer to assets held for disposal - 0.2 4.0 4.2
At 31 December 2015 - (4.8) (0.7) (5.5)
Net book amount
At 31 December 2014 1.0 3.5 3.7 8.2
At 31 December 2015 1.0 4.5 1.5 7.0
Goodwill Computer
software Total
Company £million £million £million
Cost or valuation
At 1 January 2014 0.3 2.6 2.9
Additions - 0.7 0.7
At 31 December 2014 0.3 3.3 3.6
Additions - 2.2 2.2
At 31 December 2015 0.3 5.5 5.8
Accumulated amortisation
At 1 January 2014 - (2.0) (2.0)
Amortisation charge - (0.3) (0.3)
At 31 December 2014 - (2.3) (2.3)
Amortisation charge - (0.3) (0.3)
At 31 December 2015 - (2.6) (2.6)
Net book amount
At 31 December 2014 0.3 1.0 1.3
At 31 December 2015 0.3 2.9 3.2
An annual impairment review is undertaken on the carrying value of the Group’s intangible assets to determine whether an
impairment event has occurred.

Notes to the consolidated financial statements
SECURE TRUST BANK PLC 97
17. Investments
Shares at
cost Impairment provisions
Net investments
Company £million £million £million
At 31 December 2014 and 1 January 2014 3.7 - 3.7
At 31 December 2015 3.7 - 3.7
Shares in subsidiary undertakings of Secure Trust Bank plc at 31 December 2015 are stated at cost less any provision for
impairment. All subsidiary undertakings are unlisted and none are banking institutions. The subsidiary undertakings were all
incorporated in the UK and wholly owned via Ordinary shares. All subsidiary undertakings are included in the consolidated
financial statements and have an accounting reference date of 31 December.
Details are as follows:
Principal activity
Owned directly
Debt Managers (Services) Limited Debt collection company
Everyday Loans Holdings Limited* Holding company
Secure Homes Services Limited Property rental
STB Leasing Limited Leasing
V12 Finance Group Limited Holding company
Owned indirectly via intermediate holding companies
Everyday Loans Limited* Sourcing and servicing of unsecured and secured loans
Everyday Lending Limited* Provider of unsecured and secured loans
V12 Personal Finance Limited Dormant
V12 Retail Finance Limited Sourcing and servicing of unsecured loans
*Included in assets held for sale.

Notes to the consolidated financial statements
SECURE TRUST BANK PLC 98
18. Property, plant and equipment
Freehold land and buildings
Leasehold improvements
Computer and other
equipment Total
Group £million £million £million £million
Cost or valuation
At 1 January 2014 4.4 0.4 8.9 13.7
Additions 2.7 - 0.9 3.6
Disposals - - (0.5) (0.5)
At 31 December 2014 7.1 0.4 9.3 16.8
Additions - 0.2 1.2 1.4
Transfer to assets held for disposal - (0.6) (0.4) (1.0)
At 31 December 2015 7.1 - 10.1 17.2
Accumulated depreciation
At 1 January 2014 (0.4) (0.2) (8.1) (8.7)
Depreciation charge (0.1) (0.1) (0.3) (0.5)
Disposals - - 0.5 0.5
At 31 December 2014 (0.5) (0.3) (7.9) (8.7)
Depreciation charge (0.1) (0.1) (0.4) (0.6)
Transfer to assets held for disposal - 0.4 0.2 0.6
At 31 December 2015 (0.6) - (8.1) (8.7)
Net book amount
At 31 December 2014 6.6 0.1 1.4 8.1
At 31 December 2015 6.5 - 2.0 8.5
Freehold property
Computer and other
equipment Total
Company £million £million £million
Cost
At 1 January 2014 - 8.5 8.5
Additions 2.7 0.7 3.4
Disposals - (0.5) (0.5)
At 31 December 2014 2.7 8.7 11.4
Additions - 0.8 0.8
At 31 December 2015 2.7 9.5 12.2
Accumulated depreciation
At 1 January 2014 - (8.0) (8.0)
Depreciation charge - (0.2) (0.2)
Disposals - 0.5 0.5
At 31 December 2014 - (7.7) (7.7)
Depreciation charge - (0.3) (0.3)
At 31 December 2015 - (8.0) (8.0)
Net book amount
At 31 December 2014 2.7 1.0 3.7
At 31 December 2015 2.7 1.5 4.2

Notes to the consolidated financial statements
SECURE TRUST BANK PLC 99
The Group’s freehold properties are the Registered Office of the Company, which is fully utilised for the Group’s own purposes,
and Secure Trust House, Boston Drive, Bourne End SL8 5YS, the majority of which is also used for the Group’s own purposes.
The directors have assessed the value of the Group’s freehold property at the year-end through comparison to current rental yields
on similar properties in the same area and do not believe that the fair value of freehold property is materially different from its
carrying value.
The carrying value of freehold land which is included in the total carrying value of freehold land and buildings and which is not
depreciated is £1.7 million (2014: £1.7 million).
The historical cost of freehold property included at valuation is as follows:
2015 2014
£million £million
Cost 7.5 7.5
Accumulated depreciation (1.3) (1.2)
Net book amount 6.2 6.3
19. Derivative financial instruments In order to protect its floating rate deposit book from increases in Bank of England base rates above 1.5%, the Group entered into
an interest rate cap on 30 June 2011, with a notional amount of £20 million and a maturity date of 30 June 2015. The losses
recognised in other comprehensive income in relation to the interest rate cap previously are not expected to be recovered in future
periods, therefore they were been transferred to profit or loss in 2014. The Moody’s long term rating of the counterparty was A2.
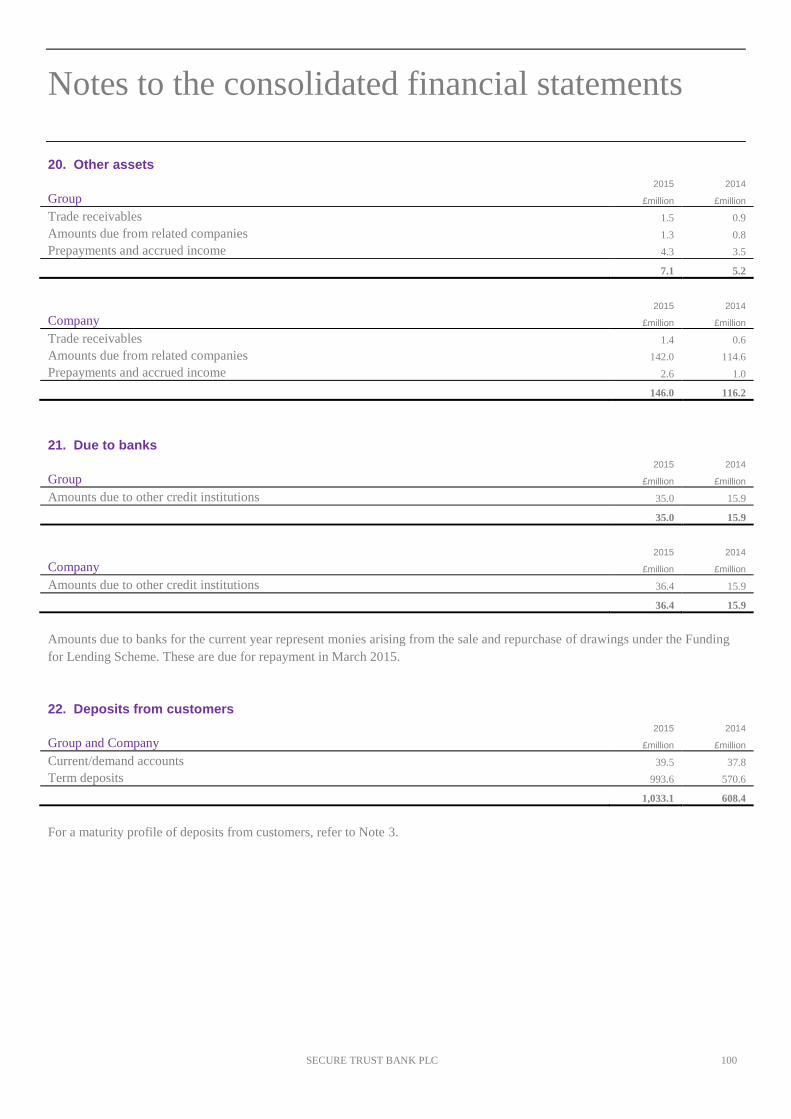
Notes to the consolidated financial statements
SECURE TRUST BANK PLC 100
20. Other assets
2015 2014
Group £million £million
Trade receivables 1.5 0.9
Amounts due from related companies 1.3 0.8
Prepayments and accrued income 4.3 3.5
7.1 5.2
2015 2014
Company £million £million
Trade receivables 1.4 0.6
Amounts due from related companies 142.0 114.6
Prepayments and accrued income 2.6 1.0
146.0 116.2
21. Due to banks
2015 2014
Group £million £million
Amounts due to other credit institutions 35.0 15.9
35.0 15.9
2015 2014
Company £million £million
Amounts due to other credit institutions 36.4 15.9
36.4 15.9
Amounts due to banks for the current year represent monies arising from the sale and repurchase of drawings under the Funding
for Lending Scheme. These are due for repayment in March 2015.
22. Deposits from customers
2015 2014
Group and Company £million £million
Current/demand accounts 39.5 37.8
Term deposits 993.6 570.6
1,033.1 608.4
For a maturity profile of deposits from customers, refer to Note 3.

Notes to the consolidated financial statements
SECURE TRUST BANK PLC 101
23. Other liabilities
2015 2014
Group £million £million
Trade payables 13.8 10.9
Amounts due to related companies 0.1 0.3
Accruals and deferred income 12.3 18.3
26.2 29.5
2015 2014
Company £million £million
Trade payables 8.3 4.2
Amounts due to related companies 10.4 4.6
Accruals and deferred income 11.5 13.4
30.2 22.2
Within Group trade payables at 31 December 2015 there is £3.7 million (2014: £4.3 million) collateral held from RentSmart. The
Group buys assets which are then leased to customers of RentSmart and the Group pays RentSmart a commission, which is
recognised within operating income. In return, RentSmart continues to operate the agreement, retains the credit risk and provides
the Group with a collateral amount that is based upon the balance of customer receivables and expected new agreements during
the following month.
Within Group and Company accruals and deferred income there is £nil million relating to accrued interest payable (2014: £6.6
million).
Financial Ombudsman Scheme accrual
The Company’s FOS accrual reflects a provision for outstanding potential PPI claims of £2.6m (2014: £2.0m) as at 31 December
2015. The increase in provision is a result of new claims emerging following an extension of the deadline for making claims.
The FCA are currently consulting on a proposed deadline for making PPI claims. The ruling is expected to come into force in
Spring 2016 with a deadline of 2 years from the ruling, which would give consumers until Spring 2018 to make a claim.
Financial Services Compensation Scheme Levy
In common with all regulated UK deposit takers, the Company pays levies to the Financial Services Compensation Scheme
(‘FSCS’) to enable the FSCS to meet claims against it. The FSCS levy consists of two parts: a management expenses levy and a
more significant compensation levy. The management expenses levy covers the costs of running the scheme and the compensation
levy covers the amount of compensation and associated interest the scheme pays, net of any recoveries it makes using the rights
that have been assigned to it.
The Company’s FSCS provision reflects market participation up to the reporting date and the accrual of £0.2 million relates to the
interest levy for the scheme year 2015/16 which is payable in September 2016. This amount was calculated on the basis of the
Company’s share of protected deposits and the FSCS’s estimate of total interest levies payable for each scheme year. The loan
repayment relating to the scheme year 2015/16 was paid by the Company in September 2015.

Notes to the consolidated financial statements
SECURE TRUST BANK PLC 102
24. Deferred taxation
2015 2014
Group £million £million
Deferred tax liabilities:
Unrealised surplus on revaluation of freehold property 0.2 0.2
Other short term timing differences (0.2) (0.2)
Deferred tax assets:
Other short term timing differences 0.3 -
Carried forward losses - 1.0
Deferred tax assets 0.3 1.0
Deferred tax liabilities:
At 1 January - (0.4)
Profit and loss account - 0.4
Deferred tax assets:
At 1 January 1.0 1.9
Profit and loss account (0.3) (0.8)
Cash flow hedges - (0.1)
Transferred to assets held for sale (0.4) -
At 31 December 0.3 1.0
2015 2014
Company £million £million
Accelerated capital allowances and other short-term timing differences 0.6 0.3
Deferred tax assets 0.6 0.3
At 1 January 0.3 0.8
Profit and loss account - accelerated capital allowances and other short-term timing differences 0.3 (0.4)
Cash flow hedges - (0.1)
Deferred tax assets at 31 December 0.6 0.3
On 2 July 2013 the Government substantively enacted a reduction in the main rate of UK corporation tax from 21% to 20% with
effect from 1 April 2015. This will reduce the Group’s future current tax charge accordingly. Deferred tax has been calculated
based on the enacted rates to the extent that the related temporary or timing differences are expected to reverse in the future
periods.

Notes to the consolidated financial statements
SECURE TRUST BANK PLC 103
25. Contingent liabilities and commitments
Capital commitments
At 31 December 2015, the Group had no capital commitments (2014: £0.1 million relating to the refurbishment of an Everyday
Loans branch).
The Company had no capital commitments (2014: £nil).
Credit commitments
At 31 December 2015, the Group and Company both had commitments of £138.6 million to extend credit to customers (2014:
£96.0 million and £96.0 million respectively).
Operating lease commitments The future aggregate lease payments for non-cancellable operating leases are as follows:
2015 2014
Land and buildings Other
Land and buildings Other
Group £million £million £million £million
Within 1 year 1.0 0.5 0.8 0.3
Between 1 year and 5 years 1.6 0.3 1.5 0.2
Over 5 years 0.3 - 0.1 -
2.9 0.8 2.4 0.5
2015 2014
Land and buildings Other
Land and buildings Other
Company £million £million £million £million
Within 1 year 0.1 0.3 - 0.3
Between 1 year and 5 years 0.6 0.2 - 0.1
Over 5 years 0.1 - 0.4 -
0.8 0.5 0.4 0.4
There are 35 leases classified as land and buildings in the Group (2014: 35). Other leases include motor vehicles and computer
hardware.
Other commitments
At 31 December 2015 a commitment exists to make further payments with regard to the Financial Services Compensation Scheme
Levy for 2015 and thereafter. Due to uncertainties regarding the elements in the calculation of the levy and the Group's share
thereof, the directors consider this cost to be unquantifiable.
26. Share capital
Number of
shares Ordinary
shares
£million
At 1 January 2014 15,648,149 6.3
Shares issued during year 2,543,745 1.0
At 31 December 2014 18,191,894 7.3
At 31 December 2015 18,191,894 7.3
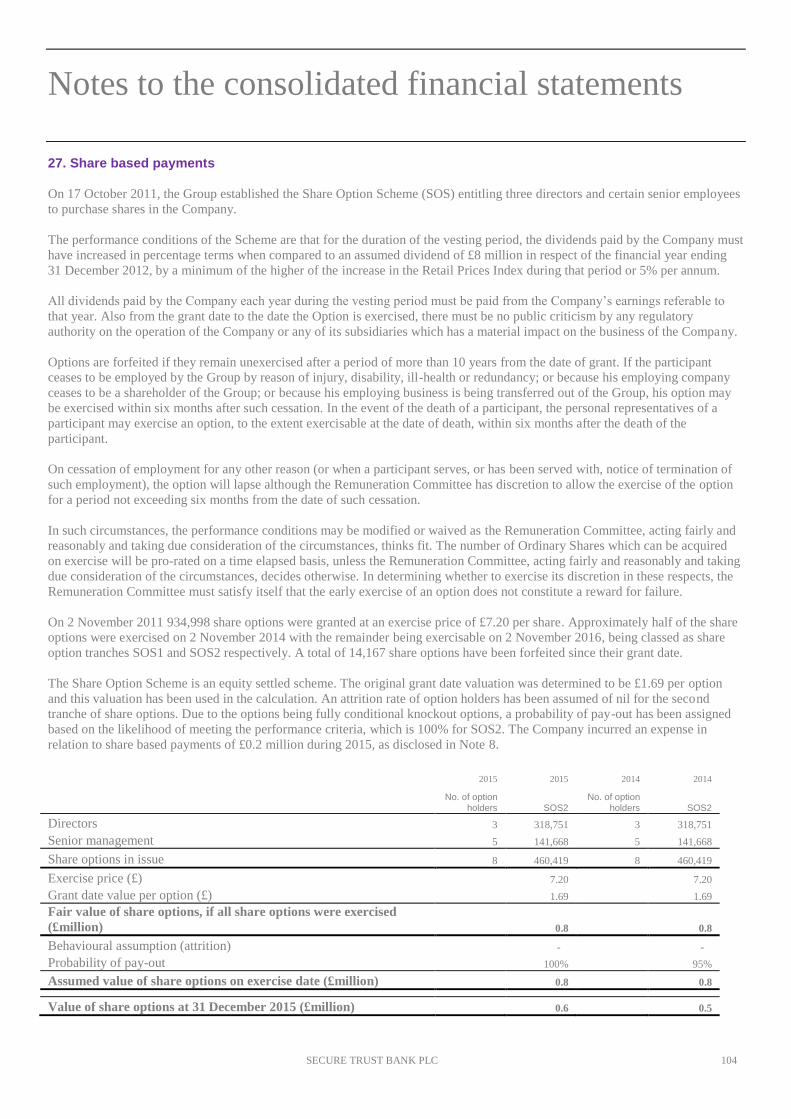
Notes to the consolidated financial statements
SECURE TRUST BANK PLC 104
27. Share based payments
On 17 October 2011, the Group established the Share Option Scheme (SOS) entitling three directors and certain senior employees
to purchase shares in the Company.
The performance conditions of the Scheme are that for the duration of the vesting period, the dividends paid by the Company must
have increased in percentage terms when compared to an assumed dividend of £8 million in respect of the financial year ending
31 December 2012, by a minimum of the higher of the increase in the Retail Prices Index during that period or 5% per annum.
All dividends paid by the Company each year during the vesting period must be paid from the Company’s earnings referable to
that year. Also from the grant date to the date the Option is exercised, there must be no public criticism by any regulatory
authority on the operation of the Company or any of its subsidiaries which has a material impact on the business of the Company.
Options are forfeited if they remain unexercised after a period of more than 10 years from the date of grant. If the participant
ceases to be employed by the Group by reason of injury, disability, ill-health or redundancy; or because his employing company
ceases to be a shareholder of the Group; or because his employing business is being transferred out of the Group, his option may
be exercised within six months after such cessation. In the event of the death of a participant, the personal representatives of a
participant may exercise an option, to the extent exercisable at the date of death, within six months after the death of the
participant.
On cessation of employment for any other reason (or when a participant serves, or has been served with, notice of termination of
such employment), the option will lapse although the Remuneration Committee has discretion to allow the exercise of the option
for a period not exceeding six months from the date of such cessation.
In such circumstances, the performance conditions may be modified or waived as the Remuneration Committee, acting fairly and
reasonably and taking due consideration of the circumstances, thinks fit. The number of Ordinary Shares which can be acquired
on exercise will be pro-rated on a time elapsed basis, unless the Remuneration Committee, acting fairly and reasonably and taking
due consideration of the circumstances, decides otherwise. In determining whether to exercise its discretion in these respects, the
Remuneration Committee must satisfy itself that the early exercise of an option does not constitute a reward for failure.
On 2 November 2011 934,998 share options were granted at an exercise price of £7.20 per share. Approximately half of the share
options were exercised on 2 November 2014 with the remainder being exercisable on 2 November 2016, being classed as share
option tranches SOS1 and SOS2 respectively. A total of 14,167 share options have been forfeited since their grant date.
The Share Option Scheme is an equity settled scheme. The original grant date valuation was determined to be £1.69 per option
and this valuation has been used in the calculation. An attrition rate of option holders has been assumed of nil for the second
tranche of share options. Due to the options being fully conditional knockout options, a probability of pay-out has been assigned
based on the likelihood of meeting the performance criteria, which is 100% for SOS2. The Company incurred an expense in
relation to share based payments of £0.2 million during 2015, as disclosed in Note 8.
2015 2015 2014 2014
No. of option
holders
No. of option
holders
SOS2 SOS2
Directors 3 318,751 3 318,751
Senior management 5 141,668 5 141,668
Share options in issue 8 460,419 8 460,419
Exercise price (£) 7.20 7.20
Grant date value per option (£) 1.69 1.69
Fair value of share options, if all share options were exercised
(£million) 0.8 0.8
Behavioural assumption (attrition) - -
Probability of pay-out 100% 95%
Assumed value of share options on exercise date (£million) 0.8 0.8
Value of share options at 31 December 2015 (£million) 0.6 0.5

Notes to the consolidated financial statements
SECURE TRUST BANK PLC 105
Cash settled share based payments
On 16 March 2015, a four year “phantom” share option scheme was established in order to provide effective long-term incentive
to senior management of the Group. Under the scheme, no actual shares would be issued by the Company, but those granted
awards under the scheme would be entitled to a cash payment. The amount of the award is calculated by reference to the increase
in the value of an ordinary share in the Company over an initial value set at £25 per ordinary share, being the price at which the
shares resulting from the exercise of the first tranche of share options under the Share Option Scheme were sold in November
2014.
As at 31 December 2015, 326,917 share options remained outstanding following the departure of one employee from the scheme.
An additional 14,000 share options should lapse following the expected departure of a further three employees following the
conditional sale of ELG.
As at 31 December 2015, the estimated fair value has been prepared using the Black-Scholes model. Measurement inputs and
assumptions used were as follows:
2015
Expected stock price volatility 27.00%
Expected dividend yield 2.09%
Risk free interest rate 0.72%
Average expected life (years) 2.85
This resulted in the following being recognised in the financial statements:
2015 2014
£million £million
Balance at 1 January - -
Charge for the year (included in staff costs - see Note 8 ) 1.2 -
Balance at 31 December 1.2 -
Intrinsic value 0.8 -
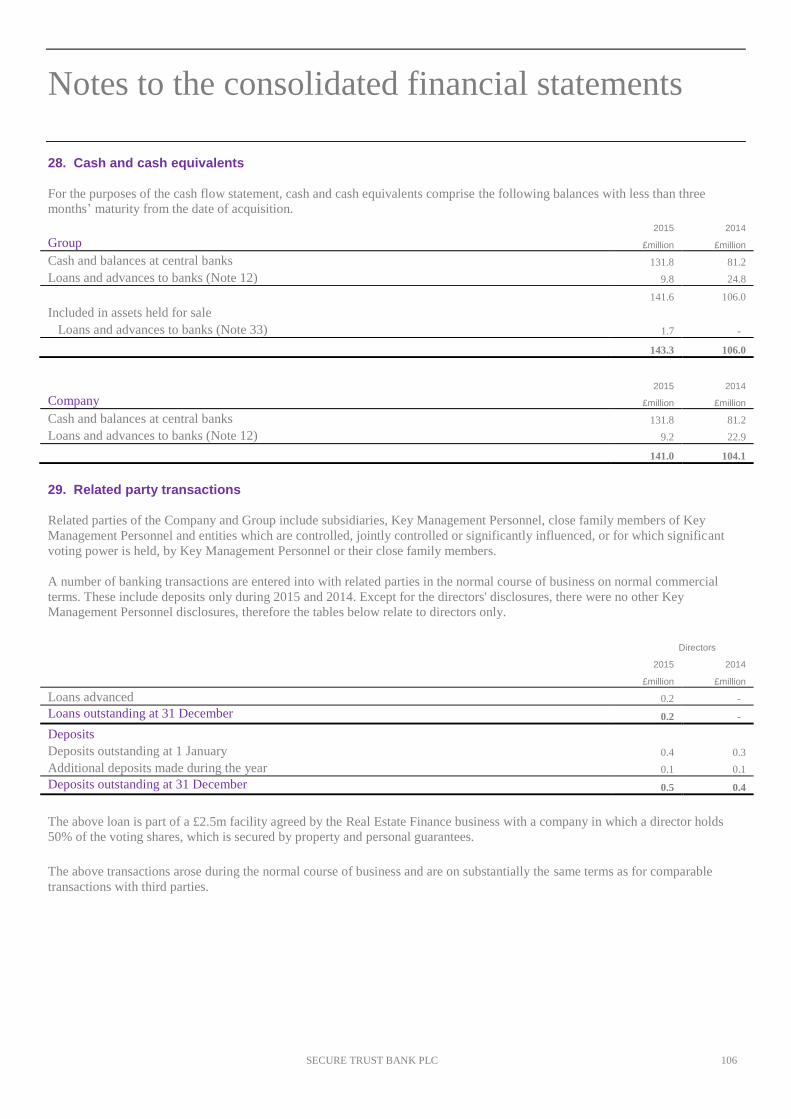
Notes to the consolidated financial statements
SECURE TRUST BANK PLC 106
28. Cash and cash equivalents
For the purposes of the cash flow statement, cash and cash equivalents comprise the following balances with less than three
months’ maturity from the date of acquisition.
2015 2014
Group £million £million
Cash and balances at central banks 131.8 81.2
Loans and advances to banks (Note 12) 9.8 24.8
141.6 106.0
Included in assets held for sale
Loans and advances to banks (Note 33) 1.7 -
143.3 106.0
2015 2014
Company £million £million
Cash and balances at central banks 131.8 81.2
Loans and advances to banks (Note 12) 9.2 22.9
141.0 104.1
29. Related party transactions
Related parties of the Company and Group include subsidiaries, Key Management Personnel, close family members of Key
Management Personnel and entities which are controlled, jointly controlled or significantly influenced, or for which significant
voting power is held, by Key Management Personnel or their close family members.
A number of banking transactions are entered into with related parties in the normal course of business on normal commercial
terms. These include deposits only during 2015 and 2014. Except for the directors' disclosures, there were no other Key
Management Personnel disclosures, therefore the tables below relate to directors only.
Directors
2015 2014
£million £million
Loans advanced 0.2 -
Loans outstanding at 31 December 0.2 -
Deposits
Deposits outstanding at 1 January 0.4 0.3
Additional deposits made during the year 0.1 0.1
Deposits outstanding at 31 December 0.5 0.4
The above loan is part of a £2.5m facility agreed by the Real Estate Finance business with a company in which a director holds
50% of the voting shares, which is secured by property and personal guarantees.
The above transactions arose during the normal course of business and are on substantially the same terms as for comparable
transactions with third parties.

Notes to the consolidated financial statements
SECURE TRUST BANK PLC 107
The Company undertook the following transactions with other companies in the Arbuthnot Banking Group:
2015 2014
£million £million
Arbuthnot Latham & Co., Ltd - recharge income of shared services (0.8) (0.2)
Arbuthnot Banking Group PLC - group recharges 0.4 0.4
Everyday Loans Holdings Limited - dividends received (11.5) (5.0)
Everyday Loans Limited - management recharge income - 8.7
Everyday Lending Limited - interest income on loan receivable (2.9) (2.6)
Everyday Lending Limited - property and leasing recharges (0.2) -
Debt Managers (Services) Limited - income from sale of debt portfolio (2.4) (3.1)
Secure Homes Services Limited - dividend received (2.0) -
Secure Homes Services Limited - building rental paid 0.4 0.4
STB Leasing Limited - dividend received (4.0) -
V12 Finance Group Limited - dividends received (2.0) -
V12 Retail Finance Limited - financial intermediary charges - applications proposed 1.7 1.5
V12 Retail Finance Limited - financial intermediary charges - applications accepted 3.4 0.8
V12 Retail Finance Limited - financial intermediary charges - loan set-up and processing 3.3 1.7
V12 Retail Finance Limited - loan book management and servicing fees 4.0 1.7
(12.6) 4.3
The loans and advances with, and amounts receivable and payable to, related companies are noted below:
2015 2014
Group £million £million
Loans and advances to related companies - 20.0
Amounts receivable from ultimate parent undertaking 1.3 0.8
Amounts due to related companies (0.1) (0.3)
1.2 20.5
2015 2014
Company £million £million
Loans and advances to related companies - 20.0
Amounts receivable from ultimate parent undertaking 1.3 0.8
Amounts receivable from subsidiary undertakings 140.1 113.8
Amounts due to related companies (10.4) (4.6)
131.0 130.0
Directors' remuneration
The directors' emoluments (including pension contributions and benefits in kind) for the year are disclosed in the Remuneration
Report beginning on page 50.
At the year end the ordinary shares held by the directors are disclosed in the Directors’ Report beginning on page 42. Details of
the directors’ holdings of share options, as well as details of those share options exercised during the year, are also disclosed in the
Directors’ Report.
The interests of any directors who hold shares in the ultimate parent company, Arbuthnot Banking Group PLC, are shown in the
Directors’ Report of the ultimate parent company.

Notes to the consolidated financial statements
SECURE TRUST BANK PLC 108
30. Operating segments
The Group changed the structure of its internal organisation during the year, and as a result the reportable segments have been
restated. The business is currently organised into six main operating segments, which consist of the different products available,
disclosed below:
Business finance
1) Real Estate Finance: buy-to-let and development loans secured by UK real estate.
2) Asset Finance: loans to small and medium sized enterprises to acquire commercial assets.
3) Commercial Finance: invoice discounting and invoice financing.
Consumer finance
4) Personal Lending: Unsecured consumer loans sold to customers via brokers and affinity partners.
5) Motor Finance: Hire purchase agreements secured against the vehicle being financed.
6) Retail Finance: Point of sale unsecured finance for in-store and online retailers.
Other
Other includes Current Account, OneBill, Pay4later, Rentsmart and debt collection.
Management review these segments by looking at the income, size and growth rate of the loan books, impairments and customer
numbers. Except for these items no costs or balance sheet items are allocated to the segments.
Interest receivable and similar
income
Fee and commission
income
Revenue from
external customers
Net impairment
losses on loans and
advances to customers
Loans and advances
to customers
Year ended 31 December 2015 £million £million £million £million £million
Business finance
Real Estate Finance 20.2 0.1 20.3 - 368.0
Asset Finance 2.4 - 2.4 - 70.7
Commercial Finance 0.4 1.2 1.6 0.3 29.3
Consumer finance
Personal Lending 17.2 - 17.2 4.8 74.3
Motor Finance 33.2 0.1 33.3 7.3 165.7
Retail Finance 22.5 1.7 24.2 5.2 220.4
Other 4.6 13.8 18.4 (0.8) 32.2
100.5 16.9 117.4 16.8 960.6
Discontinued operations and assets held for sale
Personal Lending 39.2 1.5 40.7 7.5 114.3
139.7 18.4 158.1 24.3 1,074.9

Notes to the consolidated financial statements
SECURE TRUST BANK PLC 109
Interest receivable and similar
income
Fee and commission
income
Revenue from
external customers
Net impairment
losses on loans and
advances to customers
Loans and advances
to customers
Year ended 31 December 2014 £million £million £million £million £million
Business finance
Real Estate Finance 2.5 - 2.5 - 133.8
Asset Finance - - - - 4.5
Commercial Finance - 0.1 0.1 - 5.0
Consumer finance
Personal Lending 15.1 - 15.1 3.3 87.5
Motor Finance 27.2 - 27.2 3.9 137.9
Retail Finance 12.8 0.8 13.6 1.2 116.7
Other 5.8 15.2 21.0 0.3 43.2
63.4 16.1 79.5 8.7 528.6
Discontinued operations and assets held for sale
Personal Lending 30.2 4.1 34.3 6.6 93.9
93.6 20.2 113.8 15.3 622.5
The ‘other’ segment above includes other products which are individually below the quantitative threshold for separate disclosure
and fulfils the requirement of IFRS 8.28 by reconciling operating segments to the amounts reported in the financial statements.
As interest, fee and commission and operating expenses are not aligned to operating segments for day to day management of the
business and cannot be allocated on a reliable basis, profit by operating segment has not been disclosed.
All of the Group’s operations are conducted wholly within the United Kingdom and geographical information is therefore not
presented.
31. Immediate and ultimate parent company
The Company regards Arbuthnot Banking Group PLC, a company registered in England and Wales, as the immediate and
ultimate parent company. Sir Henry Angest, the Group Chairman and Chief Executive has a beneficial interest in 53.7% of the
issued share capital of Arbuthnot Banking Group PLC and is regarded by the Company as the ultimate controlling party. A copy
of the consolidated financial statements of Arbuthnot Banking Group PLC may be obtained from the Secretary, Arbuthnot
Banking Group PLC, Arbuthnot House, 7 Wilson Street, London, EC2M 2SN.
32. Events after the balance sheet date
There were no material post balance sheet events in the Group.

Notes to the consolidated financial statements
SECURE TRUST BANK PLC 110
33. Discontinued operations and assets and liabilities held for sale On 4 December 2015, the Bank agreed to the conditional sale of its non-standard consumer lending business, ELG, which
comprises Everyday Loans Holdings Limited and subsidiary companies Everyday Lending Limited and Everyday Loans Limited,
to Non Standard Finance PLC (NSF) for £107 million in cash subject to a net asset adjustment and £20 million in NSF ordinary
shares. The Disposal is conditional on regulatory approval and satisfaction of the conditions to the NSF financing. Completion is
expected in the near future. On completion, NSF will repay the current intercompany debt of £108 million to STB.
Under the Bank’s ownership, ELG has achieved impressive growth, within the constraints imposed upon it as part of a highly
regulated banking group. An unsolicited approach revealed that NSF was prepared to pay an attractive valuation for ELG.
The net effect of the Disposal will therefore be to nearly double the equity base of Group to circa £250 million. This substantially
improves STB’s capital resources and broadens the range of strategic options available to it.
Subject to confirmation by the regulator, the Disposal is expected to improve the Group’s CET1 ratio and Leverage ratios to 24%
and 18% respectively, on a proforma basis as if the Disposal had occurred on 31 December 2015 (from 15% and 12% on an
unadjusted basis as at 30 June 2015). This represents a substantial capital surplus and significant headroom over PRA minimum
leverage requirements and will support the strong growth in lending of the Group.
While in the short term the Disposal is expected to reduce earnings, given the disposal of ELG’s profit streams, the Board is
confident that the proceeds can be reinvested to accelerate the Group’s growth prospects and secure new income streams.
Details of the discontinued operations profit for the current year and prior year, assets and liabilities held for sale and cash flow of
discontinued operations is set out below.
Income statement Year ended
31 December Year ended
31 December
2015 2014
£million £million
Interest receivable and similar income 39.2 30.2
Net interest income 39.2 30.2
Fee and commission income 1.5 4.1
Fee and commission expense (0.3) (0.1)
Net fee and commission income 1.2 4.0
Operating income 40.4 34.2
Net impairment losses on loans and advances to customers (7.5) (6.6)
Operating expenses (21.2) (19.0)
Profit before income tax 11.7 8.6
Income tax expense (2.3) (2.0)
Profit for the period - Discontinued operations 9.4 6.6

Notes to the consolidated financial statements
SECURE TRUST BANK PLC 111
Group At 31
December
2015
Assets and liabilities held for sale £million
ASSETS
Loans and advances to banks 1.7
Loans and advances to customers 114.3
Property, plant and equipment 0.4
Intangible assets 1.2
Deferred tax assets 0.4
Other assets 0.5
Total assets 118.5
LIABILITIES
Current tax liabilities 3.4
Other liabilities 5.3
Total liabilities 8.7
Net assets held for sale 109.8
Company
Assets held for sale comprises investment in subsidiary undertaking totalling £1.
Year ended
31 December Year ended
31 December
2015 2014
Cash flows from discontinued operations £million £million
Cash flows from operating activities
Profit for the year 7.5 6.6
Adjustments for:
Income tax expense 2.3 2.0
Depreciation of property, plant and equipment 0.1 0.1
Amortisation of intangible assets 1.0 1.3
Impairment losses on loans and advances to customers 7.5 6.6
Cash flows from operating profits before changes in operating assets and liabilities 18.4 16.6
Changes in operating assets and liabilities:
- net increase in loans and advances to customers (27.9) (19.1)
- net (increase) in other assets (0.1) -
- net increase in other liabilities 10.0 5.6
Income tax paid (0.1) (2.3)
Net cash inflow from operating activities 0.3 0.8
Cash flows from investing activities
Purchase of property, plant and equipment (0.3) (0.1)
Net cash flows from investing activities (0.3) (0.1)
Net increase in cash and cash equivalents - 0.7
Cash and cash equivalents at 1 January 1.7 1.0
Cash and cash equivalents at 31 December 1.7 1.7

Notes to the consolidated financial statements
SECURE TRUST BANK PLC 112
34. Country by Country reporting The Capital Requirements (Country-by-Country Reporting) Regulations 2013 introduced reporting obligations for institutions
within the scope of the European Union’s Capital Requirements Directive (CRD IV). The requirements aim to give increased
transparency regarding the activities of institutions.
The Country-by-Country Information is set out below:
31 December 2015 Number of
FTE Profit before
tax Tax paid on
profit
Name Nature of activity Location Turnover employees £000 £000
Secure Trust Bank plc Banking services UK 158.1 706 36.5 4.2
31 December 2014 Number of
FTE Profit before
tax Tax paid on
profit
Name Nature of activity Location Turnover employees £000 £000
Secure Trust Bank plc Banking services UK 113.8 608 26.1 3.1

Five year summary (unaudited)
SECURE TRUST BANK PLC 113
2015 2014 2013 2012 2011
£million £million £million £million £million
Profit for the year
Interest and similar income 139.7 93.6 73.8 44.9 22.9
Interest expense and similar charges (21.6) (14.2) (12.9) (10.5) (5.6)
Net interest income 118.1 79.4 60.9 34.4 17.3
Net fee and commission income 14.4 18.5 18.1 12.6 11.2
Operating income 132.5 97.9 79.0 47.0 28.5
Impairment losses on loans and advances (24.3) (15.3) (15.6) (8.9) (4.6)
Gain from a bargain purchase - - 0.4 9.8 -
Other income - - - 0.1 -
Exceptional costs - - (0.9) (1.4) (0.5)
Arbuthnot Banking Group recharges (0.8) (0.2) (0.1) (0.1) (1.8)
Operating expenses (70.9) (56.3) (45.7) (29.3) (14.3)
Profit before income tax 36.5 26.1 17.1 17.2 7.3
Earnings per share for profit attributable to the equity holders of the Group during the year
(expressed in pence per share)
- basic 157.8 122.3 78.3 108.9 39.6
Financial position
Cash and balances at central banks 131.8 81.2 - - -
Loans and advances to banks 11.5 39.8 110.0 155.3 139.5
Loans and advances to customers 1,074.9 622.5 391.0 297.6 154.6
Debt securities held-to-maturity 3.8 16.3 - - -
Other assets 25.4 22.5 24.9 21.7 13.7
Total assets 1,247.4 782.3 525.9 474.6 307.8
Due to banks 35.0 15.9 0.1 - -
Deposits from customers 1,033.1 608.4 436.6 398.9 272.1
Other liabilities 38.1 33.1 27.6 19.8 11.9
Total shareholders' equity 141.2 124.9 61.6 55.9 23.8
Total liabilities and shareholders' equity 1,247.4 782.3 525.9 474.6 307.8

Corporate contacts & advisers
SECURE TRUST BANK PLC 114
Secretary & Registered Office
A J Karter LLB (Hons)
One Arleston Way
Solihull
West Midlands
B90 4LH
T 0121 693 9100
F 0121 693 9124
Advisers
Independent Auditor:
KPMG LLP
One Snowhill
Snow Hill Queensway
Birmingham
B4 6GH
Principal Banker:
Barclays Bank PLC
38 Hagley Road
Edgbaston
Birmingham
B16 8NY
Stockbrokers:
Canaccord Genuity Limited
88 Wood Street
London
EC2V 7QR
Stifel Nicolaus Europe Limited
One Broadgate
London
EC2M 2QS
Nominated Adviser:
Canaccord Genuity Limited
88 Wood Street
London
EC2V 7QR
Registrar:
Capita Asset Services
The Registry
34 Beckenham Road
Beckenham
Kent
BR3 4TU