sectoral engines of growth in developing asia: stylised
TRANSCRIPT
107Malaysian Journal of Economic Studies Vol. 46 No. 2, 2009
Sectoral Engines of Growth in Developing Asia: Stylised Facts and ImplicationsMalaysian Journal of Economic Studies 46 (2): 107-133, 2009 ISSN 1511-4554
Sectoral Engines of Growth in Developing Asia: Stylised Factsand Implications
Jesus FELIPEa
Asian Development Bank
Miguel LEÓN-LEDESMAb
University of Kent
Matteo LANZAFAMEc
Universita degli Studi di Messina
Gemma ESTRADAd
Asian Development Bank
Abstract: This paper provides an analysis of developing Asia’s growth experience from thepoint of view of its structural transformation during the last three decades. The mostsalient feature of this transformation has been the significant decrease in the share ofagriculture and the parallel increase in the share of services. Using Kaldor’s framework, thepaper discusses whether industry plays the role of engine of growth in developing Asia.The empirical results show, first, that both industry and services play such a role; andsecond, that there is evidence of endogenous, growth-induced technological progress.Likewise, the technology-gap approach supports the view that technological spillovershave fostered growth in developing Asia.
Keywords: Asia, Kaldor’s laws, structural transformationJEL classification: O14, O47, O53
1. IntroductionExcept for those countries exceptionally well endowed with natural resources such as oil,growth is always associated with the structural transformation of the economy. Indeed, thegrowth experience of the developed economies since the 19th century reveals that growth
a Asian Development Bank, 6 ADB Avenue, Mandaluyong City, 1150 Metro Manila, Philippinesa Email: [email protected] (corresponding author)
The first author is also affliated to: Cambridge Centre for Economic and Public Policy (UnitedKingdom), Centre of Full Employment and Equity, University of Newcastle (Australia) and Centre forApplied Macroeconomic Analysis, Australian National University (Australia).
b School of Economics, University of Kent, Canterbury, Kent, CT2 7NZ, U.K.b Email: [email protected]
c Dipartmento di Economia, Statisca, Matematica e Sociologia (DESMaS) “W. Pareto”, Universita degliStudi di Messina, Via T. Cannizzaro 278, 98122, Messina, Italy.c Email: [email protected]
d Email: [email protected]
We are grateful to a referee for his/her useful suggestions. This paper represents the views of theauthors and does not represent those of the Asian Development Bank, its Executive Directors, or thecountries that they represent.
108 Malaysian Journal of Economic Studies Vol. 46 No. 2, 2009
Jesus Felipe, Miguel León-Ledesma, Matteo Lanzafame and Gemma Estrada
was associated with changes in the structure of the economy. More recently, the experienceof the successful Asian economies (e.g., South Korea, Malaysia, Taiwan, etc.) also showsthat high growth has been associated with deep changes in the structure of these economies.Moreover, many economists see the development of a modern industrial sector as the keyfor propelling structural transformation.
Structural transformation is reflected in changes in output and employmentcompositions. An economy that grows as a result of transformation generates new activitiescharacterised by higher productivity and increasing returns to scale. The transition acrossdifferent patterns of production and specialisation also involves upgrading to higher value-added activities within each sector through the introduction of new products and processes.These changes entail far-reaching transformations in terms of, among other things, economicgeography and the skill content of output. It is the countries that can sustain multipletransitions across different stages of their structural transformation that grow successfully.
As Rodrik (2006) reminds readers, development economists of the ‘old’ schoolunderstood the key role that structural transformation plays in the course of development.Among these economists, it was probably Nicholas Kaldor (1966; 1967) who provided themost thorough explanation of why industry plays the role of “engine of growth.” Indeed,the so-called ‘Kaldor’s Laws’ provide a solid starting point for sector analyses of growthand structural change. Recently, Jaumotte and Spatafora (2007) discussed Asia’s performancefrom a sectoral perspective.
The purpose of this paper is to analyse developing Asia’s growth experience in thecontext of structural transformation. Growth and structural transformation are inter-related,since countries do not grow by simply reproducing themselves on a larger scale. Generally(unless all sectors of the economy grow at identical rates), countries become different asthey grow, not only in terms of what they produce, but also in terms of how they do it (i.e.,by using different inputs, including methods of production).
Specifically, we attempt to answer the following questions: (i) What has been theextent of structural change in developing Asia during the last three decades? (ii) What isthe contribution of the different sectors to the growth performance of the Asian economies?(iii) What is the contribution of structural change to productivity growth and catching up?
The rest of the paper is structured as follows. Section 2 documents the extent ofstructural transformation in developing Asia. Section 3 provides a brief summary of Kaldor’slaws. Section 4 discusses the empirical evidence provided by the laws. Section 5 complementsthe analysis of growth and structural transformation in Asia through Kaldor’s laws with ananalysis of the importance of structure and technology diffusion. Section 6 summarises themain findings.
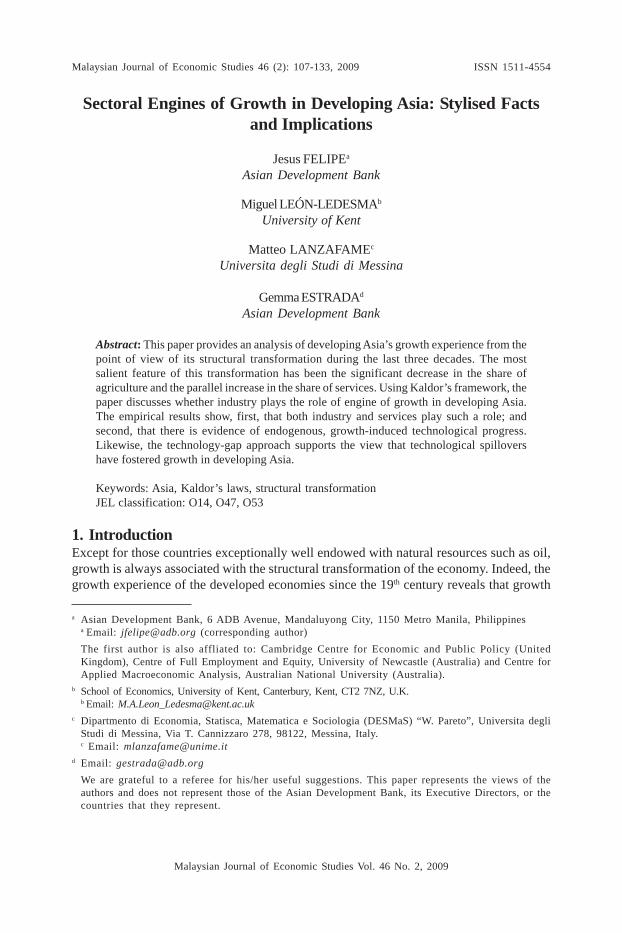
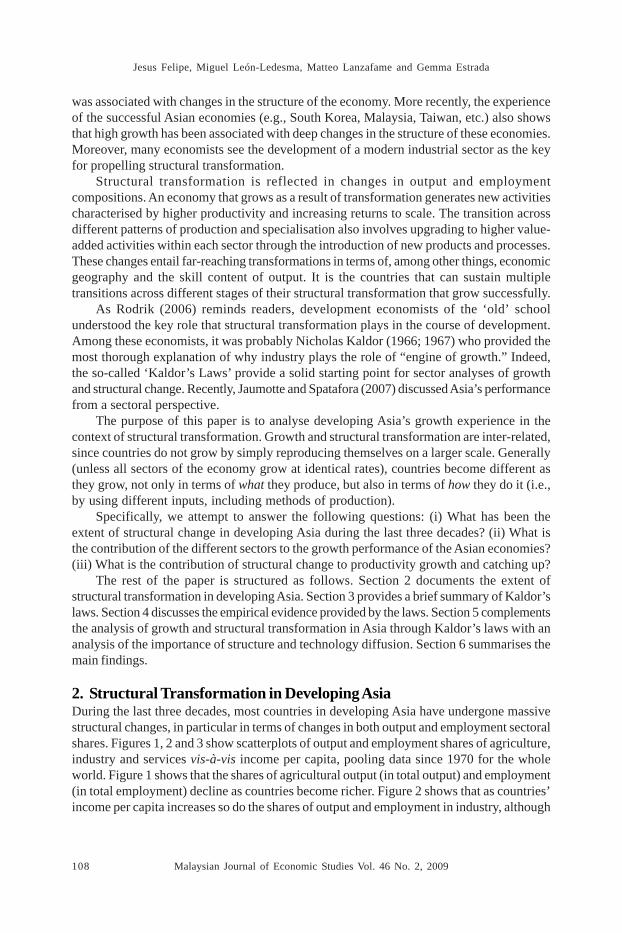
2. Structural Transformation in Developing AsiaDuring the last three decades, most countries in developing Asia have undergone massivestructural changes, in particular in terms of changes in both output and employment sectoralshares. Figures 1, 2 and 3 show scatterplots of output and employment shares of agriculture,industry and services vis-à-vis income per capita, pooling data since 1970 for the wholeworld. Figure 1 shows that the shares of agricultural output (in total output) and employment(in total employment) decline as countries become richer. Figure 2 shows that as countries’income per capita increases so do the shares of output and employment in industry, although
109Malaysian Journal of Economic Studies Vol. 46 No. 2, 2009
Sectoral Engines of Growth in Developing Asia: Stylised Facts and Implications
Figure 1: Agricultural output and employment shares vs. per capita GDP, 1970–2004(logarithmic scale)
Sources: Asian Development Bank, Statistical Database System (2006); Directorate General ofBudget, Accounting, and Statistics (various years); National Bureau of Statistics (various years);Sundrum (1997) and Chadha and Sahu (2002) cited in Anant et al. (2005); World Bank, World
Development Indicators online (2006).
Figure 2: Industry output and employment shares vs. per capita GDP, 1970–2004(logarithmic scale)
Sources: Asian Development Bank, Statistical Database System (2006); Directorate General ofBudget, Accounting, and Statistics (various years); National Bureau of Statistics (various years);Sundrum (1997) and Chadha and Sahu (2002) cited in Anant et al. (2005); World Bank, World
Development Indicators online (2006).
110 Malaysian Journal of Economic Studies Vol. 46 No. 2, 2009
Jesus Felipe, Miguel León-Ledesma, Matteo Lanzafame and Gemma Estrada
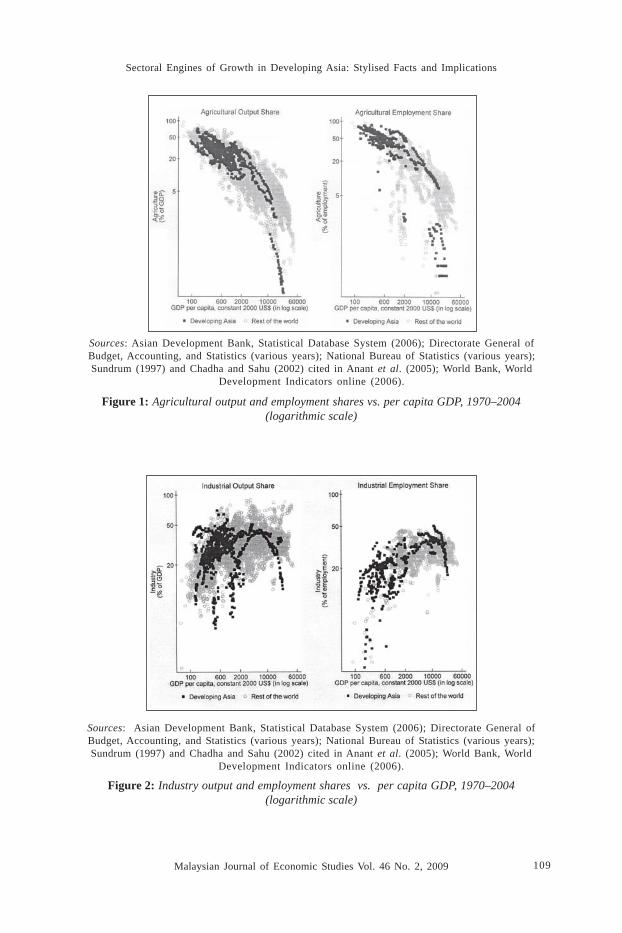
there seems to be a point beyond which these two shares start declining. Figure 2 alsoshows a wide dispersion in these shares for a given income per capita. Finally, Figure 3shows that the shares of output and employment in services clearly increase as income percapita increases. The relationship described between sectors’ shares and income per capitais referred to as the ‘logistic pattern.’ It is based on Engle’s law (demand explanation) and onthe differential productivity growth rates across sectors (supply explanation).
The share of agricultural output in total output has declined significantly acrossdeveloping Asia during the last thirty years. Especially significant are the declines thatoccurred in China and India; in the former from about 32 per cent in the 1970s to about 13 percent in 2000-2004, and in India from about 42 per cent to about 23 per cent (during the sameperiods). In parallel with this decline, there has also been an increase in the share ofservices in all regions. The share of industry has increased significantly in some parts ofdeveloping Asia (e.g., ASEAN-4, Other Southeast Asia, Other South Asia), remained thesame in China, and increased by a small margin in India.
The share of employment in agriculture has also declined across most of developingAsia, except in Central and West Asia (although in 2000-2004, agriculture was still thelargest employer in developing Asia in 12 out of 23 countries for which data was available).This is the result of the convulsion that the region underwent after the collapse of theSoviet Union. In general, the decline in agricultural employment has occurred at a muchslower pace than that in output.
As in the case of output share, there has been a general increase in the share ofemployment in services in all regions. Employment in industry has increased significantlyin the ASEAN-4 countries (except the Philippines) and by a small margin in India; it has not
Figure 3: Services output and employment shares vs. per capita GDP, 1970–2004(logarithmic scale)
Sources: Asian Development Bank, Statistical Database System (2006); Directorate General ofBudget, Accounting, and Statistics (various years); National Bureau of Statistics (various years);Sundrum (1997) and Chadha and Sahu (2002) cited in Anant et al. (2005); World Bank, World
Development Indicators online (2006).
111Malaysian Journal of Economic Studies Vol. 46 No. 2, 2009
Sectoral Engines of Growth in Developing Asia: Stylised Facts and Implications
changed in China; and has suffered a decline in the NIEs (especially Hong Kong) andacross most of Central and West Asia.
The NIEs have undergone severe de-industrialisation as manufacturing has lostsignificant weight in total output between the 1970s and 2000-2004 (Rowthorn andRamaswamy 1997; 1999; Pieper 2000). This is not a negative phenomenon, but the naturalconsequence of the industrial dynamism of these economies, that is, the transition toservice-led economies. It is a feature of economic development that reflects their success.In terms of manufacturing employment, all four NIEs have clearly de-industrialised, especiallyHong Kong, where the share decreased by about 25 percentage points in two decades. Thedeclines in the other three economies are significant but smaller. Rowthorn and Ramaswamy(1997; 1999) have noted that this group of countries is going through a process similar tothat of the OECD countries, although it must be noted that it is a process affecting Taiwanand, especially, Hong Kong, and to a much lesser extent South Korea and Singapore.1 Thisis the result of transferring production facilities to China. In South Korea and Singapore, theshare of manufacturing has remained at about 27 per cent since the 1980s. Felipe andEstrada (2007) provide a recent analysis of developing Asia’s manufacturing sector.
The ASEAN-4 countries and Other Southeast Asia have increased their manufacturingshares significantly, both in terms of output and employment. The exception is thePhilippines, which had the highest manufacturing output share among the ASEAN-4 in the1970s, but by 2000-04 the share had decreased by about three percentage points and wasthe lowest in the group.
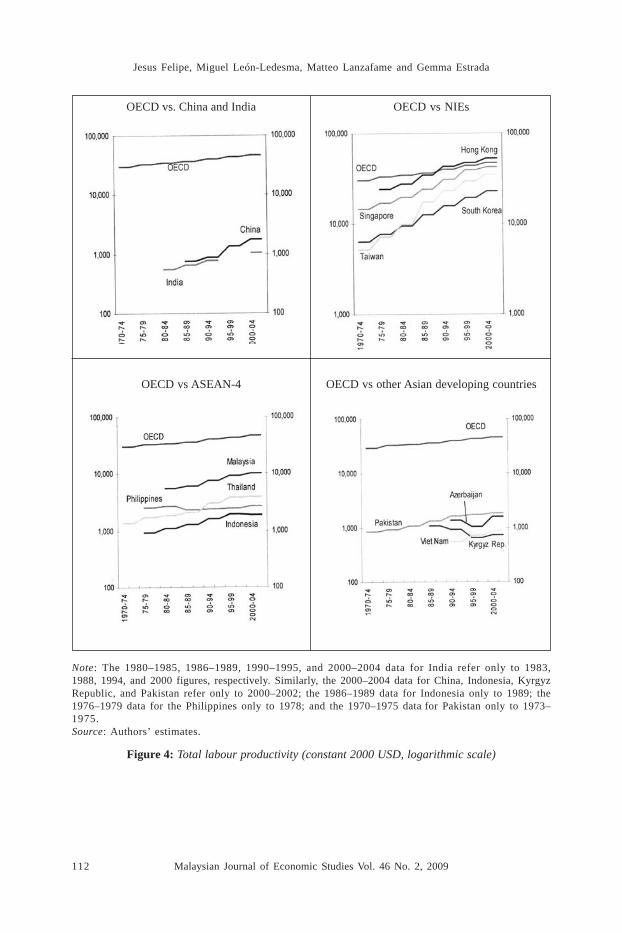
Although Indonesia, Malaysia and Thailand are cases of what can be labeled as‘successful industrialisation’, this must be qualified with the following two observations.First, other than South Korea, Taiwan, Malaysia and the Kyrgyz Republic, no other countryin developing Asia had in 2000-2004 a share of employment in manufacturing as high as thatof the OECD countries. Second, in terms of labour productivity (Figure 4), there is a largedifferential between most developing Asian countries and the OECD average. Indeed, itappears that many countries across developing Asia have industrialised at low levels ofproductivity. This could be due to two reasons: (a) that the product mix of new employmenthas been towards relatively low productivity industries; and/or (b) that the increase inemployment has taken place in low productivity techniques.
Other than the NIEs, today’s level of productivity in the rest of the developing Asia isstill below the OECD average during the early 1970s. The level of productivity in thesecondary sector is significantly higher than that in agriculture. And the level of labourproductivity in the service sector is above that in industry and manufacturing. Labourproductivity in industry in the Philippines in 2000-2004 was below the 1978 level, and inIndonesia it has barely increased. In most countries, labour productivity in agriculture isstill very low.
1 Wu (2004:258-260) argues that both public and private circles in Hong Kong “remain interested in ‘re-industrialisation’” after 1997. The reasons are twofold. First, de-industrialisation brings hardship forthe poor, worsens income distribution and, as a consequence, threatens social stability. Second, HongKong has specialised in services that are China-oriented. However, Hong Kong may lose this privilegedposition once Shanghai flourishes as a service centre. Wu goes on to argue that both private andprivate circles in Hong Kong tried to prevent the city’s de-industrialisation, but could not stop it dueto the lack of any industrial policy in the 1970s.
112 Malaysian Journal of Economic Studies Vol. 46 No. 2, 2009
Jesus Felipe, Miguel León-Ledesma, Matteo Lanzafame and Gemma Estrada
Figure 4: Total labour productivity (constant 2000 USD, logarithmic scale)
Note: The 1980–1985, 1986–1989, 1990–1995, and 2000–2004 data for India refer only to 1983,1988, 1994, and 2000 figures, respectively. Similarly, the 2000–2004 data for China, Indonesia, KyrgyzRepublic, and Pakistan refer only to 2000–2002; the 1986–1989 data for Indonesia only to 1989; the1976–1979 data for the Philippines only to 1978; and the 1970–1975 data for Pakistan only to 1973–1975.Source: Authors’ estimates.
OECD vs. China and India OECD vs NIEs
OECD vs ASEAN-4 OECD vs other Asian developing countries
113Malaysian Journal of Economic Studies Vol. 46 No. 2, 2009
Sectoral Engines of Growth in Developing Asia: Stylised Facts and Implications
Only the NIEs have achieved labour productivity levels that approach those of theOECD countries, and within this group, Singapore and Hong Kong are city-states with verysmall rural sectors. South Korea and Taiwan are significantly behind. Moreover, although inall Asian countries, productivity has improved significantly (with the noted exception ofthe Philippines), the absolute gap with respect to the OECD productivity level has widened.In the case of Malaysia, the country with the highest productivity levels outside the OECDand the NIEs, the absolute productivity differential with respect to the OECD in industryhas almost doubled, from USD21,786 in 1980-85 to USD38,946 in 2000-04, despite the factthat Malaysia’s productivity in industry increased by a factor of 1.7. In other countries andsectors the gap has widened by even larger amounts.
The Asian Development Bank (2007) provides evidence that the manufacturing sectorsof a number of Asian economies, especially South Korea and Malaysia; Singapore andTaiwan, have undergone important transformations and shifted their manufacturing outputto more technology- and scale-intensive subsectors. This shift upward is an importantcomponent of what structural change is about - the production of more sophisticatedmanufactured products leads to faster growth for it enlarges the potential for catch-up. InChina and India the shift to more technology- and scale-intensive subsectors is takingplace more slowly; while in most other Asian countries, the evidence is lacking.
Although in decline with respect to the average of the 1980s, the share of China’smanufacturing subsector in total output has been traditionally very high. It still accountsfor about 34.5 per cent of total output, only matched in developing Asia by Malaysia,Thailand and Tajikistan. The share of manufacturing employment, on the other hand, hasdeclined from about 15 per cent in the 1980s to 11 per cent now. China has effectively lostmillions of manufacturing jobs since the 1990s due to the restructuring process of its state-owned enterprises since the economic reform period began in 1979. However, it is worthnoting that this decline is occurring at a much lower level of income than it did in theindustrial countries. Moreover, less than a fifth of China’s labour force is employed inmanufacturing, mining, and construction combined (Banister 2005). The share of India’smanufacturing output has remained stable at about 15-16 per cent since the 1970s, while theshare of manufacturing employment has been at around 11 per cent during the periodsunder consideration.
3. Structural Change, Industrialisation and Kaldor’s LawsIn order to understand the potential role of developing Asia’s transformation, it is importantto view these changes in light of the development theory literature. It is in this context thatthe Kaldorian sectoral growth facts or laws (Kaldor 1966; 1967) become very relevant as anapproach to the issue of how structural change has affected growth in developing Asia,and what is the role that the different sectors have played. The Kaldorian facts bringtogether the notion of ‘engine of growth’ sectors, ‘economies of scale’ and ‘sectoral shifts’in a simple yet informative way. This framework recognises that some sectors may play amore important role in pulling the rest of the economy and in generating productivity gainsthrough economies of scale.
Kaldor’s laws allow us to address empirically the following questions: (i) Is manufacturingan engine of growth in Asia? (ii) Can services play a role as engine of growth? (iii) What are
114 Malaysian Journal of Economic Studies Vol. 46 No. 2, 2009
Jesus Felipe, Miguel León-Ledesma, Matteo Lanzafame and Gemma Estrada
the most dynamic sectors in Asian countries? (iv) Can we expect continued growth in Asia,given the recent sectoral developments?
It should be noted that we view Kaldor’s laws more as a series of stylised facts andhistorical regularities rather than a theory of economic development. These facts arecompatible with a diverse range of theories of growth. What is important is that thecorrelations embedded in Kaldor’s laws are presented at the sectoral level and, hence, arehelpful in analysing and comparing patterns of economic growth, and the role of structure.In this sense, our objective is ‘estimating’, rather than ‘testing’, these laws, following thedistinction put forward by Leamer and Levinsohn (1995).
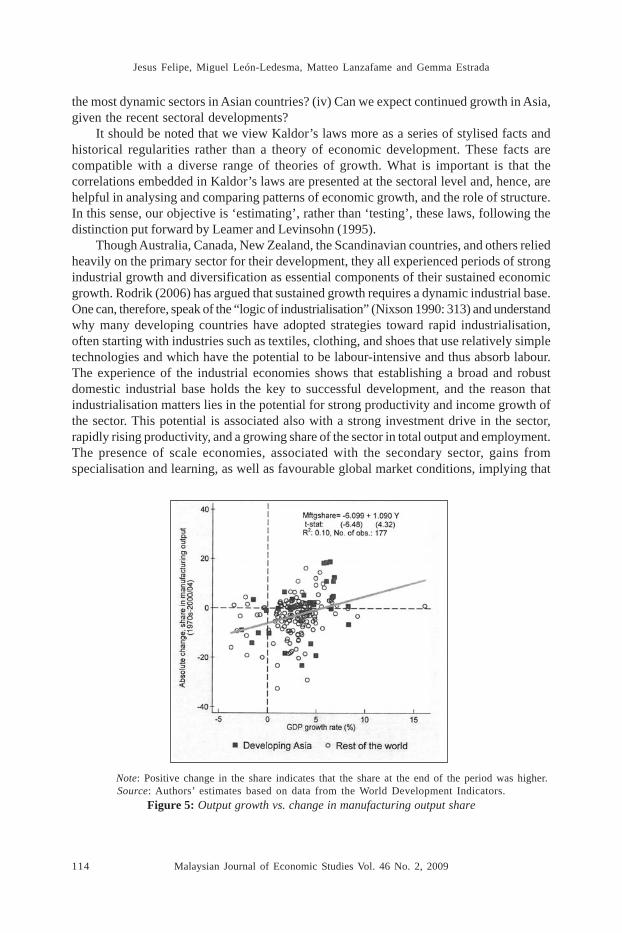
Though Australia, Canada, New Zealand, the Scandinavian countries, and others reliedheavily on the primary sector for their development, they all experienced periods of strongindustrial growth and diversification as essential components of their sustained economicgrowth. Rodrik (2006) has argued that sustained growth requires a dynamic industrial base.One can, therefore, speak of the “logic of industrialisation” (Nixson 1990: 313) and understandwhy many developing countries have adopted strategies toward rapid industrialisation,often starting with industries such as textiles, clothing, and shoes that use relatively simpletechnologies and which have the potential to be labour-intensive and thus absorb labour.The experience of the industrial economies shows that establishing a broad and robustdomestic industrial base holds the key to successful development, and the reason thatindustrialisation matters lies in the potential for strong productivity and income growth ofthe sector. This potential is associated also with a strong investment drive in the sector,rapidly rising productivity, and a growing share of the sector in total output and employment.The presence of scale economies, associated with the secondary sector, gains fromspecialisation and learning, as well as favourable global market conditions, implying that
Figure 5: Output growth vs. change in manufacturing output share
Note: Positive change in the share indicates that the share at the end of the period was higher.Source: Authors’ estimates based on data from the World Development Indicators.
115Malaysian Journal of Economic Studies Vol. 46 No. 2, 2009
Sectoral Engines of Growth in Developing Asia: Stylised Facts and Implications
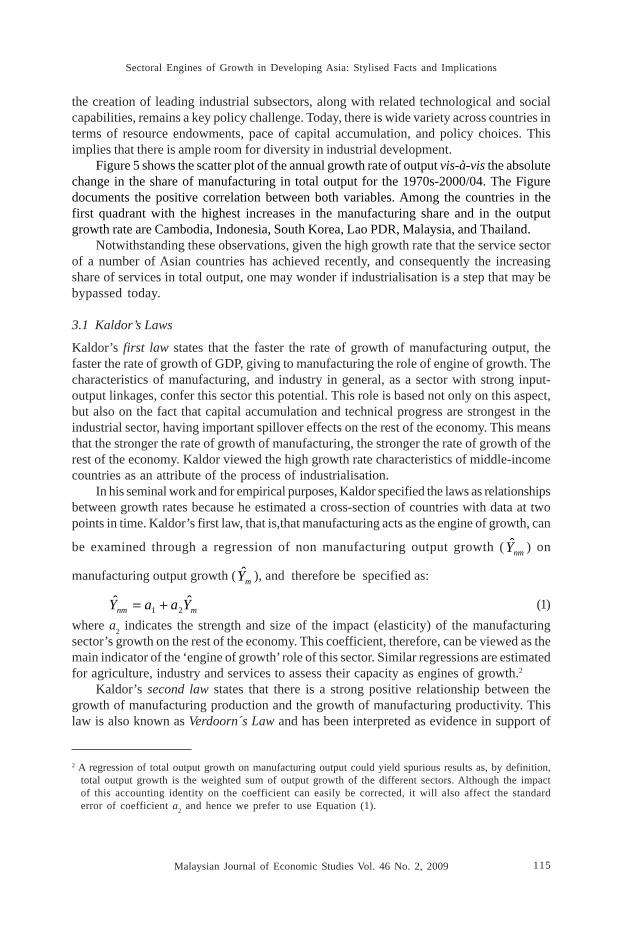
the creation of leading industrial subsectors, along with related technological and socialcapabilities, remains a key policy challenge. Today, there is wide variety across countries interms of resource endowments, pace of capital accumulation, and policy choices. Thisimplies that there is ample room for diversity in industrial development.
Figure 5 shows the scatter plot of the annual growth rate of output vis-à-vis the absolutechange in the share of manufacturing in total output for the 1970s-2000/04. The Figuredocuments the positive correlation between both variables. Among the countries in thefirst quadrant with the highest increases in the manufacturing share and in the outputgrowth rate are Cambodia, Indonesia, South Korea, Lao PDR, Malaysia, and Thailand.
Notwithstanding these observations, given the high growth rate that the service sectorof a number of Asian countries has achieved recently, and consequently the increasingshare of services in total output, one may wonder if industrialisation is a step that may bebypassed today.
3.1 Kaldor’s Laws
Kaldor’s first law states that the faster the rate of growth of manufacturing output, thefaster the rate of growth of GDP, giving to manufacturing the role of engine of growth. Thecharacteristics of manufacturing, and industry in general, as a sector with strong input-output linkages, confer this sector this potential. This role is based not only on this aspect,but also on the fact that capital accumulation and technical progress are strongest in theindustrial sector, having important spillover effects on the rest of the economy. This meansthat the stronger the rate of growth of manufacturing, the stronger the rate of growth of therest of the economy. Kaldor viewed the high growth rate characteristics of middle-incomecountries as an attribute of the process of industrialisation.
In his seminal work and for empirical purposes, Kaldor specified the laws as relationshipsbetween growth rates because he estimated a cross-section of countries with data at twopoints in time. Kaldor’s first law, that is,that manufacturing acts as the engine of growth, can
be examined through a regression of non manufacturing output growth ( nmY ) on
manufacturing output growth ( mY ), and therefore be specified as:
mnm YaaY ˆˆ21 += (1)
where a2 indicates the strength and size of the impact (elasticity) of the manufacturing
sector’s growth on the rest of the economy. This coefficient, therefore, can be viewed as themain indicator of the ‘engine of growth’ role of this sector. Similar regressions are estimatedfor agriculture, industry and services to assess their capacity as engines of growth.2
Kaldor’s second law states that there is a strong positive relationship between thegrowth of manufacturing production and the growth of manufacturing productivity. Thislaw is also known as Verdoorn´s Law and has been interpreted as evidence in support of
2 A regression of total output growth on manufacturing output could yield spurious results as, by definition,total output growth is the weighted sum of output growth of the different sectors. Although the impactof this accounting identity on the coefficient can easily be corrected, it will also affect the standarderror of coefficient a
2 and hence we prefer to use Equation (1).
116 Malaysian Journal of Economic Studies Vol. 46 No. 2, 2009
Jesus Felipe, Miguel León-Ledesma, Matteo Lanzafame and Gemma Estrada
the existence of increasing returns in the manufacturing sector (for example, McCombie etal. 2002). The expansion of output leads to a process of macro-dynamic increasing returnsthat derive productivity gains. This can also be interpreted from the point of view ofemployment creation: sectors subject to scale economies have lower employment elasticitieswith respect to output, as productivity grows as a by-product of output expansion.3 Asproductivity growth equals output growth minus employment growth, regressingproductivity on total growth, that is, the original Verdoorn specification, could inducespurious correlation.4 For this reason, Verdoorns’ law, that is, the induced productivitygrowth effect linked to increasing returns, is specified as a regression of manufacturing
employment growth ( me ) on manufacturing output growth ( mY ). Algebraically,
mm Ybbe ˆˆ 21 += (2)
Kaldor’s hypothesis is that output expansion induces a less than proportionalemployment expansion that leads to productivity gains. The coefficient b
2, the elasticity of
employment with respect to output, is an indicator of the degree of increasing returns. Thecloser it is to 1, the smaller the induced productivity growth and returns to scale. Traditionally,estimates of the coefficient for manufacturing are close to 0.5. With a few assumptionsabout the capital-output ratio, a 0.5 coefficient implies increasing returns in a standardproduction function (see Ros 2000:130-133). The interpretation of this coefficient is thateach additional percentage point in the growth of output is associated with a 0.5 per centincrease in employment and a 0.5 per cent increase in growth productivity. As in the case ofthe first law, similar regressions are estimated for agriculture, industry and services.
As mentioned earlier, rather than interpreting the Kaldorian model of growth as atheoretical explanation of the ‘ultimate’ causes of growth, these hypotheses are formulatedempirically and interpreted as stylised facts that can shed light on the questions posed atthe start of the section. Thus, these two hypotheses provide a set of growth facts at thesectoral level that can be used in conjunction with several theoretical interpretations toformulate a well-informed analysis of the growth performance of the Asian countries. Asindicated above, Kaldor’s laws, when viewed as a set of empirical regularities, appear to beconsistent with many growth models that do not rely on diminishing returns to capital. Thedivision of labour and ideas-driven growth models of Romer (1986; 1990), Lucas (1988) andAghion and Howitt (1992) are all consistent with Kaldor’s second law, although they are setup in economies without an explicit sectoral structure.
Kaldor’s third law states that when manufacturing grows, the rest of the sectors (notsubject to increasing returns) will transfer labour to manufacturing, raising the overallproductivity of the economy. Dynamic sectors absorb workers from the stagnant ones in
3 It is also the result of a second mechanism. This is that employment growth in industry tends toincrease the rate of growth of productivity in other sectors. This is the consequence of diminishingreturns to labour in other sectors and the absorption of surplus labour from these sectors as well as offaster increase in the flow of goods into consumption.
4 Using the original Verdoorn equation mm Yp βα += , where is growth of productivity,
we can rearrange to obtain (2) as mm Y)(e βα −+−= 1 .
117Malaysian Journal of Economic Studies Vol. 46 No. 2, 2009
Sectoral Engines of Growth in Developing Asia: Stylised Facts and Implications
which the level and growth of labour productivity is very low. This raises the overallproductivity level of the economy and its rate of growth. The key mechanisms that explainhow structural change affects productivity growth through compositional effects weredeveloped by Baumol et al. (1985) and by Baumol et al. (1989). According to their view,backward economies with a large pool of employment in low productivity activities (normallyagriculture) experience a bonus from structural change. This ‘structural bonus’ arises as aresult of the transfer of labour from low to high productivity activities. This will automaticallyincrease the productivity level of the economy. This happens even if this transfer of resourcesconstitutes mainly a shift from agriculture to services. However, as the logistic pattern ofstructural change drives resources towards services, and given that productivity growth inthis sector is usually slower than in industry, countries experience a ‘structural burden.’This ‘burden’ means that the process of structural change has a negative impact onproductivity growth. In the limit, as most of the labour force has moved into the servicesactivities, economies experience ‘asymptotic stagnancy’ as productivity growth is mostlydetermined by the services sector.5
The relationship between Kaldor’s third law and Baumol’s asymptotic stagnancy theoryis evident. the importance of a sector depends not only on its role in generating scaleeconomies, but also on how it absorbs resources from other sectors, leading to the ‘structuralbonus’ and ‘structural burden’ effects. Although a sector with low productivity growth canabsorb resources from agriculture leading to increased productivity levels, this source ofeconomic growth is asymptotically exhausted. In the transition process, Kaldor’s third lawwill be an important source of growth but, in the limit, induced productivity growth is thekey to generating growth (see Fagerberg 2000; Timmer and Szirmai 2000).
4. An Examination of Kaldor’s LawsRegressions of Kaldor’s first two laws were conducted using a panel of 17 developingAsian countries for 1980-2004. The panel is unbalanced as data for some countries for someyears are missing at the beginning of the sample. The lack of consistent time-series data onemployment for Bangladesh, India, and Lao PDR, prevented us from including these countriesin the regression of the second law. The exploitation of both cross-sectional and time series
5 This description of how resource transfers in the process of structural change affect growth is veryuseful to analyse compositional effects. However, three aspects have to be noted. First, the concept ofasymptotic stagnancy is a relative one. That is, growth is driven by activities whose productivity growsat a relatively slower rate than industry but productivity growth may still be high in absolute terms.Secondly, it is assumed that services are necessarily a slow productivity growth sector. However, thedistinction between stagnant and dynamic sectors has become blurred in recent decades by technologicaladvances that have provoked very important changes in the organisation and productivity of manyservices activities. Finally, although it is almost tautological that employment shifts towards the morelabour-intensive activities, the model does not consider that growth in the different sectors isinterdependent. That is, the expansion of some activities, especially those with increasing returns, canhave an important impact on productivity in other activities. New growth theory has emphasised howthe expansion of markets leads to increased division of labour and intermediate products leading tomore sophisticated production processes that can be enjoyed by all the sectors in the economy.Similarly, some activities with more traditional input-output linkages can act as engines of growththrough backward and forward effects on other sectors. Innovation and knowledge accumulation arebut another source of sectoral spillovers that link together the developments of different sectorsindependently of their relative size in the economy.
118 Malaysian Journal of Economic Studies Vol. 46 No. 2, 2009
Jesus Felipe, Miguel León-Ledesma, Matteo Lanzafame and Gemma Estrada
data allowed us to include all relevant information that would be thrown away in pure cross-sectional average estimates. Unlike in Kaldor’s original work, equations (1) and (2)wereestimated not in growth rates but in log levels using cointegration techniques, as thetraditional growth rates specification may be simply capturing business cycle correlationsthat are not the focus of our investigation. Moreover, it is the relationship in levels thatcaptures the technological and equilibrium relationship between the variables. It is for thisreason that cointegration matters. Therefore, Kaldor’s first law was estimated in log-levels as:
1 2ln lnnm m
it itiY Yα α= + (3)
where nm
itY denotes the level of non manufacturing output for country i at time t; m
itY
denotes manufacturing output; and αli is the fixed-effect for each of the countries. This
equation was also used in the estimation of the corresponding relationships for agriculture,industry and services.
And the second law was estimated as:
1 2ln lnm m
it itie Yβ β= + (4)
where m
ite denotes manufacturing employment. This panel of time-series allowed us to
address other potentially relevant problems. The first one was the bias that might beassociated from the endogeneity of the regressors. Although our interest was in the stylisedfact stemming from the reduced form, and not in a structural interpretation, endogeneitymay induce biases in the estimated coefficients. For this reason we used a Fully ModifiedOrdinary Least Squares (FMOLS) panel cointegration estimator, as advocated by Pedroni(2000). This is an estimator for heterogeneous panels. It allowed to us obtain a panelestimate of the coefficient as well as country-specific coefficients. The FMOLS estimator isa semi-parametric method that takes into account leads and lags to account for possibleendogeneity of the right side variables and mis-specified dynamics. A homogeneouscointegration vector was estimated, but fixed effects and short-run dynamics were allowedto be unit-specific.
The second problem that could arise is that there may be a high degree of correlationbetween the different variables across countries. World shocks affecting variables such asthe terms of trade may induce cross-sectional correlation and also correlation between theregressed variables that is unrelated to the Kaldorian hypotheses that are the focus of theanalysis. For this reason, we also provided estimates of the panel cointegration coefficientsincluding heterogeneous (country-specific) unobserved components estimated by obtainingprincipal components.6 This estimate allowed for a high degree of heterogeneity as well, butassumed common slope coefficients. These estimates are referred to as UC (UnobservedComponent) elasticities. Therefore, Equations (3) and (4) were augmented with the principalcomponent (PC):
1 2 3ln lnnm m
it it ti iY Y PCδ δ δ= + + (5)
and
1 2 2ln lnm m
it it ti ie Y PCλ λ λ= + + (6)
6 See Forni et al. (2001). In practice, we included only the first principal component in the model.
119Malaysian Journal of Economic Studies Vol. 46 No. 2, 2009
Sectoral Engines of Growth in Developing Asia: Stylised Facts and Implications
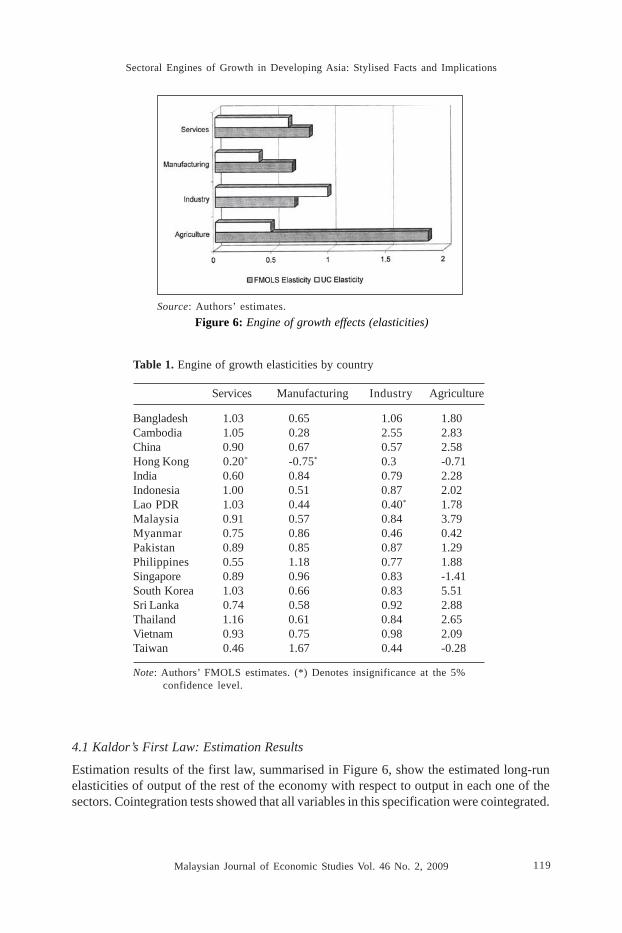
4.1 Kaldor’s First Law: Estimation Results
Estimation results of the first law, summarised in Figure 6, show the estimated long-runelasticities of output of the rest of the economy with respect to output in each one of thesectors. Cointegration tests showed that all variables in this specification were cointegrated.
Figure 6: Engine of growth effects (elasticities)Source: Authors’ estimates.
Table 1. Engine of growth elasticities by country
Services Manufacturing Industry Agriculture
Bangladesh 1.03 0.65 1.06 1.80Cambodia 1.05 0.28 2.55 2.83China 0.90 0.67 0.57 2.58Hong Kong 0.20* -0.75* 0.3 -0.71India 0.60 0.84 0.79 2.28Indonesia 1.00 0.51 0.87 2.02Lao PDR 1.03 0.44 0.40* 1.78Malaysia 0.91 0.57 0.84 3.79Myanmar 0.75 0.86 0.46 0.42Pakistan 0.89 0.85 0.87 1.29Philippines 0.55 1.18 0.77 1.88Singapore 0.89 0.96 0.83 -1.41South Korea 1.03 0.66 0.83 5.51Sri Lanka 0.74 0.58 0.92 2.88Thailand 1.16 0.61 0.84 2.65Vietnam 0.93 0.75 0.98 2.09Taiwan 0.46 1.67 0.44 -0.28
Note: Authors’ FMOLS estimates. (*) Denotes insignificance at the 5%confidence level.
120 Malaysian Journal of Economic Studies Vol. 46 No. 2, 2009
Jesus Felipe, Miguel León-Ledesma, Matteo Lanzafame and Gemma Estrada
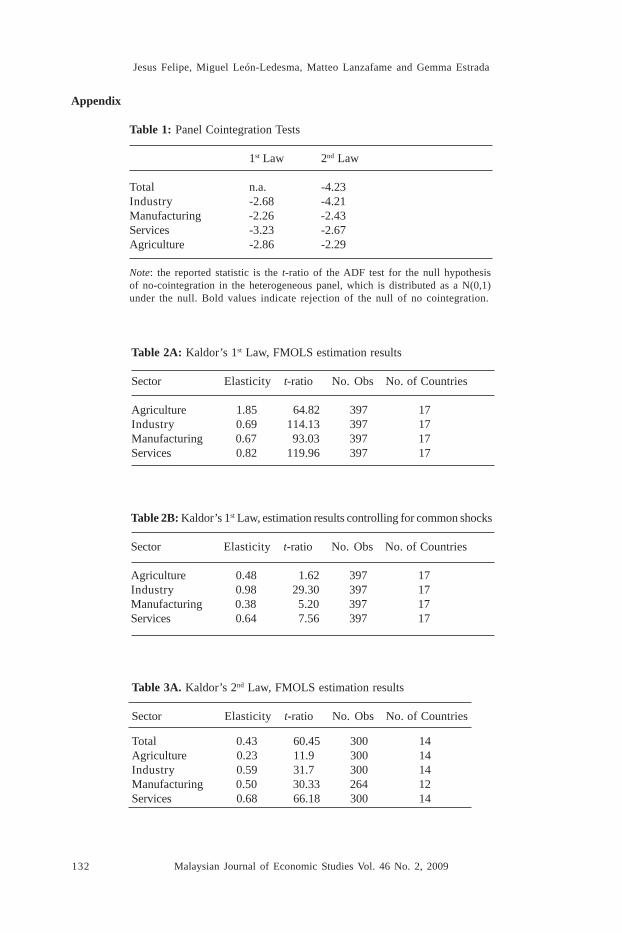
See Appendix Table 1 (Pedroni’s (2000) panel ADF statistic for heterogeneous panels areprovided). The sector with the largest engine of growth elasticity, after controlling forcommon shocks, is industry. This is followed by services and manufacturing. Agricultureappears to have a very large impact using the FMOLS estimate. The introduction of theunobserved component (UC elasticity) reduces the size of the elasticity significantly. Thisis because agricultural output is likely to be highly correlated across countries due tocommon shocks stemming from, for example, climate conditions and terms of trade shocks.The larger elasticity of industry relative to manufacturing reflects the fact that industrialactivities such as electricity and other utilities have important forward and backward linkageswith the rest of the economy.
These results also indicate that both industry and services have acted as the enginesof growth in developing Asia during the period analysed. It is important to note that serviceshave a larger impact than manufacturing. This is not due to mere compositional effects, aswe have avoided this source of spuriousness by using the output of the rest of the sectors,and not total output, as the dependent variable.
Individual country results are shown in Table 1. The strongest elasticities of the servicesector was found in Thailand, South Korea, Cambodia, Bangladesh and Lao PDR,respectively; whereas for manufacturing, Taiwan and the Philippines present the largesteffects. Cambodia and Bangladesh have significantly larger elasticities for overall industrythan for manufacturing. This may reflect the importance of utilities or construction in thesecountries. The results for Hong Kong show a surprisingly low elasticity for services and anegative (though insignificant) elasticity for manufacturing. The reason for these results isthat the non services sector in Hong Kong is only a very small fraction of output (15% in2003), therefore making the results not reliable. The FMOLS results for agriculture arebiased as in this sector, common shocks account for a large fraction of the variation ofoutput. Detailed results of the panel regressions are presented in Appendix Tables 2A & 2B.
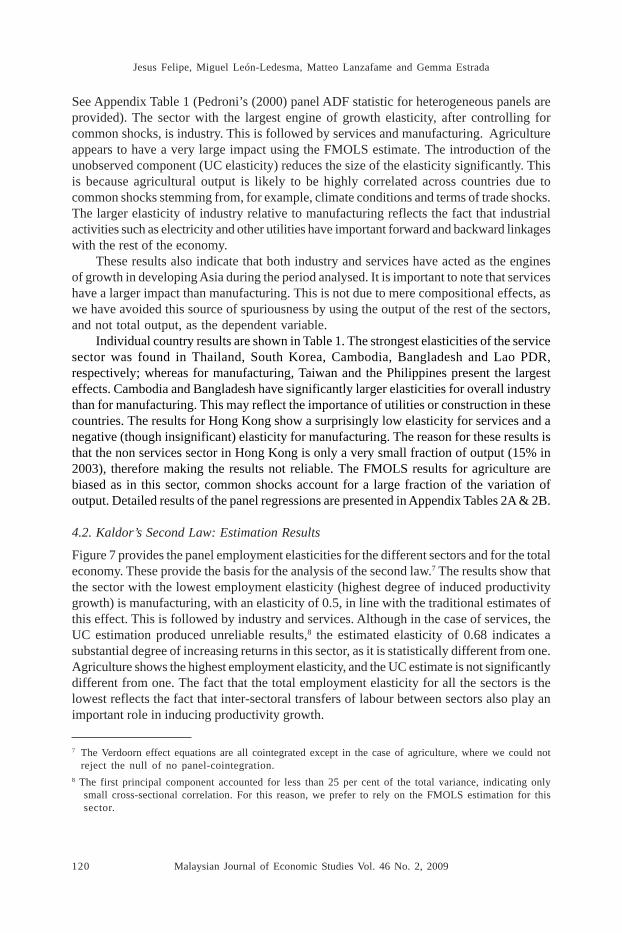
4.2. Kaldor’s Second Law: Estimation Results
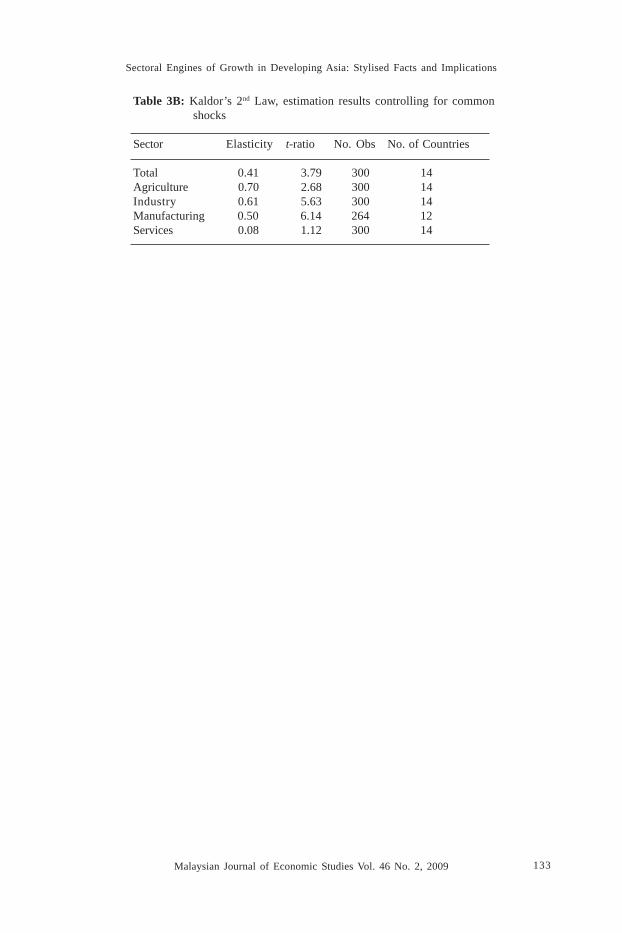
Figure 7 provides the panel employment elasticities for the different sectors and for the totaleconomy. These provide the basis for the analysis of the second law.7 The results show thatthe sector with the lowest employment elasticity (highest degree of induced productivitygrowth) is manufacturing, with an elasticity of 0.5, in line with the traditional estimates ofthis effect. This is followed by industry and services. Although in the case of services, theUC estimation produced unreliable results,8 the estimated elasticity of 0.68 indicates asubstantial degree of increasing returns in this sector, as it is statistically different from one.Agriculture shows the highest employment elasticity, and the UC estimate is not significantlydifferent from one. The fact that the total employment elasticity for all the sectors is thelowest reflects the fact that inter-sectoral transfers of labour between sectors also play animportant role in inducing productivity growth.
7 The Verdoorn effect equations are all cointegrated except in the case of agriculture, where we could notreject the null of no panel-cointegration.
8 The first principal component accounted for less than 25 per cent of the total variance, indicating onlysmall cross-sectional correlation. For this reason, we prefer to rely on the FMOLS estimation for thissector.
121Malaysian Journal of Economic Studies Vol. 46 No. 2, 2009
Sectoral Engines of Growth in Developing Asia: Stylised Facts and Implications
Source: Authors’ estimatesFigure 7: Employment elasticities with respect to output: the Verdoorn effect
Table 2: Employment elasticities by country
Total Industry Agriculture Services Manufacturing
Cambodia 0.86 1.39 1.15 1.42 1.20China 0.22 0.10 n.a. 0.75 n.a.Hong Kong 0.29 1.30 1.26 0.6 1.17Indonesia 0.41 0.98 0.31 0.48 0.47Malaysia 0.48 0.64 n.a. 0.58 0.55Myanmar 0.53 0.57 0.34 0.45 0.40*
Pakistan 0.41 0.28 0.68 0.70 0.20Philippines 0.84 1.01 0.50 1.05 0.81Singapore 0.40 0.19 0.96 0.48 0.12South Korea 0.32 0.26 n.a. 0.68 0.14Sri Lanka 0.37 0.37 0.76 0.68 0.28Thailand 0.35 0.59 n.a. 0.67 0.53Vietnam 0.34 0.35 0.60 0.68 n.a.Taiwan 0.25 0.21 0.82 0.41 0.14
Note: Authors’ FMOLS estimates; ‘n.a.’ denotes not available and (*) denotes insignificance at the 5%confidence level.
Table 2 shows the employment elasticities by country. China’s employment elasticityof industry is very low. This is followed by the elasticties for Singapore, Taiwan and SouthKorea. The latter are the most mature economies in the sample. In the case of services,

122 Malaysian Journal of Economic Studies Vol. 46 No. 2, 2009
Jesus Felipe, Miguel León-Ledesma, Matteo Lanzafame and Gemma Estrada
Taiwan, Singapore, Myanmar, Indonesia and Hong Kong have the lowest employmentelasticities. With the exceptions of Myanmar and Indonesia, these economies are also moreadvanced. It appears that economies that are either growing very rapidly or that are alreadymore mature, are the most capable of generating induced productivity growth in bothsectors and also enjoy increasing returns. This sectoral dynamism is important to avoid the‘middle income trap’. Detailed results of the panel regressions are presented in AppendixTables 3A and 3B.
4.3. Kaldor’s Third Law
Discussions of Kaldor’s third law have been carried out in regression context with littlesuccess (see McCombie 1980).9 Traditional estimates suffer from spurious correlation andidentification problems. A more useful approach consists in decomposing the growth rate
of labour productivity ( q ) into three components (see also Jaumotte and Spatafora 2007):
q
(7)
where q denotes the level of labour productivity,
q
is the growth rate of labour productivity,
and λ denotes the sector’s employment share in total employment (both variables in periods0 and t; i refers to the three sectors, agriculture, industry and services). What is theinterpretation of the three terms in the decomposition?
(i) The first term (I) is the static structural reallocation effect (SSRE). This is the contributionto productivity levels of the transfer of resources from low to high productivity sectors.It is related to Baumol’s structural bonus hypothesis. We expect that the transfer willincrease the average level of productivity of the economy as employment shares shiftfrom agriculture to services. This effect is calculated by shifting employment shareskeeping initial productivity levels of each sector constant.
(ii) The second term second term (II) is the dynamic structural reallocation effect (DSRE).It represents the contribution of the resource transfer to productivity growth and it isrelated to Baumol’s structural burden hypothesis that as employment transfers towardsservices, a sector with (in general, though not always) lower productivity growth,reduces the overall productivity growth of the economy. The effect is calculated as theinteraction between employment shifts and productivity growth.
(iii) The final term (III) is the within-sector productivity growth (WS). It is the contributionof productivity growth within each sector to overall productivity growth. This is the
9 Recently, Wells and Thirlwall (2003) estimated Kaldor’s laws with data for African countries. Thethird law is a regression of overall productivity growth on the growth of industry and the growth ofemployment outside industry. The coefficient of industry’s growth was positive while that ofemployment growth outside industry was negative, indicating that the slower the employment growthoutside industry, the faster the overall productivity grows.
123Malaysian Journal of Economic Studies Vol. 46 No. 2, 2009
Sectoral Engines of Growth in Developing Asia: Stylised Facts and Implications
growth of productivity that is not explained by sectoral shifts. It is calculated bykeeping employment shares constant and allowing productivity levels to change.
The importance of making the distinction between the static and dynamic structuralreallocation effects is that it helps distinguish between the structural bonus and burdeneffects of employment reallocation. Countries with large agricultural sectors have a lot togain from the bonus of surplus labour in low productivity activities. However, if the growthof employment is predominantly in sectors with lower scope for productivity growth, thereis a burden effect. If productivity growth in services is lower than in manufacturing, thisimposes a ‘relative’ burden (though not absolute). Note, however, that in Kaldor’sinterpretation, this reallocation is ‘induced’ by growth of the leading sector. This hypothesiscannot be examined directly by shift-share analysis, but it is clear that it is the growingsectors that will draw resources from those contracting.
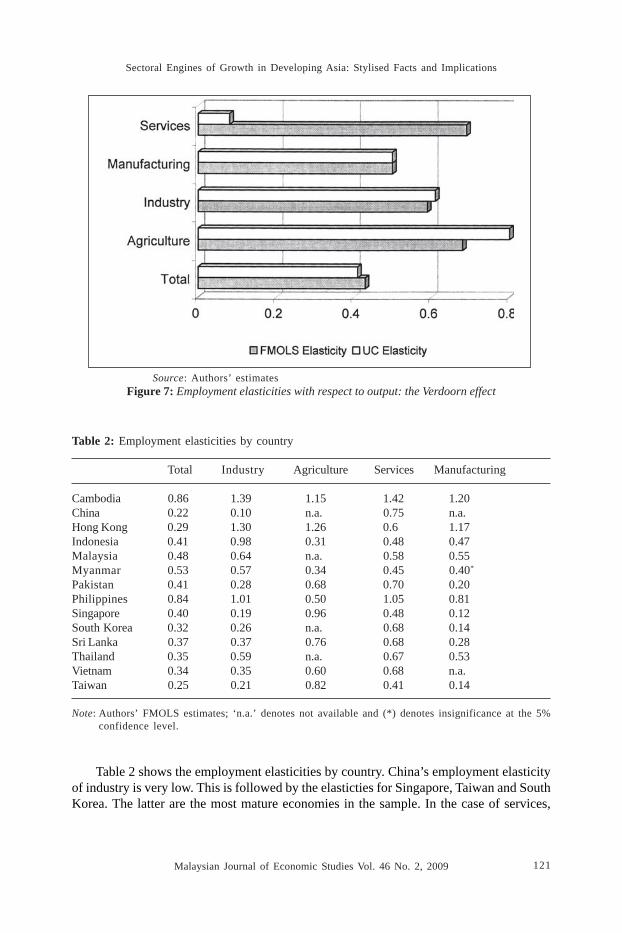
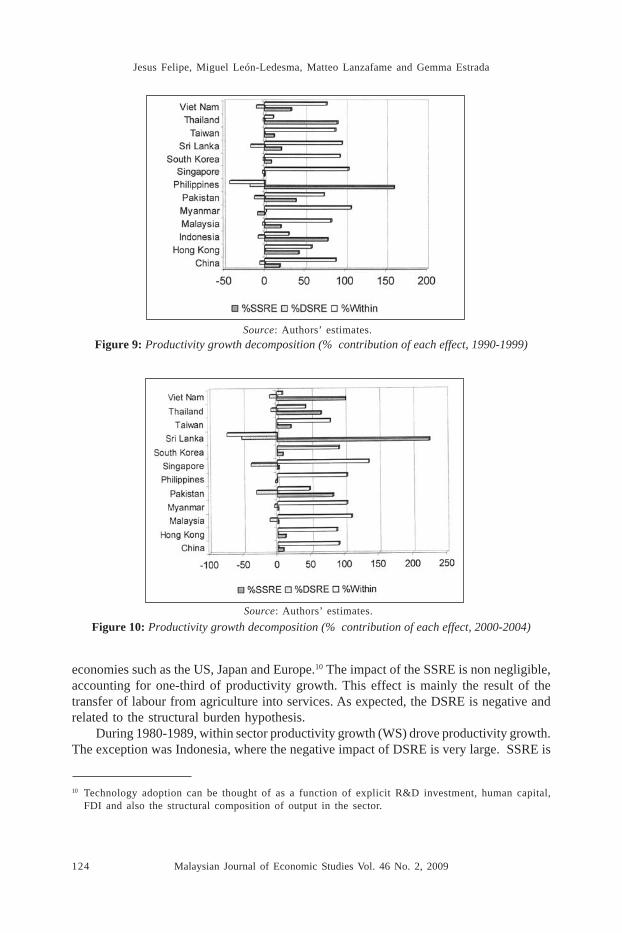
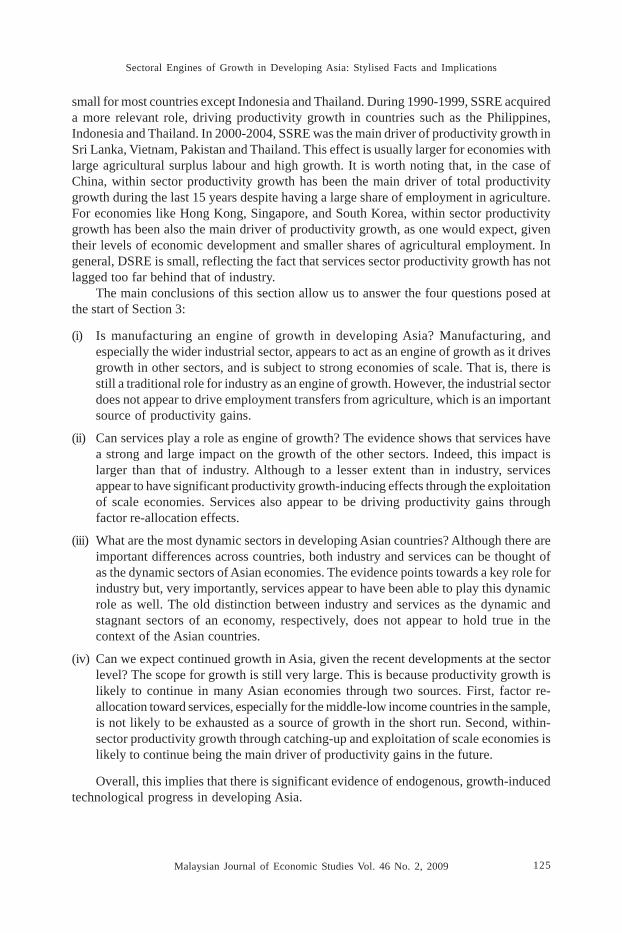
The contribution of sectoral shifts to productivity growth embedded in the third law ispresented in Figures 8, 9, and 10. We have decomposed productivity growth into its threecomponents for three different sub-periods, 1980-1989, 1990-1999 and 2000-2004. The averagecontribution of each effect throughout 1980-2004 is approximately 33 per cent for the StaticStructural Reallocation effect (SSRE), -14 per cent for the Dynamic Structural Reallocationeffect (DSRE), and 81 per cent for within sector productivity growth effect (WS). For 1980-1989, these percentages are 15.6 per cent, -22 per cent and 106.5 per cent, respectively. For1990-1999, they are 40 per cent, -6 per cent and 66 per cent, respectively; whereas for thefinal period the corresponding figures are 44 per cent, -13 per cent and 69 per cent,respectively. This shows that the SSRE gained importance during the last fifteen years. Thefigures, however, mask large differences across countries. Nevertheless, they point towardsthe WS effect as the main driver of overall productivity growth. WS is related to productivitygains stemming from scale economies and, importantly, technology absorption from frontier
Figure 8: Productivity growth decomposition(% contribution of each effect, 1980-1989)
Source: Authors’ estimates.
124 Malaysian Journal of Economic Studies Vol. 46 No. 2, 2009
Jesus Felipe, Miguel León-Ledesma, Matteo Lanzafame and Gemma Estrada
Figure 9: Productivity growth decomposition (% contribution of each effect, 1990-1999)Source: Authors’ estimates.
Source: Authors’ estimates.
Figure 10: Productivity growth decomposition (% contribution of each effect, 2000-2004)
economies such as the US, Japan and Europe.10 The impact of the SSRE is non negligible,accounting for one-third of productivity growth. This effect is mainly the result of thetransfer of labour from agriculture into services. As expected, the DSRE is negative andrelated to the structural burden hypothesis.
During 1980-1989, within sector productivity growth (WS) drove productivity growth.The exception was Indonesia, where the negative impact of DSRE is very large. SSRE is
10 Technology adoption can be thought of as a function of explicit R&D investment, human capital,FDI and also the structural composition of output in the sector.
125Malaysian Journal of Economic Studies Vol. 46 No. 2, 2009
Sectoral Engines of Growth in Developing Asia: Stylised Facts and Implications
small for most countries except Indonesia and Thailand. During 1990-1999, SSRE acquireda more relevant role, driving productivity growth in countries such as the Philippines,Indonesia and Thailand. In 2000-2004, SSRE was the main driver of productivity growth inSri Lanka, Vietnam, Pakistan and Thailand. This effect is usually larger for economies withlarge agricultural surplus labour and high growth. It is worth noting that, in the case ofChina, within sector productivity growth has been the main driver of total productivitygrowth during the last 15 years despite having a large share of employment in agriculture.For economies like Hong Kong, Singapore, and South Korea, within sector productivitygrowth has been also the main driver of productivity growth, as one would expect, giventheir levels of economic development and smaller shares of agricultural employment. Ingeneral, DSRE is small, reflecting the fact that services sector productivity growth has notlagged too far behind that of industry.
The main conclusions of this section allow us to answer the four questions posed atthe start of Section 3:
(i) Is manufacturing an engine of growth in developing Asia? Manufacturing, andespecially the wider industrial sector, appears to act as an engine of growth as it drivesgrowth in other sectors, and is subject to strong economies of scale. That is, there isstill a traditional role for industry as an engine of growth. However, the industrial sectordoes not appear to drive employment transfers from agriculture, which is an importantsource of productivity gains.
(ii) Can services play a role as engine of growth? The evidence shows that services havea strong and large impact on the growth of the other sectors. Indeed, this impact islarger than that of industry. Although to a lesser extent than in industry, servicesappear to have significant productivity growth-inducing effects through the exploitationof scale economies. Services also appear to be driving productivity gains throughfactor re-allocation effects.
(iii) What are the most dynamic sectors in developing Asian countries? Although there areimportant differences across countries, both industry and services can be thought ofas the dynamic sectors of Asian economies. The evidence points towards a key role forindustry but, very importantly, services appear to have been able to play this dynamicrole as well. The old distinction between industry and services as the dynamic andstagnant sectors of an economy, respectively, does not appear to hold true in thecontext of the Asian countries.
(iv) Can we expect continued growth in Asia, given the recent developments at the sectorlevel? The scope for growth is still very large. This is because productivity growth islikely to continue in many Asian economies through two sources. First, factor re-allocation toward services, especially for the middle-low income countries in the sample,is not likely to be exhausted as a source of growth in the short run. Second, within-sector productivity growth through catching-up and exploitation of scale economies islikely to continue being the main driver of productivity gains in the future.
Overall, this implies that there is significant evidence of endogenous, growth-inducedtechnological progress in developing Asia.
126 Malaysian Journal of Economic Studies Vol. 46 No. 2, 2009
Jesus Felipe, Miguel León-Ledesma, Matteo Lanzafame and Gemma Estrada
5. Production Structure Similarities, Technology Diffusion and Catch upIn this section, we address the third question posed in the introduction, namely, ‘what is thecontribution of structural change to productivity growth and catching up’? While regressionanalysis of the first two Kaldorian hypotheses for the Asian countries has providedsignificant evidence of endogenous, growth-induced technological progress, for countrieslagging behind the technological frontier endogenous technological progress will be partlydependent on the acquisition and mastering of more advanced production techniques fromthe leader countries, which in turn will be determined by such factors as national R&D,human capital and trade openness.
Furthermore, if technology is (at least to a certain extent) sector-specific, its diffusionfrom the most advanced to the less advanced countries will be more intense and faster, thehigher the degree of structural (or sectoral) similarity between them. As a result, ceterisparibus, technological progress will be faster for a less-advanced country the more itsproduction structure resembles that of the technological leader. This reasoning is in linewith Abramovitz (1986; 1993) who has argued that the extent to which developing economiescan benefit from the superior technology developed in advanced countries depends ontheir ‘absorption capability.’ The latter is itself a composite variable, determined by social aswell as economic and structural factors, such as the degree of ‘technological congruence’with countries on the technological frontier.
Here, we propose a simple approach to measure the significance of the extent to whichthe productivity growth performance of the Asian countries has benefited from technologicalspillovers from the most advanced countries flowing via a ‘structural channel’.
First, in the spirit of the technology-gap approach to growth and convergence(Gerschenkron 1962; Nelson and Wright 1992), we defined a measure of the potential fortechnology transfer from the most advanced to the less advanced countries as given by thelabour productivity ratio between the two, that is,
G
(8)
where t denotes time, qL(t) is the level of labour productivity in the technologically most-
advanced country and qi(t) is its counterpart in the less-advanced country i.
Second, we devised a measure of structural similarity making use of Krugman’sspecialisation index (or K-index) developed by Midelfart-Knarvirk et al. (2000). 11 At eachpoint in time, the index was constructed as the sum over the k sectors of the absolutedifferences between the sectors’ shares of value-added in country i and in the technologicalleader. Its value ranged between zero and two and increased with degree of specialisation,
11 When applied to country-level bilateral comparisons, it is constructed as: ( ) ( ) - ( )k kiL i Lk
K t abs v t v t⎡ ⎤= ⎣ ⎦∑ ,
where
v
and ( )kix t denotes value-added of country i in sector k at time t and ( )k
Lv t refers to
the technological leader. Instead of value-added, Midelfart-Knarvirk et al. (2000) employed the grossvalue of output as a measure of activity level, on the grounds that this makes the results of the analysisless likely to be biased by the effects of structural shifts in outsourcing to other sectors. This optionwas precluded by data unavailability in our case.
127Malaysian Journal of Economic Studies Vol. 46 No. 2, 2009
Sectoral Engines of Growth in Developing Asia: Stylised Facts and Implications
that is, it is higher the more a country’s production structure differs from that of thetechnological leader. For instance, a K-index value of 0.5 indicates that 25 per cent of theproduction structure of country i is out of line with that of the technologically most-advanced country, in the sense that one-quarter of its total output does not correspond tothe average sectoral composition in the latter.12
In this way, one can build a structurally-weighted gap-variable by first designing ameasure of structural weights as
( )( )
12
iL
iL
K tW t = − (9)
where 0 < WiL (t) < 1, which increases with the degree of structural similarity, that is as K
iL (t)
falls. The structurally-weighted gap-variable is(10)
This variable can then be introduced in a growth regression (see Temple 1999) tocapture the idea that the impact of technology spillovers on the less-advanced countries’growth performance will be dependent not only on the size of the technology gap but alsoon the degree of structural similarity between technological leaders and followers. Weexamined this hypothesis by making use of a simple reduced-form growth equation.
Given the nature of the hypothesis under examination, finely sectorally disaggregateddata are essential for estimation proposes. Taking this into account, we restricted ourattention to manufacturing and constructed the structural weights W
iL (t) using United
Nations Industrial Development Organization (UNIDO) data for 28 sectors.13 The remainingdata weretaken from the World Bank World Development Indicators (WDI) and theInternational Labour Organization (ILO).14
To smooth out cyclical effects, structural weights WiL (t) were computed as 3-year
moving-averages of annual values. The regression was estimated by means of panel datatechniques using an unbalanced panel of annual data over 1982-2002 for nine Asian countries- Bangladesh, China, Hong Kong, Indonesia, Malaysia, Singapore, South Korea, Sri Lankaand Taiwan. The regression estimated is
(11)
where qit is the rate of labour productivity growth in country i and the gap variables are
constructed taking both the USA and Japan as the two technological-leaders with respectto the less-advanced Asian countries in our sample. We used the fixed-effects Least Squares
12 The upper bound of the index equals two because, by construction, it takes into account both positiveand negative deviations across sectors. Thus, when calculating the ‘implied-percentage deviation’ thevalue in question must be halved: in the example (0.5/2) per cent is 25 per cent.
13 The data are from the UNIDO ‘Industrial Statistics Database’ 2006 at the 3-digit level of ISIC Code(Revision 2).
14 The source of the manufacturing value-added series for the US is the Department of Commerce, Bureauof Economic Analysis.
128 Malaysian Journal of Economic Studies Vol. 46 No. 2, 2009
Jesus Felipe, Miguel León-Ledesma, Matteo Lanzafame and Gemma Estrada
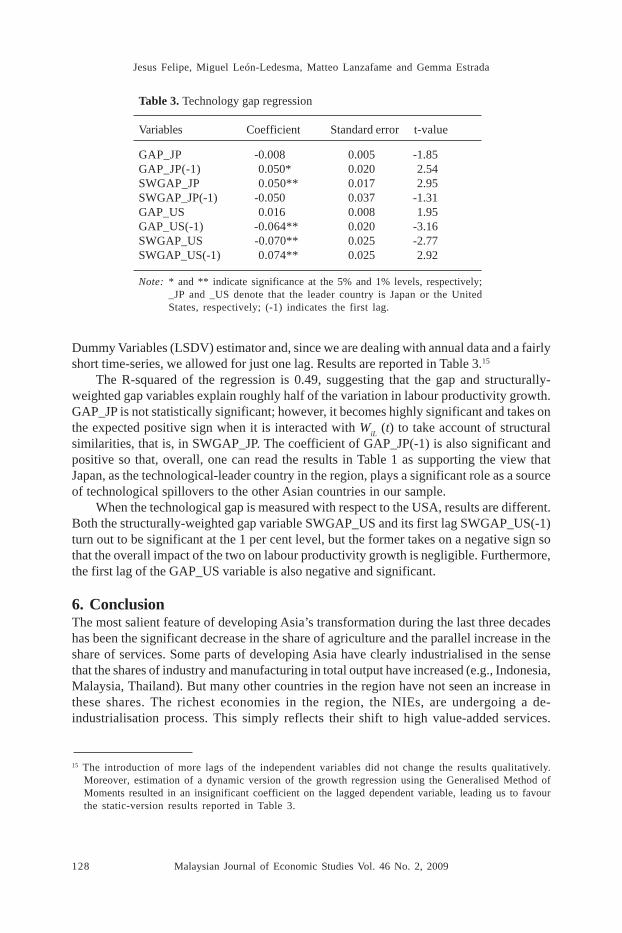
Dummy Variables (LSDV) estimator and, since we are dealing with annual data and a fairlyshort time-series, we allowed for just one lag. Results are reported in Table 3.15
The R-squared of the regression is 0.49, suggesting that the gap and structurally-weighted gap variables explain roughly half of the variation in labour productivity growth.GAP_JP is not statistically significant; however, it becomes highly significant and takes onthe expected positive sign when it is interacted with W
iL (t) to take account of structural
similarities, that is, in SWGAP_JP. The coefficient of GAP_JP(-1) is also significant andpositive so that, overall, one can read the results in Table 1 as supporting the view thatJapan, as the technological-leader country in the region, plays a significant role as a sourceof technological spillovers to the other Asian countries in our sample.
When the technological gap is measured with respect to the USA, results are different.Both the structurally-weighted gap variable SWGAP_US and its first lag SWGAP_US(-1)turn out to be significant at the 1 per cent level, but the former takes on a negative sign sothat the overall impact of the two on labour productivity growth is negligible. Furthermore,the first lag of the GAP_US variable is also negative and significant.
6. ConclusionThe most salient feature of developing Asia’s transformation during the last three decadeshas been the significant decrease in the share of agriculture and the parallel increase in theshare of services. Some parts of developing Asia have clearly industrialised in the sensethat the shares of industry and manufacturing in total output have increased (e.g., Indonesia,Malaysia, Thailand). But many other countries in the region have not seen an increase inthese shares. The richest economies in the region, the NIEs, are undergoing a de-industrialisation process. This simply reflects their shift to high value-added services.
Table 3. Technology gap regression
Variables Coefficient Standard error t-value
GAP_JP -0.008 0.005 -1.85GAP_JP(-1) 0.050* 0.020 2.54SWGAP_JP 0.050** 0.017 2.95SWGAP_JP(-1) -0.050 0.037 -1.31GAP_US 0.016 0.008 1.95GAP_US(-1) -0.064** 0.020 -3.16SWGAP_US -0.070** 0.025 -2.77SWGAP_US(-1) 0.074** 0.025 2.92
Note: * and ** indicate significance at the 5% and 1% levels, respectively;_JP and _US denote that the leader country is Japan or the UnitedStates, respectively; (-1) indicates the first lag.
15 The introduction of more lags of the independent variables did not change the results qualitatively.Moreover, estimation of a dynamic version of the growth regression using the Generalised Method ofMoments resulted in an insignificant coefficient on the lagged dependent variable, leading us to favourthe static-version results reported in Table 3.
129Malaysian Journal of Economic Studies Vol. 46 No. 2, 2009
Sectoral Engines of Growth in Developing Asia: Stylised Facts and Implications
Various other countries in the region have had difficulties in industrialising. India and thePhilippines are among the most significant examples, although recent data for India seem toindicate that its manufacturing share has increased. Others (e.g., the Pacific economies)face industrialisation as a very difficult process, since they have limited opportunities tostart with. It is important to note that the patterns of structural transformation of output andemployment are different, as the decline in agricultural employment is taking place at a muchslower pace than that of output. This has led, in many countries across the region, to rather‘asymmetric’ output and employment structures. Indeed, one could say that much of theregion looks like a service economy in terms of output, but like an agricultural economy interms of employment. An additional important feature of structural change in developingAsia is that, despite its rapid growth, the level of labour productivity in most of the regionstill lags far behind that of industrial countries. Given that investments were made in highlyproductive industry and services segments of the economy, this implies that there are stillmany other large segments of the economy with very low productivity. It therefore seemsthat structural transformation in developing Asia is taking place through a combination ofmodern and sophisticated industry and services with high and rising productivity levels,with many other backward ones (probably where a large part of the labour from agricultureis being transferred) that operate at very low productivity levels.
Regressions of Kaldor’s laws indicate that both industry and services appear to haveacted as engines of growth in the Asian economies. The manufacturing sector is subject tostrong increasing returns, although the degree of increasing returns in services is non-negligible too. Although employment in industry and manufacturing is shrinking as a shareof total employment, this does not necessarily imply that their role as the most dynamicsectors has decreased. Induced productivity growth in manufacturing can indeed be seenas the reason for its decline as a share of output for countries that had previouslyindustrialised. Notable exceptions are China and India. In the former, industrial activityremains relatively very important and in the latter large-scale industrialisation has notoccurred. Services appear to have contributed largely to growth as they drag employmentfrom the less productive agricultural sector. Although induced productivity growth in servicesis smaller than in industry, services appear to be a remarkably dynamic sector. Both factorstogether have contributed to the importance of services as an engine of growth. In the limitand as the large reserves of employment in agriculture are exhausted, the contribution ofservices to productivity growth is likely to decrease as its productivity growth is lower thanthat of industry.
This will largely depend on the composition of services between dynamic and stagnantactivities. However, there is no reason to believe that, in the medium run, growth will declinedue to the increase in the share of services in total output. There are three main reasons forthis:
(i) There is still a very large scope for structural change, especially in the less developedeconomies of Asia.
(ii) The role of the dynamic industrial sector remains very relevant for economies whereindustrialisation occurred previously.
130 Malaysian Journal of Economic Studies Vol. 46 No. 2, 2009
Jesus Felipe, Miguel León-Ledesma, Matteo Lanzafame and Gemma Estrada
(iii) The scope of within-sector productivity growth is still very large. This is likely to befacilitated by structural change itself, which increases the capacity of Asian economiesto absorb foreign technology. This catching-up process is likely to lead to importantproductivity gains in services.
Finally, the technology-gap approach, as formalised in the framework used here, providesa simple way to analyse the impact of technology diffusion on the growth performance ofthe Asian countries. The results support the view that technological spillovers foster growthwhen Japan is taken as the technological-leader, but this is not the case when the leader-country is the USA. Structural similarity seems to be playing a significant part in theprocess of technology diffusion both from Japan and the US, although the overall influencefrom the latter is fairly small.
ReferencesAbramovitz, M. 1993. The origins of the post-war catch-up and convergence boom. In The Dynamics
of Technology, Trade and Growth, ed. J. Fagerberg, B. Verspagen and N. von Tunzelmann pp.21–52. Aldershot: Edward Elgar.
Abramovitz, M. 1986. Catching-up, forging ahead and falling behind. Journal of Economic History46: 386-406.
Aghion, P. and Howitt, P. 1992. A model of growth through creative destruction. Econometrica 60:323-351.
Anant, T.C.A., R. Hasan, P. Mohapatra, R. Nagaraj and S.K. Sasikumar. 2006. Labor markets inindia: issues and perspectives. In Labor Markets in Asia: Issues and Perspectives, ed. J. Felipeand R. Hasan, pp. 205-305. London: Palgrave Macmillan for ADB.
Asian Development Bank. 2007. Asian Development Outlook 2007. Manila.Asian Development Bank. 2006. Statistical Database System. Manila.Banister, J. 2005. Manufacturing employment in China. Monthly Labor Review (July): 11-29.Baumol, W.J., S.A.B. Blackman and E. Wolff. 1989. Productivity and American Leadership: the
Long View. MIT Press; Cambridge.Baumol, W.J., S.A.B. Blackman and E. Wolff. 1985. Unbalanced growth revisited: asymptotic
stagnancy and new evidence. The American Economic Review 75(4):806-817.Chadha, G.K. and P.P. Sahu. 2002. Post-reform setbacks in rural employment issues that need
further scrutiny. Economic and Political Weekly, 25 May: 1998-2026.Directorate General of Budget, Accounting and Statistics. Various years. China Statistical Yearbook.
Taipei.Fagerberg, J. 2000. Technological progress, structural change and productivity growth: a comparative
study. Structural Change and Economic Dynamics 11: 393-411.Felipe, J. and G. Estrada. 2007. Benchmarking developing Asia’s manufacturing sector. Economics and
Research Department Working Paper 101 (September). Asian Development Bank, Manila, Philippines.Forthcoming in the International Journal of Development Issues.
Forni M., M.Hallin, M.Lippi, and L. Reichlin. 2001. The Generalized Factor model: identificationand estimation. The Review of Economics and Statistics 82(3): 540-554.
Gerschenkron, A. 1962. Economic Backwardness in Historical Perspective: a Book of Essays.Belknap Press: Cambridge, MA.
Jaumotte, F. and N. Spatafora. 2007. Asia Rising: A Sectoral Perspective. IMF Working Paper 07/130.
Kaldor, Nicolas. 1966. Causes of the Slow Rate of Growth in the United Kingdom. CambridgeUniversity Press: Cambridge.
131Malaysian Journal of Economic Studies Vol. 46 No. 2, 2009
Sectoral Engines of Growth in Developing Asia: Stylised Facts and Implications
Kaldor, Nicolas. 1967. Strategic Factors in Economic Development. New York State School ofIndustrial and Labor Relations, Cornell University: New York, Ithaca.
Leamer, Edward and James Levinsohn. 1995. International trade theory: the evidence. In TheHandbook of International Economics: Vol. III, ed. G. Grossman and K. Rogoff, pp.1339-1394.Amsterdam: North-Holland.
Lewis, A.W. 1954. Economic development with unlimited supplies of labor. The Manchester School22: 139-191.
Lucas, R.E. Jr. 1988. On the mechanics of economic development. Journal of Monetary Economics22: 3-42.
McCombie, J.S.L. 1980. On the quantitative importance of Kaldor’s Laws. Bulletin of EconomicResearch 32: 102-112.
McCombie, J.S.L., M.Pugnoand B.Soro (eds.) (2002) Productivity Growth and EconomicPerformance: Essays on Verdoorn’s Law. Palgrave Macmillan.
Midelfart-Knarvik, K.H., H.G. Overman, S.J. Redding and A.J.Venables.2000. The Location ofEuropean Industry. Economic Paper 142, European Commission Directorate-General forEconomic and Financial Affairs.
National Bureau of Statistics. Various years. China Statistical Yearbook. Beijing.Nelson, R.R. and G. Wright.1992. The rise and fall of American technological leadership: the post-
war era in historical perspective. Journal of Economic Literature 30: 1931-1964.Nixson, Frederick I. 1990. Industrialisation and structural change in developing countries. Journal of
International Development 2(2):310-333.Pedroni, P. 2000. Fully modified OLSfor heterogeneous cointegrated panels. Advances in Econometrics
15: 93-130.Pieper, U. 2000. De-industrialisation and the social and economic sustainability nexus in developing
countries: cross-country evidence on productivity and employment. The Journal of DevelopmentStudies 36(4) :66-99.
Rodrik, Dani. 2006. Industrial development: stylised facts and policies. John F. Kennedy School ofGovernment, Harvard University. Available: http://ksghome.harvard.edu/~drodrik/industrial%20development.pdf.
Romer, P.M. 1990. Endogenous technological change. Journal of Political Economy 98: 71-102.Romer, P.M. 1986. Increasing returns and long run growth. Journal of Political Economy 94: 1002-
1037.Ros, Jaime. 2000. Development Theory & The Economics of Growth. The University of Michigan
Press: Ann Arbor.Rowthorn, R. and R. Rawasmany. 1997. De-industrialisation: Causes and Implications. IMF Working
Paper p9/42.Rowthorn, R. and R. Ramaswamy. 1999. Growth, trade and de-industrialisation. IMF Staff Papers
46(1): 18-41.Sundrum, R.M. 1987. Growth and Income Distribution in India. New Delhi: Sage.Temple, J. 1999. The new growth evidence. Journal of Economic Literature 37: 112-156.Timmer, M.P. and A. Szirmai. 2000. Productivity growth in Asian manufacturing: the structural
bonus hypothesis examined. Structural Change and Economic Dynamics 11: 371-392.Wells, H. and A.P. Thirlwall. 2003. Testing Kaldor’s growth laws across the countries of Africa.
African Development Review 15(2-3): 89-105.World Bank. 2006. World Development Indicators Online. Washington, DC.Wu, Henry and W. Wan. 2004. Economic Development in a Globalized Environment. East Asian
Evidences. Kluwer Academic Publishers.
132 Malaysian Journal of Economic Studies Vol. 46 No. 2, 2009
Jesus Felipe, Miguel León-Ledesma, Matteo Lanzafame and Gemma Estrada
Table 1: Panel Cointegration Tests
1st Law 2nd Law
Total n.a. -4.23Industry -2.68 -4.21Manufacturing -2.26 -2.43Services -3.23 -2.67Agriculture -2.86 -2.29
Note: the reported statistic is the t-ratio of the ADF test for the null hypothesisof no-cointegration in the heterogeneous panel, which is distributed as a N(0,1)under the null. Bold values indicate rejection of the null of no cointegration.
Table 2A: Kaldor’s 1st Law, FMOLS estimation results
Sector Elasticity t-ratio No. Obs No. of Countries
Agriculture 1.85 64.82 397 17Industry 0.69 114.13 397 17Manufacturing 0.67 93.03 397 17Services 0.82 119.96 397 17
Table 2B: Kaldor’s 1st Law, estimation results controlling for common shocks
Sector Elasticity t-ratio No. Obs No. of Countries
Agriculture 0.48 1.62 397 17Industry 0.98 29.30 397 17Manufacturing 0.38 5.20 397 17Services 0.64 7.56 397 17
Table 3A. Kaldor’s 2nd Law, FMOLS estimation results
Sector Elasticity t-ratio No. Obs No. of Countries
Total 0.43 60.45 300 14Agriculture 0.23 11.9 300 14Industry 0.59 31.7 300 14Manufacturing 0.50 30.33 264 12Services 0.68 66.18 300 14
Appendix
133Malaysian Journal of Economic Studies Vol. 46 No. 2, 2009
Sectoral Engines of Growth in Developing Asia: Stylised Facts and Implications
Table 3B: Kaldor’s 2nd Law, estimation results controlling for commonshocks
Sector Elasticity t-ratio No. Obs No. of Countries
Total 0.41 3.79 300 14Agriculture 0.70 2.68 300 14Industry 0.61 5.63 300 14Manufacturing 0.50 6.14 264 12Services 0.08 1.12 300 14