sector profile for solar photovoltaics in canada · navigant consulting inc., sector profile for...
TRANSCRIPT
SECTOR PROFILE FOR SOLAR PHOTOVOLTAICS IN CANADA

Report – 2012-063 (RP-TEC) March 29th , 2012

Report – 2012-063 (RP-TEC) March 29th , 2012
SECTOR PROFILE FOR SOLAR PHOTOVOLTAICS IN CANADA
Prepared by:
Navigant Consulting, Inc. 333 Bay Street
Suite 1250 Toronto, Ontario, M5H 2R2
Uwww.navigant.com U
Presented to:
CanmetENERGY, Varennes Research Centre
Date:
March 29th, 2012

Report – 2012-063 (RP-TEC) - i - March 29th , 2012
CITATION
Navigant Consulting Inc., Sector Profile for Solar Photovoltaics in Canada, report # 2012-063 (RP-TEC), CanmetENERGY, Natural Resources Canada, March 2012, 100 pp.
DISCLAIMER
This report is distributed for informational purposes and does not necessarily reflect the views of the Government of Canada nor constitute an endorsement of any commercial product or person. Neither Canada nor its ministers, officers, employees or agents makes any warranty in respect to this report or assumes any liability arising out of this report.
ACKNOWLEDGEMENTS
The preparation of this report was funded by Natural Resources Canada through the ecoENERGY Innovation Initiative.

Report – 2012-063 (RP-TEC) - ii - March 29th , 2012
TABLE OF CONTENTS
1 Executive Summary........................................................................................................................... 1 1.1 Key Takeaways...................................................................................................................................... 1
2 Provincial and Federal Solar PV Incentives......................................................................................... 5 2.1 Ontario ................................................................................................................................................. 8
2.1.1 RESOP ..................................................................................................................................... 8 2.1.2 Green Energy and Green Economy Act, 2009 ......................................................................... 10 2.1.3 Ontario’s Domestic Content Requirements ............................................................................ 11 2.1.4 Feed-in Tariff (FIT) 2.0............................................................................................................ 15
2.2 British Columbia.................................................................................................................................. 18 2.3 Alberta................................................................................................................................................ 20 2.4 Saskatchewan ..................................................................................................................................... 21 2.5 Manitoba ............................................................................................................................................ 23 2.6 Quebec ............................................................................................................................................... 23 2.7 New Brunswick.................................................................................................................................... 24 2.8 Prince Edward Island ........................................................................................................................... 24 2.9 Newfoundland & Labrador .................................................................................................................. 25 2.10 Nova Scotia ......................................................................................................................................... 25 2.11 Northwest Territories.......................................................................................................................... 25 2.12 Yukon.................................................................................................................................................. 26 2.13 Nunavut.............................................................................................................................................. 26
3 PV Markets in Canada ..................................................................................................................... 27 3.1 Ontario ............................................................................................................................................... 27 3.2 Renewable Energy Standard Offer Program (RESOP)............................................................................ 28 3.3 MicroFIT and FIT.................................................................................................................................. 28
3.3.1 Samsung................................................................................................................................ 36 3.4 Outside of Ontario............................................................................................................................... 37
4 PV Supply Chain in Canada .............................................................................................................. 39 4.1 Module Manufacturing........................................................................................................................ 40 4.2 Balance of System Manufacturing ....................................................................................................... 41 4.3 Downstream Supply Chain................................................................................................................... 44 4.4 Business Models and Channels to Market............................................................................................ 44 4.5 Other Parts of the Supply Chain........................................................................................................... 47 4.6 Building Integrated PV (BIPV) Supply Chain.......................................................................................... 48
5 Key Manufacturer Profiles............................................................................................................... 49 5.1 Modules.............................................................................................................................................. 50 5.2 Inverters ............................................................................................................................................. 54 5.3 Racking ............................................................................................................................................... 56 5.4 Other .................................................................................................................................................. 57 5.5 Contract Manufacturing ...................................................................................................................... 57 5.6 Recent Factory Closures ...................................................................................................................... 58
6 Current Economic and Productivity Statistics................................................................................... 59 6.1 Metrics................................................................................................................................................ 60 6.2 Domestic Demand............................................................................................................................... 61 6.3 Economic – Exports ............................................................................................................................. 66 6.4 Energy Production............................................................................................................................... 66 6.5 Employment........................................................................................................................................ 68
7 Canadian Workforce Assessment .................................................................................................... 70 7.1 Employment Needs ............................................................................................................................. 70 7.2 Skills Needed....................................................................................................................................... 70

Report – 2012-063 (RP-TEC) - iii - March 29th , 2012
7.2.1 Market Forecasts................................................................................................................... 71 7.2.2 Labour Requirements ............................................................................................................ 72
7.3 Current Supply .................................................................................................................................... 73 7.4 Gaps and Challenges ........................................................................................................................... 73
8 PV Innovation System In Canada ..................................................................................................... 75 8.1 Introduction........................................................................................................................................ 75 8.2 Summary of Funding Programs............................................................................................................ 75 8.3 Canadian PV Technology Clusters ........................................................................................................ 78 8.4 Key Companies and Competitors in Each Technology Cluster ............................................................... 87 8.5 Global PV Innovations ......................................................................................................................... 88
8.5.1 Modules ................................................................................................................................ 88 8.5.2 Power Electronics & Balance of Systems ................................................................................ 91 8.5.3 BIPV Systems......................................................................................................................... 92
9 Appendix A: Key Players Across the PV Supply Chain in Canada....................................................... 93 10 Appendix B: Leading Canadian University PV Researchers ............................................................... 98
10.1 Universities ......................................................................................................................................... 98

Report – 2012-063 (RP-TEC) - iv - March 29th , 2012
Table of Figures
Figure 1 – 2011 Canadian PV Installations, 289 MWDC .............................................................................. 1
Figure 2 – Progress of RESOP Solar (MWAC) 2F .......................................................................................... 10
Figure 3 – SaskPower Green Options Partners Program 2011 Projects, 50 MW...................................... 23
Figure 4 – 2011 Canadian PV Installations, 289 MWDC25F .......................................................................... 27
Figure 5 – MicroFIT Project Overview (MW)29F......................................................................................... 30
Figure 6 – Overview of FIT Solar Projects (MW) 31F ................................................................................... 32
Figure 7 – Ground-mount vs Rooftop Solar PV FIT (MWAC) 32F ................................................................... 32
Figure 8 – Cumulative Canadian PV Installations MWDC38F........................................................................ 38
Figure 9 – PV Supply Chain .................................................................................................................... 39
Figure 10 – Process Steps for Crystalline Silicon Module ........................................................................ 40
Figure 11 – Balance of System Components........................................................................................... 42
Figure 12 – Downstream Supply Chain................................................................................................... 44
Figure 13 – Economic Impact Methodology ........................................................................................... 60
Figure 14 – Skill set requirements.......................................................................................................... 72
Figure 15 – Canadian Federal Funding Sources (as of 2012) ................................................................... 76
Figure 16 – Global PV Module Technology Overview and Efficiencies Reached ...................................... 90

Report – 2012-063 (RP-TEC) - v - March 29th , 2012
Table of Tables
Table 1 – Summary of PV Incentives in Canada ........................................................................................ 5
Table 2 – MicroFIT and FIT Domestic Content related Designated Activities........................................... 12
Table 3 – Ontario's Domestic Content Requirements ............................................................................. 13
Table 4 – Original MicroFIT Pricing......................................................................................................... 14
Table 5 – Original FIT Price Schedule...................................................................................................... 14
Table 6 – LTEP Technology Targets 36F ...................................................................................................... 16
Table 7 – Original FIT vs. Proposed FIT 2.0 Pricing.................................................................................. 17
Table 8 – BC Standing Offer Program Base Price 9F .................................................................................. 19
Table 9 – BC Standing Offer Program Delivery Time Adjustment Table 10F................................................. 20
Table 10 – Green Options Partners Program Tariff Rates ....................................................................... 22
Table 11 – FIT Ground Mount Contract Holders33F ................................................................................... 33
Table 12 – Early Leaders in Canadian-Made Modules............................................................................. 41
Table 13 – Early Leaders in Canadian-Made Inverters ............................................................................ 43
Table 14 – Leading Canadian PV Component Manufacturers ................................................................. 49
Table 15 – Sample of Contract Manufacturing Relationships ................................................................. 57
Table 16 – Summary of Economic and Productivity Metrics ................................................................... 59
Table 17 – Assumed Breakout of Installed Costs .................................................................................... 61
Table 18 – 2011 Canadian PV Installations and Economic Impacts ......................................................... 62
Table 19 – Economic Impact of Owner's Costs ....................................................................................... 62
Table 20 – Ontario FIT Domestic Content Requirements 48F ...................................................................... 63
Table 21 – 2011 Economic Output of Canadian Module Manufacturing ................................................. 64
Table 22 – Economic Output of Canadian Inverter Manufacturing ......................................................... 65
Table 23 – Economic Output of Canadian Racking Manufacturing.......................................................... 65
Table 24 – Economic Output of Electrical Component Distribution ........................................................ 66
Table 25 – Economic Output Driven by Manufacturing Exports.............................................................. 66
Table 26 – Generation of PV Fleet as of the End of 2011........................................................................ 67
Table 27 – Labor Intensity (FTE/MW)..................................................................................................... 68
Table 28 – Estimated 2011 PV Employment........................................................................................... 69
Table 29 – Skill Set by Activity Type ....................................................................................................... 71
Table 30 – Navigant's Market Projection [MWDC] ................................................................................. 72
Table 31 – 2011 Labour Supply Data for Skill Sets Relevant to the PV Industry ....................................... 73

Report – 2012-063 (RP-TEC) - vi - March 29th , 2012
Table 32 – Shortfall in labour relative to 2011 levels.............................................................................. 74
Table 33 – Canadian Companies and Their Key Innovations Grouped by Technology Clusters ................ 81
Table 34 – Key Competitors for PV Companies that Innovate in Canada ................................................ 87
Table 35 – Key Global Innovations in PV Modules .................................................................................. 89
Table 36 – Key Global Innovations and Programs in Power Electronics, and Balance of Systems for PV Systems ................................................................................................................................. 91
Table 37 – Key Global BIPV Innovations and Programs........................................................................... 92
Table 38 – PV-Related University-Based Research Leaders in Canada .................................................... 98

Report – 2012-063 (RP-TEC) - 1 - March 29th , 2012
1 EXECUTIVE SUMMARY Overall, there were 289 MWDC of solar photovoltaic (PV) capacity installed in Canada in 2011 representing over 335 gigawatt-hours (GWh) of power generation on an annual basis. This level of activity created $584 million of direct economic output and employed approximately 5,100 direct full time equivalents on an annual basis. As shown in Figure 1 below, the majority of these installations were made in Ontario.
RESOP, 156, 54%
microFIT, 79, 28%
FIT - CAE, 27, 9%
Rest of Canada, 27, 9%
Figure 1 – 2011 Canadian PV Installations, 289 MWDC
Canada’s PV sector has been undergoing significant change over the last five years, during which time the focus of the Canadian PV sector shifted from primarily residential off-grid and niche applications to grid-connected systems. Due primarily to Ontario’s Renewable Energy Standard Offer Program (RESOP) and subsequent Feed-in Tariff (FIT) program for grid-connected PV, Canada’s solar sector has been an area of significant investment in 2011.
This sector profile looks at the state of the market throughout Canada including various incentives in place across Canada, provides an update on installations in 2011, describes the PV supply chain, key manufacturers, economic impacts, workforce capability and the state of R&D initiatives in Canada.
The key takeaways from this sector profile are presented in the next subsection and are also embedded throughout the report.
1.1 Key Takeaways Below is a list of key takeaways by chapter.

Report – 2012-063 (RP-TEC) - 2 - March 29th , 2012
Chapter 2 – Provincial and Federal Solar PV Incentives 1) Ontario’s PV-focused procurement programs, including the Renewable Energy
Standard Offer Program, Feed-In Tariff (FIT) program and microFIT program, differentiate it from the rest of Canada and have led to significantly more PV related investment as a result.
2) One of the primary objectives of Ontario’s Green Energy and Green Economy Act, 2009 was the promotion of renewable energy related employment and the FIT program included Domestic Content requirements for PV and wind generation.
3) The FIT Review Report recommends a greater role for Aboriginal and Community based projects, restricts the siting of ground mount projects on prime agricultural lands, and reduces FIT pricing from 10% to 32%.
4) Outside of Ontario Net Metering is available in most provinces and territories, however, residential rates are not sufficient to justify investment in solar PV for the majority of the population and there are few PV-specific incentive programs. Thus, outside of Ontario, the market is almost all off-grid systems.
5) Total public budgets for photovoltaics in Canada were reported to be $61.8 million in 2010. This is mainly due to the incentive program in Ontario that provides a feed-in tariff for PV generated electricity.
Chapter 3 – PV Markets in Canada
6) Ontario accounted for 91% of the 289 MWDC of PV that was installed in Canada in 2011.
7) Over 11,000 microFIT-PV projects were installed in Ontario in 2011 representing over 100 MWDC of distributed PV. Although they are a maximum of 10 kWAC in size, some microFIT projects are being rejected due to distribution system limitations, primarily in rural parts of Ontario.
8) Over 75%, or 940 MWAC, of the 1,200 MWAC of FIT projects under contract are for ground mounted projects. Over 800 MWAC of these ground mount projects, are held by seven contract holders. As of February 2012, there were an additional 5,900 MWAC of applications on file with the Ontario Power Authority.
9) Despite the large number of projects and MW capacity under contract in Ontario under the FIT program, very few have started construction primarily due to delays associated with the new environmental approval process, the Renewable Energy Approval, and obtaining a connection impact assessment.
10) Despite its steady growth, the off-grid market’s total market share will continue to decrease as the grid connected market expands rapidly.
Chapter 4 – PV Supply Chain in Canada 11) The PV Supply Chain comprises of upstream equipment and component
manufacturing, as well as downstream services needed to build PV components and

Report – 2012-063 (RP-TEC) - 3 - March 29th , 2012
install projects. The majority of these services are offered in Canada but only some of these products are made in Canada.
12) The early leaders in Canadian module manufacturing are located in Ontario and most have vertically integrated by developing their own projects in order to ensure sufficient demand to justify the manufacturing investment.
13) A number of original equipment manufacturers that decided to invest in Ontario after 2010 opted for a contract manufacturing model which reduces their investment, allows them to satisfy the Domestic Content requirements and capture some of the Ontario FIT market.
14) The Building Integrated PV market is relatively immature as compared to other forms of PV and is still at the demonstration phase in Canada.
Chapter 5 – Key Manufacturer Profiles
15) Leading Canadian PV component manufacturers had revenues from all of their Canadian related PV activities of $359 million in 2011 and employed over 2,100 people.
16) Non-Ontario based component manufacturers represented the majority of exports in 2011.
Chapter 6 – Current Economic and Productivity Statistics
17) In 2011, the Canadian PV industry drove $584 M of economic output and directly employed approximately 5,100 full time equivalents.
18) At the end of 2011 total Canadian PV installations of 571 MW could generate 722 GWh per year with a potential value of $48 M/Year.
Chapter 7 – Canadian Workforce Assessment 19) The Canadian PV industry has a shortage of approximately 3,800 FTEs to meet the
likely demand through 2014.
Chapter 8 – PV Innovation System in Canada 20) Several federal and provincial funding sources are available for PV manufacturers to
access at each stage of product commercialization. Key sources include SDTC, NSERC, Ontario Innovation Demonstration Fund and Ontario Centres of Excellence.
21) Development of formal networks and state-of-the-art testing facilities through federal and provincial funding has increased company and university research collaboration.
22) Key innovative PV companies in Canada have raised more than $95 million in government and venture capital funding. In addition, private companies are dedicating more than $20 million annually for PV R&D in Canada.

Report – 2012-063 (RP-TEC) - 4 - March 29th , 2012
23) Globally, more than US$375 million is spent per year on cells and PV module R&D alone.
24) The European Commission, US Department of Energy, and large inverter manufacturers are major funding sources for R&D on power electronics, and balance of systems.
25) A legislative push, particularly in Europe, for new construction to be net-zero (or near net-zero) energy buildings in 2020 and beyond is the key driver for BIPV systems research.

Report – 2012-063 (RP-TEC) - 5 - March 29th , 2012
2 PROVINCIAL AND FEDERAL SOLAR PV INCENTIVES The sizes of PV markets in Canada, and throughout the globe, are primarily dictated by the level of support they receive in the form of facilitation and subsidies from government. This chapter describes the various support mechanisms for PV throughout each of the provinces and territories. Support varies from allowing electricity consumers to offset their own electricity consumption through net metering programs to cost based incentives that pay a premium above alternative costs of electricity.
Ontario stands out from other Canadian provinces owing to its procurement programs focused on PV, including the Renewable Energy Standard Offer Program (RESOP), Feed-in Tariff (FIT) and microFIT program, all described in greater detail in this chapter. By contrast, the other Canadian provinces have enabled grid-connected PV through net metering programs. However, net metering benefits alone are not sufficient to encourage most customers to build PV directly or to have a third party finance and own projects. Thus, the total installed grid connected capacity of PV outside of Ontario remains modest and limited to the off-grid market for the most part. While some provinces continue to consider solar PV specific incentive schemes, there are currently no concrete plans to implement any programs in the immediate future.
At the federal level, with the exception of the federal Income Tax Act’s Accelerated Capital Cost Allowance (CCA) of 50% on a declining balance basis to eligible PV systems, there are no incentives available for solar PV.
In this chapter we describe the regulatory and other incentive programs in Ontario and the rest of Canada.
A summary of these incentives is shown in Table 1.
Table 1 – Summary of PV Incentives in Canada
Solar PV Specific Programs
Province Program Description
Ontario RESOP
FIT / microFIT
FIT 2.0
20 year contract; $0.42/kWh for every kWh, 10 MWAC cap per project
20 year contract; rate schedule based on system size; domestic content requirement, agricultural land restriction
Revised (lower) pricing; priority for community and Aboriginal participation

Report – 2012-063 (RP-TEC) - 6 - March 29th , 2012
Alberta
Solar PV Equipment Pilot Program
ENMAX Generate Choice Home Solar Program
Grants of up to $19,500 per system for up to 10 kW systems, targeting farmers
Utility installs and operates 1.3 kW system; customer pays combination of down payment and monthly charge
Quebec Operational Solar Assistance Program
PV system must displace the use of fossil fuels and be located on a municipal, institutional, commercial, industrial or agricultural building
75% of total PV project costs paid up to $300,000
$7 million budget
Federal Incentive
Incentive Description
Accelerated Capital Cost Allowance (CCA)
Asset class 43.2, allows for depreciation of 50% on a declining basis for eligible PV systems
Net Metering
Province (West to East, then Territories)
Maximum System Size Treatment of Net Excess Energy
British Columbia 50 kW Carried forward 1 year at which point utility has option to pay out at rate of 8.16 cents / kWh
Alberta 1 MW Carried forward 1 year
Saskatchewan 100 kW Carried forward up to 1 year, then granted to utility. Saskatchewan Research Council (SRC) will cover 35% of capital costs up to $35,000.
Manitoba 10 MW Customers are required to purchase a bidirectional meter

Report – 2012-063 (RP-TEC) - 7 - March 29th , 2012
Ontario 500 kW Carried forward 1 year
Quebec 50 kW Carried forward and granted to utility after 24 months
New Brunswick 100 kW Carried forward until March of each year and then claimed by utility
Prince Edward Island 100 kW Credited at retail rate
Newfoundland & Labrador
Program currently under development
Nova Scotia 1 MW Carried forward 1 year and then granted to utility
Northwest Territories No net metering but has Alternative Energy Technologies Program that subsidizes small renewable energy projects
Yukon Program currently under development
Nunavut No Program
Key Takeaway 1. Ontario’s PV-focused procurement programs, including the Renewable Energy Standard Offer Program, Feed-In Tariff (FIT) program and microFIT program, differentiate it from the rest of Canada and have led to significantly more PV related investment as a result.

Report – 2012-063 (RP-TEC) - 8 - March 29th , 2012
2.1 Ontario There are three active and one former program that facilitate solar PV in Ontario. Net Metering, FIT and microFIT are active and the RESOP is no longer issuing new contracts, but a number of projects are still under development. This section will discuss these programs in the following order:
1. Net Metering
2. RESOP
3. MicroFIT
4. FIT
Net Metering and microFIT are focused on residential and small commercial applications, where the RESOP and FIT are for larger commercial rooftop and utility scale solar systems. The microFIT and the FIT program were developed as a result of the Green Energy and Green Economy Act, 2009 (GEA). This important legislation not only created these incentives programs, it also had a meaningful impact on Ontario’s renewable energy sector as whole and spurred investment in Ontario based manufacturing due to domestic content requirements embedded within the programs. This subsection will describe important elements of each of the incentives programs as well as an overview of the GEA and the domestic content requirements.
Net Metering
Ontario’s Net Metering initiative allows electricity customers to generate electricity from a renewable energy source and offset their electricity consumption by using the power they generate by injecting excess power into the distribution system. Local distribution companies’ (LDCs) track how much power is being injected into the grid and this amount can be used for up to one year to offset future electricity consumption. After one year, any excess generation credits are retired by the LDC. Key eligibility criteria for net metering are:
You must generate electricity primarily for your own use;
The electricity must be generated solely from a renewable resource (wind, water, solar energy or biomass); and
The maximum capacity of the generation facility can’t be more than 500 kilowatts.
2.1.1 RESOP
Overview
The RESOP was launched in November 2006 to encourage the development of smaller renewable energy projects. The standardized approach towards contracting aimed at reducing development cost and risks, as compared with competitive request for proposal (RFP) processes, and therefore allowed smaller developers to obtain contracts. The program had no formal

Report – 2012-063 (RP-TEC) - 9 - March 29th , 2012
targets but was intended to encourage approximately 1,000 MW of new renewable generation within 10 years. Eligible technologies included wind, solar, hydro and various bio-energy technologies including woody biomass and bio-gas generation. Within a year and a half the RESOP program had over 1,400 MW of projects under contract, and solar PV represented over 525 MW or over 37% of the total amount of contracted projects. 0F
1
Pricing
The RESOP program had a very simplified approach towards pricing for PV and offered a standard rate of $0.42 / kWh. There was no pricing or size differentiation for solar PV and both micro and utility scale projects received the same rate under the RESOP program. However, in order to maximize returns, developers applied for projects at the upper limit of the allowed project size (10 MWAC) in order to achieve economies of scale.
Eligibility
In order to be eligible for the RESOP program, projects had to:
1. Connect at distribution voltage (less than fifty kilovolts)
2. Have a valid Connection Impact Assessment (CIA)
3. Demonstrate control of the proposed project location
4. Specify the category applicable to the project under the former environmental assessment requirements1F
2
5. Allow the OPA to access the generation meter data
Relevant Program Rules
The RESOP program had a project size cap of 10 MWAC and allowed generators three years to bring their projects into commercial operation from the contract execution date. The Ontario Power Authority offered a one-year contract extension to RESOP contract holders in the summer of 2009 in exchange for a security deposit and liquidated damages provisions. This extension provided greater flexibility to RESOP contract holders during a time when solar costs continued to decline. As can be seen from Figure 2 below, the majority of RESOP contracts that were issued are still in force and over half have achieved commercial operation. Navigant anticipates the vast majority of the remaining projects under contract will achieve commercial operation.
1 Ontario Power Authority, RESOP Archive, http://archive.powerauthority.on.ca/sop/Storage/97/9262_RESOP_Progress_Report_February_2009.pdf, accessed on line February 29, 2012. 2 The environmental assessment process was updated in 2009 – 2010 through the introduction of the Renewable Energy Approval process.

Report – 2012-063 (RP-TEC) - 10 - March 29th , 2012
Figure 2 – Progress of RESOP Solar (MWAC)2F
3
Source: OPA – RESOP Archive and Q3 2011 Contract Management Report
At the time that the RESOP program was introduced installed costs for PV systems were significantly higher than they are today and there was no experience with commercial or utility scale systems in Ontario. The RESOP pricing of $0.42 / kWh was intended to be exploratory with limited expectations of the total capacity or number of projects that would be awarded contracts. However, due to the significant decline in module and system costs, the RESOP contracts increased significantly in value and an active secondary market for RESOP contracts emerged.
The RESOP program was put under review in May of 2008. At the time there was significant interest in the program but given challenges that some generators were facing connecting to the distribution system in parts of the province there were outstanding questions on the role of this program and how it fit in with other on-going renewable procurements. Simultaneously, Ontario was facing significant economic distress to the global financial crisis, and manufacturing suffered considerably.
2.1.2 Green Energy and Green Economy Act, 2009
Ontario’s microFIT and FIT programs, launched in September 2009, are electricity generation procurement programs where developers apply for contracts under standardized rules, pricing and contracts. The microFIT and FIT program are considered the cornerstone of the provincial government’s Green Energy and Green Economy Act, 2009 (GEA). Announced in May 2009, the GEA had multiple objectives that resulted in important changes for renewable energy development in Ontario. Two of the major objectives within the GEA were 1) Promoting and reducing barriers to renewable energy development and 2) Maximizing renewable energy
3 OPA – RESOP Archive and Q3 2011 Contract Management Report.

Report – 2012-063 (RP-TEC) - 11 - March 29th , 2012
related employment in Ontario. These objectives were achieved through a variety of policy actions that included:
Giving the Minister of Energy the authority to direct the OPA to develop a FIT program with domestic content requirements
Addressing local opposition by removing municipal authority to restrict renewable energy development
Streamlining environmental approvals through standardized requirements on locating and siting renewable energy projects through the creation of a one window approach and a six month service guarantee for obtaining environmental approvals
Created a Renewable Energy Facilitation Office (REFO) to assist proponents through approvals processes
Giving priority access to renewables by requiring transmitters and distributors to connect renewable generators when connection is requested in writing and meets technical, economic and other requirements
Reducing regulatory uncertainty by expanding the objectives of the Ontario Energy Board “…to promote the use and generation of electricity from renewable energy sources…”
Allowing transmitters and distributors to recover costs related to investments to connecting renewable generation facilities from all electricity consumers
The most important policy action related to the PV sector is the requirement to include domestic content provisions within the microFIT and FIT program. These provisions are described in greater detail in the next sub-section.
2.1.3 Ontario’s Domestic Content Requirements
A key objective of the GEA was to create investment in Ontario based manufacturing of renewable energy equipment. One of the few changes to Bill 150, which became the GEA, was the requirement that domestic content provisions be included as part of a FIT program. This element was in contrast to the precursor RESOP which did not include any such provisions.
The domestic content provisions mandate specific PV related components and activities to be completed by Ontario based manufacturers and service providers. Each activity, referred to as Designated Activities in the FIT Contract, had a deemed Qualifying Percentage which counts towards meeting these requirements. Table 1 provides an overview of the Designated Activities and their associated Qualifying Percentages.

Report – 2012-063 (RP-TEC) - 12 - March 29th , 2012
Table 2 – MicroFIT and FIT Domestic Content related Designated Activities
Qualifying Percentages Designated Activity
microFIT Crystalline Silicon > 10 kW
Silicon 10% 11%
Ingots/Wafers 12% 13%
Cells 10% 11%
Module 13% 15%
Inverter 9% 8%
Racking 9% 11%
Wiring and Electrical Hardware 10% 9%
On- and Off-Site Labour 27% 18%
Consulting Services - 4%
Total 100% 100%
The domestic content requirements were differentiated based on project size and on the expected in-service time for FIT projects, defined by what is called the Milestone Date for Commercial Operation in the FIT Contract, and the actual in-service for microFIT projects. The initial domestic content requirements were 40% for microFIT projects that achieved commercial operation in 2010, increasing to 60% in 2011. For FIT projects the domestic content requirement was 50% for projects with an expected in-service date prior to 2011 and 60% thereafter. Only rooftop PV projects had the opportunity to apply for contracts with a 50% domestic content requirement. Despite these shorter timelines for the lower domestic content threshold, for microFIT and rooftop FIT contracts, both were subsequently extended by the OPA due to delays experienced by developers. These delays allowed projects installed in 2011 and 2012 to comply with the 40% and 50% threshold. Navigant’s forecast on the amount of Megawatts that will be installed in 2012 to 2014 is included in the economic impact analysis in 7.2.1 Market Forecasts. An overview of the domestic content requirements and the extensions is provided in Table 3 below.

Report – 2012-063 (RP-TEC) - 13 - March 29th , 2012
Table 3 – Ontario's Domestic Content Requirements
Program DC Requirement Initial In-Service Requirement
Extension to In-Service Requirement
microFIT 40% Pre 2011 Projects that applied prior to October 8, 2010 were allowed to achieve 40% DC
Projects with contracts as of January 28, 2011 were given an additional year to achieve commercial operation, giving those that had a 40% requirement additional time.
microFIT 60% Post 2011 FIT 50% Pre 20113F
4 All FIT projects were given an additional year to achieve COD in February 2011, including those with a 50% requirement.
FIT 60% Post 2011
When first introduced the domestic content provisions created a significant amount of discussion due to the limited supply of existing manufacturing capacity within the province, but as will be discussed, this did not inhibit applications to either the microFIT or FIT programs.
MicroFIT
The microFIT program provides a simplified approach towards contracting with micro scale generators (≤10 kW) that are connected to the distribution system. Administered through the Ontario Power Authority, solar PV microFIT projects are offered 20 year contracts to buy power generated and injected into a local distribution companies system, see Table 4 for pricing. Although a variety of technologies are eligible including wind, hydro, bio-energy and solar PV, over 99% of the applications have been for solar PV projects. 4F
5
4 Due to the delay in issuing contracts, the initial pre-2011 in-service date requirement gave contract holders until April 30, 2011 to achieve commercial operation, therefore with the additional one year extension contract holders have until April 30, 2012 to achieve commercial operation before incurring any liquidated damages, which would give them up an additional six months. 5 Based on microFIT bi-weekly report, available on line: http://microfit.powerauthority.on.ca/sites/default/files/Bi-
Key Takeaway 2. One of the primary objectives of Ontario’s Green Energy and Green Economy Act, 2009 was the promotion of renewable energy related employment and the FIT program included Domestic Content requirements for PV and wind generation.

Report – 2012-063 (RP-TEC) - 14 - March 29th , 2012
Table 4 – Original MicroFIT Pricing
Rooftop or Ground-mounted Size Tranche Price Rooftop ≤ 10 kW 80.2 ¢/kWh Ground-mounted ≤ 10 kW 64.2 ¢/kWh
There are five key steps to participate in the microFIT program as follows:
1. Submit an application to the OPA
2. Obtain approval to connect the project from the LDC
3. Receive a conditional offer from the OPA
4. Build and connect the project
5. Accept the contract
The second step above was not initially included as part of the microFIT program when it was released in September 2009, but as described in Chapter 3, the response to microFIT was more than anticipated in rural Ontario and there were instances where the distribution system could not facilitate additional projects.
With over 11,000 projects connected, representing approximately over 100 MWDC of capacity 5F
6, the microFIT program has demonstrated the willingness to invest in solar PV and the ability of the industry to ramp up quickly to meet the growing demand.
FIT
FIT contracts are for twenty years in duration, and pay generators based on energy produced. As shown in Table 5 the FIT program differentiates pricing based on type and project size.
Table 5 – Original FIT Price Schedule
Rooftop or Ground Mount Size Tranches Price Rooftop > 10 kW ≤ 250 kW 71.3 c/kWh
Rooftop > 250 kW ≤ 500 kW 63.5 c/kWh
Rooftop > 500 kW 53.9 c/kWh
Ground mounted > 10 kW ≤ 10 MW 44.3 c/kWh
Initially, the FIT program’s application review process differentiated between smaller and larger projects, where smaller Capacity Allocation Exempt (CAE) projects, as defined in the Distribution System Code6F
7, were intended to be reviewed more expeditiously as compared with larger Capacity Allocation Required (CAR) projects. However, due to challenges in connecting CAE
Weekly%20FIT%20and%20microFIT%20Report%20February%2017%2C%202012.pdf, accessed March 2, 2012. 6 Ibid. 7 The Distribution System Code defines Capacity Allocation Exempt (CAE) projects, as projects connecting to a distribution system that are less than 250 kW, if connecting at 15 kV or below, or projects that are 500 kW or less if connecting at 15 kV or above.

Report – 2012-063 (RP-TEC) - 15 - March 29th , 2012
projects, both CAE and CAR projects were subject to a connection approval process as part of the application process. The steps involved in obtaining a FIT contract, prior to program review, include:
1. Submitting an application, including application security
2. OPA application review
3. OPA contract offer or application rejection
4. Contract Execution
Even after a contract was executed, FIT contract holders had to achieve certain development milestones before obtaining a Notice to Proceed (NTP) from the OPA. Prior to receiving the NTP, the OPA had the right to cancel a FIT contract and pay limited damages for development costs incurred. In order to obtain the NTP, solar PV FIT contract holders had to:
1. Obtain environmental approvals, as required, through the Renewable Energy Approval (REA) process
2. Submit a Financing Plan
3. Obtain a Connection Impact Assessment or System Impact Assessment as applicable
4. Submit a Domestic Content Plan
Under the FIT contract and rules pre-program review, solar PV contract holders have three years to build their project and achieve commercial operation.
2.1.4 Feed-in Tariff (FIT) 2.0
The FIT program rules included a provision where the program would be reviewed after two years. Although there were various types of program updates since the FIT launch in September 2009, the official program review began on October 31, 2011 and the FIT Review Report was released March 22, 2012. The FIT Review Report provides clear direction for the future of the program by providing recommendations in six strategic areas, listed and discussed below. However, only after a Ministerial Directive is issued to the OPA and the revised FIT rules and contract released, which has not yet occurred at the time of writing, will it be clear how all the recommendations within the FIT Review Report are implemented. The six strategic areas included covered in the FIT Review Report were:
Continue Ontario’s commitment to clean energy
Streamline processes and create jobs
Encourage greater community and Aboriginal participation
Improve municipal engagement
Reduce prices to reflect lower costs

Report – 2012-063 (RP-TEC) - 16 - March 29th , 2012
Expand Ontario’s clean energy economy
Highlights of the recommendations from each of these areas are discussed below.
Continue Ontario’s commitment to clean energy
The Long Term Energy Plan (LTEP) provides policy guidance to the OPA, as communicated in the Supply Mix Directive of February 17, 2011 on the amount and timing of different generation sources. The Ministry of Energy had clearly communicated that FIT 2.0 would be aligned with the targets in the LTEP. The contribution towards the provincial energy demand is communicated in the LTEP and based on this information the MW targets by technology can be calculated. Using the contracted MW targets communicated by the OPA and the Ministry of Energy, the remaining MWs needed to achieve the solar PV MW target within the LTEP can be determined. Assuming no attrition of the projects currently under contract or committed, only an additional 80 MW of solar contracts are needed to achieve the 2018 LTEP targets. See Table 6 below. This is contrasted with the nearly 5,900 MW that have submitted applications or are waiting for a distribution or transmission system upgrade, shown in Figure 6.
Table 6 – LTEP Technology Targets36F
8
Fuel Type % of 2030 Energy
Demand
GWh Capacity Factor
Forecast MW
IPSP II Contracted or
Committed
Needed to Meet Target
(No Attrition) Wind 10% 19,800 29% 7,790 6,850 940 Solar PV 2% 2,970 14% 2,510 2,430 80 BioEnergy 1% 2,574 75% 390
10,700 220 170
Water 20% 39,600 50% 9,040 9,000 9,330 (290) Total 19,700 18,830 900
This material difference in “demand and supply” for solar PV contracts will put pressure on the government to increase the role for solar PV within the future supply mix. The FIT Review Report recommends accelerating the timeline for achieving the 10,700 MW target for renewable energy to 2015 from 2018 and states that the government should review, at the end of 2013, if the renewables target should be increased.
Streamline processes and create jobs
The FIT Review Report provides a number of recommendations on improving the environmental approvals process by increasing coordination amongst Ministries and increasing the self-screening option to include eligible small-scale solar and bio-energy projects, in order to reduce the timelines required to obtain the REA.
Encourage greater community and Aboriginal participation
8 Based on the LTEP and Navigant analysis of OPA Q3 Contract Management, FIT Bi-weekly reports and announced government contracts.

Report – 2012-063 (RP-TEC) - 17 - March 29th , 2012
Going forward, applications made to the FIT program will be prioritized based on a point scoring system that will recognize and favour projects with Aboriginal and Community equity participation. In addition, 10% of the remaining FIT contract capacity will be set aside for projects that meet these requirements.
Improve municipal engagement
The scoring system used to prioritize FIT applications will also recognize projects that have conducted early engagement with municipalities where the projects are to be located. In addition, solar PV projects over 10 kW will no longer be allowed on any lands that include any prime agricultural land and the exemptions that were previously permitted to changes in zoning will no longer be permitted.
Reduce prices to reflect lower costs
In the two years that the FIT program has been in place costs for solar PV generating equipment has fallen dramatically while the prices offered have remained constant, save for the reduction to microFIT ground mount prices as described earlier in this chapter. This has resulted in increasing returns for solar PV contract holders. In 2011 alone, module prices fell 40%. Solar PV pricing in FIT 2.0 is expected to fall significantly to reflect the current market environment.
The FIT Review Report recommends reduction in prices for solar from 10% to 32%, see Table 7 below. In addition, FIT pricing will be set at the time of contract execution as compared to application, and pricing will be reviewed on an annual basis.
Table 7 – Original FIT vs. Proposed FIT 2.0 Pricing
Rooftop or Ground Mount
Size Tranches FIT 1.0 Price FIT 2.0 Recommended
% Change
≤ 10 kW 80.2 c/kWh 54.9 c/kWh -31.5%
> 10 kW ≤ 100 kW 71.3 c/kWh 54.8 c/kWh -23.1%
> 100 kW ≤ 500 kW 63.5 – 71.3 c/kWh 53.9 c/kWh -15.1 to -23.1% Rooftop
> 500 kW 53.9 c/kWh 48.7 c/kWh -9.6%
≤ 10 kW 64.2 c/kWh 44.5 c/kWh -30.7%
> 100 kW ≤ 500 kW 38.8 c/kWh -12.4%
> 500 kW ≤ 5 MW 35.0 c/kWh -21.0% Ground Mount
> 5 MW
44.3 c/kWh
34.7 c/kWh -21.7%
Expand Ontario’s clean energy economy
As described in the FIT Review Report, the government of Ontario will continue to develop its strategy to promote its clean energy economy. It will consider a number of policy actions including:

Report – 2012-063 (RP-TEC) - 18 - March 29th , 2012
Targeted financial support for smart grid demonstration projects
Consider the potential for a clean energy institute to spur innovation and achieve greater global presence for Ontario based companies
Support for Ontario manufacturers through a strategic export strategy
Create a Clean Energy Task Force to advise the government on potential strategies for Ontario’s clean energy sector
2.2 British Columbia There are three programs that facilitate solar PV in British Columbia:
1. BC Hydro Net Metering
2. FortisBC Net Metering
3. Standing Offer Program
In addition, BC Hydro had started to consult and develop a FIT program focused on new and emerging technologies but has not yet implemented it. The Net Metering and Standing Offer Programs are described below.
BC Hydro Net Metering
British Columbia’s net metering program was approved by the BCUC in May 2004. Electricity customers connected to BC Hydro’s distribution can offset their consumption by generating electricity using a technology defined as clean by the BC government, which includes solar PV7F
9, that are less than or equal to 50 kW in size. Any excess generation is used to offset future electricity bills for a one year period. At the end of the one year period, any excess generation injected into BC Hydro’s distribution system is paid at the Net Metering tariff of 8.16 cents / kWh8F
10 or applied against future bills.
9 British Columbia’s Clean or Renewable Electricity Definitions, http://www.empr.gov.bc.ca/EAED/AEPB/Documents/CleanEnergyJune.pdf , accessed on line March 2, 2012. 10 Schedule 1289 – Net Metering Service, http://www.bchydro.com/etc/medialib/internet/documents/info/pdf/info_net_metering_tariff.Par.0001.File.info_net_metering_tariff.pdf, accessed March 2, 2012.
Key Takeaway 3. The FIT Review Report recommends a greater role for Aboriginal and Community based projects, restricts the siting of ground mount projects on prime agricultural lands, and reduces FIT pricing from 10% to 32%.

Report – 2012-063 (RP-TEC) - 19 - March 29th , 2012
FortisBC Net Metering
The FortisBC’s Net Metering program was approved in September of 2009 and is very similar to the BC Hydro Net Metering program. FortisBC customers can generate their own power using clean and renewable energy and inject it into FortisBC’s distribution system, offsetting their own consumption. Systems have to be 50 kW or less in size. As opposed to the 8.16 cents/kWh paid by BC Hydro at the end of the year for any excess generation, FortisBC pays a rate based on the current electricity rate schedule.
BC Hydro Standing Offer Program
British Columbia’s Standing Offer Program was designed to encourage the development of smaller scale renewable energy projects. Projects have to be less than 15 MW in size to apply to the program and meet a number of other eligibility requirements including being a clean or renewable resource as defined in the Clean Energy Act, which includes solar PV.
Prices paid to generators under the Standing Offer Program are differentiated based on their location within the province, time of day and month of delivery (see Table 6 and Table 7). In addition, fifty percent of the contract price is escalated each year with the Consumer Price Index (CPI). The differentiated prices reflect the expected value of the energy to BC’s electricity system and the relative costs associated with transmitting power to BC’s load centres in the Lower Mainland and Vancouver Island.
Table 8 – BC Standing Offer Program Base Price9F
11
Region of Point of Injection (POI)
Base Price (2010 $ / MWh)
Vancouver Island $102.25 Lower Mainland $103.69 Kelly/Nicola $97.02 Central Interior $99.26 Peace Region $94.86 North Coast $96.17 South Interior $98.98 East Kootenay $102.18
11 BC Hydro Standing Offer Program Rules, http://www.bchydro.com/etc/medialib/internet/documents/planning_regulatory/acquiring_power/2011q1/20110125_sop_program.Par.0001.File.20110125-SOP-ProgramRules.pdf , accessed on-line, March 2, 2012.

Report – 2012-063 (RP-TEC) - 20 - March 29th , 2012
Table 9 – BC Standing Offer Program Delivery Time Adjustment Table10F
12
Month Time of Delivery Factor (TDF) Super-Peak Peak Off-Peak January 141% 122% 105% February 124% 113% 101% March 124% 112% 99% April 104% 95% 85% May 90% 82% 70% June 87% 81% 69% July 105% 96% 79% August 110% 101% 86% September 116% 107% 91% October 127% 112% 93% November 129% 112% 99% December 142% 120% 104%
At these tariffs, it is unlikely that any solar PV would be developed though there could be exceptions.
2.3 Alberta There are three programs that promote solar PV in Alberta:
1. Net Metering
6. Solar PV Equipment Pilot Program
7. ENMAX Generate Choice Home Solar Program
Each is described within this section.
Net Metering
In 2008 the province of Alberta in conjunction with the Alberta Utilities Commission introduced a Net-Metering program which gives Albertans the opportunity to produce their own electricity through micro-generation (1 MW of less) and sell any excess energy sent back into the distribution network. 11F
13
Solar PV Equipment Pilot Program
On January 30, 2012, Agriculture Alberta announced a Solar PV Equipment Pilot program, targeting farmers. Agricultural producers with annual gross incomes of $10,000 or more were eligible to apply to the program. A site assessment is completed to determine if the applicant is
12 BC Hydro Standing Offer Program – Standard Form EPA, Appendix 4, http://www.bchydro.com/planning_regulatory/acquiring_power/standing_offer_program/documents.html, accessed on line March 2, 2012. 13 Alberta Utilities Commission, Accessed February 14th 2012, http://www.auc.ab.ca/rule-development/micro-generation/Pages/default.aspx

Report – 2012-063 (RP-TEC) - 21 - March 29th , 2012
eligible to apply to the program. If eligible, funding is available for Solar PV Equipment Pilot grants based on the rated power of the solar PV system using the cumulative total of the following formula: $2.50 per Watt from 2,200 W to 3,000 W; Plus $2.00 per Watt from 3,001 W to 6,000 W; Plus $1.50 per Watt from 6,001 W and over, until the Program maximum of $19,500 has been reached. The Program maximum corresponds to a solar PV system size of 10 kW. 12F
14
The first phase of the program (Part 1) was sold out two weeks after the program was open for applications. The program is scheduled to be re-opened April 2, 2012 (Part 2) with additional funds.
ENMAX Generate Choice Home Solar Program
ENMAX, a Calgary based utility, has established a Generate Choice Home Solar Program which installs 1.3 kW solar photovoltaic systems for homeowners in Alberta. The solar systems are paid for and maintained by ENMAX and participating customers have to pay only an upfront fee and monthly rental fee to participate. There are three payment options for program participation. Homeowners may choose to:
1. Pay no down payment and have monthly fees of $59.99
2. Pay a down payment of $1,500 and have monthly fees of $39.99
3. Pay a down payment of $3,500 and have monthly fees of $16.9913F
15
2.4 Saskatchewan Programs that can facilitate solar PV in Saskatchewan include:
1. Net Metering
2. Green Options Partner Program
3. Small Power Producers Program
4. Saskatoon Light & Power – Power Producers Policy
Net Metering
Saskatchewan has also implemented a net metering program allowing small individual producers (100 kW or less) to send excess electricity production back into the distribution grid. The program provides funding up to 35% of capital costs up to $35,000 and includes equipment costs, installation and permits, application and interconnection fees. The funding is provided by the Go Green Fund of Saskatchewan and the program is administered by the Saskatchewan Research Council (SRC). Eligible equipment includes photovoltaic (solar), wind, low-impact hydro, biomass, heat reclaim and flare gas. Eligible projects must comply with their local utility’s
14 Government of Alberta, Agriculture and Rural Development, Accessed February 13 2012, http://www.growingforward.alberta.ca/ProgramAreas/EnhancedEnvironment/EnergyEfficiency/On-FarmEnergyManagement/index.htm 15 ENMAX Generate Choice, Accessed February 14th 2012, http://www.generatechoice.ca/solar/benefits/

Report – 2012-063 (RP-TEC) - 22 - March 29th , 2012
net metering policies and must enter into a contract with their local utility. 14F
16 Customers who are part of the net metering program are able to bank any additional electricity they produce above what is consumed on site during your annual billing cycle but do not get paid for additional electricity sent to the grid.
Green Options Partner Program
SaskPower has implemented a Green Options Partners Program which allows medium sized clean energy producers (100 kW – 10 MW) to sell their electricity production to SaskPower. Twenty projects totalling 50 MW of production were selected for the 2011 program. The energy purchase rates depend on the target commercial operation date and the actual commercial operation date. Successful projects will be paid the lower of the rates applicable on the two dates. 15F
17
Table 10 – Green Options Partners Program Tariff Rates
Year Energy Tariff ($/MWh)
2011 $96.09
2012 $98.02
2013 $99.98 2014 $101.98
2015 $104.02
2016 $106.10 2017 $108.22
2018 $110.38
2019 $112.59
The projects awarded in 2011 included seven different technologies as shown in Figure 3 but did not include solar PV. At the current tariff, solar PV is not competitive.
16 Saskatchewan Research Council, Accessed February 13 2012, http://www.src.sk.ca/html/research_technology/energy_conservation/net_metering/index.cfm 17 SaskPower Green Option Partners Program, Accessed February 15th 2012, http://environment.alberta.ca/01838.html

Report – 2012-063 (RP-TEC) - 23 - March 29th , 2012
24.8
13.9
5
2.62 1
0.4
Wind
Flare Gas
Geothermal
Lanfill Gas
Hydro
Turbo Expander
Waste Heat Recovery
Figure 3 – SaskPower Green Options Partners Program 2011 Projects, 50 MW
Small Power Producers Program
SaskPower also has a Small Power Producers program which provides customers who want to produce up to 100 kW of power the option to sell the power back to SaskPower. In this program customers are responsible for the initial capital cost of the generation system but are paid for any electricity they produce in excess of what is used on-site. The program pays 9.609 ¢/kWh produced in 2011 and the price will escalate at two percent per year.
Saskatoon Light & Power – Power Producers Policy
Saskatoon Light & Power has created a Power Producers policy which is designed to allow customers to sell electricity generated by renewable sources (up to a maximum of 1 MW) back to the distribution grid.16F
18
2.5 Manitoba Customer Owned Generation
Manitoba Hydro allows customers connecting at less than 25 kV to generate their own power for projects up to 10 MW in size and inject excess power into the grid to offset their own consumption.
2.6 Quebec Net Metering Rate Option
Hydro Quebec offers a Net Metering Rate Option that allows solar PV generators of up to 50 kW in size to offset their consumption and inject excess power into the grid. To participate, generators must either be a residential customer, a farmer or a small-power business customer.
18 Saskatoon Light & Power www.saskatoon.ca/DEPARTMENTS/Utility%20Services/Saskatoon%20Light%20and%20Power/Documents/Power_Producers_Policy.pdf

Report – 2012-063 (RP-TEC) - 24 - March 29th , 2012
Generators are allowed to bank excess power for up to twenty-four months, after which the excess power is no longer used to offset consumption.
Operational Solar Assistance Program
Offered through the Quebec government, this program provides grants to qualifying projects that reduce the use of fossil fuels through the application of solar technologies. To qualify projects must be installed on buildings in the municipal, institutional, commercial, industrial or agricultural sectors. Solar PV projects are eligible to apply for 75% of the total project costs up to a maximum of $300,000. This program was introduced in March 2012 and had a budget of $7 million.
2.7 New Brunswick Net Metering
New Brunswick’s Net Metering program allows for projects, including solar PV, up to 100 kW to offset the consumption of the facility or home where they are located. Any excess generation credits are reduced to zero in March of the following year.
Embedded Generation Tariff
For projects between 100 and 3,000 kW, this tariff offers an option to generate and sell power to NB Power. Various technologies are eligible including solar PV. The tariff as of June 2010 was 9.728 cents per kWh and is based on the cost of supplying power from the distribution system.17F
19
2.8 Prince Edward Island Through the Renewable Energy Act, PEI has introduced net-metering with the intent to assist customers who want to supply a portion or all of their annual electricity load from a small capacity renewable energy generation system. Through the net metering program customers will be credited the retail price for electricity generated from systems with a capacity of up to 100 kW. 18F
20 The PEI Department of Environment and Energy also provides Provincial Sales Tax (PST) exemptions for the purchase of small renewable energy systems (<100 kW). 19F
21
19 NB Power, http://www.nbpower.com/html/en/conservation/renewable_projects/embedded_generation/embedded_generation.html , accessed March 2, 2012. 20 Maritime Electric - Net Metering, Accessed February 15th 2012, http://www.maritimeelectric.com/documents/environment/Net_Metering_Brochure.pdf 21 PEI Department of Environment and Energy, Accessed February 15th 2012, http://www.gov.pe.ca/photos/original/ee_frame_rep_e.pdf

Report – 2012-063 (RP-TEC) - 25 - March 29th , 2012
2.9 Newfoundland & Labrador A net metering program is currently under development in Newfoundland & Labrador. They currently have two customers who are interested in net-metering who have wind turbines.20F
22
2.10 Nova Scotia Net Metering Program
Nova Scotia Power has introduced a net metering program which provides customers with the option to connect renewable energy generation of up to 1 MW to the grid. Any electricity which is produced above what is consumed by the home or business can be directed back into the grid and customers will receive a credit for this supply which can be carried over to future bills for up to 12 months. 21F
23
Renewable Energy Procurements
Nova Scotia introduced a Community Feed-in Tariff (COMFIT) Program in 2011, however, solar was not included as one of the technologies. They also announced a program to procure 300 GWh of renewable energy through competitive bid. All renewable energy technologies are allowed to bid, but given the cost competition, it is expected that the procurement will be fulfilled with 3-5 wind farms.
2.11 Northwest Territories Alternative Energy Technologies Program
The Government of the Northwest Territories has developed an Alternative Energy Technologies Program to encourage development of small renewable energy projects. The program has three funding categories: communities, businesses and residents. The Community Renewable Energy Fund offers 50% funding up to $50,000 annually for alternative energy projects such as photovoltaic systems or solar walls. The Medium Renewable Energy Fund offers $15,000 or one third of the cost of a qualified alternative energy project for a business and the Small Renewable Energy Fund offers up to $5,000 for residential projects.22F
24 The program is run by the Northwest Territories Department of the Environment and Natural Resources and operates as a net billing program.
22 Newfoundland Labrador Hydro - Environment, Accessed February 14th 2012, http://www.nlh.nl.ca/hydroweb/nlhydroweb.nsf/TopSubContent/Environment-Sustainable%20Electricity?OpenDocument 23 Nova Scotia Power – Net Metering, Accessed February 14th 2012, www.nspower.ca/en/home/environment/renewableenergy/netmetering/default.aspx 24 Government of NWT, Accessed February 13th 2012, http://www.enr.gov.nt.ca/_live/pages/wpPages/aetp.aspx

Report – 2012-063 (RP-TEC) - 26 - March 29th , 2012
2.12 Yukon The Government of Yukon has currently drafted a net metering policy which has not yet been put in place. When put in place the program is expected to encourage residential customers to install their own renewable electricity generation to offset their electricity consumption. Additional electricity generated will be feed back into the distribution grid.23F
25
2.13 Nunavut There are currently no incentives in place in Nunavut which encourage the development of solar. The 2007 Ikummatiit: An Energy Strategy for Nunavut focused on reducing Nunavut’s reliance on fossil fuels however no programs have been developed to support renewable power development to date. 24F
26
25 Government of Yukon, Accessed February 15th 2012, http://netmetering.gov.yk.ca/ 26 Government of Nunavut, Accessed February 14th 2012, http://www.gov.nu.ca/files/Ikummatiit%20Energy%20strategy_sept%202007_eng.pdf 27 Ayoub, J, Dignard-Bailey, Poissant, Y, National Survey Report of PV Power Applications in Canada - 2010, CanmetENERGY, 2011
Key Takeaway 4. Outside of Ontario Net Metering is available in most provinces and territories, however, residential rates are not sufficient to justify investment in solar PV for the majority of the population and there are few PV-specific incentive programs. Thus, outside of Ontario, the market is almost all off-grid systems.
Key Takeaway 5. Total public budgets for photovoltaics in Canada were reported to be $61.8 million in 201027. This is mainly due to the incentive program in Ontario that provides a feed-in tariff for PV generated electricity.

Report – 2012-063 (RP-TEC) - 27 - March 29th , 2012
3 PV MARKETS IN CANADA The Canadian PV market is characterized by two types of provincial markets, those with explicit support for grid connected installations and those without. As described in Chapter 2, Ontario stands out from the rest of Canada in installed capacity due to current and past programs to support the development and installation of PV projects.
Figure 4 below shows total PV installations in Canada in 2011 of 289 MWDC. As can be seen below, Ontario accounted for 91% of Canada’s 2011 installations. This chapter will therefore focus primarily on grid-connected PV in Ontario. We also discuss the off-grid market which accounts for the majority of the “Rest of Canada” amount.
RESOP, 156, 54%
microFIT, 79, 28%
FIT - CAE, 27, 9%
Rest of Canada, 27, 9%
Figure 4 – 2011 Canadian PV Installations, 289 MWDC25F
28
3.1 Ontario Ontario’s PV market segments cover the full range of project sizes, from micro scale urban and rural installations, to commercial rooftops, to utility scale projects covering large tracks of land. 28 Ontario installation data sourced from OPA Contract Management Reports and FIT Bi-weekly reports. The OPA data is reported in MWAC and was therefore converted at DC/AC ratio of 1.15. Rest of Canada based on NRCan 2011 PV installation survey.
Key Takeaway 6. Ontario accounted for 91% of the 289 MWDC of PV that was installed in Canada in 2011.

Report – 2012-063 (RP-TEC) - 28 - March 29th , 2012
Each of these market segments will be discussed including the various levels of activity that occurred, based on the different procurement programs in place. These include:
1. Renewable Energy Standard Offer Program (RESOP)
2. Feed-in Tariff (FIT) Program 1.0
Micro-FIT (Residential)
Capacity Allocation Exempt (CAE) FIT (Commercial Rooftop)
Capacity Allocation Required (CAR) FIT (Utility Scale / Large scale rooftop)
Impacts of FIT program review
In addition, at the time of writing the FIT program was completed and summary of the review was released which provides information on anticipated changes to the program. These changes will also be discussed.
3.2 Renewable Energy Standard Offer Program (RESOP) Recent RESOP Related Activity
As shown in Figure 4 on page 27 above approximately 150 MWDC of RESOP projects achieved commercial operation in 2011 and Navigant believes that a majority of the others have started site preparation or have begun construction.
As is typical for these types of assets, there has been a significant amount of reselling of RESOP projects from their original project developer and contract holder to the long term operating asset holder. Among RESOP contract holders, First Solar has been the most successful in developing and reselling these assets after commercial operation. Prominent long term RESOP solar contract holders/owners include Enbridge, EDF EN, GE, NextEra, Capstone Infrastructure (formerly Macquarie), Innergex and Starwood Energy.
3.3 MicroFIT and FIT As a result of the creation of the FIT and microFIT programs Ontario’s PV market has flourished, however, the success associated with executing contracts and developing projects has been contrasted with a variety of implementation challenges. The domestic content requirements within these programs have also been a source of both achievement and frustration. The next section will provide a discussion of these successes and challenges.
MicroFIT
An overview of the microFIT program is provided in section 2.1 Ontario, above. In this section we discuss development activity and program changes that have recently occurred.

Report – 2012-063 (RP-TEC) - 29 - March 29th , 2012
Revision to MicroFIT Ground Mount Pricing and the Role of Aggregators
As of February 12, 2012, there has been over 11,000 solar PV microFIT projects installed, representing over 100 MWDC of distributed micro scale PV.26F
29 After RESOP, microFIT project development and construction has far outpaced both commercial rooftop and ground mount FIT projects to date. This is due primarily to the simplified approval and connection process associated with microFIT.
Although the microFIT program has been successful in encouraging investment, resulting in a significant number of installations, it has not been without its challenges. What was initially designed for residential rooftop installations, the program made a rule change prior its launch that allowed for ground mount projects to be eligible as well. This resulted in a significant amount of microFIT applications from rural Ontario where land and shading restrictions are much less of a factor which allowed for larger system sizes. By the summer of 2010 27F
30 the average size microFIT projects to be over 9 kWAC, representing a very large residential rooftop system. The relative share of ground to rooftop projects was not anticipated by the OPA and Ministry of Energy. Nor was the use of sun tracking equipment, which, despite its higher capital and O&M costs, was resulting in greater energy production and return on equity (ROE) then was initially anticipated. In addition, many of the rural applications submitted at the time were from project aggregators who were leasing the land from rural land owners. The combination of the volume of projects, the average size, higher ROE and significant role of aggregators lead the OPA and Ministry of Energy to make changes to the microFIT program pricing and rules, where the price paid for ground mount projects was lower than rooftop and aggregators were not formally allowed to participate. The updated microFIT price for ground mount project was $0.642/kWh shown in Table 4 above, was revised downward from $0.802/kWh. Although aggregators could no longer be the contract counterparty with the OPA for microFIT projects located on third party land, microFIT aggregation continues because microFIT contract holders are allowed to direct payments entitled to them to a third party.
Challenges associated with Connections
MicroFIT projects are defined as micro-embedded generation under the Ontario Energy Board’s Distribution System Code (DSC) 28F
31, the code that governs distributor’s treatment of these generators, and therefore are not typically subject to any formal connection assessment regardless of the voltage at which they are connecting. Although distributors have the right to refuse connecting micro-embedded generators, at the time of the microFIT program design rejecting microFIT applicants was not considered likely due to their relatively small contribution
29 Ibid. 30 Calculated based on September 13, 2010 FIT and microFIT Bi-weekly report, http://fit.powerauthority.on.ca/Storage/11147_Bi-Weekly_FIT_and_microFIT_Report_September_13th_2010.pdf, accessed on line March 4, 2012. 31 Distribution System Code, http://www.ontarioenergyboard.ca/OEB/_Documents/Regulatory/Distribution_System_Code.pdf

Report – 2012-063 (RP-TEC) - 30 - March 29th , 2012
of generation. However, due to the response of microFIT projects and their location in rural Ontario, where distribution systems feeders can be very long and distribution equipment typically older, microFIT generators had begun to receive rejection notices from distributors in mid to late 2010.
Due to the limitations within the distribution systems, the OPA updated its microFIT application process such that applicants were required to confirm available connection availability with their Local Distribution Company (LDC) prior to receiving a conditional offer. As of February 17, 2012 over 11 MW worth of projects have been denied connection and almost another 49 MW have been rejected or withdrawn (Figure 5 below).
Figure 5 – MicroFIT Project Overview (MW)29F
32
Domestic Content Extension
The delays created in the microFIT program, including those associated with the price revision consultation and project connection, resulted in extensions for contract and conditional offer holders.
30F
33 The extensions provided additional time to achieve commercial operation, and extended the amount of time, and increased the amount of projects that could achieve domestic content compliance without using Ontario-made inverters and modules. For inverter and module manufacturers this reduced their market size and delayed market demand. As will
32 Based on data within the FIT and microFIT bi-weekly report, http://fit.powerauthority.on.ca/sites/default/files/Bi-Weekly%20FIT%20and%20microFIT%20Report%20February%2017%2C%202012.pdf, accessed March 4, 2012. 33 Extensions to the in-service deadlines, that dictated domestic content requirements, were extended explicitly on November 08, 2010 and were then extended further by the OPA, pursuant to Ministerial suggestion, on January 28, 2011. Direction to the OPA is available on the microFIT website: http://microfit.powerauthority.on.ca/domestic-content-requirements-microfit-projects

Report – 2012-063 (RP-TEC) - 31 - March 29th , 2012
be examined below, the delay in the microFIT segment was not the only delay that manufacturers had to contend with.
Feed-in Tariff (FIT)
The FIT program is a standardized procurement program that offers renewable energy generators long term contracts, under standardized rules and contracts. PV projects are offered contracts of 20 years. The FIT program was developed throughout late 2008 and 2009 by the OPA in collaboration with the Ministry of Energy, the Ontario Energy Board (OEB), Hydro One and the Independent Electricity System Operator (IESO).
Although the FIT program had no formal caps or targets given the importance of promoting local industry via the domestic content requirements, Ontario’s electricity system fundamentals and available transmission and distribution capacity created limits on the amount of new generation that could be connected. However, given the importance of local economic development, the FIT program application process included a mechanism where projects that could connect immediately were held in a queue that would inform infrastructure upgrades such that they would eventually be able to connect their projects. Another important aspect of the FIT program was the application review timelines which were initially intended to be sixty days.
As described above, the FIT program had two streams. One focused on smaller commercial scale typically rooftops, considered CAE and larger utility scale projects, considered CAR. For solar PV projects, there were a number of differences in how the FIT program treated these segments. The distinction in pricing and initial difference in connection assessment was already described above. Another important distinction CAE rooftops and utility scale CAR were the environmental approval requirements. CAE PV rooftop projects were not subject to any environmental approval where CAR projects were. The GEA created a new single approval entitled the Renewable Energy Approval (REA) which incorporated all past environmental approval processes into a single process. Although this change to a new single “window” approach was meant to reduce uncertainty and time lines associated with obtaining environmental approvals, the REA initially had a six month service guarantee, it did not prove to be as quick as anticipated. In fact, the process ended up taking 18-24 months as discussed below.
Contract Offers & Installations
As of February 17, 2012, there were over 1,200 MWAC of FIT solar PV projects under contract and another 5,900 MWAC, including applications and projects awaiting the Economic Connection
Key Takeaway 7. Over 11,000 microFIT-PV projects were installed in Ontario in 2011 representing over 100 MWDC of distributed PV. Although they are a maximum of 10 kWAC in size, some microFIT projects are being rejected due to distribution system limitations, primarily in rural parts of Ontario.

Report – 2012-063 (RP-TEC) - 32 - March 29th , 2012
Test (ECT) in the queue to obtain contracts. See Figure 6 below. These contracts were offered between March 2010 and July 2011. Since that time there have been few contracts offered.
Figure 6 – Overview of FIT Solar Projects (MW)31F
34
On a MW basis, ground-mount projects represent the lion’s share of FIT solar PV projects under contract and throughout the various stages of development, as per Figure 7. At the contract, Notice to Proceed (NTP) and Commercial Operation Date (COD) stage, ground mount projects represent 940 MWAC as compared to rooftops which represent 301 MWAC.
Figure 7 – Ground-mount vs Rooftop Solar PV FIT (MWAC)32F
35
34 Based on data within the FIT and microFIT bi-weekly report, http://fit.powerauthority.on.ca/sites/default/files/Bi-Weekly%20FIT%20and%20microFIT%20Report%20February%2017%2C%202012.pdf, accessed March 4, 2012. 35 Ibid.

Report – 2012-063 (RP-TEC) - 33 - March 29th , 2012
What is not seen in Figure 6 and Figure 7 is the concentration of FIT contracts by the top contract holders. The seven largest contract holders, and their partners, have over 800 MWAC under contract, representing just under 85% of the ground mount projects as show in shading in Table 9.
Table 11 – FIT Ground Mount Contract Holders33F
36
Rank Developer MWAC # Avg Size % Cumulative % 1 Recurrent Energy 170 27 6 18.1% 18.1% 2 SkyPower 158 16 10 16.8% 34.9% 3 Northland Power 130 13 10 13.8% 48.7% 4 SunEdison 130 13 10 13.8% 62.5% 5 Penn Energy Trust 65 9 7 6.9% 69.5% 6 ATS & Q-Cells JV 64 7 9 6.8% 76.3% 7 Canadian Solar 30 3 10 3.2% 79.5% 8 Saturn (Partner with Canadian Solar) 30 3 10 3.2% 82.7% 9 3G Energy (Partner with Canadian Solar) 17 2 9 1.8% 84.5%
10 Solray Energy 20 3 7 2.1% 86.6% 11 International Power 20 2 10 2.1% 88.7% 12 Perpetual Energy 20 2 10 2.1% 90.9% 13 Invenergy 20 2 10 2.1% 93.0% 14 Conex 10 1 10 1.1% 94.0% 15 Energy Farming Ontario 10 1 10 1.1% 95.1% 16 Upper Canada Solar Generation 10 1 10 1.1% 96.2% 17 Solar Spirit 10 1 10 1.1% 97.2% 18 Silvercreek Solar Park 10 1 10 1.1% 98.3% 19 Hugh Thorne (individual) 9 1 9 1.0% 99.3% 20 Balsam Lake Green Energy 3 1 3 0.3% 99.6% 21 Hybridyne Power 2 1 2 0.2% 99.8% 22 Vinefresh Produce Limited 2 1 2 0.2% 100.0%
Total 940 111 8 100.0%
Amongst the largest contract holders are three of the largest module suppliers, Canadian Solar, ATS and SunEdison/MEMC. The domestic content requirements create the potential for synergies; contract holders need modules and module suppliers need to ensure they have a sales pipeline to justify investment in a module facility.
36 OPA FIT press releases, company reports, news articles and Navigant analysis.

Report – 2012-063 (RP-TEC) - 34 - March 29th , 2012
Challenges
Although there is a significant number of MW under contract, as of February 17, 2012 there were only 27 MWAC of FIT contracts that had achieved commercial operation, almost two years since the first contract offers were announced in March 2010. The FIT program allows solar PV projects three years to achieve commercial operation, but many of the launch contracts, those that were offered contracts in March or April 2010, accelerated their expected commercial operation date in order to gain priority. Therefore, many of the larger ground mount and rooftop projects had less than three years to achieve commercial operation. Once contracted, however, projects met with a number of delays. The most prevalent were those associated with the REA process and obtaining a Connection Impact Assessment (CIA). Both of these elements were needed to obtain a NTP from the OPA which was required in order to move a project into the construction phase. However, the REA process was a brand new process at the time of FIT program launch and it soon had over two hundred new projects requiring review and approval. In addition there were even more contracted projects that were requesting CIAs from their LDC and hundreds more project developers requesting preliminary connection information for their FIT applications. In short, all of the various government Ministries involved in the REA approval process, as well as some LDCs were overwhelmed by the volume of projects. As a result of receiving regular Force Majeure requests, the OPA offered an optional one year contract extension to all FIT contract holders in February of 2011 in exchange for the restriction on certain types of Force Majeure requests.34F
37 This extension essentially reinstated the three year time frame for most solar PV contract holders.
Beyond this extension, the FIT contract allows for a six month period for rooftop and eighteen month period for ground-mount after the Milestone Date for Commercial Operation during which a contract holder can pay liquidated damages. After this additional time, however, if a project has not achieved commercial operation it loses its contract.
In the interim, the FIT pricing, which was based on specific cost assumptions, stayed constant for contract holders while solar PV costs were falling dramatically, increasing the potential returns within FIT solar PV contracts.
37 One year extension of Milestone Date for Commercial Operation available for FIT contract holders, OPA FIT website, http://fit.powerauthority.on.ca/february-9-2011-one-year-extension-milestone-date-commercial-operation-available-fit-contract-holder , accessed March 4, 2012.
Key Takeaway 8. Over 75%, or 940 MWAC, of the 1,200 MWAC of FIT projects under contract are for ground mounted projects. Over 800 MWAC of these ground mount projects, are held by seven contract holders. As of February 2012, there were an additional 5,900 MWAC of applications on file with the Ontario Power Authority.

Report – 2012-063 (RP-TEC) - 35 - March 29th , 2012
In summary, there has been very little construction activity in FIT projects to date due to a number of factors, but primarily due to delays in obtaining environmental approvals and connection assessments. In addition, given the three year period contract holders have to build and the falling cost environment over the last two years, project owners have little incentive to purchase equipment now and build projects well in advance of their required Milestone Date for Commercial Operation.
Manufacturer’s Perspective
At the time of the FIT program launch there was one module manufacturer in Ontario, Solgate, one silicon refiner, 6N Silicon, who is now owned by Silicor Materials (formerly Calisolar) and one inverter manufacturer, Satcon. The domestic content requirements embedded in the FIT program therefore created uncertainty for project developers and opportunity for component manufacturers. As discussed in Chapter 4, a number of component manufacturers invested in new facilities or contract manufacturing arrangements in Ontario to supply the burgeoning market. Therefore, the result of each of the delays described above delayed the demand for Ontario-made product, but also allowed additional competition to catch up to early movers.
Going forward, most of the larger ground-mount contract holders have selected major component suppliers but do not need delivery until 2013 and 2014. Manufacturers are now looking to commercial rooftop and microFIT segments for 2012 deliveries.
Financing
Long term owners of FIT projects include SunEdison and its affiliates, TransCanada, IPR GDF Suez, Algonquin, Northland, and Starwood Energy Group, who is Samsung’s equity partner.
About $3 billion of new project finance is expected to be required over the next three years for the current backlog of solar and wind FIT projects, with solar accounting for about half of that. 35F
38 Ground mount FIT contracts are expected to be financed using approximately 60-80% debt with the majority of contract holders accessing the capital markets for non-recourse project financing, although several deep pocketed companies have the option to finance their projects using their balance sheet.
38 http://www.renewableenergyworld.com/rea/news/article/2012/02/ontario-post-election-is-the-financing-market-ready
Key Takeaway 9. Despite the large number of projects and MW capacity under contract in Ontario under the FIT program, very few have started construction primarily due to delays associated with the new environmental approval process, the Renewable Energy Approval, and obtaining a connection impact assessment.

Report – 2012-063 (RP-TEC) - 36 - March 29th , 2012
European and Japanese lenders have traditionally been more comfortable funding solar projects due to their experience lending to solar PV. Lenders that provided funding for RESOP projects include Dexia, West LB, Nord LB, Caixa Nova, Union Bank, KfW, Deutsche Bank and Bank of Tokyo-Mitsubishi. For FIT projects, Navigant expects some of the same lenders but many new ones including a stronger presence of Japanese banks, Canadian life insurance companies and possibly some of the Canadian banks. Many lenders are interested in funding FIT projects but typically need to be able to provide the long debt terms of fifteen to twenty years that align with the contract, and avoid interest rate risk, in order to attract the contract holders. Even though some lenders new to solar are able to provide these longer debt terms, they continue to get more comfortable with the technology and contract risks. Some concerns that lenders have with the FIT program include the following:
Domestic Content Requirements – Because domestic content compliance is determined after the COD and therefore, there is a risk, albeit remote, that the contract may be revoked for non-compliance with these requirements. The OPA has worked closely with developers and lenders to ameliorate this issue.
Political Risk / Retroactive Tariff Reductions – Some lenders are concerned that the government might retroactively reduce the tariffs thereby impacting the cash flows of the projects. Since retroactive actions would cause extreme harm to Ontario’s reputation in the international community, this is highly unlikely.
To date, construction financing has been put in place for many projects and has come from Deutsche Bank, Rabobank, Bank of China and Mizuho, however, term debt has not yet been announced. Navigant anticipates that sufficient financing will be available for FIT projects though a considerable amount of debt is required to be raised in a short amount of time and there are certainly scenarios in which insufficient debt is available. If the project finance debt market is insufficient, the bond market is another option. In the US, MidAmerican is raising debt through the bond market for its 550 MW Topaz project in California for about 50% of the capital cost of the project.
First Ground Mount FIT Projects Online
In February 2012, the first 10 MW ground mount FIT project came online in Ingleside, Ontario. This project was developed and built by SunEdison. As of April 2012, a number of ground mount FIT projects had reached the Notice to Proceed (NTP) stage and were either under construction or near the construction phase, including among others, projects developed by Canadian Solar and Recurrent.
3.3.1 Samsung
The government of Ontario signed a framework agreement with Samsung C&T and its partners (the Korean Consortium) committing the province to enter into long term contracts for 500 MW of solar PV and 2,000 MW of wind, in exchange for the commitment to build four renewable
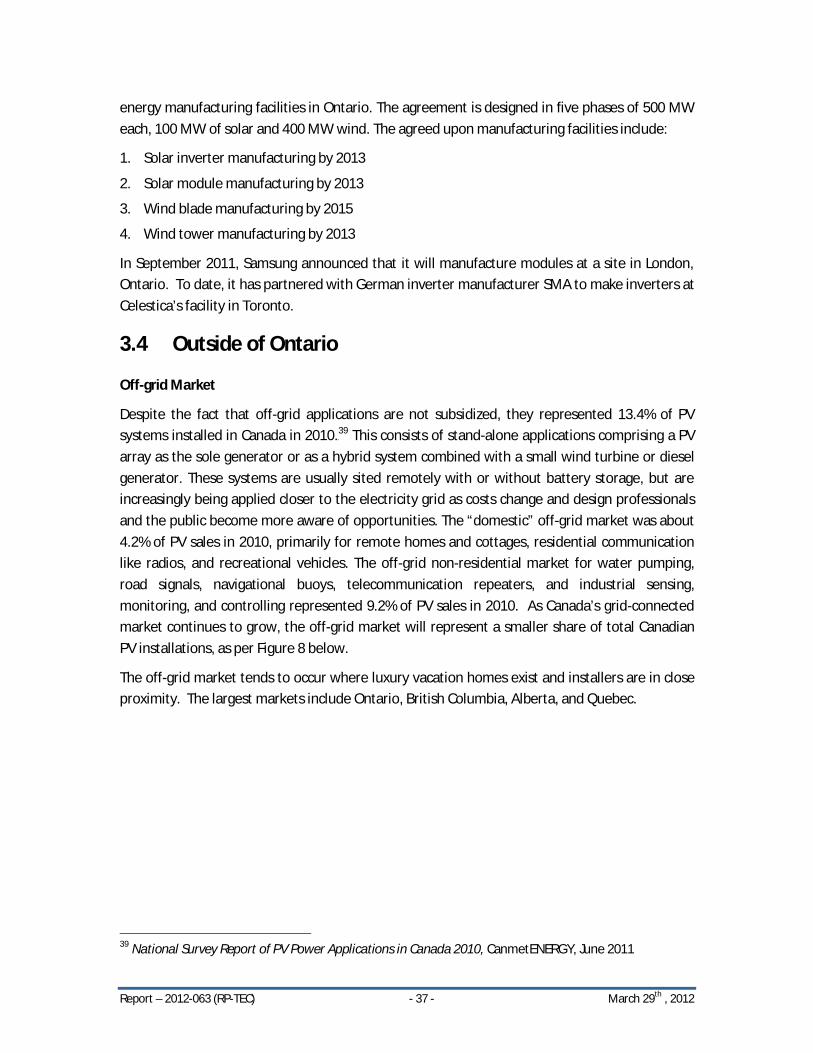
Report – 2012-063 (RP-TEC) - 37 - March 29th , 2012
energy manufacturing facilities in Ontario. The agreement is designed in five phases of 500 MW each, 100 MW of solar and 400 MW wind. The agreed upon manufacturing facilities include:
1. Solar inverter manufacturing by 2013
2. Solar module manufacturing by 2013
3. Wind blade manufacturing by 2015
4. Wind tower manufacturing by 2013
In September 2011, Samsung announced that it will manufacture modules at a site in London, Ontario. To date, it has partnered with German inverter manufacturer SMA to make inverters at Celestica’s facility in Toronto.
3.4 Outside of Ontario
Off-grid Market
Despite the fact that off-grid applications are not subsidized, they represented 13.4% of PV systems installed in Canada in 2010.37F
39 This consists of stand-alone applications comprising a PV array as the sole generator or as a hybrid system combined with a small wind turbine or diesel generator. These systems are usually sited remotely with or without battery storage, but are increasingly being applied closer to the electricity grid as costs change and design professionals and the public become more aware of opportunities. The “domestic” off-grid market was about 4.2% of PV sales in 2010, primarily for remote homes and cottages, residential communication like radios, and recreational vehicles. The off-grid non-residential market for water pumping, road signals, navigational buoys, telecommunication repeaters, and industrial sensing, monitoring, and controlling represented 9.2% of PV sales in 2010. As Canada’s grid-connected market continues to grow, the off-grid market will represent a smaller share of total Canadian PV installations, as per Figure 8 below.
The off-grid market tends to occur where luxury vacation homes exist and installers are in close proximity. The largest markets include Ontario, British Columbia, Alberta, and Quebec.
39 National Survey Report of PV Power Applications in Canada 2010, CanmetENERGY, June 2011

Report – 2012-063 (RP-TEC) - 38 - March 29th , 2012
Figure 8 – Cumulative Canadian PV Installations MWDC38F
40
Grid Connected Market The largest grid connected system outside of Ontario is the 260 kW system at Okanagan Center of Excellence in Penticton, BC which was installed by contractor SkyFire Energy and came online in September 201141. A 60 kW system was commissioned in the Northwest Territories in March 2012. This system was funded with $700,000 from the Northwest Territories Department of Industry, Tourism and Investment42. Other grid connected systems have been built outside of Ontario at colleges and universities that have sustainability goals and at the homes of high net worth individuals.
40 Ayoub, J, Dignard-Bailey, Poissant, Y, National Survey Report of PV Power Applications in Canada - 2010, CanmetENERGY, 2011 41 http://www.conergy.us/desktopdefault.aspx/tabid-183/468_read-787/ 42 http://news.exec.gov.nt.ca/premier-mcleods-speech-official-ribbon-cutting-for-the-fort-simpson-solar-photovoltaic-project/
Key Takeaway 10. Despite its steady growth, the off-grid market’s total market share will continue to decrease as the grid connected market expands rapidly.

Report – 2012-063 (RP-TEC) - 39 - March 29th , 2012
4 PV SUPPLY CHAIN IN CANADA This chapter provides an overview of the PV supply chain in Canada, from components needed to build solar cells and modules, to services needed to support project development and installation. As will be discussed the majority of the supporting services are provided, but only a subset of the total value added products are produced in Canada. The PV supply chain is made up of equipment or products and services, as shown in Figure 9. The upstream portion of the supply chain is comprised of equipment such as modules, inverters, racking/mounting, and wiring/cable. The downstream portion of the supply chain includes product distribution, project development, engineering, procurement and construction (EPC) services and operations and maintenance (O&M) services. The equipment manufacturing and downstream functions will be the focus of this chapter.
Polysilicon Wafers and Ingots Cell Module Inverter
Racking / Mounting /
BIPV
Wiring / Cable
Distribut-ion
Develop-ment EPC O&M
Manufacturing Equipment
Consumables for Manufacturing
Financing, Consulting (Legal/Engineering/Permitting/Business/Architects), Testing, Energy Managers, Utilities
Publishing, Trade and Industry Associations, Training/Education
Software / Monitoring
ServicesProducts
Module Balance of System Components Downstream
Figure 9 – PV Supply Chain
A number of functions support this supply chain including capital equipment used to manufacture PV components and equipment and consumables for manufacturing. In the case of module assembly, consumables include glass, junction boxes/cables, encapsulents, aluminum frames, and backsheets, etc. The three lines at the bottom of Figure 9 show services that support the industry, including: software and monitoring; financing, consulting, testing, energy managers and utilities; and publishing, trade and industry association and training/education.
Companies that participate in each part of the supply chain can be found in Appendix A.
Details of the various parts of the PV supply chain are provided below along with highlights of some early leaders in the Canadian PV supply chain. Profiles of leading manufacturers are provided in Chapter 5.

Report – 2012-063 (RP-TEC) - 40 - March 29th , 2012
4.1 Module Manufacturing The process steps for manufacturing a crystalline silicon module are shown in Figure 10.
Polysilicon Ingots and Wafers Cells Module
• Produce Silicon-tetrachoride
• Produce Tri-chlorosilane
• Siemens process or Silane FBR
• Package
• Incoming Inspection
• Polysiliconprep/mixing
• CZ (Czrochralski) growth / casting
• Boule trim / cut bricks
• Slice bricks into wafers
• Clean wafer
• Package wafer
• Incoming inspection
• Etch wafer
• Diffusion
• Glass etch
• Antireflection coating / passivation
• Metallization front / back
• Sinter
• Cell test and sort
• Package cells
• Incoming inspection / sort
• String cells
• Module layup
• Module lamination
• Module cure / trim
• Frame module
• Module termination
• Module power / safety test
• Package module
Process Steps
Figure 10 – Process Steps for Crystalline Silicon Module
As shown in Figure 10, the first step in the manufacturing of a crystalline silicon module is the processing and refining of polysilicon. In Canada, only one company produces silicon – 6N Silicon, based in Vaughan, Ontario and owned by Silicor Materials, formerly Calisolar. The next step is the forming of silicon wafers and cells, however, there are no wafer or cell manufacturers in Canada. Once silicon cells are produced, they are then electrically connected and laminated into modules. At the module assembly step, there are a number of Canadian based manufacturers who, with the exception of one, are based in Ontario. Ontario module assembly companies source their cells from foreign companies such as JA Solar, Motech and Gintech in China and Taiwan.
Key Takeaway 11. The PV Supply Chain comprises of upstream equipment and component manufacturing, as well as downstream services needed to build PV components and install projects. The majority of these services are offered in Canada but only some of these products are made in Canada.

Report – 2012-063 (RP-TEC) - 41 - March 29th , 2012
The early leaders in Canadian-made modules, who are all located in Ontario in order to satisfy the Ontario domestic content requirements, are shown in Table 12. Four of the five companies shown in the figure have the benefit of having developed their own projects and therefore can supply those projects with their own modules, with Celestica being the one exception. In addition, two of the largest FIT contract holders have partnered with these companies. Northland has signed an agreement with MEMC/Flextronics for 130 MWAC of modules and Recurrent with Celestica for 170 MWAC. In addition to Recurrent, Celestica is operating as the contract manufacturer for Opsun and Soventix.
Table 12 – Early Leaders in Canadian-Made Modules
Early Leaders in Canadian-Made Modules
CompanyMEMC /
Flextronics parternship
Celestica Canadian Solar
Photowatt(ATS)
Samsung Consortium (planned)
Business
• MEMC: Tier 1 PV company
• Flextronics: contract manufacturer
Contract manufacturer
to various industries
Tier 1 PV company
• Automated manufacturing and assembly systems
• PV business
• Conglomerate
Key Clients / MOUs
• Own account (180 MW)
• Northland (130 MW)
• Recurrent (170 MW)
• Soventix• Opsun• Also makes
inverters
• Own account (102 MW)
• SkyPower(RESOP)
• Own account (64 MW)
• microFITdeveloper (24 MW)
• Hanwha (160 MW)
• Own account (500 MW)
Market Cap (3/12)
$920 m (MEMC) $1,900 m $163 m $720 m >$100 b
Mfg Site Newmarket, Ontario
Toronto (Don Mills),
Ontario
Guelph, Ontario
Cambridge, Ontario
London, Ontario (planned)
In this table we include Samsung which has an agreement for 500 MWAC of projects with the Ontario government and announced in September 2011 its intention to make modules in London, Ontario. Samsung’s first planned project is a 100 MW project in Haldimand, Ontario, south of Hamilton.
We make note of the market capitalization of each company in this figure. Financial strength of a company is one part of the module purchase decision making process as project developers prefer to go with vendors that have large balance sheets and are therefore better positioned to honour the twenty to twenty-five year warranties typical for modules.
4.2 Balance of System Manufacturing Figure 11 shows the balance of system components.

Report – 2012-063 (RP-TEC) - 42 - March 29th , 2012
Inverters Racking / Mounting
Wiring / Cabling
Ground Mount
Commercial Roof
Residential
Combiner Box
Wire/Cable
Single- and Dual-Axis Trackers
Microinverter
DC/DC Optimizers
+ Other related components
Central Inverters
Figure 11 – Balance of System Components
Among the components depicted in Figure 11 above central inverter manufacturing has seen the largest increase in manufacturing capability in Canada. These inverters are used for commercial rooftop and utility scale projects which represent the largest segments of Canada PV projects under contract. The process steps for a central inverter include:
• Capacitors • Motherboard • Heatsink • Line filter • Cabinet • Flexbar • Transformers • Wiring / final assembly • Burn-in / test • Package / ship
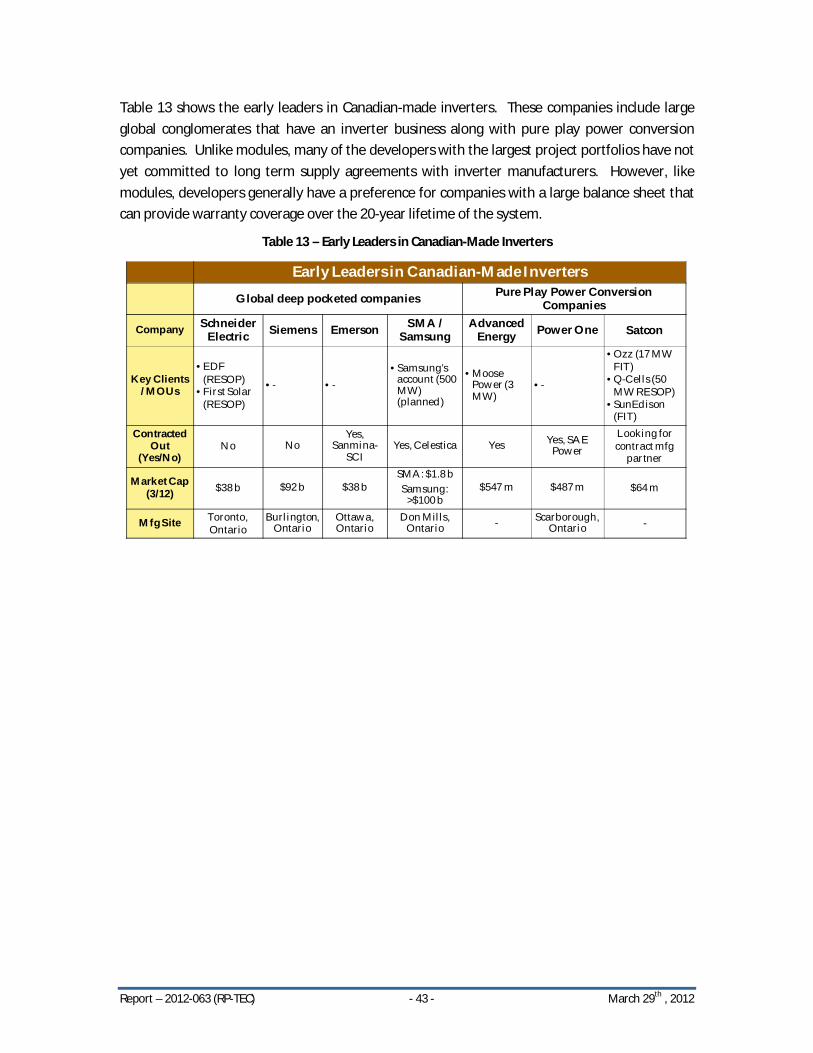
Report – 2012-063 (RP-TEC) - 43 - March 29th , 2012
Table 13 shows the early leaders in Canadian-made inverters. These companies include large global conglomerates that have an inverter business along with pure play power conversion companies. Unlike modules, many of the developers with the largest project portfolios have not yet committed to long term supply agreements with inverter manufacturers. However, like modules, developers generally have a preference for companies with a large balance sheet that can provide warranty coverage over the 20-year lifetime of the system.
Table 13 – Early Leaders in Canadian-Made Inverters
Early Leaders in Canadian-Made Inverters
Global deep pocketed companies Pure Play Power Conversion Companies
Company Schneider Electric Siemens Emerson SMA /
SamsungAdvanced
Energy Power One Satcon
Key Clients / MOUs
• EDF (RESOP)
• First Solar (RESOP)
• - • -• Samsung’s
account (500 MW) (planned)
• Moose Power (3 MW)
• -
• Ozz (17 MW FIT)
• Q-Cells (50 MW RESOP)
• SunEdison(FIT)
Contracted Out
(Yes/No)No No
Yes, Sanmina-
SCIYes, Celestica Yes Yes, SAE
PowerLooking for contract mfg
partner
Market Cap (3/12) $38 b $92 b $38 b
SMA: $1.8 bSamsung:
>$100 b$547 m $487 m $64 m
Mfg Site Toronto, Ontario
Burlington, Ontario
Ottawa, Ontario
Don Mills, Ontario - Scarborough,
Ontario -

Report – 2012-063 (RP-TEC) - 44 - March 29th , 2012
4.3 Downstream Supply Chain Figure 12 shows the process steps in the downstream portion of the supply chain.
Distribution Development EPC O&M
Process Steps
• Supply agreements with equipment vendors
• Maintain product inventory (PV modules, inverters, balance of system components)
• Deliver product to end customer
• Secure lease agreements for land and/or rooftops
• Secure FIT contract / PPA
• Secure permits (REA process in Ontario)
• Find and align players for financing
• Structure debt, equity
• Prepare, audit, and negotiate contracts with equipment, EPC, O&M vendors
• Domestic Content Plan
• Interconnection planning / agreement
• Engineer / design project
• Identify and procure equipment required
• Specify installation procedures
• Sell product to end customer
• Guarantee product performance
• Construct project
• Manage / oversee subcontractors (often local companies)
• Interconnection / utility upgrades
• Monitor remotely
• Inspect onsite
• Maintain and clean in accordance with equipment warranties
• Maintain grounds
• Sell/provide spare parts
• Report performance
• Security
• Other services as per O&M agreement
Applications • Primarily residential and small commercial
• Primarily ground mount and commercial rooftop; Limited for residential
• All • Primarily ground mount and commercial
Figure 12 – Downstream Supply Chain
4.4 Business Models and Channels to Market There are many parts to the supply chain and a number of different business models. Below we explain how some companies are integrating across the value chain as well as important concepts of contract manufacturing and ownership models. In addition, we discuss channels to market for product manufacturers.
Vertical Integration
A number of companies have pursued vertical integration strategies where they participate at multiple points of the supply chain in an attempt to achieve higher margins. SunEdison / MEMC and Canadian Solar are two examples of the most vertically integrated companies in Ontario. SunEdison / MEMC, via their services agreement with Flextronics, and Canadian Solar are not only manufacturing modules, they are project developers, project owners, EPC contractors and

Report – 2012-063 (RP-TEC) - 45 - March 29th , 2012
O&M providers. It is not surprising that companies are vertically integrating in Ontario, as many companies have been financially successful at vertically integrating across the supply chain outside of Canada such as GCL, Sharp, First Solar and SunPower.
Other examples of vertical integration include:
Strategic investors leveraging their equity position and provide other functions within their company such as EPC and O&M services to a project.
Development firms selling their own projects on the condition that they will do the EPC and O&M for the project.
Inverter companies have attempted to expand their service offering to include monitoring and O&M to projects that do not use their product.
Distributors trying to expand into an EPC provider, particularly design engineering.
Contract manufacturers have provided design engineering for products and manufacturing processes and logistics services such as shipping, warehousing and spare parts inventory.
Domestic and foreign module manufacturers who buy projects in order to supply the project with their own modules.
Contract Manufacturing
A number of upstream equipment suppliers have entered the Ontario market via contract manufacturing with a local firm which is a less capital intensive approach in order to meet domestic content requirements. This allows the equipment supplier to leverage its brand and intellectual property position and reduce its risk in the event that the market declines over time. Celestica is probably the largest contract manufacturer in Ontario and makes both modules and inverters for several companies. Flextronics and Sanmina-SCI are two other contract manufacturers of modules and inverters. In addition, there are a number of contract manufacturers of racking and mounting equipment.
In some contract manufacturing arrangements, the customer also acts as a supplier to its own product by providing certain materials or components to the contract manufacturer. For example, some original equipment manufacturers (OEM) will provide solar cells to their contract manufacturer who is producing modules. This allows them to have greater control over the inputs used. In other instances, the contract manufacturer will sources all of its own raw materials.
Key Takeaway 12. The early leaders in Canadian module manufacturing are located in Ontario and most have vertically integrated by developing their own projects in order to ensure sufficient demand to justify the manufacturing investment.

Report – 2012-063 (RP-TEC) - 46 - March 29th , 2012
In one of the more dramatic shifts to contract manufacturing, inverter manufacturer Satcon closed its Burlington, Ontario factory, laid off 140 workers in January 2012 and moved to a contract manufacturing model to serve the Ontario market. Soon after, in February 2012, it extended its contract manufacturing partnership with Shenzhen, China-based Excelstor, a subsidiary of Great Wall Computer, with whom it announced a broad 5-year sales, marketing and distribution agreement.39F
43
Ownership Models
Ownership of a PV system can either be by the host or by a third party. Most microFIT projects are owned by the host, while most ground mount and commercial rooftop projects are owned by third parties.
In the third party ownership model, there are various scenarios, the most common of which include:
1. Ownership by an independent power producer (IPP) that has financed the project, using its own balance sheet to raise debt, and
2. Ownership by a special purpose project entity that raises the debt through non-recourse project finance, normally from banks, life insurance companies and/or pension funds.
Some financial entities are also providing leasing options to system owners as an alternative to balance sheet or non-recourse financing. Third party ownership is more likely to include a contract with a vendor to provide O&M since there is a greater focus on the financial metrics that need to be met.
Channels to Market
Products such as modules, inverters and racking are sold into the market on either a spot market basis or under a supply agreement to various types of customers including wholesale distributors, retail outlets, project developers, EPC companies, project entities and the system host. Various stakeholders can have influence over selection of equipment including the project developer, the EPC contractor, the investor, both debt and equity, the independent engineer and other advisors. When product is sold through a distributor, the distributor takes a margin on the sale, thus typically lowering the margin of the product manufacturer. In the future,
43 http://www.masshightech.com/stories/2012/02/06/daily16-Satcon-stock-rises-more-than-55-on-China-deal.html
Key Takeaway 13. A number of original equipment manufacturers that decided to invest in Ontario after 2010 opted for a contract manufacturing model which reduces their investment, allows them to satisfy the Domestic Content requirements and capture some of the Ontario FIT market.

Report – 2012-063 (RP-TEC) - 47 - March 29th , 2012
product sales may happen through real estate developers who wish to incorporate PV in new buildings.
4.5 Other Parts of the Supply Chain Other parts of the supply chain include the following:
Manufacturing equipment – This refers to the capital equipment used to manufacture the solar equipment. Normally, contractors build factories on a turnkey basis, where they are commissioned to build the whole factory. In Canada, Cambridge, Ontario-based ATS is a manufacturing equipment vendor.
Consumables for manufacturing – This refers to the raw materials consumed in the manufacturing process. In the case of module assembly, this includes glass, junction boxes/cables, encapsulents, frames and backsheets, among others. DuPont, 3M, and 5N Plus are materials suppliers in Canada.
Software / monitoring – Software and monitoring is used in different manufacturing processes. It is also used for PV systems where the system is monitored for power output and notification of any maintenance issues.
Financing – Financing involves the equity and debt required to finance PV systems. Another important part of financing is insurance products. For example, insurance products are used to insure against the guaranteed performance of a solar module.
Consulting – Consultants provide legal, engineering/architectural, business, accounting and other advice to the industry.
Testing – Testing of product is required at various parts of the supply chain. Module testing in Ontario is offered by Exova.
Energy Managers – Energy managers are those people in companies that have responsibility to oversee and manage the supply and consumption of energy. They will often be the ones responsible for procuring solar for their company’s buildings.
Utilities – Utilities play a key role in the PV supply chain in terms of providing a connection to the electrical grid.
Publishing – This refers to publishers of magazines, newsletters and other trade publications.
Trade and Industry Associations – This refers to trade and industry associations such as the Canadian Solar Industries Association (CanSIA), the Ontario Sustainable Energy Association (OSEA) and the Ontario Solar Network (OSN).
Training/Education – This refers to companies that conduct training at various parts of the supply chain and also to staff at universities and colleges engaged in teaching courses in PV.

Report – 2012-063 (RP-TEC) - 48 - March 29th , 2012
4.6 Building Integrated PV (BIPV) Supply Chain Building-integrated photovoltaic (BIPV) are technologies and/or materials that are used to replace building materials needed for roofs, skylights, facades, curtain-wall on high risers, and parking canopies, among others. Although BIPV can participate in the Ontario FIT Program, there is not a unique tariff for this technology.
There is considerable innovation going on in BIPV in Canada and around the world (see Chapter 8 PV Innovation System In Canada). In Canada, BIPV products are generally not commercially available, but rather are at the demonstration stage. Since July 2006, France offered the highest tariff for BIPV in the world, making it a more commercial market, though the BIPV industry is still relatively immature.
From a supply chain perspective, the BIPV product eliminates or reduces the need for racking and mounting as in conventional PV. However, the requirements for an inverter and wiring still exist. In terms of installation, BIPV can be deployed either as a retrofit on an existing building or it can be designed into a new building.
The main companies marketing BIPV products in Canada include Centennial Global Technology and Canadian Solar. Uni-Solar manufactured a BIPV product in Ontario in 2011 but they have since exited the market. Some of the leading BIPV product suppliers globally include Suntech, SunPower, Sharp, Yingli and Dow Chemical.
BIPV modules are available or being developed in several forms as follows:
Flat roofs – The most widely installed to date is a thin film solar cell integrated to a flexible polymer roofing membrane. In Ontario, Uni-Solar had a product for flat roofs but they have since exited the market.
Pitched roofs – Solar shingles are modules designed to look and act like regular shingles, while incorporating a flexible thin film cell.
Facade – Facades can be installed on existing buildings. These modules are mounted on the facade of the building, over the existing structure, which can increase the appeal of the building and its resale value.
Glazing – Transparent modules can be used to replace a number of architectural elements commonly made with glass or similar materials, such as windows and skylights.
Parking Canopies – Solar modules are integrated into a parking lot canopy.
Key Takeaway 14. The Building Integrated PV market is relatively immature as compared to other forms of PV and is still at the demonstration phase in Canada.

Report – 2012-063 (RP-TEC) - 49 - March 29th , 2012
5 KEY MANUFACTURER PROFILES This chapter provides profiles of leading manufacturers in Canada throughout the PV component supply chain. The profiles cover key metrics regarding the manufacturer’s product and service offerings, 2011 revenues, R&D expenditures, direct employees and levels of export. The data was collected via telephone surveys conducted throughout February and March 2012. In a number of cases a specific data point was either not disclosed or a minimum value or a range was provided. In some instances, revenue and R&D expenditures are provided at the aggregate level but not disclosed for a particular manufacturer.
Table 14 summarizes the key metrics across a selection of leading manufacturers. Revenue figures include all Canadian related PV revenues from all business lines, including development and EPC revenue. Due to the way some data was provided Navigant had to make assumptions with regard to revenue, R&D expenditures and exports. The total figure provided is an approximation using the following assumptions: 1) for values that were provided as a range, we assumed the midpoint and 2) when a minimum value was provided, we used the minimum value for the purposes of calculating totals. In addition, several manufacturers provided their data to be used at an aggregated level only. In total, the profiled manufacturers had 2011 revenues of $359 million across all of their product and service lines, had over 2,100 direct employees as of December 31, 2011, and exports represented approximately $89 million or 25% of revenues. Navigant attempted to contact all leading manufacturers operating in Canada. The table below represents those that responded to our survey and is not exhaustive.
Table 14 – Leading Canadian PV Component Manufacturers
Man. Component
Company Canadian HeadquartersRevenue from Canadian
Based Value Added Activities($M)
R&D EmployeesExports as a % of
Sales ($M)
Export % from Ontario
Manufacturers
PV Module Canadian Solar Kitchener, Ontario Greater than $100 million 0 300 25%PV Module Celestica Toronto, Ontario Greater than $20 million Greater than $1 million More than 300 25%PV Module Eclipsall Toronto, Ontario $8 million $250,000 70 10%PV Module Heliene Sault Ste Marie, Ontario $42 million $1.1 million 38 5%PV Module Photowatt Cambridge, Ontario Greater than $10 million $500,000 80 Less than 5%PV Module Silfab Mississauga, Ontario $5 million - $10 million $50 - $250 38 0%PV Module Siliken Toronto, Ontario $11.3 million 0 163 0%PV Module Solgate Woodbridge, Ontario Greater than $10 million $250,000 - $500,000 38 0%PV Module MEMC/Flextronics Toronto, Ontario Greater than $10 million n/a 450 n/aInverter SAE Power Scarborough, Ontario Approximately $12 million 0 25 0%Inverter SatCon Burlington, Ontario Approximately $10 - 15 million 0 140 50%Inverter Schneider Electric Burnaby, British Columbia $30 - 50 million $15 - 20 million More than 300 0%Inverter SunGrow Canada Vaughan, Ontario Less than $1 million Greater than $500,000 14 30%Inverter Sanmina Ottawa, Ontario n/a N Less than 125 N/ARacking Samco Toronto, Ontario $5 million - $10 million 0 32 40%Racking Schletter Windsor, Ontario 0 0 40 0%Racking Commercial Roll Form Brampton, Ontario Less than $500 k 0 4 0%
Export % from Non-Ontario
ManufacturersPV Module Day4 Energy Burnaby, British Columbia $57 million $3.4 million 34 94%Other 5N Plus Montreal, Quebec Greater than $10 million $750,000 90 More than 95%
Canadian Total ($M) $359 26 2156 25% 25%
94%
Ontario Based Manufacturers
9%
Non-Ontario Based Manufacturers

Report – 2012-063 (RP-TEC) - 50 - March 29th , 2012
5.1 Modules Celestica
Parent Company Description Global Electronics Manufacturing Services (EMS) company
Canadian-made PV Products Module assembly
Inverter assembly and test Service PV lines of business Design engineering for products and processes
Product Manufacturing Services
Technical reliability and qualification lab services
Supply chain and logistics services Canadian / Global Headquarter Location Toronto, Ontario Canadian-based PV employees (as of December 31, 2011) More than 300
SunEdison/MEMC Parent Company Description SunEdison is a division of MEMC
MEMC manufactures silicon products for semiconductor and solar industries
Canadian-made PV Products Module assembly
o MEMC has a service agreement in place with Flextronics whose facility is located in Newmarket, ON
Service PV lines of business Project development
O&M
EPC
Key Takeaway 15. Leading Canadian PV component manufacturers had revenues from all of their Canadian related PV activities of $359 million in 2011 and employed over 2,100 people.
Key Takeaway 16. Non-Ontario based component manufacturers represented the majority of exports in 2011.

Report – 2012-063 (RP-TEC) - 51 - March 29th , 2012
Financing
Project ownership Global Headquarter Location Belmont, California Canadian Headquarter Location Toronto, Ontario Canadian PV Revenues for 2011 Greater than $10 million Canadian-based PV employees (as of December 31, 2011) 450
Solar Subsidiary of ATS Automation (formerly Photowatt) Parent Company Description Division of ATS, who manufactures automated
manufacturing and assembly systems
Canadian-made PV Products Module assembly
Contract manufacture of panels for Hanwha SolarOne using Hanwha’s cells (160 MW agreement)
Solar module manufacturing equipment Service PV lines of business Ground and rooftop solar project development Global / Canadian Headquarter Location Cambridge, Ontario Canadian PV Revenues for 2011 Greater than $10 million
Canadian PV R&D Expenditures for 2011 $500,000 Canadian-based PV employees (as of December 31, 2011) 80
Exports as a % of sales 5%
Canadian Solar Solutions Inc. Parent Company Description Division of Canadian Solar Inc.
Vertically integrated module manufacturer
Canadian-made PV Products Module assembly Service PV lines of business Project development of utility scale solar farms
O&M EPC
Global / Canadian Headquarter Location Kitchener, Ontario Canadian PV Revenues for 2011 Greater than $100 million Canadian PV R&D Expenditures for 2011 None Canadian-based PV employees (as of December 31, 2011) 300
% of sales for Export 25%

Report – 2012-063 (RP-TEC) - 52 - March 29th , 2012
Eclipsall Energy Corp.
Parent Company Description Pure play module manufacturer Canadian-made PV Products Modules Service PV lines of business Development & Financing
EPC of solar projects Global / Canadian Headquarter Location Toronto, Ontario Canadian PV Revenues for 2011 $ 8 million Canadian PV R&D Expenditures for 2011 $ 250,000 Canadian-based PV employees (as of December 31, 2011) 70
% of sales for Export 10%
Heliene Inc. Parent Company Description Affiliated with Heliene Spain
Pure play module manufacturer Canadian-made PV Products Modules Service PV lines of business System Design
Financing
3rd party leasing Global / Canadian Headquarter Location Sault Ste. Marie, Ontario Canadian PV Revenues for 2011 $ 42 million Canadian PV R&D Expenditures for 2011 $ 1.1 million Canadian-based PV employees (as of December 31, 2011) 38
% of sales for Export 5%
Siliken Canada Parent Company Description Siliken Canada is a subsidiary of Siliken based in Spain
Pure play module manufacturer Canadian-made PV Products Module assembly (located in Windsor) Service PV lines of business Project Ownership
Project Acquisition Global Headquarter Location Valencia, Spain Canadian Headquarter Location Toronto, Ontario Canadian PV Revenues for 2011 $11.3 million Canadian PV R&D Expenditures for 2011 0 Canadian-based PV employees (as of December 31, 2011) 163
% of Sales for Export 0

Report – 2012-063 (RP-TEC) - 53 - March 29th , 2012
Day4 Energy Parent Company Description PV module manufacturing and technology licensing
Wangs Brother Motor Company (Taiwan) acquired 20% stake in December 2011
Canadian-made PV Products Module assembly
Manufacturing Equipment for PV Module Assembly Service PV lines of business Project development
Advanced PV modules research, design & marketing
PV module manufacturing process licensing Global / Canadian Headquarter Location Burnaby, British Columbia Canadian PV Revenues for 2011 $57 million Canadian PV R&D Expenditures for 2011 $3.4 million Canadian-based PV employees (as of December 31, 2011) 34
% of Sales for Export 94%
SolGate Parent Company Description Pure play module company Canadian-made PV Products Module assembly Service PV lines of business None Global / Canadian Headquarter Location Woodbridge, Ontario Canadian PV Revenues for 2011 Greater than $10 million Canadian PV R&D Expenditures for 2011 $250 - $500 k Canadian-based PV employees (as of December 31, 2011) 38
% of Sales for Export 0
Silfab Ontario Inc.
Parent Company Description Silfab Ontario is owned by Silfab SpA, which itself is owned by GRIDCO SRL
GRIDCO SRL manufactures cells and modules with partners
Canadian-made PV Products Module assembly
Single axis tracker Service PV lines of business None Global Headquarter Location Via Medoaco, Italy Canadian Headquarter Location Mississauga, Ontario

Report – 2012-063 (RP-TEC) - 54 - March 29th , 2012
5.2 Inverters Satcon
Parent Company Description PV inverter company
Other power conversion solutions Canadian-made PV Products Inverter assembly and test Service PV lines of business System monitoring Global Headquarter Location Boston, Massachusetts Canadian Headquarter Location Burlington, Ontario (factory was closed January 2012)
SAE Power Parent Company Description Contract inverter manufacturing
Other power conversion solutions Canadian-made PV Products Inverters Service PV lines of business None Global / Canadian Headquarter Location Scarborough, Ontario Canadian PV Revenues for 2011 Approximately $ 12 million Canadian PV R&D Expenditures for 2011 0 Canadian-based PV employees (as of December 31, 2011) 25
% of Sales for Export 0
Schneider Electric Parent Company Description Schneider Electric Canada Inc. is a subsidiary of
Schneider Electric SA based in Paris, France Canadian-made PV Products 3 Phase Inverters Service PV lines of business Project development (engineering and product
solutions) O&M
Global / Canadian Headquarter Location Global Solar Headquarters: Burnaby, BC Solar Operations Headquarters: Mississauga, ON
Canadian PV Revenues for 2011 $30 – 50 million Canadian PV R&D Expenditures for 2011 $15 – 20 million Canadian-based PV employees (as of December 31, 2011) More than 300
% of Sales for Export 0%

Report – 2012-063 (RP-TEC) - 55 - March 29th , 2012
SunGrow
Parent Company Description Subsidiary of SunGrow Power Supply Ltd. in China Largest inverter manufacturer in China Pure play inverter manufacturer in Canada
Canadian-made PV Products Grid-connected inverters (100 kW, 250 kW, and 500 kW)
Service PV lines of business None Global Headquarter Location Heifei, China Canadian Headquarter Location Vaughan, Ontario (Also HQ for North America) Canadian PV Revenues for 2011 Less than $ 1 million Canadian PV R&D Expenditures for 2011 Greater than $500,000 Canadian-based PV employees (as of December 31, 2011) 14
% of Sales for Export 30%
Sanmina-SCI Inc.
Parent Company Description Global EMS (electronics manufacturing services) Canadian-made PV Products Inverter assembly and test
Manufactures grid-tie inverters for multiple industry leading OEMs
Manufactures technology leading microinverters and associated communication hubs
Service PV lines of business Design engineering for products and processes Global Headquarter Location San Jose, California, United States Canadian Headquarter Location Ottawa, Ontario Canadian-based PV employees (as of December 31, 2011) Less than 125
Report – 2012-063 (RP-TEC) - 56 - March 29th , 2012
5.3 Racking Samco Solar
Parent Company Description Division of Samco Machinery Provides roll forming machine solutions to the building
and construction, automotive, HVAC and appliance industries
Leading turnkey fabricator of solar mounting systems and accessories for large-scale rooftop and ground-mount PV systems
Canadian-made PV Products Racking (contract manufacturing) Trackers (contract manufacturing) Concentrated Solar Systems (contract manufacturing)
Service PV lines of business None Global / Canadian Headquarter Location Toronto, Ontario Canadian PV Revenues for 2011 $5 – 10 million Canadian PV R&D Expenditures for 2011 None Canadian-based PV employees (as of December 31, 2011) 32
% of Sales for Export 40%
Schletter Canada Inc.
Parent Company Description Schletter GmbH – solar racking system manufacturer Canadian-made PV Products Solar racking systems Service PV lines of business None Global Headquarter Location Kirchdorf/Haag, Germany Canadian Headquarter Location Windsor, Ontario Canadian-based PV employees (as of December 31, 2011) Approximately 40
Commercial Roll Form
Parent Company Description Serves multiple markets with a variety of metal products
Canadian-made PV Products Racking Systems Service PV lines of business None Global / Canadian Headquarter Location Brampton, Ontario Canadian PV Revenues for 2011 Less than $500,000 Canadian PV R&D Expenditures for 2011 none Canadian-based PV employees (as of December 31, 2011) 4
% of Sales for Export None

Report – 2012-063 (RP-TEC) - 57 - March 29th , 2012
5.4 Other 5N Plus
Parent Company Description Pure play PV module materials company Canadian-made PV Products Pure metals and compounds for thin-film PV industry:
Cadmium tellurium, Cadmium telluride, Cadmium sulphide, and Selenium
Service PV lines of business None Global / Canadian Headquarter Location Montreal, Québec Canadian PV Revenues for 2011 Greater than $10 million Canadian PV R&D Expenditures for 2011 $750,000 Canadian-based PV employees (as of December 31, 2011) ~90
% of Sales for Export Greater than 95%
5.5 Contract Manufacturing The manufacturers listed above have their own facilities located in Canada. As described in Chapter 4 PV Supply Chain in Canada, in Ontario, many manufacturers sell their products but use a third party to manufacture them locally in order to satisfy the domestic content requirements embedded in the FIT program. The OEM’s either license their technology or provide inputs to these manufacturers. Table 15 provides examples of some of the contract manufacturing relationships in Canada due to Ontario’s domestic content requirements.
Table 15 – Sample of Contract Manufacturing Relationships
Component Manufacturer Contract Manufacturer Soventix
Opsun Celestica
Hanwha ATS Modules
LDK Lumin
Ontario Solar Form
SMA
Advanced Energy Celestica
Inverters Emerson
SPARQ Sanmina
UniRac
Unistrut
Northern Metal States
Not Disclosed Racking
DEGERenergie Broadway Metals Inc

Report – 2012-063 (RP-TEC) - 58 - March 29th , 2012
5.6 Recent Factory Closures Overcapacity in the worldwide PV market has caused factory closures and bankruptcies. In addition, moves to a contract manufacturing model have similarly caused factory closings. Some recent factory closings in Canada include the following:
United Solar (Uni-Solar) – In November 2011, amorphous silicon, thin film, module manufacturer Uni-Solar announced that it was shuttering its Lasalle, Ontario plant close to Windsor, and letting go its 20 workers.40F
44 The company had just opened the facility some 5 months earlier in May 2011. Uni-Solar was the only thin film company that had been in commercial production in Ontario. In February 2012, Auburn Hills, Michigan-based Energy Conversion Devices, the parent of Uni-Solar, filed for bankruptcy. 41F
45
Satcon – In January 2012, inverter manufacturer Satcon announced that it would be closing its Burlington, Ontario factory and laying off 140 workers.42F
46 The Satcon facility in Burlington was primarily making the smaller scale Solstice inverters that Satcon had decided to eliminate. Satcon’s larger inverters are manufactured outside of Ontario. As of January 2012, Satcon indicated that they were “currently working to partner with a contract manufacturer to maintain Ontario production capacity for Satcon solutions to continue to satisfy Ontario’s feed-in tariff requirements”.43F
47
Timminco – Timminco announced in March 2010 that it was suspending its production of silicon in Becancour, Quebec amid lower polysilicon prices. The company continued to sell product from its inventory but has yet to resume production. In March 2012, Timminco announced its assets had been purchased by QSI Partners. 44F
48
44 http://blogs.windsorstar.com/2011/11/10/lasalles-uni-solar-plant-closes/ 45http://www.freep.com/article/20120214/BUSINESS06/120214023/Energy-Conversion-Devices-bankruptcy-ECD 46http://www.bloomberg.com/news/2012-01-04/satcon-cuts-35-of-workforce-to-close-factory-in-canada.html 47 http://investor.satcon.com/phoenix.zhtml?c=93692&p=irol-newsArticle&ID=1644417&highlight= 48 http://www.timminco.com/PressRelease.aspx?prId=1579145&id=24

Report – 2012-063 (RP-TEC) - 59 - March 29th , 2012
6 CURRENT ECONOMIC AND PRODUCTIVITY STATISTICS This chapter provides an estimate of the 2011 economic and productivity statistics for the Canadian PV industry, summarized in Table 16. We first review the metrics we chose to analyze and then we discuss each metric in detail.
This analysis represents a high level, top down direct economic impact estimate and was conducted using installation information available through public sources. Given that project specific details were unknown, Navigant used professional judgment in estimating domestic content for major components and activities based on Canadian manufacturing capability as well as PV segment specific domestic content requirements, discussed in greater detail below. In addition, Canadian value added percentages for each activity were estimated by market segment based on Canadian specific activities and average selling prices. An overview of the methodology is provided in Figure 13 below.
Table 16 – Summary of Economic and Productivity Metrics
Metric Activity 2011 Economic Output Due to Canadian Market
2011 Economic Output Due to Exports
Engineering and Construction $452 M 0 Development Costs $32 M 0 Module Manufacturing $42 M $5 M Inverter Manufacturing $9 M $1 M Racking Manufacturing $33 M $3 M Electrical Component Distribution $16 M 0
Economic Output
Total $584 M $9 M New Energy Generation All 722 GWh N/A
Employment All 5,143 FTE
Key Takeaway 17. In 2011, the Canadian PV industry drove $584 M of economic output and directly employed approximately 5,100 full time equivalents.

Report – 2012-063 (RP-TEC) - 60 - March 29th , 2012
Step 1:Determine 2011 Canadian PV
Installations and Exports
Output:
1. PV Installations by segment on a MW basis.
2. Estimate of exports based on survey responses
1. Review OPA Contract Management and FIT Bi-weekly reports
2. Review Canmet submission on Canadian PV installations to IEA
3. Survey Leading Manufacturers
Step 2: Estimate Domestic Content
by PV Related Activity
1. Allocate Domestic Content by PV component and activity, dif ferentiated PV market segment, based on:
• Manufacturing Capability
• Service Capability
• Domestic Content Requirements
Output
1. Percentage of Domestic Content for each PV related activity dif ferentiated by segment.
Step 3:Estimate Value Add by PV
Related Activity
1. Estimate value added for each PV related activity occurring in Canada based on Canadian specif ic activities and average selling price of component or service.
Output:
1. Value added for each PV related activity on a $/W basis.
Step 4: Calculate Total PV Economic Impacts
1. Multiply outputs f rom Step 1, 2 and 3.
Output:
1. Total PV related economic impact dif ferentiated by PV segment.
Figure 13 – Economic Impact Methodology
6.1 Metrics Navigant considered economic impacts driven by Canadian PV installations and reported exports of products. We considered many different metrics to track economic productivity but chose those related to 1) economic output, including engineering and construction, development costs, manufacturing, 2) energy production and 3) employment. Most of the PV industry’s direct GDP impacts are driven by these activities and they can be tracked or estimated each year using publicly available data.
We first looked at impacts due to Canadian PV installations. Because not all equipment manufactured in a given year will be installed in that year, the data here represents a typical 12 month period, rather than precisely what happened in 2011. Based on the number of installations in a given year we made assumptions on the percentage of equipment that was manufactured in Canada and what percent represented value added activities that occurred in Canada. For example, a PV module might cost $1.60/W, but the value add of the manufacturing steps that take place in Canada is only $0.80/W, so we only attribute $0.80/W of economic output to Canada.
For this analysis, we broke the industry into six segments based upon variations in domestic content requirements (which influence the amount of Canadian manufacturing required), installation costs, and typical energy production. The six segments are:
Ontario RESOP
Ontario FIT – Ground Mount
Ontario FIT – Rooftop
Ontario microFIT
Grid connected outside of Ontario
Off-grid

Report – 2012-063 (RP-TEC) - 61 - March 29th , 2012
We used the assumed breakout of system prices shown in Table 17, by segment.
Table 17 – Assumed Breakout of Installed Costs
Segment Ontario RESOP
Ontario FIT – Ground
Mount
Ontario FIT – Roof Top
Ontario MicroFIT
Grid Connected
Outside Ontario
Off-Grid
Modules $1.70 $1.60 $1.70 $1.75 $2.00 $2.00 Inverter $0.35 $0.35 $0.35 $0.35 $0.40 $0.40 Racking $0.20 $0.20 $0.20 $0.20 $0.30 $0.30 Electrical Components $0.26 $0.26 $0.26 $0.30 $0.30 $0.30 Installation $0.80 $0.80 $0.90 $2.80 $3.00 $3.00 Owner’s Costs $0.20 $0.20 $0.30 0 0 0
Total $3.51 $3.41 $3.71 $5.40 $6.00 $6.00
In addition to impacts associated with Canadian PV installations, we looked at the economic impacts of Canadian manufacturers exporting products. We chose metrics due to manufacturing and employment by the same rationale discussed above. Export data was not readily available and was based on information provided by a selection of leading manufacturers.
6.2 Domestic Demand Navigant estimates 289 MWDC were installed during 2011, divided amongst the PV market segments as shown in Table 18. Ontario specific data was taken from the Ontario Power Authority 45F
49 and non-Ontario data are Navigant estimates based on CanmetENERGY submissions to the International Energy Agency.46F
50 Several large RESOP projects were installed in 2011 as well as a significant amount of microFIT and some rooftop FIT projects.
Installation
Navigant assumes that 100% of economic outputs of installation are attributable to Canada. The economic output of these items – on a $/W basis for each segment is also shown in Table 18. Total 2011 economic output of all segments was approximately $452 million and this is the largest impact of any segment we analyzed.
49 Ontario Power Authority at FIT.powerauthority.on.ca 50 Ayoub, J, Dignard-Bailey, Poissant, Y, National Survey Report of PV Power Applications in Canada - 2009, CanmetENERGY, 2010

Report – 2012-063 (RP-TEC) - 62 - March 29th , 2012
Table 18 – 2011 Canadian PV Installations and Economic Impacts
Segment 2011 Installations (MWDC)47F
51 Canadian Value Add Installation ($/W)
Total 2011 Economic Impact ($M)
Ontario RESOP 156 $0.80 $125 Ontario FIT – Ground Mount 0.6 $0.80 $0.5
Ontario FIT – Roof Top 27 $0.90 $24 Ontario MicroFIT 79 $2.80 $222 Grid Connected Outside Ontario 2 $3.00 $6
Off-Grid 25 $3.00 $75 Total 289 $452
Owner’s Costs
In addition to the economic activity related to construction, a project owner has costs related to development, permitting, professional services and consultants. In our experience, these costs are only incurred by commercial and utility scale projects, such as RESOP and FIT, and not by smaller projects, such as microFIT or off-grid applications. While RESOP projects do need to procure these services to comply with domestic content requirements typically companies with local knowledge are required in these areas, for example Canadian based firms are better suited to do permitting in Canada. So we assumed a majority of Owner’s Costs stay in Canada. The value add of this is roughly $0.20/W, coming to a 2011 economic output of $32 million.
Table 19 – Economic Impact of Owner's Costs
Segment 2011 Installations (MWDC)
% Domestic Sourcing
Canadian Value Add ($/W)
Total 2011 Economic Impact ($M)
Ontario RESOP 156 80% $0.15 $23 Ontario FIT – Ground Mount 0.6 80% $0.20 $0.1
Ontario FIT – Roof Top 27 80% $0.30 $8.1
Ontario MicroFIT 79 0 $0.00 $0.0 Grid Connected Outside Ontario 2 0 $0.00 $0.0
Off-Grid 25 0 $0.00 $0.0 Total 289 Total $32
Manufacturing
Most necessary components are manufactured in Canada, primarily in Ontario, but their actual usage is influenced by varying domestic content requirements. Certain segments – RESOP, off-grid and grid connected outside of Ontario – do not have domestic content requirements. For 51 The OPA reports its PV in MWAC where costs are quoted in MWDC therefore a DC/AC ratio of 1.20 was used to convert OPA installation figures to MWDC.

Report – 2012-063 (RP-TEC) - 63 - March 29th , 2012
those segments, components are typically purchased based upon lowest cost and likely do not come from Canada. However, projects participating in the Ontario FIT programs must meet a minimum domestic content requirement as described in Section 2.1.3 Ontario’s Domestic Content Requirements. For ease of reference, the requirements and repeated in Table 20 below. We have shaded the items we believe most projects will use to comply. We are assuming that Ingots/Wafers and Cells will not come from Ontario because no commercial-scale suppliers exist. This section discusses the economic impact of items that are manufactured in Canada.
Table 20 – Ontario FIT Domestic Content Requirements48F
52
Qualifying Percentages Designated Activity
microFIT Crystalline Silicon > 10 kW
Silicon 10% 11%
Ingots/Wafers 12% 13%
Cells 10% 11%
Module 13% 15%
Inverter 9% 8%
Racking 9% 11%
Wiring and Electrical Hardware 10% 9%
On- and Off-Site Labour 27% 18%
Consulting Services - 4%
Total 100% 100%
Modules
Because of variances in content requirements, we analyzed the likely source of modules for each segment. For segments without domestic content requirements, we assumed the modules were mostly sourced from outside Canada.49F
53 For FIT projects, we looked at how the domestic content requirements have evolved. MicroFIT applications in before October of 2010 had to meet a 40% requirement, which can be done without an Ontario module. Given that projects have a six month to one year window for completion after application approval, depending on the date that they had applied, we assumed roughly half the projects installed in 2011 had a 40% requirement and half had a 60% requirement. For the rooftop FIT projects, we assumed most of the projects installed in 2011 still qualified for the 50% domestic content requirement, so most of them did not use Canadian modules.
52 Ontario Power Authority. Thin-Film requirements were not included because no commercial scale thin-film manufacturing facilities are running in Ontario. 53 Beyond the lack of domestic requirements, most RESOP projects were developed at a time when there were not very many module manufacturers in Canada, so they signed module supply agreements with international suppliers.

Report – 2012-063 (RP-TEC) - 64 - March 29th , 2012
To calculate the economic output of module manufacturing, we only included the value add of module assembly, not the whole value of the module. Module assembly starts with finished cells. The cells are then strung together (electrically), mounted on a back sheet, and encapsulated. Cover glass is applied before frames are added. Finally, electrical testing is completed. Depending on the segment, the value-add ranges from $0.80 to $1.00/W. Table 21 shows that the total impacts was approximately $42 million in 2011. However, going forward remaining FIT projects will be subject to higher domestic content requirements and therefore the economic impact of module manufacturing is expected to increase.
Table 21 – 2011 Economic Output of Canadian Module Manufacturing
Segment 2011
Installations (MWDC)
% Domestic Modules
Canadian Value Add ($/W)
Total 2011 Economic Impact
($M) Ontario RESOP 156 0% $0.85 $0.0 Ontario FIT – Ground Mount 0.6 25% $0.80 $0.1
Ontario FIT – Roof Top 27 25% $0.85 $5.7
Ontario MicroFIT 79 50% $0.88 $34.6 Grid Connected Outside Ontario 2 5% $1.00 $0.1
Off-Grid 25 5% $1.00 $1.3 Total 289 Total $42
Inverters
Similar to modules, only the final assembly and testing of inverters – approximately 25% of the overall value - is currently being done in Canada, so the value-add is less than the total sale price of an inverter. This comes to approximately $0.09 to $0.10/W. Since some inverter manufacturers were present in Ontario prior to the FIT program, we assumed some RESOP projects use Ontario inverters. For the FIT rooftop projects, Ontario inverters are required to meet domestic content, so we assumed 100% local sourcing. For the same rationale as modules, we assumed 50% of microFIT projects sourced local inverters. This results in an overall impact of $9 million.

Report – 2012-063 (RP-TEC) - 65 - March 29th , 2012
Table 22 – Economic Output of Canadian Inverter Manufacturing
Segment 2011
Installations (MWDC)
% Domestic Inverters
Canadian Value Add ($/W)
Total 2011 Economic Impact
($M)
Ontario RESOP 156 25% $0.09 $3.4 Ontario FIT – Ground Mount 0.6 100% $0.09 $0.0
Ontario FIT – Roof Top 27 100% $0.09 $2.4
Ontario MicroFIT 79 50% $0.09 $3.5 Grid Connected Outside Ontario 2 0% $0.10 $0.0
Off-Grid 25 0% $0.10 $0.0 Total 289 Total $9.0
Racking
For racking we assumed that FIT projects would have to source 100% from Ontario to meet domestic content requirements. However, there have been a number of racking manufacturing options in Canada for some time, so we assumed that some non-FIT projects would source from Canada. Since all of the manufacturing of these components is typically done in Canada, and most of the inputs are available in Canada, we attributed 80% of the component costs to Canadian economic activity. The total 2011 impact was $33 million and since most racking comes from Canada, we expect that the impact of this sector will scale with market size.
Table 23 – Economic Output of Canadian Racking Manufacturing
Segment 2011
Installations (MWDC)
% Domestic Racking
Canadian Value Add ($/W)
Total 2011 Economic Impact
($M) Ontario RESOP 156 50% $0.16 $12.5 Ontario FIT – Ground Mount 0.6 100% $0.16 $0.1 Ontario FIT – Roof Top 27 100% $0.16 $4.3 Ontario MicroFIT 79 100% $0.24 $12.7 Grid Connected Outside Ontario 2 50% $0.24 $0.2 Off-Grid 25 50% $0.24 $3.0
Total 289 Total $33
Electrical
The domestic content requirements for electrical components – such as wiring, combiner boxes and fuses – state that the products must be bought from an Ontario company, but can be manufactured anywhere, so we assumed 100% local sourcing for FIT projects. But for the non-

Report – 2012-063 (RP-TEC) - 66 - March 29th , 2012
FIT projects we also assumed 100% local sourcing because these components are typically not sourced internationally. We assumed the value-add is mostly the distributor or wholesaler’s margin of ~20%. The economic impact of this was $16 million.
Table 24 – Economic Output of Electrical Component Distribution
Segment 2011 Installations (MWDC)
% Domestic Electrical
Canadian Value Add ($/W)
Total 2011 Economic Impact50F
54 ($M)
Ontario RESOP 156 100% $0.05 $8.1 Ontario FIT – Ground Mount 0.6 100% $0.05 $0.0
Ontario FIT – Roof Top 27 100% $0.05 $1.4
Ontario MicroFIT 79 100% $0.06 $4.8 Grid Connected Outside Ontario 2 100% $0.06 $0.1
Off-Grid 25 100% $0.06 $1.5 Total 289 Total $16
6.3 Economic – Exports To assess the economic output driven by manufacturing exports, we leveraged the Chapter 5 interviews with manufacturers and asked them about their export activities. We found that across modules, inverters and racking, exports were 10% of revenue in 2011. We assumed no export of work for installation, owner’s costs or electrical component distribution as those fields are generally regional and require specific local knowledge, certifications, licences, etc. We scaled the economic outputs calculated in the previous section for module, inverter and racking manufacturing to account for exports Table 25 shows the results. The exports totaled $9 million in economic output for 2011.
Table 25 – Economic Output Driven by Manufacturing Exports
Product Export Revenue ($M)
Module Manufacturing $4.6
Inverter Manufacturing $1.0
Racking Manufacturing $3.4
Total $9.0
6.4 Energy Production Another economic benefit of the PV industry is the electricity the plants generate, which offsets the need for other sources of power. To capture this benefit, we calculated the annual generation of installed plants in Canada. For pre-2011 installations, we used data reported to 54 Individual values may not sum to total due to rounding.

Report – 2012-063 (RP-TEC) - 67 - March 29th , 2012
the IEA by CanmetENERGY. 51F
55 We used publicly available weather data and production modelling tools, such as the US National Renewable Energy Laboratory’s System Advisor Model, the Photovoltaic potential and solar resource maps of Canada56, as well data obtained through past Navigant industry surveys, to estimate annual production for the each segment. We looked at each segment separately because of variations in likely location and system design. All the FIT and RESOP projects will be installed in Ontario at a fixed tilt, but many of the microFIT projects employ dual-axis tracking devices. Furthermore, the ground-mount FIT and RESOP projects will have a slightly more optimal tilt than rooftop projects. For projects outside Ontario, we took weather data from Winnipeg as an average for the rest of the country. We then multiplied the calculated kWh/kW by the installed base to get the generation available in 2011 and arrived at 674 GWh.
The economic value of this can be estimated by average cost of generation during the year. For our analysis, we focused on the average cost of generation in Ontario, since that is where most of the plants are installed. Using data from the Independent Electricity System Operator in Ontario, we used an average Hourly Ontario Electricity Price of 3.15 cents/kWh52F
57 and an average Global Adjustment Mechanism cost of 4.04 cents/kWh 53F
58 for a total value of 7.19 cents/kWh. Multiplying this time 674 GWh yields a value of $48 M/Year.
Table 26 – Generation of PV Fleet as of the End of 2011
Segment Pre-2011
Installations Base (MWDC)
2011 Installations
(MWDC)
Production Capacity
(kWh/kW) Generation (GWh)
Off-grid domestic 22.9 1,200 74 Off-grid non-domestic 37.3
27 1,200 61
Grid-connected distributed 27.7 106.0 1,250 167
Grid-connected centralized 193.3 156.6 1,200 420
Total 281 289 - 722
55 Ayoub, J, Dignard-Bailey, Poissant, Y, National Survey Report of PV Power Applications in Canada - 2010, CanmetENERGY, 2011 56 Photovoltaic potential and solar resource maps of Canada: https://glfc.cfsnet.nfis.org/mapserver/pv/index_e.php 57 Taken from http://www.ieso.ca/imoweb/siteShared/monthly_prices.asp?sid=bi 58 Taken from http://www.ieso.ca/imoweb/siteshared/global_adjustment_tbl.asp?sid=bi
Key Takeaway 18. At the end of 2011 total Canadian PV installations of 571 MW could generate 722 GWh per year with a potential value of $48 M/Year.

Report – 2012-063 (RP-TEC) - 68 - March 29th , 2012
6.5 Employment In addition to economic output, employment totals present the economic impact of an industry. We looked at employment impacts for each of the activities discussed above – engineering and construction, owner’s costs and manufacturing. Navigant has completed several studies on the employment impacts of the PV industry and was able to leverage past work to estimate the per MW impacts of each activity, shown in Table 27. The data are shown in Full Time Equivalent 54F
59 (FTE)/MW. For RESOP module manufacturing, we assume it is 0 because no RESOP modules come from Canada. Installation is the most labour intensive, followed by module manufacturing.
Table 27 – Labor Intensity (FTE/MW)
Segment Module Mfg
Inverter Mfg Installation Racking
Mfg
Electrical Component Distributors
Owner's Costs Total
Ontario RESOP 1 1.2 4 2 0.3 1.2 9.7 Ontario FIT –
Ground Mount 2.5 1.2 4 2 0.3 1.2 11.2
Ontario FIT – Roof Top 2.5 1.2 5 2 0.4 1.2 12.3
Ontario microFIT 1 1.2 14 2 0.4 0 18.6 Grid Connected Outside Ontario 2.5 1.2 13 2 0.4 0 19.1
Off-Grid 2.5 1.2 13 2 0.4 0 19.1
Labour intensity data for module, inverter and racking manufacturing were taken from past Navigant studies55F
60 and adopted to current Canadian conditions based upon manufacturer interviews.
For the other industries, we used economic multipliers available from Statistics Canada 56F
61 on the number of jobs driven by spending in a certain industry, where the industries are defined by NAICS codes. For installation of PV facilities, we used data for Electric Power Engineering Construction of 4.33 FTE/$M spent. For Electrical Component Distributors, we used a value of 6.27 FTE/$M spent in the Wholesale Trade. Finally, for owner’s costs, we used a value of 8.16 FTE/$M spent on Computer Systems Design and Other Professional, Scientific and Technical service. As discussed above, we assumed owner’s costs were minimal in the microFIT and non-Ontario markets.
59 One FTE equals employment of one person for a year, or multiple people contributing enough hours to equal one person being employed for a year. 60 Sources: Economic Impacts of Extending Federal Solar Tax Credits, September, 2008, completed for the Solar Energy Research and Education Foundation; Jobs Impacts of a National Renewable Electricity Standard, February 2010, completed for the RES Alliance for Jobs; Employment Impacts of a National Clean Energy Standard, August, 2010, completed for GE Energy; What Does the California Solar Clean Tech Workforce Look Like, July, 2010, presented at Intersolar North America 2010 61 Provincial Input-Output Multipliers, Industry Accounts Division System of National Account, Statistics Canada, May 2010

Report – 2012-063 (RP-TEC) - 69 - March 29th , 2012
Table 28 shows the results of multiplying the labour intensity values by the combined Canadian installations and export sales numbers. We estimate that ~1,000 MW of capacity already exists in Ontario for modules, inverters and racking manufacturing. We assumed this level of capacity for half of 2011 and included those employment impacts as well. Note that this does not include: the impact of utility or government employees involved in PV; the employment impacts of transmission and distribution planning and construction; and employment related to projects under development. This is an increase of ~70% over the FTE’s reported by CanSIA in 2009. 57F
62
Table 28 – Estimated 2011 PV Employment
Labour Type 2011
Manufacturing Trades 2,225
Manufacturing Engineers 295
Management and Overhead 412
Construction Trades 1,661
Civil Engineers 179
Electrical Engineers 179
Permitting consultants 68
Sales 124
Total 5,143
62 2009 Labour Force Survey of the Canadian Solar Industry, 2009, available at www.brightfutures.ca

Report – 2012-063 (RP-TEC) - 70 - March 29th , 2012
7 CANADIAN WORKFORCE ASSESSMENT As the Canadian PV industry grows, the need for employees with specialized knowledge of solar will grow as well. In this chapter, we first forecast the demand for labour. We then compared this demand against different information on labour supply to look where gaps might be. We found an oversupply of manufacturing labour, but a shortage of skilled construction and engineering labour.
7.1 Employment Needs Navigant first calculated how many FTE’s would be needed for each skill set in the Canadian PV industry. We first looked at what skills are needed and then calculated the number of FTEs in each skill set as a function of the size of the PV industry.
7.2 Skills Needed To understand the different skills needed for the Canadian PV industry, we looked at the different activities analyzed in Chapter 6:
Module Manufacturing: high-tech and low-tech technicians for module assembly and testing; manufacturing engineers to design processed, monitor equipment, quality control and trouble-shooting; management and supervisors; and a sales staff knowledgeable in PV.
Inverter Manufacturing: high-tech and low-tech technicians for inverter assembly and testing; manufacturing engineers to design processed, monitor equipment, quality control and trouble-shooting; management and supervisors; and a sales staff knowledgeable in PV.
Racking Manufacturing: low-tech technicians for metal working, assembly, coating and testing; manufacturing engineer, management and supervisors; and a sales staff knowledgeable in PV.
Electrical Component Distributors: sales staff knowledgeable in PV products and design; management and supervisors
Installation: Construction trades including electricians, welders, general construction labourers, heavy equipment operators and shift supervisors; civil and electrical engineers; and management and administrative staff.
Owner’s Costs: permitting consultants are usually environmental scientists and biologists; civil and electrical engineering; and management and overhead.
We grouped these different skill sets into eight categories:
Manufacturing trades
Manufacturing engineers

Report – 2012-063 (RP-TEC) - 71 - March 29th , 2012
Management and overhead
Construction trades
Civil engineers
Electrical engineers
Permitting consultants
Sales
Using previous Navigant studies and models58F
63 we estimated the breakout of labour needs for each activity, shown in Table 29.
Table 29 – Skill Set by Activity Type
Labour Type Module Manufacturing
Inverter Manufacturing Installation Racking
Manufacturing
Electrical Component Distribution
Owner's Costs
Manufacturing Trades 75% 75% 0% 85% 0% 0%
Manufacturing Engineers 15% 15% 0% 5% 0% 0%
Management and Overhead 7% 7% 5% 8% 10% 15%
Construction Trades 0% 0% 85% 0% 0% 0%
Civil Engineers 0% 0% 5% 0% 0% 30% Electrical Engineers 0% 0% 5% 0% 0% 30%
Permitting consultants 0% 0% 0% 0% 0% 25%
Sales 3% 3% 0% 2% 90% 0%
Total 100% 100% 100% 100% 100% 100%
7.2.1 Market Forecasts
To understand the magnitude of labour requirements, we projected annual installations, by segment, out to 2014. Our forecast – shown in Table 30 – has installations peak at 748 MWDC in 2013. 59F
64 This forecast includes projected attrition rates by market segment. Please note that each segment’s attrition rate does not apply to all MW under contract. Navigant assumed that the projects that are already under construction will achieve commercial operation. We assume that the Off-Grid and Grid Connected Outside Ontario markets stay steady over time. The Ontario FIT
63 Jobs Impacts of a National Renewable Electricity Standard, February 2010, completed for the RES Alliance for Jobs; PV Manufacturing Cost Model, 2008, prepared for the U.S. Department of Energy’s Solar America Initiative. 64 OPA reports contracts in MWAC but these were converted to MWDC at a DC/AC ratio of 1.2.

Report – 2012-063 (RP-TEC) - 72 - March 29th , 2012
– Ground Mount line includes the 240 MWDC of projects proposed by Samsung that we anticipate to be installed in 2014.
Table 30 – Navigant's Market Projection [MWDC]
Segment Contracted Attrition Net of Attrition 2012 2013 2014
Ontario RESOP 224 10% 202 202 0 0 Ontario FIT – Ground Mount 1,359 10% 1,223 141 618 465
Ontario FIT – Roof Top 337 20% 269 124 104 42
Ontario MicroFIT 174 20% 139 139 0 0
Sub-total 2,094 12% 1,834 606 721 506 Grid Connected Outside Ontario - - - 2 2 2
Off-Grid - - - 25 25 25
Total 2,094 12% 1,834 633 748 533
7.2.2 Labour Requirements
Using labour intensity from Table 27, skill requirements from Table 29 and our market projections in Table 30, we projected the number of FTE’s required for each skill set, by year in each scenario (Figure 14).
Labour needs peak in 2013, with installations. The largest areas of need are manufacturing trades and construction trades, combining for ~5,800 FTE’s in 2013. However, their need falls by 2014 as new construction falls off.
-
500
1,000
1,500
2,000
2,500
3,000
3,500
Man
ufac
turi
ng T
rade
s
Man
ufac
turi
ng E
ngin
eers
Man
agem
ent a
ndO
verh
ead
Con
stru
ctio
n Tr
ades
Civ
il En
gine
ers
Elec
tric
al E
ngin
eers
Perm
ittin
g co
nsul
tant
s
Sale
s
FTE'
s
201220132014
Figure 14 – Skill set requirements

Report – 2012-063 (RP-TEC) - 73 - March 29th , 2012
7.3 Current Supply No current study (i.e. completed within the last year) exists of labour supply for the PV industry, so we collected information from a variety of sources to compare against demand.
Statistics Canada Data Every year, Statistics Canada estimates labour supply by National Occupational Classification-Statistics (NOC-S) code. Navigant purchased data 60F65 for codes relative to PV for Canada as a whole and specifically for Ontario as that is where most PV manufacturing and construction will be.
Table 31 – 2011 Labour Supply Data for Skill Sets Relevant to the PV Industry
Function / Skill Set Canada Ontario NOC-S code
Managers In Construction And Transportation 196,700 74,500 A37
Managers In Manufacturing And Utilities 75,400 28,100 A39
Civil Engineers 414,300 22,700 C031
Electrical and Electronics Engineers 37,200 16,700 C033
Industrial and Manufacturing Engineers 12,900 5,500 C041
Sales Representatives and Technical Sales Specialists 364,300 150,100 G11 and G12
Construction trades 395,700 128,200 H1
Machine Operators in Manufacturing 359,400 159,800 J1
Navigant Estimates of 2011 Levels
Finally, we estimated what employment levels were in 2011 to understand how many more FTE’s are needed in each section. Using Table 18’s 2011 installations, labour intensity from Table 27, and skill requirements from Table 29, we created an initial estimate. However, we updated this estimate given that we estimate that ~1,000 MW of capacity already exists in Ontario for modules, inverters and racking manufacturing. We assumed this level of capacity for half of 2011. This leads to a total 2011 level of ~4,900 FTEs as shown in Table 28.
7.4 Gaps and Challenges Comparing Table 16 to Table 31 would suggest that there is abundant labour available to staff the Canadian PV industry. However, what Table 31 does not capture is that the PV industry requires specialized training as discussed in a recent Electricity Sector Council study 61F
66 on the PV labour force and a Conference Board of Canada report analyzing future employment needs in the Canadian electric sector as a whole. 62F
67 A more useful comparison is comparing the peak labour needs – in 2013 – to 2011 levels, shown in Table 32.
65 Statistics Canada, Labour Force Survey, custom tabulation purchase at www.statcan.ca 66 2009 Labour Force Survey of the Canadian Solar Industry, 2009, available at www.brightfutures.ca 67 Shedding Light on the Economic Impact of Investing in Electricity Infrastructure, 2012, The Conference Board of Canada

Report – 2012-063 (RP-TEC) - 74 - March 29th , 2012
This analysis shows shortages in each field. There is a short fall in manufacturing trades, but not as big as one would expect in just looking what was installed in 2011. This is because Ontario already has enough manufacturing capacity to almost meet future needs. However, collectively there is still a shortage of approximately 3,800 FTEs, driven by construction trades, and related engineering and manufacturing, that needs to be filled in the near term.
Table 32 – Shortfall in labour relative to 2011 levels
Labour Type 2011
Labour Force
Peak Needs 2012 - 2014
Shortfall
Manufacturing Trades 2,225 3,333 1,108
Manufacturing Engineers 295 491 199
Management and Overhead 412 641 229
Construction Trades 1,661 2,981 1,485
Civil Engineers 179 463 284
Electrical Engineers 179 463 284
Permitting consultants 68 265 197
Sales 124 321 197
Total 5,143 8,956 3,978
Key Takeaway 19. The Canadian PV industry has a shortage of approximately 3,800 FTEs to meet the likely demand through 2014.

Report – 2012-063 (RP-TEC) - 75 - March 29th , 2012
8 PV INNOVATION SYSTEM IN CANADA
8.1 Introduction Access to a variety of federal, provincial, and venture capital funding has helped create hubs of PV innovation in Canada. In this chapter, we discuss the PV innovation system in Canada. We identify PV technology clusters within Canada, leading companies that conduct research and development (R&D) within these clusters, and key private and institutional research partners that collaborate with each company. Academic networks that have resulted in significant collaboration between university researchers and companies are identified. Local and global competitors for each profiled company are identified. This is followed by an overview of activities in PV technology innovation globally. Leading Canadian PV researchers and their research are summarized in Appendix B.
8.2 Summary of Funding Programs Figure 15 shows Canadian federal funding sources and the stages of commercialization they cover. These sources of funding are potential sources for PV, but also provide funding to various other industries. In addition to these federal sources, there are provincial and local sources of funding. The Government of Ontario has created several funds to support clean energy technology development and commercialization through Ontario Ministry of Research and Innovation (OMRI), Ontario Centres of Excellence (OCE), and Ontario Innovation Demonstration Fund (OIDF). Ontario Emerging Technologies Fund (OETF), and Ontario Power Authority’s Technology Demonstration Fund. The government of British Columbia (BC) has dedicated $25 million to the Innovative Clean Energy Fund to help bring near-commercial clean energy technologies to local and international markets. The government of Quebec has created Technoclimat, a green technologies demonstration program to support companies in the development and demonstration of technologies that reduce greenhouse gas emissions, and the Energy Innovation Assistance Program (PAIE) to fund clean energy research, experimentation, and product development activities performed in college or university research centres in Quebec.

Report – 2012-063 (RP-TEC) - 76 - March 29th , 2012
Figure 15 – Canadian Federal Funding Sources (as of 2012)
Source: Adapted from Natural Resources Canada
The funding sources and their mission statements are described below:
BDC – Business Development Bank of Canada. Mission is: “Help create and develop Canadian businesses through financing, venture capital and consulting services, with a focus on small and medium-sized enterprises (SMEs).”
CFI – Canadian Foundation for Innovation is an independent non-governmental organization that funds up to 40% of research infrastructure costs for both academic and industrial institutions. Infrastructure funded by CFI includes state-of-the-art equipment, laboratories, databases, specimens, scientific collections, computer hardware and software, communications linkages and buildings necessary to conduct leading-edge research.
CIDA – Canadian International Development Agency is funded by the Government of Canada to manage Canada’s support and resources effectively and accountably to achieve meaningful and sustainable results and engage in policy development in Canada and internationally. CIDA provided over $75 million in funds towards R&D focused on energy policy, generation, and transmission projects that contribute towards economic development in Canada and other developing and under-developed countries.
EcoEII – EcoEnergy Innovation Initiative is a new program funded by Government of Canada’s Economic Action Plan to support energy technology innovation research and development, and

Report – 2012-063 (RP-TEC) - 77 - March 29th , 2012
demonstration projects. EcoEII provides funding to projects focused on energy efficiency, unconventional oil and gas, clean energy and renewables, bioenergy, and electrification of transportation. The EcoEnergy Innovation Initiative is a new program that received $97 million in funding in the 2011 budget.
FCM – Federation of Canadian Municipalities represents the interests of municipalities on policy and program matters that fall within federal jurisdiction. It also invests in municipal green-energy and climate change related projects through its $3 billion Green Municipal Fund by establishing partnerships leveraging both public and private-sector funding to reach higher standards of air, water and soil quality, and climate protection.
IRAP – Industrial Research Assistance Program run by National Research Council (NRC) provides business advisory and financial assistance services for promoting the development and commercialization of technology of small- and medium-sized enterprises across Canada.
ISTP Canada – International Science and Technology Partnerships (ISTP) Canada – ISTP Canada was incorporated with the primary objective of strengthening Canada’s science and technology, business to business relations and ultimately overall economic, trade and political relations. It will provide networking opportunities and funding to support Canadian participation in collaborative research projects with counterparts globally starting with China and India. Emphasis is placed on research projects with the potential for commercial application.
NSERC – Natural Sciences and Engineering Research Council of Canada is an agency funded by the Federal Government of Canada that supports university students in their advanced studies, promotes and supports discovery research at universities, and fosters innovation by encouraging Canadian companies to participate and invest in postsecondary research projects.
SDTC – Sustainable Development Technology Canada is a not-for-profit foundation funded by the Government of Canada that partially finances and supports the development and demonstration of clean technologies which provide solutions to issues of climate change, clean air, water quality and soil, and which deliver economic, environmental and health benefits to Canadians.
These Public Research Institutions and Programs (PRIP) are structured and mandated to assume much higher risks associated with technology development and demonstration and initial market entry, in support of industrial growth. PRIP leverage the risks (along the research, development and demonstration stages of the technology innovation chain) by partnering with diverse stakeholders in the private and public sectors. PRIP thus fill a need left by University Technology Transfer Offices which are sometimes averse to taking technological and/or financial risks because they are not structured to deal with it.

Report – 2012-063 (RP-TEC) - 78 - March 29th , 2012
8.3 Canadian PV Technology Clusters With the growth of the Canadian and global PV industries, a number of entrepreneurial Canadian companies have pursued technological innovations in advanced PV modules, power electronics, building integrated PV, and manufacturing processes. All together these companies have raised over $117 million in funding from government programs, strategic investors, and venture capitalists. In many cases, they have created PV clusters by collaborating with universities and research institutes. Table 33 outlines companies conducting leading-edge research in Canada.
Natural Resources Canada’s CanmetENERGY plays an important role in the development of applied knowledge either directly or indirectly in the PV Innovation System. It is responsible for conducting PV R&D activities in Canada that facilitate the deployment of PV energy technologies throughout the country. The PV program coordinates national research projects, contributes to international committees on the establishment of PV standards, produces information that supports domestic capacity-building and organizes technical meetings and workshops to provide stakeholders with the necessary information to make informed decisions. Most research projects are carried out, on a cost-sharing basis, with industry, universities, research groups, quasi-public agencies, and other departments and governments. More specifically, CanmetENERGY chairs the Canadian sub-committee to the International Electrotechnical Commission (IEC) Technical Committee 82 (TC82) and coordinates Canadian development efforts in international standards on PV systems and components. Standards ensure the reliability and safety of PV systems adapted to Canadian climate and conditions, and they contribute to a global PV product conformity assessment, the reduction of non-tariff trade barriers, and the development of improved PV products at lower costs. Furthermore CanmetENERGY also coordinates Canada’s participation in the International Energy Agency Photovoltaic Power Systems Program (IEA PVPS) implementing agreement to support the market transformation in Canada to clean renewable energy technologies. The IEA PVPS is an effective way of linking science and policy objectives, as well as leveraging the global effort that is required to drive down the cost of solar PV technologies.
Finally, there are several PV innovation focused networks which have been formed with funding from the Natural Science and Engineering Research Council (NSERC), the Canadian Foundation for Innovation (CFI), Natural Resources (NRCan) and/or provincial sources. Such networks have brought together companies to use world class testing facilities to test their innovative products, partner with university professors to conduct research, and to engage with graduate students to
Key Takeaway 20. Several federal and provincial funding sources are available for PV manufacturers to access at each stage of product commercialization. Key sources include SDTC, NSERC, Ontario Innovation Demonstration Fund and Ontario Centres of Excellence.

Report – 2012-063 (RP-TEC) - 79 - March 29th , 2012
build a talent pool and retain highly skilled professionals in the region. Below are four such networks:
SUNLab – With $9.8 million in funding from the Ontario Research Fund Grant, SUNLab is Canada’s premier solar cell characterization research facility particularly for concentrated PV systems with the capability of testing cells with intensities greater than 1000 suns. Located at University of Ottawa and headed by Dr. Karin Hinzer, this facility has brought together industry partners including Cyrium Technologies Inc, Morgan Solar Inc, Menova Energy Inc, and Opel Solar Inc to form collaborations to conduct research on PV concentrator systems, multi-junction solar cells, thermal junctions, and novel nano-structures for PV modules.
PV Innovation Network – NSERC invested $5 million over 5 years to create the Photovoltaic Innovation Network (PV Network), currently directed by Dr. Rafael Kleiman at McMaster University, which brings together 100 researchers, industrial partners and government research institutes (CanmetENERGY and National Research Council Canada) to foster and accelerate research collaboration, and widespread adoption of photovoltaics as a renewable energy in Canada. The PV Network is currently developing a roadmap for PV cell technology through its Technology Transfer Committee, creating a summer school focused on specialized training for graduate students across Canada on leading-edge PV cell research, and also hosts a national scientific conference, Photovoltaics Canada, focused on PV cell innovations.
Center for Advanced Photovoltaic Devices and Systems (CAPDS) – Located at University of Waterloo and headed by Dr. Siva Sivoththaman, this is a 14,000 square foot PV research facility that enables synthesis of semiconductor base materials, nanotechnologies for PV, design and fabrication of advanced PV devices and modules, and testing and characterization of PV materials, devices, and systems. The facility is used by both start-up companies and other universities in Ontario. Research in this facility has led to significant research on modules using lower-purity silicon, and creation of “spectral-engineered” solar cells to take advantage of quantum effects by deploying nano-scale structures onto PV devices. Companies such as Canadian Solar Inc. and Photowatt Ontario have actively collaborated with CAPDS for novel cell module testing and characterization.
Smart Net-Zero Energy Buildings Research Network (SNEBRN) – NSERC, CMHC, and NRCan invested $6.25 million over 5 years to bring together 29 researchers from 15 universities, and over 15 companies and utilities to focus on building technology research with the eventual goal of developing technologies for net-zero buildings. Headed by Dr. Andreas Athienitis at Concordia University, the funds from this network are being used to develop a new large scale 2-storey solar simulator that allows testing and development of BIPV systems and advanced envelope assemblies under a broad range of simulated outdoor temperatures and solar radiation levels.

Report – 2012-063 (RP-TEC) - 80 - March 29th , 2012
Key Takeaway 21. Development of formal networks and state-of-the-art testing facilities through federal and provincial funding has increased company and university research collaboration.

Report – 2012-063 (RP-TEC) - 81 - March 29th , 2012
Table 33 – Canadian Companies and Their Key Innovations Grouped by Technology Clusters
Company Name and Location R & D Description Funding Partners University Partners CONCENTRATED PV (CPV)
Morgan Solar Toronto, Ontario
Developing a facility to manufacture Sun Simba CPV systems that utilize patented Light-Guide Solar Optic (LSO) technology resulting in reduced cost compared to competing CPV systems
$50 million raised to date from the following: Enbridge Inc. Frost Group LLC California Energy Commission (loan) Nypro Inc. Sustainable Development Technology
Canada(SDTC) Turnstone Capital Management LLC Iberdrola Group Ontario Innovation Demonstration Fund Ontario Centres for Excellence
Dr. Karin Hinzer (University of Ottawa)
Dr. Oliver Trescases (University of Toronto)
Cyrium Technologies Ottawa, Ontario
Developing a facility to manufacture Quantum Dot Enhanced Cells (QDEC) that utilize patented nanotechnology with a minimum efficiency of 38% (at solar insolation greater than 50 W/cm2 and 25°C). Standards development participation as part of the International Electrotechnical Commission (IEC) TC 82 WG7 on solar PV concentrators.
$20 million raised to date from the following: Business Development Canada (BDC)
Venture Fund Chrysalix Energy Venture Capital Panagea Venture Fund Querus Trust
Leveraged participation with Natural Resources Canada (NRCan) as part of the est. $1 million International Electrotechnical Commission (IEC) TC 82 on PV systems and components
Dr. Roberto Morandotti (Institut national de la recherche scientifique (INRS))
Dr. Vincent Aimez (Université de Sherbrooke)
Dr. Richard Ares (Université de Sherbrooke)
National Research Council Canada (NRC)
International Energy Agency’s (IEA) Innovation and Energy Technology Sector (IETS), CanmetENERGY PV Program

Report – 2012-063 (RP-TEC) - 82 - March 29th , 2012
Gestion TechnoCap Inc. SpaceWatts Division Varennes, Québec
Developed a cost-effective high-efficiency CPV system, SpaceWatt, that utilizes currently available material supply chain logistics. Currently planning to demonstrate a 35 kW system, and a 125 kW system in Bromont, Québec, and Varennes, Québec respectively.
$2.7 million raised to date from the following: SDTC Arch Aluminum & Glass Company Inc. Monast Inc. Institut de recherche Hydro- Québec Spire Semiconductor LLC Agence de l’efficacité énergétique du
Quebéc Richard Norman
Université de Sherbrooke
ORGANIC PV (OPV) St-Jean Petrochemical Inc. St-Jean-Sur-Richleau, Quebec
Partnering with Konarka Technologies Inc. to manufacture a unique polymer, Power Plastic, used for novel Organic PV (OPV) modules with efficiencies of 8% and costs less than $1 per watt
$5 million raised to date from the following: Konarka Technologies Inc. Sustainable Technology Development
Canada (SDTC) National Research Council Canada (NRC)
Dr. Mario LeClerc (Université Laval)
National Research Council Canada (NRC)
PV FEEDSTOCK ARISE Technologies Corp. Waterloo, Ontario
Developed a demonstration plant that produces silicon feedstock that can be fed into the ingot-making process to produce crystalline silicon ingots for solar cells. The approach also allows for recovery and reuse of waste silicon.
$19.7 million to date from the following: SDTC Ebner Gesellschaft M.B.H Topsil Semiconductor Materials A/S
University of Toronto University of Waterloo
6N Silicon / Silicor Materials Vaughan, Ontario
Developing a demonstration plant that will produce upgraded metallurgical silicon (UMG) with 99.9999% purity for the PV industry.
$5.5 million to date from the following: Ontario Innovation Demonstration Fund SDTC
none

Report – 2012-063 (RP-TEC) - 83 - March 29th , 2012
5N Plus Inc. Montreal, Quebec
Has developed a proprietary technology that results in high purity of Cadmium Telluride and Cadmium Sulfide. Developed process to recycle telluride. Participation to the International Energy Agency’s (IEA) Photovoltaic Power Systems (PVPS) research collaboration on PV Environmental, Health and Safety – Task 12
Self-funded Annual R&D budget of $800,000 - $1
million for PV Technologies and Processes
Leveraged participation with Natural Resources Canada (NRCan) as part of the $1.23 million International Energy Agency’s (IEA) Photovoltaic Power Systems (PVPS) budget
Innovation and Energy Technology Sector (IETS), CanmetENERGY PV Program
PV MODULES & BUILDING INTEGRATED PV (BIPV) Day4 Energy Inc. Burnaby, British Columbia
Developed a patented electrode platform that results in an advanced PV module manufacturing process that improves connections to and between PV cells resulting in higher cell efficiencies and lower module production costs. Participation to the International Energy Agency’s (IEA) Photovoltaic Power Systems (PVPS) research collaboration on very large scale PV power generation systems – Task 8 Standard development participation as part of the International Electrotechnical Commission (IEC) TC 82 WG7 on solar PV concentrators.
Self-funded; annual R&D budget of $3 - $3.5 million for PV Technologies and Processes
$500,000 from National Research Council’s Industrial Research Assistance Program (IRAP) (loan)
Leveraged participation with Natural Resources Canada (NRCan) as part of the $1.23 million International Energy Agency’s (IEA) Photovoltaic Power Systems (PVPS) budget Leveraged participation with Natural Resources Canada (NRCan) as part of the est. $1 million International Electrotechnical Commission (IEC) TC 82 on PV systems and components
Dr. Mario Beaudoin (University of British Columbia)
Dr. Stephen O’Leary (University of British Columbia)
Dr. Alexandre Brolo (University of Victoria
Li Yang (Simon Fraser University)
British Columbia Institute of Technology (BCIT)
Capilano University Innovation and Energy
Technology Sector (IETS), CanmetENERGY PV Program

Report – 2012-063 (RP-TEC) - 84 - March 29th , 2012
Developed a patented tool, ecoTest Probe, for characterization of printed solar cells with and without printed bus bars.
Self-funded Dr. Mario Beaudoin (University of British Columbia)
Canadian Solar Kitchener, Ontario
Has dedicated BIPV modules which use double low iron tempered glass with solar cells laminated in between. These modules have power outputs of 55 – 115 W/m2 depending on cell spacing. Have been doing R&D on BIPV in Canada. Standard development participation as part of the International Electrotechnical Commission (IEC) TC 82 WG2 on solar PV modules.
Self-funded Have also invested in MSR Innovations
Inc. Leveraged participation with Natural Resources Canada (NRCan) as part of the est. $1 million International Electrotechnical Commission (IEC) TC 82 on PV systems and components
Participating in OCE’s Collaborative Research Program
Dr. Siva Sivoththaman (University of Waterloo)
Innovation and Energy Technology Sector (IETS), CanmetENERGY PV Program
Alouette Homes (acquired by Bonneville Homes in 2012) St-Alphonse-de-Granby, Québec Régulvar Laval, Québec
Commercialized a building integrated PV/thermal roof and demonstrated the EcoTerra House, the first net-zero home in Canada that is 2600 sq. ft, and consumes less than 10% of a similar sized standard house.
$640,000 from the following: NRCan’s Technology Early Action
Measure (TEAM) Canadian Mortgage and Housing
Corporation (CMHC) Hydro Québec
Dr. Andreas Athienitis (Concordia University)
Innovation and Energy Technology Sector (IETS), CanmetENERGY PV Program
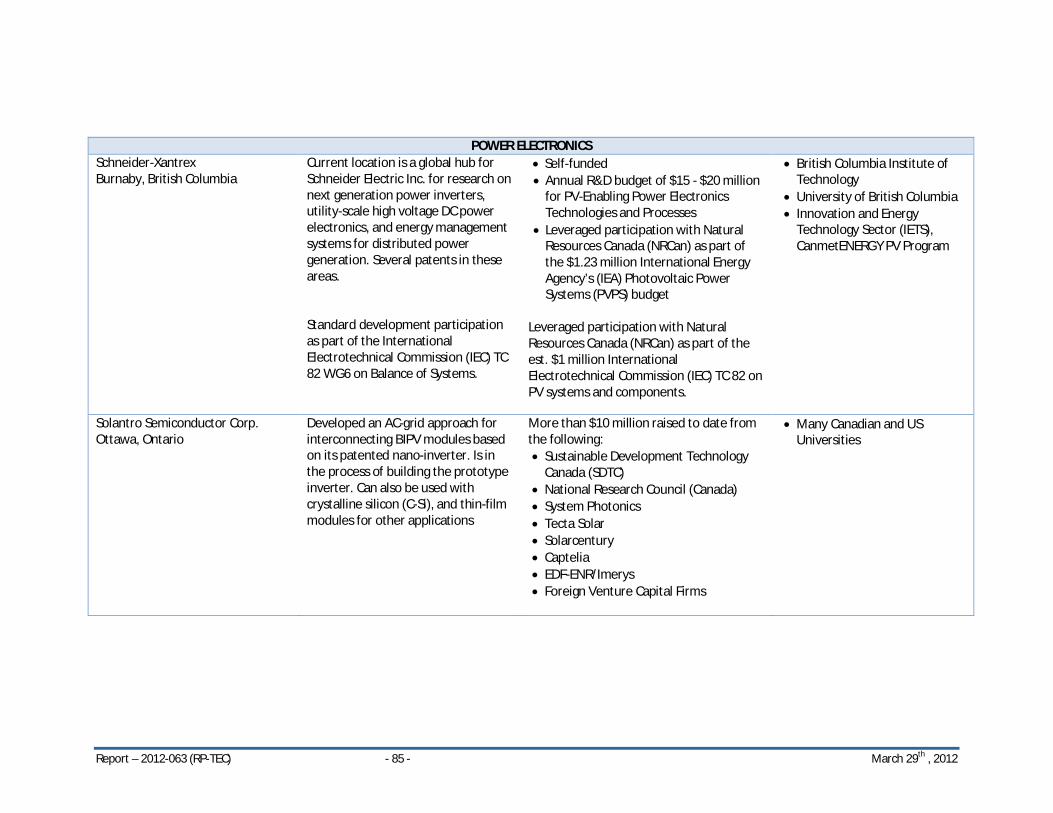
Report – 2012-063 (RP-TEC) - 85 - March 29th , 2012
POWER ELECTRONICS
Schneider-Xantrex Burnaby, British Columbia
Current location is a global hub for Schneider Electric Inc. for research on next generation power inverters, utility-scale high voltage DC power electronics, and energy management systems for distributed power generation. Several patents in these areas. Standard development participation as part of the International Electrotechnical Commission (IEC) TC 82 WG6 on Balance of Systems.
Self-funded Annual R&D budget of $15 - $20 million
for PV-Enabling Power Electronics Technologies and Processes
Leveraged participation with Natural Resources Canada (NRCan) as part of the $1.23 million International Energy Agency’s (IEA) Photovoltaic Power Systems (PVPS) budget
Leveraged participation with Natural Resources Canada (NRCan) as part of the est. $1 million International Electrotechnical Commission (IEC) TC 82 on PV systems and components.
British Columbia Institute of Technology
University of British Columbia Innovation and Energy
Technology Sector (IETS), CanmetENERGY PV Program
Solantro Semiconductor Corp. Ottawa, Ontario
Developed an AC-grid approach for interconnecting BIPV modules based on its patented nano-inverter. Is in the process of building the prototype inverter. Can also be used with crystalline silicon (C-Si), and thin-film modules for other applications
More than $10 million raised to date from the following: Sustainable Development Technology
Canada (SDTC) National Research Council (Canada) System Photonics Tecta Solar Solarcentury Captelia EDF-ENR/Imerys Foreign Venture Capital Firms
Many Canadian and US Universities

Report – 2012-063 (RP-TEC) - 86 - March 29th , 2012
SPARQ Systems Inc. Kingston, Ontario
Demonstrating a microinverter that uses advanced technological and software-based solutions to produce more AC power from PV panels for longer periods under lower light and partial shadowing conditions.
$600,000 raised to date from the following: Ontario Centers for Excellence (OCE) Canadian Consortium for Research (CCR)
Dr. Praveen Jain (Queens University & CEO of SPARQ Systems Inc.)
MOUNTING SYSTEMS MSR Innovations Inc. Burnaby, British Columbia
Developed a unique modular polymer roofing tile, SolTrak, containing an integral solar-electric panel mounted on custom extruded tracks to reduce BIPV system installation time and costs.
$1.15 million raised to date from the following: SDTC Century Group Lands Corp. Canadian Solar Inc. EMS Grivory (Chemie) Advantage Tool & Machine
None
SOLAR APPLICATIONS Carmanah Technologies Corp. Victoria, British Columbia
Developed self-contained PV-based lighting system for public lighting applications in streets and parks. Also provided PV systems for Dr. David Suzuki Public School (Windsor, Ontario), Canada’s first LEED Platinum school.
Self-funded Annual R&D budget of $2 million for PV-
Enabling Power Electronics $466,000 from SDTC $500,000 from Technology Early Action
Measure (TEAM) co-chaired by NRCan, Industry Canada (IC), and Environment Canada (EC)
$400,000 for grid-tie PV system from Government of Ontario’s Green Schools Initiative
Dr. Reuven Gordon (University of Victoria)
British Columbia Institute of Technology
Key Takeaway 22. Key innovative PV companies in Canada have raised more than $95 million in government and venture capital funding. In addition, private companies are dedicating more than $20 million annually for PV R&D in Canada.

Report – 2012-063 (RP-TEC) - 87 - March 29th , 2012
8.4 Key Companies and Competitors in Each Technology Cluster
While Canadian companies are well recognized for their innovative products, several companies exist as competitors in Canada, and in international markets (primarily in Germany and United States). Table 34 outlines the Canadian companies with significant PV-related innovation in Canada and the local and global competitors they face.
Table 34 – Key Competitors for PV Companies that Innovate in Canada
Company Name and Location
Canadian Competitors Global Competitors
CONCENTRATED PV (CPV) Morgan Solar Toronto, Ontario
Opel Solar Inc. Amonix Inc. SolFocus Inc Soitec Semprius Inc.
Cyrium Technologies Ottawa, Ontario
Menova Energy Inc. Opel Solar Inc.
United Solar Ovonic LLC Spectrolab Helios Solar LLC
ORGANIC PV (OPV) St-Jean Petrochemical Inc. St-Jean-Sur-Richleau, Quebec
None Konarka Technologies Inc. Heliatek GmBH
PV FEEDSTOCK 6N Silicon / Silicor Materials Vaughan, Ontario
Timminco Ltd. Dow Corning Corp.
5N Plus Inc. Montreal, Quebec
Redlen Technologies
None
PV MODULES & BUILDING INTEGRATED PV (BIPV) Day4 Energy Inc. Burnaby, British Columbia
Canadian Solar Inc.
Schott Solar AG Bosch Solar Energy AG Suntech Power Inc.
Canadian Solar Kitchener, Ontario
None First Solar Inc. Suntech Power Inc. SolarWorld GmBH
POWER ELECTRONICS Schneider-Xantrex Burnaby, British Columbia
Satcon Technology Corp. Power-One Inc. SMA America LLC Siemens AG ABB Inc.
Solantro Semiconductor Corp. Ottawa, Ontario
SPARQ Systems Inc. SMTC
STMicroelectronics Inc. National Semiconductor (Texas
Instruments Inc.) SPARQ Systems Inc. Kingston, Ontario
Solantro Semiconductor Corp. SMTC
Enphase Inc. Enecsys Ltd.

Report – 2012-063 (RP-TEC) - 88 - March 29th , 2012
Power-One Inc. MOUNTING SYSTEMS
MSR Innovations Inc. Burnaby, British Columbia
Cosma International Inc. UniRac (Hilti Group) UniStrut (Atkore Intl) DEGERenergie GmBH
8.5 Global PV Innovations Worldwide public expenditures for PV research and development have substantially increased over the past decade. According to data collected by International Energy Agency (IEA), public R&D efforts (including pilot and demonstration projects) have increased globally to more than US$500 million since 2007. While there is continued research in inverters, and balance of system components, the majority of the research (over 75% of R&D funds, or US$375 million) is focused on cells and PV modules.
Leading institutions include the University of New South Wales (UNSW) in Australia, Sandia National Laboratories in the US, the Fraunhofer Institute for Solar Energy Systems (ISE) in Germany, the Energy Research Centre (ECN) of the Netherlands, and national and international organizations like Japan’s New Energy and Industrial Development Technology Association (NEDO), the European Commission in Brussels, Belgium, the National Renewable Energy Laboratory (NREL) in the US and the Netherlands Agency for Energy and the Environment (NOVEM).
In addition, there are numerous private companies that conduct research. Below is a summary of the some of the research and technological innovations going on in the area of modules, power electronics and balance of system (BOS) and BIPV.
8.5.1 Modules
Figure 16 outlines the current status of PV module technologies globally in terms of cell efficiency. Cell efficiency for both conventional crystalline silicon technology and thin film technologies is a prime area of focus in current R&D, as is reducing manufacturing cost. Extensive research on these areas outside Canada is being conducted by companies and government organizations in Germany, United States, and Japan. Table 35 outlines key technological innovations for PV modules.
Key Takeaway 23. Globally, more than US$375 million is spent per year on cells and PV module R&D alone.

Report – 2012-063 (RP-TEC) - 89 - March 29th , 2012
Table 35 – Key Global Innovations in PV Modules
Company / Institution Name and Location
Key Innovation(s)
PV MODULE MANUFACTURING (PVMM) Sunsonix Creative Cleaning California, United States
Development of an advanced cleaning technology that removes interfacial transition metals from PV junctions resulting in increased silicon-based PV cell efficiency
DuPont Inc. Delaware, United States
Development of a Teflon film as a glass substitute in the lamination process to produce lighter flexible PV systems.
Napra Company Ltd, and Advanced Industrial Science and Technology Institute (AIST) Tokyo, Japan
Development of copper paste as a substitute for silver paste based on research funded by AIST to enable low-cost print manufacturing of electrodes and wiring for crystalline silicon solar cells.
SILICON FEEDSTOCK JYT Corp. Beijing, China
Created 450 and 600 kg polycrystalline furnaces, improving productivity of wafer formation, a bottleneck in PV production.
GT Advanced Technologies New Hampshire, United States
Successfully produced polysilicon growing furnaces for sale, breaking a long standing poly-silicon cartel, and reducing prices significantly.
CRYSTALLINE SILICON MODULES SunPower Inc. Oregon, United States Suntech Inc. Jiangsu, China
Developed and are optimizing Back Contact (BC) cell modules that increase cell efficiency.
Sanyo Inc. Osaka, Japan
While previously developed Heterojunction with Intrinsic Thin Layer (HIT) cells and holds patent to it, it is due to expire soon thereby resulting in a number of variants or augmentation of standard cells resulting in lower technology costs.
JA Solar Holdings Co. Ltd. Shanghai, China
Uses Innovolight’s Secium nanoparticle ink to develop a novel selective emitter. While there are ~ 10 other types of selective emitter designs worldwide, this design results in greatly increased cell efficiency.
THIN FILM CELL AND MODULE EFFICIENCIES Miasolé California, United States
Achievement of 17.3% champion device efficiency, and 14% commercial efficiency for a CIGS vacuum-based process, thereby potentially reducing costs for PV modules compared to current crystalline silicon modules.
Nanosolar Inc. California, United States
17.1% aperture efficiency through a printed CIGS process
Solar Frontier K. K. Tokyo, Japan
17.8% efficiency on a 30x30 cm substrate.
First Solar Inc. Arizona, United States
Achieved 14.4% best-of-module efficiency and 17.3% in the laboratory @ 1 cm2. ORGANIC PV MODULES
Fraunhofer Institute of Solar Energy (ISE) Freiburg im Breisgau, Germany
Achieved the highest fill factor of 64% for flexible organic solar cell modules, efficiencies of 26.4% at 1,000 W/m2 and 25°C for GaAs cells, and achieved 19.6% silicon PV cell efficiency for PVs with printed front side contacts and aluminum oxide surface passivation on boron-doped emitters.

Report – 2012-063 (RP-TEC) - 90 - March 29th , 2012
Figure 16 – Global PV Module Technology Overview and Efficiencies Reached
Source: National Renewable Energy Laboratory (NREL)

Report – 2012-063 (RP-TEC) - 91 - March 29th , 2012
8.5.2 Power Electronics & Balance of Systems Table 36 outlines the key technological innovations in this area:
Table 36 – Key Global Innovations and Programs in Power Electronics, and Balance of Systems for PV Systems
Company / Institution Name and Location
Key Innovation(s)
TRACKING SYSTEMS Fraunhofer Institute of Solar Energy (ISE) Freiburg im Breisgau, Germany Sandia National Laboratories Washington DC, United States
Implementation of alternative module architectures, and algorithms for cell-level Maximum Power Point Tracking (MPPT) with a string-level converter in order to mitigate issues such as shunting.
POWER CONVERSION DEVICES Carnegie Mellon University Pennsylvania, United States
Development of a new nanoscale magnetic material that will reduce the size, weight, and cost of utility-scale PV solar power conversion systems that connect directly to the grid.
Ideal Power Converters Inc. Texas, United States
Development of a sub-100 lb 100 kW that significantly reduce the manufacturing, shipping, and installation costs of inverters when compared to traditional 100 kW inverters that weight more than 2,000 lbs.
Satcon Technology Corp. Massachusetts, United States
Development of a lightweight power conversion device that is capable of taking utility-scale solar power and outputting it directly into the electric utility grid at distribution voltage levels, thereby eliminating the need for large transformers.
EnecSys Inc. Cambridge, United Kingdom Power-One Inc, Enphase Energy Inc, and SMA America LLC. California, United States
Development, implementation, and commercialization of micro-inverters.
BALANCE OF SYSTEMS Petra Solar Inc. New Jersey, United States University of Central Florida Florida, United States
Development of a solar power management platform in collaboration with 15 other utilities to address multi-layer control and communication architecture that can be monitored and controlled by an offsite utility distribution system operator. This goal is achieved by using a modular and scalable inverter power architecture for large PV systems that can be remotely controlled and optimized.
DOE Creation of the Solar Energy Grid Integration Systems (SEGIS) program that focuses on advanced systems and technologies that enable the electrical power grids to handle large amounts of PV electricity.
Key Takeaway 24. The European Commission, US Department of Energy, and large inverter manufacturers are major funding sources for R&D on power electronics, and balance of systems.

Report – 2012-063 (RP-TEC) - 92 - March 29th , 2012
8.5.3 BIPV Systems
In May 2010, the European Parliament and the European Council adopted an Energy Performance of Buildings Directive (EPBD) (2010/31/EU) that implies that from the year 2020 onwards all new buildings will have to be nearly net-zero energy buildings and acquire a significant share of their energy requirements from renewable sources. This has spurned significant research in building energy efficient technologies, and BIPV systems. Several demonstration projects incorporating BIPV systems in net-zero energy buildings have been completed in United States, Germany, and other countries. Table 37 outlines the key global technological innovations in this area.
Table 37 – Key Global BIPV Innovations and Programs
Company / Institution Name and Location
Key Innovation(s)
Dow Chemical Inc. Michigan, United States United States Department of Energy (DOE)
Commercialization of Dow Powerhouse ™ solar shingles by Dow Chemical Inc. which incorporate high-efficiency thin-film CIGS cells as part of the shingles to be used as roofing material for buildings that incorporate BIPV systems. The technology was commercialized using US$20 million funding received from DOE.
Owens Corning Inc. Minnesota, United States Solexel Inc. California, United States DOE
Initiated research on BIPV systems using US$13 million funding received from DOE’s SunShot Initiative using novel roofing and glass materials with ultra-thin crystalline silicon technology.
European Commission Brussels, Belgium
Through its Energy-Efficient Buildings European Initiative has allocated 10.7 million Euros towards developing next generation BIPV facades for high-rise buildings in order to meet European Union’s (EU) goal of mandating all new construction buildings to be net-zero certified by 2020.
Karlsruhe Institute of Technology Karlsruhe, Germany
A methodology is being currently developed to evaluate the economic viability based on the total cost of ownership (TCO) of BIPV systems while taking into consideration the added benefits/savings associated with BIPV systems due to lower operating costs of the building.
Key Takeaway 25. A legislative push, particularly in Europe, for new construction to be net-zero (or near net-zero) energy buildings in 2020 and beyond is the key driver for BIPV systems research.
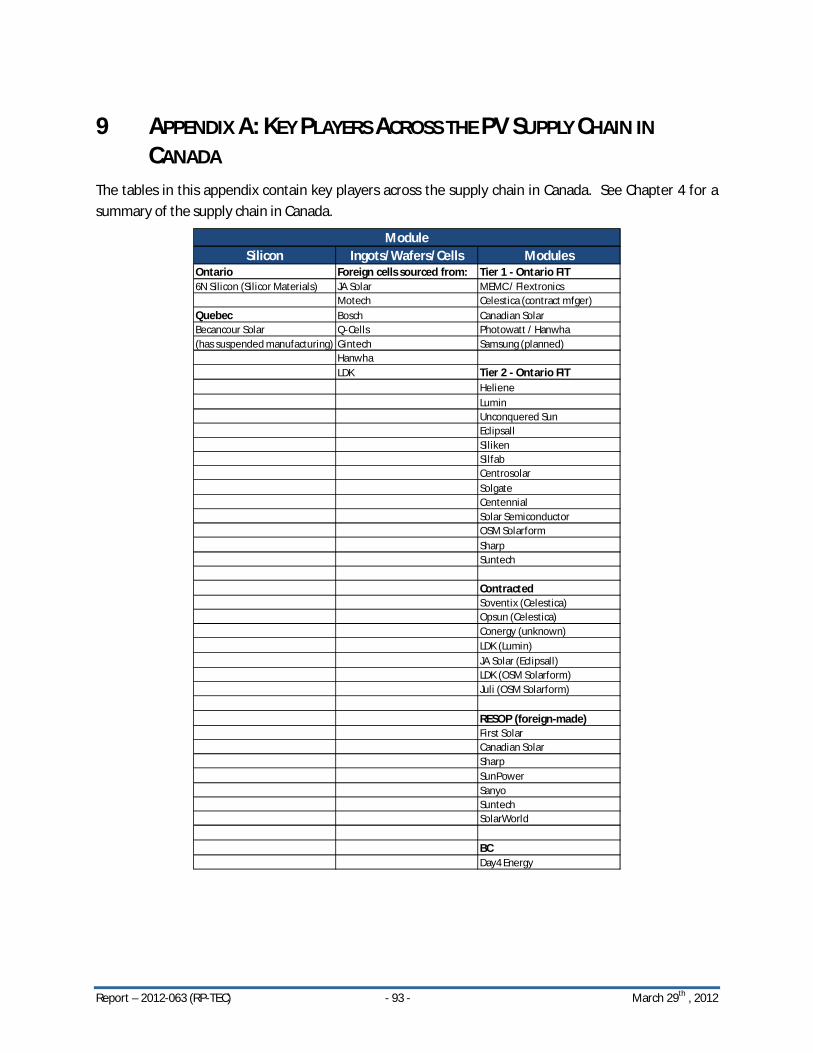
Report – 2012-063 (RP-TEC) - 93 - March 29th , 2012
9 APPENDIX A: KEY PLAYERS ACROSS THE PV SUPPLY CHAIN IN CANADA
The tables in this appendix contain key players across the supply chain in Canada. See Chapter 4 for a summary of the supply chain in Canada.
Silicon Ingots/Wafers/Cells ModulesOntario Foreign cells sourced from: Tier 1 - Ontario FIT6N Silicon (Silicor Materials) JA Solar MEMC / Flextronics
Motech Celestica (contract mfger)Quebec Bosch Canadian SolarBecancour Solar Q-Cells Photowatt / Hanwha(has suspended manufacturing) Gintech Samsung (planned)
HanwhaLDK Tier 2 - Ontario FIT
HelieneLuminUnconquered SunEclipsallSilikenSilfabCentrosolarSolgateCentennialSolar SemiconductorOSM SolarformSharpSuntech
ContractedSoventix (Celestica)Opsun (Celestica)Conergy (unknown)LDK (Lumin)JA Solar (Eclipsall)LDK (OSM Solarform)Juli (OSM Solarform)
RESOP (foreign-made)First SolarCanadian SolarSharpSunPowerSanyoSuntechSolarWorld
BCDay4 Energy
Module

Report – 2012-063 (RP-TEC) - 94 - March 29th , 2012
Inverter Racking - OEM Racking - Contract Mfgs Wire / CableTier 1 - Ontario FIT Ground Mount Steel Racking / Tracking componentsEatonAdvanced Energy Hilti / UniRac (contracted) Samco Hammond ManufacturingSchneider Northern States Metals (Solar FlexRack) (contracted)Commercial Roll Form Products Schneider ElectricKACO Cosma Power Systems/Magna (contracted)Cosma (Magna) Lapp CanadaSMA / Samsung (Celestica) Schletter (semi-contracted) Cooke and DenisonSatcon (negotiating mfg) Habdank (contracted) DomCastPower One (SAE Power) Unistrut (contracted) CargowallEmerson (Sanmina-SCI, Ottawa) Steel Tree Structures
Espe SunParc (contracted) Aluminum Racking / Tracking componentsTier 2 - Ontario FIT SDF (contracted) Sapa (alliance with Samco)Fronius Mounting Systems, Inc. (contracted)ExtrudexMagnetek Atlas Tube (JMC Steel) SpectraSunGrow AlmagSustainable Energy Technologies Can-ArtCelestica (contract mfger)SAE Power (contract mfger) TrackersSiemens GreenWorks Solar Power
Magna ClosuresDeger Energie (contracted)
Contracted Sentinel Solar Corp.Solectria (SunRise Power) Sun-Link Solar TrackerSanterno (Sanmina-SCI, Ottawa) Upper Canada Solar GenerationSolarEdge (Flextronics) Sonnen Systems (Kirchner) (contracted)
Mecasolar (contracted)Lorentz (contracted)Array Technologies Inc. (contracted)
DC/DC OptimizersTigo Energy RooftopSolarEdge KB Racking (contracted)
Polar Racking (contracted)Microinverters (contract mfg)Applied Energy Techonologies (contracted)Sparq (Sanmina-SCI, Ottawa) Sunlink Solar (contracted)Enphase (Flextronics) S-5Enecsys (SMTC, Markham) Conergy (contracted)
Cooper B Line (contracted)BC Opsun (contracted)Analytic Systems SunEdison (contracted)
Hilti / UniRac (contracted)
BIPVCentennial (building façade)Canadian Solar
Balance of System Components

Report – 2012-063 (RP-TEC) - 95 - March 29th , 2012
Distributor Project Developers O&MConergy Ground Mount - w FIT ContractsGround Mount MicroFIT Ground MountCentrosolar Recurrent White Construction Company (home base) Q-CellsMatrix Energy SkyPower Black & McDonald Green Sun Rising (Windsor) MEMC / SunEdisonHoneybee Solar Northland MEMC / SunEdison iSolara Solar (Nepean) Advanced EnergyGraybar MEMC / SunEdison EnXco (EDF) Sunrise Solar (Toronto) SchneiderRexel Canadian Solar PCL Apollo Solar (Mississauga) First SolarWestburne Electric Penn Energy Renewables Canadian Solar Generation Solar (Peterborough)Johnson ControlsSchneider Electric Perpetual Energy M Sullivan & Son SolSmart (Toronto) Canadian SolarAS Solar North America Refergy AMEC Pioneer Solar (Toronto/Ottawa)Carmanah Technologies Solray Energy Q-Cells Dynamic Solar Tech (Stouffville)
IPR GDF Suez Ellis Don Maki Bay Solar (Thunder Bay)Algonquin Fritz Construction Services Estill Energy (Guelph) Commercial RooftopConex North Key Construction Evergreen Power Limited (Lindsay)Bondfield ConstructionEnergy Farming Ontario Aecon Flannagan & Son (Buckhorn) Johnson ControlsUpper Canada Solar Generation Jazz Solar (Ottawa) Many other EPCsSolar Spirit Local Trades SolarLogic (Thunder Bay)Silvercreek Solar Park Electrical Down to Earth Solar (Toronto)Hugh Thorne Civil Highland Electrical (Collingwood)Balsam Lake Green Energy Geotechnical Icarus Solar (Concord)Hybridyne Power Certified Solar (Windsor)Vinefresh Produce Limited Commercial Rooftop Enviro-Energy Technologies (Markham)Samsung NorthGrid Solar Arcadian Projects (Kitchener)Saturn GSL Green Grid Solutions (Waterloo)
RESCo + Many, many othersSolera (Phantom)
Ground Mount - RESOP AriseFirst Solar Rumble Energy BIPVEDF HES Dynamic Solar TechGE SolarGStarwood AGT Solar Off-grid systemsNextEra Valard CarmanahInnergex GEMCO Alpha TechnologiesGreen Soldiers Johnson Controls Evergreen Power LimitedCapstone (formerly Macquarie) AmerescoPod Generating ABB
Rodan EnergyOttawa Solar Power
Rooftop PanasonicOzz Solar Alpha TechnologiesAmeresco Canadian SolarSolar Power Network CarmanahOYA Solar Dial One Wolfedale ElectricBlackstone Grasshopper SolarFresh from the Sun Bondfield ConstructionPotentia NaylorFovere PQISolPowered AvacosCarbonFree Technology New Energy SystemsPowerStream SkyFire EnergyOshawa Power QPA SolarOmniwatt Orange SolarCarmanah Technologies BlackstoneEssex Energy Aecon3G Energy Corp.Rumble EnergyAmp SolarJohnson ControlsMoose PowerBright Power Group
MicroFITPure Energies
EPCDownstream

Report – 2012-063 (RP-TEC) - 96 - March 29th , 2012
Legal Permitting Business Consulting EngineeringTorys Stantec Navigant SAICBlakes Garrad Hassan Power Advisory HatchStikeman Elliott Golder Associates Ernst & Young Black & VeatchBLG Dillon SAIC OrtechMcMillan Hatch ClearSky Advisors E3 ConsultingOsler SAIC KPMG Garrad HassanDale & Lessman Genivar BridgePoint Group StantecBennett Jones Compass Renewable Energy DillonGowlings AMECMiller Thomson Public Relations MMM GroupMcCarthy Tetrault Sussex Strategy Group NavigantAird & Berlis National Public Relations Altus Group
SteenhofEnvironmental / Aboriginal Law Technical Morrison HershfieldWillms & Shier Pivotry Consulting Genivar
Advisors / Service Providers

Report – 2012-063 (RP-TEC) - 97 - March 29th , 2012
Equity Debt Debt/Equity Arrangers
Ground Mount - Ontario FIT ContractsGround Mount - FIT StonebridgeTransCanada Deutsche Bank JCM CapitalNorthland Rabobank Travelers CapitalStarwood (Samsung) MizuhoAlgonquin Bank of ChinaIPR GDF Suez Bank of Tokyo - MitsubishiMEMC / SunEdison Union Bank
ManulifeSunLifeCanadian banks
Ground Mount - RESOP Pension fundsEnbridgeGE RooftopCapstone (formerly Macquarie) DLL (Rabobank)StarwoodInnergex LeasingMEMC / SunEdison DLL (Rabobank)
microFITRooftop TD BankPotentia / Power Corp. Royal BankCarbonFree Technology / CCLLiberation Energy RESOPMann Engineering DexiaGreat Circle Solar West LBPowerStream Nord LBOshawa Power Caixa NovaHorizon Utilities Union Bank
KfWDeutsche BankBank of Tokyo - Mitsubishi
Financing Providers

Report – 2012-063 (RP-TEC) - 98 - March 29th , 2012
10 APPENDIX B: LEADING CANADIAN UNIVERSITY PV RESEARCHERS
10.1 Universities A survey of leading universities in Canada found that about 50 research laboratories employing 200-250 full-time equivalent researchers had active research programs in or closely related to a broad range of photovoltaic technologies. Table 38 outlines key technology researchers in Canada that have cumulatively acquired over $1.5 million in government research funding over the past year alone.
Table 38 – PV-Related University-Based Research Leaders in Canada
Professor University Research Description CRYSTALLINE SILICON (C-Si)
Dr. Rafael Kleiman & Dr. John Preston
McMaster University
Head the Laboratory for Advanced Photovoltaic Research, and the NSERC CREATE Program for Photovoltaics respectively. Developed a patent-pending method to develop high-efficiency silicon-based multi-junction solar cells that exceeded the world record cell performance for efficiency (greater than 20.4%) using a low-cost multi-crystalline substrate.
Dr. Siva Sivoththaman University of Waterloo
Heads the Centre for Advanced Photovoltaic Devices and Systems (CAPDS) and currently develops methods for fabrication of silicon nanopillars and nanowires from bulk crystals in order to develop high performance C-Si PV cells.
AMORPHOUS SILICON (A-Si) Dr. Nazir Kherani University of
Toronto Heads the Advanced Photovoltaics and Devices (APD) research group, and has developed a novel silicon deposition technique, DC Saddle Field (DCSF) Plasma Enhanced Chemical Vapour Deposition System (PECVDS) that can be used to obtain better surface passivation of the A-Si surface thereby increasing PV cell lifespan.
III-V CONCENTRATORS Dr. Karin Hinzer University of Ottawa Founded the Solar Cells and Nanostructured
Devices Laboratory (SUNLab) that specializes in modeling and characterization of high-efficiency solar cells. Currently the lab has been characterizing the performance of quantum-dot, AlGaAs, GaAs, and InGaP multi-junction solar cells to determine the next generation CPV modules.

Report – 2012-063 (RP-TEC) - 99 - March 29th , 2012
DYE SENSITIZED SOLAR CELL (DSSC) MODULES
Dr. Curtis Berlinguette University of Calgary Directs the Center for Advanced Solar Materials and has developed robust dyes that are more efficient at harvesting low-energy photons compared to current DSSCs thereby leading to cell efficiencies close to 12%.
Dr. Benoit Marsan UQAM Discovered a new disulfide-thiolate redox couple that is an iodide-free redox electrolyte to be used in DSSCs in order to prevent corrosion of electrical contacts, and reduce light absorption losses, thereby leading to a scalable DSSC with efficiencies of 6.4%.
ORGANIC POLYMER PV (OPV) MODULES Dr. Mario LeClerc Université Laval Current research focuses on the design, synthesis,
and characterization of polycarbazole materials to be used in novel OPV. The research is in conjunction with St-Jean Petrochemicals Corp. and Konarka Technologies Inc. to develop a manufacturing process for OPVs using polycarbazole materials.
Dr. Jianping Lu National Research Council
Developed a new polymer to be used in inverted organic PV cells that resulted in a cell efficiency of 7.1%, the current record for the most efficient OPV.
PV NANOTECHNOLOGY Dr. Edward Sargent University of
Toronto Currently the Canada Research Chair in Nanotechnology and regarded as one of the world’s top young innovators in MIT’s Technology Review. Developed a low-cost efficient Colloidal Quantum Dot (CQD) PV device that can reach above 5% solar power conversion efficiency.
Dr. Jillian Buriak University of Alberta
Currently the Canada Research Chair in Inorganic and Nanoscale Materials. Her research focuses on using nanotechnology to improve the performance and reliability of inverted organic photovoltaic cells, and to develop sub-50 nanometer (nm) features on silicon-based integrated circuits for use in advanced PV systems.
INVERTER CONTROL Dr. Luis Lopez Concordia University Currently developing interconnection technologies
for grid-connected PV systems, and investigating approaches for maximizing the capacity factor while maintaining voltage regulation in isolated micro-grids.
Dr. Rajiv Varma University of Western Ontario
Heading Large-Scale Photovoltaic Power Integration in Transmission and Distribution Networks Project

Report – 2012-063 (RP-TEC) - 100 - March 29th , 2012
funded by OCE. Developed a novel approach to use of PV power plants as Static Synchronous Compensators (STATCOMs) at night thereby lowering wind energy enabling infrastructure costs.

Report – 2012-063 (RP-TEC) - 101 - March 29th , 2012