section 6 expansion of the digital economy and rapid
TRANSCRIPT

209
Section 6 Expansion of the digital economy and rapid progress in social implementation of innovative technologies for combating novel coronavirus disease (COVID-19) (Corona Tech) 1. Globalization and expansion of the digital economy (1) Rapid expansion of the digital economy in response to the COVID-19 pandemic
One global trend that has become clear during the COVID-19 pandemic is the acceleration of economic and social digitalization. This is an extension of the expansion of the digital economy in recent years. At a time when face-to-face communication is restricted and travel restrictions and social distancing are in place due to the pandemic, economic and social digitalization are proceeding further.
This situation has become apparent in various economic activities. Regarding consumption activity, although consumption has been subdued on the whole as people refrain from going out amid the COVID-19 pandemic, e-commerce trading has expanded in various regions. In China, while retail sales have recorded steep year-on-year declines since the beginning of 2020, internet sales of goods have continued to increase, registering a year-on-year increase of 8.6% in April. In the United States, retail sales declined by 16.4% from previous month, but online sales increased by 8.4%.
In short, as consumption activity using digital technology is making up for constraints on economic activity, the expansion of e-commerce trade has been prominent since March, when COVID-19 infections spread worldwide (Figure II-1-6-1). Figure II-1-6-1 Online retail sales growth(2020; year-on-year)
Notes: Online sales of brands that primarily sell in stores through apps, etc. Source: Emarsys, GoodData (prepared on May 18th, 2020).
North America
Europe
Asia-Pacific
Others
-50
0
50
100
150
200
250
Jan. 5
Jan. 12
Jan. 19
Jan. 26
Feb. 2
Feb. 9
Feb. 16
Feb. 23
Mar. 1
Mar. 8
Mar. 15
Mar. 22
Mar. 29
Apr. 5
Apr. 12
Apr. 19
Apr. 26
May. 3
May. 10
(%)

210
E-commerce trade using online malls provided by IT platform operators has been particularly brisk, with demand expanding for necessities like food and toilet paper. In the January-March quarter of 2020, Amazon increased sales amid the COVID-19 pandemic, recording 46.1 billion dollars in North American e-commerce sales, a 29% increase compared with the same quarter of the previous year, and 19.1 billion dollars in overseas sales, an 18% increase. JD.com, a Chinese e-commerce company, also registered a sales increase of 20.7% in the January-March quarter.
According to an analysis conducted by the WTO regarding e-commerce, trade and the pandemic,46 while demand for medical supplies, such as disinfectants and masks, daily necessities, such as toilet paper, and food expanded rapidly because of stockpiling by consumers, shortages of goods occurred because e-commerce trade also depends on supply chains. In addition to pointing out the presence of vulnerabilities like this, the WTO also mentioned the importance of considering expanding international cooperation in order to level the playing field for small and medium-size enterprises and micro enterprises by facilitating the cross-border movement of products and services and narrowing the digital divide.
The acceleration of digitalization due to the COVID-19 pandemic is not limited to e-commerce trade. The daily number of users of Facebook, including users of Instagram and WhatsApp, is increasing (Figure II-1-6-2), and the use of services provided by Microsoft and Google is also increasing due to shelter-in-place restrictions imposed all around the world. Figure II-1-6-2 Number of daily active users of Facebook
Notes: The term “DAUs” refers to “daily active users.” Source: Facebook.
46 “E-commerce, trade and the Covid-19 pandemic” (WTO, May 4th, 2020).
0
1
2
3
4
5
1,300
1,400
1,500
1,600
1,700
1,800
2018-Q2 2018-Q3 2018-Q4 2019-Q1 2019-Q2 2019-Q3 2019-Q4 2020-Q1
DAUs (left axis) % compared to the previous term (right axis)
(Million people) (%)

211
For Netflix, which distributes movies online, demand from consumers staying at home increased in the January-March quarter, when COVID-19 infections spread, resulting in an accelerated growth in the number of users. In the January-March quarter, the number of users increased by 16 million people compared with that in the previous quarter.
The shift of business activities to the online format is also being promoted. Telework, which refers to remote work from home has become popular, leading to an increase in the use of various online conferencing software programs. Schools are also using digital technology to provide education remotely. For Microsoft’s Teams video conferencing system, the number of users increased by as many as 12 million people during the one week from March 11, and the number of active users of the company’s Skype video phone system also increased rapidly. For Zoom, another provider of a video conferencing system, the number of active users increased by 100 million people during the 19 days from April 3rd.
For those services, there is a network effect, which refers to the cycle of an increase in online conferences, leading to an increase in the enrollment of users who have not previously used the services and further encouragement for other people to become users. As a result, the concentration of users for particular services is proceeding (Figure II-1-6-3). Figure II-1-6-3 Number of users/participants of online communication tool (Microsoft Teams and Zoom)
0
50
100
150
200
250
300
350
0
5
10
15
20
25
30
35
40
45
50
Apr
. 201
8M
ay. 2
018
Jun.
201
8Ju
l. 20
18A
ug. 2
018
Sep.
201
8O
ct. 2
018
Nov
. 201
8D
ec. 2
018
Jan.
201
9Fe
b. 2
019
Mar
. 201
9A
pr. 2
019
May
. 201
9Ju
n. 2
019
Jul.
2019
Aug
. 201
9Se
p. 2
019
Oct
. 201
9N
ov. 2
019
Dec
. 201
9Ja
n. 2
020
Feb.
202
0M
ar. 2
020
Apr
. 202
0
Mar. 11: 32 million users
Mar. 18: 44 million users
Million people
April 22: 300 million users
Apr. 3: 200 million
users
Million people
Microsoft Teams(Daily active users; left axis)
Zoom(Daily meeting participants, right axis)
212
(2) Expansion of digital trade Amid the trend of economic digitalization, digital trade has continued to grow worldwide. In this
context, the current status of digital trade will be examined. There is no universal definition of digital trade. OECD explains the concept of digital trade by
stating that, in principle, cross-border data transfer is the prerequisite and that e-commerce transactions among consumers, companies and governments that are related to trade in goods and services distributed electronically or physically are included.
According to the definition, digital trade includes not only internet-based purchases and sales of goods but also services provided through online platforms, such as online hotel reservation, ride sharing, and music streaming.
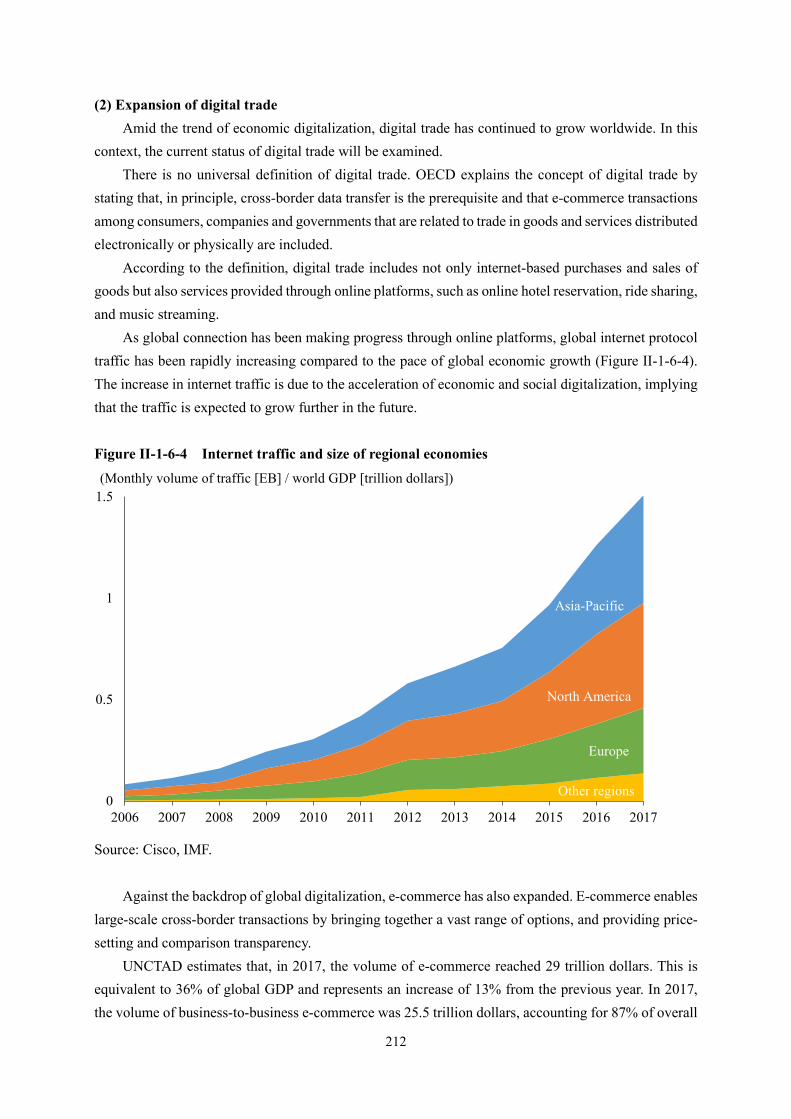
As global connection has been making progress through online platforms, global internet protocol traffic has been rapidly increasing compared to the pace of global economic growth (Figure II-1-6-4). The increase in internet traffic is due to the acceleration of economic and social digitalization, implying that the traffic is expected to grow further in the future. Figure II-1-6-4 Internet traffic and size of regional economies
Source: Cisco, IMF.
Against the backdrop of global digitalization, e-commerce has also expanded. E-commerce enables large-scale cross-border transactions by bringing together a vast range of options, and providing price-setting and comparison transparency.
UNCTAD estimates that, in 2017, the volume of e-commerce reached 29 trillion dollars. This is equivalent to 36% of global GDP and represents an increase of 13% from the previous year. In 2017, the volume of business-to-business e-commerce was 25.5 trillion dollars, accounting for 87% of overall
0
0.5
1
1.5
2006 2007 2008 2009 2010 2011 2012 2013 2014 2015 2016 2017
(Monthly volume of traffic [EB] / world GDP [trillion dollars])
Other regions
Europe
North America
Asia-Pacific

213
e-commerce, while the value of business-to-consumer e-commerce in the same year increased 22% from the previous year to 3.9 trillion dollars.
In terms of the value of business-to-consumer e-commerce sales, China, the United States and the United Kingdom were the top three countries. The value of cross-border business-to-consumer e-commerce in 2017 was estimated to be 412.0 billion dollars. This was equivalent to 11% of overall business-to-consumer sales and increased the share of 7% in 2015 (Table II-1-6-5).47 Table II-1-6-5 E-commerce sales (2017; UNCTAD estimates)
Ranking Country Cross-border
B2C sales ($ billion)
Share of e-commerce (%)
Share of B2C sales (%)
1 U.S. 102 6.6 13.5
2 China 79 3.5 7.5
3 U.K. 31 7.0 15.0
4 Japan 18 2.6 12.2
5 Germany 15 1.0 17.1
6 France 10 1.8 10.6
7 Canada 8 1.8 12.7
8 Italy 4 0.7 16.2
9 ROK 3 0.5 3.8
10 Netherlands 1 0.2 5.0
TOTAL 270 3.0 10.7
World 412 2.3 10.7
Source: UNCTAD.
Among the factors behind the expansion of the global e-commerce market is the diffusion of the internet and mobile phones. The emergence of the internet and mobile phones has caused a significant change in the people’s lives, where it has enabled them to communicate across borders and quickly gather information.
The diffusion of the internet and mobile phones has been rapid. In 2000, the mobile phone ownership rate was around one in five persons, but, in 2019, the global number of phones owned worldwide surpassed the global population size (Figure II-1-6-6). As a result of the growth of the populations of developing countries, those countries accounted for 80% of the global number of mobile phone users in 2019 (Figure II-1-6-7). One of the factors behind this is the progress in diffusion of mobile phones due to efforts to localize the functions and promote sales of low-priced models in accordance with local income levels, as Transsion, a Chinese company, is doing in Africa.
47 Digital Economy Report 2019 (UNCTAD).

214
Figure II-1-6-6 Number of mobile phone users and internet users worldwide (per 100 people)
Notes: Numbers for 2019 are estimates. Source: ITU World Telecommunication/ICT Indicators database. Figure II-1-6-7 Comparison of the number of mobile phone users between developing and developed countries (2000 and 2019)
Source: ITU.
In some cases, promoting businesses using such digital technology as mobile phone-based e-commerce may make it possible to be more profitable than conventional face-to-face businesses. Data on changes in sales by three major global companies (Taobao of the Alibaba group (Chinese e-commerce company), Walmart (U.S. supermarket operator), Adidas (German sports goods company)) show that Taobao has achieved growth by expanding its business at an amazing speed (Figure II-1-6-8).
108.0
53.6
0
20
40
60
80
100
2001 2003 2005 2007 2009 2011 2013 2015 2017 2019
Num
ber o
f use
rs p
er 1
00 p
eopl
e
Number of mobile phone users
Number of internet users
Developed countries:
470 million users
Developing countries:
250 million users
2000
Developed countries:
1.65 billion users
Developing countries: 6.66 billion users
2019

215
Figure II-1-6-8 Promoting businesses using digital technology (comparison of companies’ total sales)
Notes: Prepared by Ministry of Economy, Trade and Industry based on the World Development Report
2019 (World Bank). Numbers on Taobabo are the values of distribution transactions in the target fiscal years issued by Alibaba.
Source: Refinitiv; Numbers on Alibaba (Taobao) are excerpts from the annual report issued by Alibaba.
Means of online settlement, as the infrastructure that supports digital trade, have become diverse. Not only are credit cards and debit cards, but a diverse range of means of settlement have also become available thanks to the diffusion of FinTech, leading to the development of digital trade. (3) Growing presence of giant IT companies operating across national borders
One characteristic of the digital economy, which has been expanding in recent years, is the presence of a network effect. The network effect is observed when a higher number of users of a service leads to increasing the convenience of the service. For example, if more people become members of an SNS, users can communicate with more friends, which means that the value of the SNS increases.
The network effect can be divided into direct and indirect effects. The direct effect is observed when a higher number of people subscribing to a network leads to greater benefits for subscribers (e.g., the degree of satisfaction felt by people who post messages on SNS and followers). The indirect effect is observed when a product or service (e.g., hardware equipment) is closely related to complementary products or services (e.g., software programs or various services) and when an increase in the use of the product or service leads to the supply of a more diverse range of complementary products or services (e.g. advertisements attached to SNSs) in larger volume, bringing more convenience and greater benefits.
0
1000
2000
3000
4000
5000
6000
7000
8000
900019
8419
8619
8819
9019
9219
9419
9619
9820
0020
0220
0420
0620
0820
1020
1220
1420
1620
18
Walmart (estd. in 1969 in the U.S.)Adidas (estd. in 1949 in Germany)Taobao (estd. in 2003 in China)
(100 million dollars)

216
The network effect has created giant global IT companies through globalization as it works across national borders. The number of real users of Facebook expanded from 100 million in 2008 to more than 2 billion in 2019. The number of users is larger than the population of any country in the real world, which is an achievement that can be realized exactly because of globalization.
As a result, Facebook’s annual sales, which were 780 million dollars in 2009, expanded 72-fold to 55.8 billion dollars in 2018. The complementarity of the network effect is also considered to be one factor behind the many M&A deals that involved giant IT companies, such as Facebook’s acquisition of Instagram (Figure II-1-6-9). Figure II-1-6-9 Number of monthly users of giant IT companies
Source: BIS (2019).
Due to digitalization, the industrial structure is shifting to a layer model. The structures of conventional industries have generally been looked at from the viewpoint of a value chain model, but digitalization is promoting the shift to a layered model.
The value chain refers to a sequence of business processes, including planning, manufacturing and sales. Mostly, consumers’ only point of contact with the value chain is sales by a final player, so their choices are limited to the range of options provided by sellers. In short, the right to make decisions with respect to products rests with the supply side. In the case of automobiles, finished vehicle makers are responsible for planning, development and production, affiliated companies supply parts, and dealers sell vehicles. However, consumers’ choices are limited to the range of options provided by dealers.
Meanwhile, an industrial structure under a layer model, which is becoming commonplace due to digitalization, is formed as a layer stack (an assembly of layers) extending across business sectors. Layers that constitute the stack exist independently as products and services. Therefore, a layered structure potentially enables consumers to gain direct access to each layer. The key point of a layered
0.00
0.10
0.20
0.30
0.40
0.50
0.60
0.00
5.00
10.00
15.00
20.00
25.00
2003 2004 2005 2006 2007 2008 2009 2010 2011 2012 2013 2014 2015 2016 2017 2018
Alibaba Facebook Tencent Groupon (right axis) Kakao (right axis)
Number of monthly users of giant IT companies(100 million people)(100 million people)

217
structure is that final consumers can directly choose a mix of products and services from among options available from individual layers that constitute the stack.
The shift to a layered structure is defined in terms of the following three factors: (1) an increase in the number of layers, (2) an increase in the independence of each layer, and (3) increased flexibility in the combination of choices in individual layers. As a result of the shift, the range of options widens from consumers’ point of view. In the case of e-books, the choice rests with final consumers with respect to all of apps, hardware, and contents stores. Consumers can choose, purchase and use a mix of products and services from among options available from individual layers with relative flexibility. The progress in the shift to a layered stricture is increasing the influence of the platform operator in each layer.48 Figure II-1-6-10 Value chain model and layered mode of industrial structures
Source: Negoro T., S. Fujimaki, “Changing the Strategic Viewpoint to Adapt the Digitalization: From Value Chain Strategy to Layer Strategy” (Waseda Bulletin of International Management, No. 44, pp.145-162, 2013).
The shift in industrial structure to a layer model is not limited to IT industries. In value chain-based
conventional, mature industries, modularization and a shift to software products is proceeding in line with the increasing use of big data due to the evolution of IT. As a result, this shift is expected to accelerate.49
Globalization and digitalization are promoting competition and the concentration of market power among particular companies (market concentration) at the same time.
Globally active companies are likely to see their profit margins decline due to competition with foreign companies, while domestic companies may withdraw from the market or engage in M&As. The 1990s through the first half of the 2000s was a period of intensifying business competition due to
48 Negoro, T. and S. Fujimaki, “Changing the Strategic Viewpoint to Adapt the Digitalization: From Value
Chain Strategy to Layer Strategy” (Waseda bulletin of international management, NO. 44, pp.145-162, 2013).
49 Nakamura, M. and T. Negoro, “IT KA NIYORU JIDOUSHA SANGYOU NO REIYAA KOUZOUKA—JIDOUSHA SANGYOU NIOKERU MITTSU NO REIYAA SENRYAKU MODERU—" (Working Paper Series, No. 55, Research Institute of Information Technology and Management, Waseda University, 2016).
・・・・
Stage 1 Stage 2 Stage N
Finalconsumers
Rawmaterials/parts
Finalproducts/services
Cross-sectoral chains of value added =
value chains
Value chain model Layer model
Layer V
Layer IV
Layer III
Layer II
Layer I
Accumulation of layers making a system of products/services
Cross-sectoral layer stacks
(combination)
Finalconsumers
(in the case of e-books)
Contents
Contents stores
Browsing applications
Hardware/OS
Communication networks

218
globalization.50 However, in recent years, globalization has promoted market concentration more than it has global
competition. As companies have expanded into the global market, competitive companies have achieved business expansion. In other words, while many companies may withdraw from markets or scale down their business operations as a result of competition at home and abroad, successful domestic companies may expand into global markets. In that case, as a result of changes in their business scale or in the environment for competition with other companies, successful companies may turn into giant companies in their home markets.51
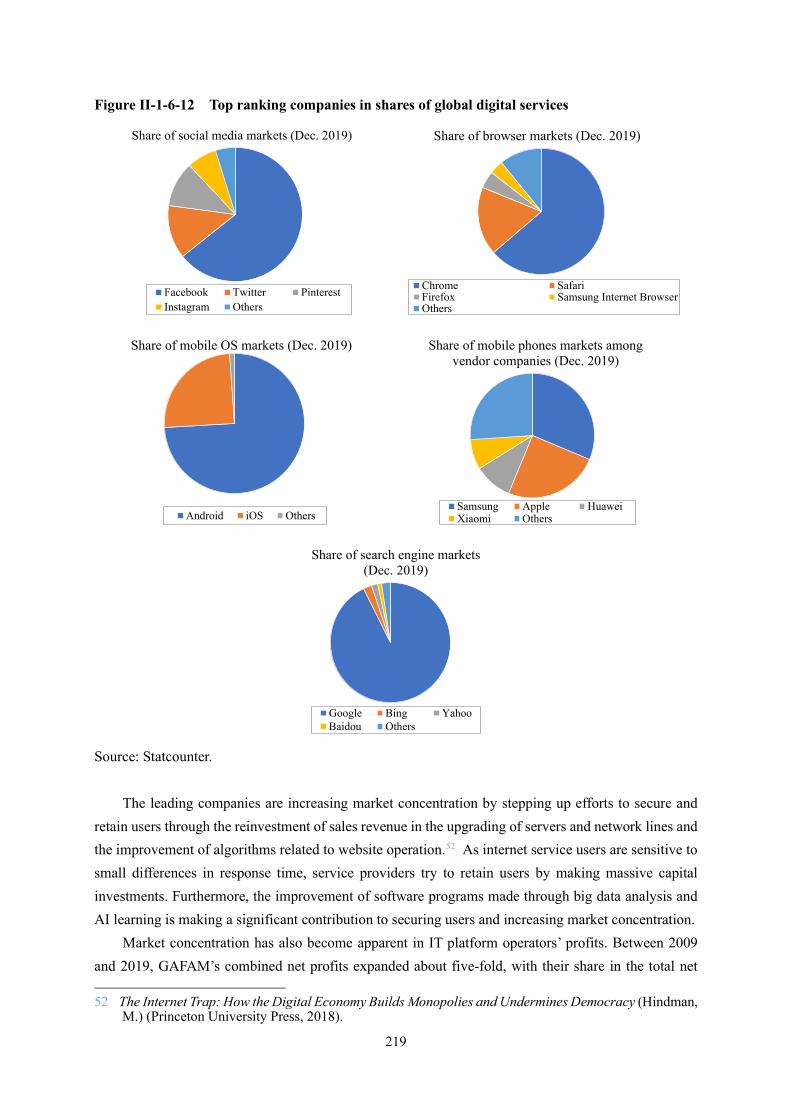
Market concentration has become apparent in the forms of an increase in the number of superstar companies and increases in markups in the United States. Other features of this phenomenon include an increase in the number of M&As and a decrease in the number of listed companies. GAFAM (an acronym for the five giant IT services companies, namely Google, Amazon, Facebook, Apple and Microsoft) frequently acquire technology companies with future potential (Table II-1-6-11). As a result, there is little chance of startups developing into giant technology companies, whereas the existing giant companies frequently start services in sectors outside their existing core businesses. In the digital services sector, market power tends to be concentrated among some particular companies in this way, as shown in Figure II-1-6-12. Table II-1-6-11 Number of M&A deals by giant IT companies
Google 240
Microsoft 226
IBM 181
Apple 114
Intel 98
Amazon 86
Facebook 84
Twitter 56
Source: Crunchbase (as of May 10th, 2020).
50 In the United States in the 1990s through the first half of the 2000s, markups decreased in industries
affected by competition with foreign companies (Feenstra and Weinstein (2017)). A markup refers to the amount by which the input cost is increased to arrive at the selling price. It is a profit margin indicator. In the United States, the share of imports increased and the markup for U.S. companies declined by around 0.5 percentage points between 1992 and 2005, and during this period, the benefits for U.S. consumers increased nearly 1% due to the decline in the markup and an increase in options.
51 Philippon (2019).
219
Figure II-1-6-12 Top ranking companies in shares of global digital services
Source: Statcounter.
The leading companies are increasing market concentration by stepping up efforts to secure and retain users through the reinvestment of sales revenue in the upgrading of servers and network lines and the improvement of algorithms related to website operation.52 As internet service users are sensitive to small differences in response time, service providers try to retain users by making massive capital investments. Furthermore, the improvement of software programs made through big data analysis and AI learning is making a significant contribution to securing users and increasing market concentration.
Market concentration has also become apparent in IT platform operators’ profits. Between 2009 and 2019, GAFAM’s combined net profits expanded about five-fold, with their share in the total net
52 The Internet Trap: How the Digital Economy Builds Monopolies and Undermines Democracy (Hindman,
M.) (Princeton University Press, 2018).
Share of social media markets (Dec. 2019)
Facebook Twitter PinterestInstagram Others
Share of browser markets (Dec. 2019)
Chrome SafariFirefox Samsung Internet BrowserOthers
Share of mobile OS markets (Dec. 2019)
Android iOS Others
Share of mobile phones markets among vendor companies (Dec. 2019)
Samsung Apple HuaweiXiaomi Others
Share of search engine markets (Dec. 2019)
Google Bing YahooBaidou Others
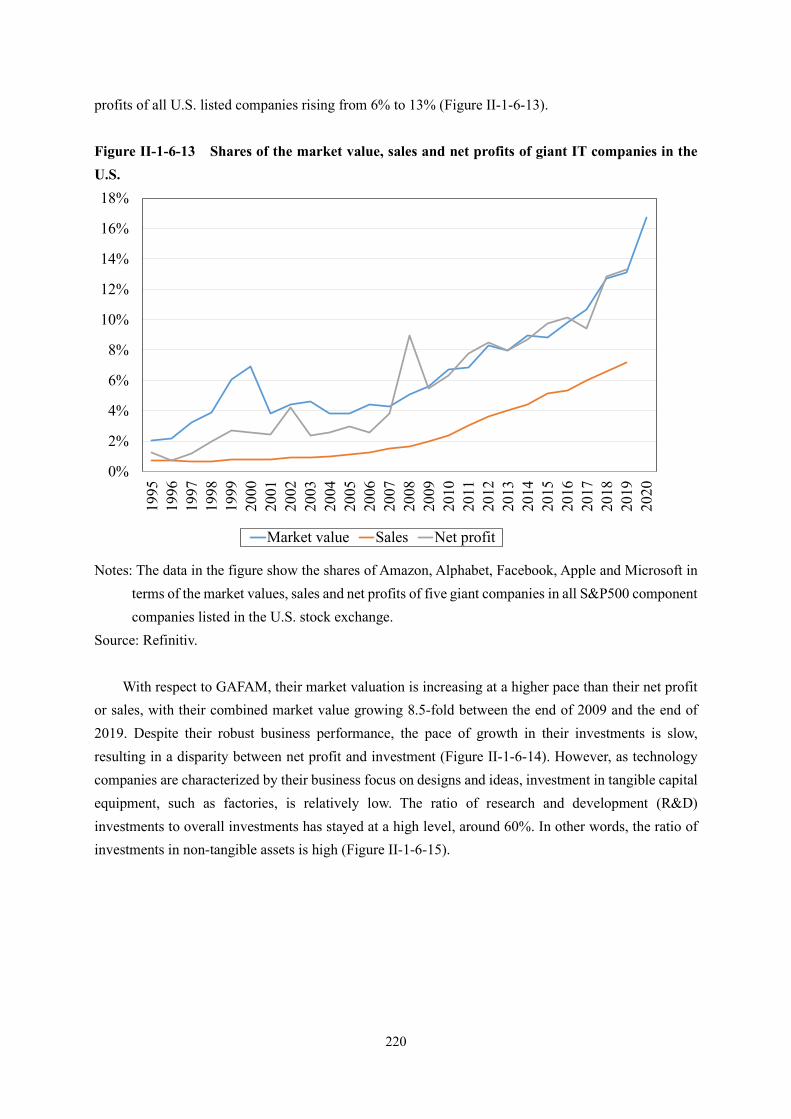
220
profits of all U.S. listed companies rising from 6% to 13% (Figure II-1-6-13). Figure II-1-6-13 Shares of the market value, sales and net profits of giant IT companies in the U.S.
Notes: The data in the figure show the shares of Amazon, Alphabet, Facebook, Apple and Microsoft in
terms of the market values, sales and net profits of five giant companies in all S&P500 component companies listed in the U.S. stock exchange.
Source: Refinitiv.
With respect to GAFAM, their market valuation is increasing at a higher pace than their net profit or sales, with their combined market value growing 8.5-fold between the end of 2009 and the end of 2019. Despite their robust business performance, the pace of growth in their investments is slow, resulting in a disparity between net profit and investment (Figure II-1-6-14). However, as technology companies are characterized by their business focus on designs and ideas, investment in tangible capital equipment, such as factories, is relatively low. The ratio of research and development (R&D) investments to overall investments has stayed at a high level, around 60%. In other words, the ratio of investments in non-tangible assets is high (Figure II-1-6-15).
0%
2%
4%
6%
8%
10%
12%
14%
16%
18%
1995
1996
1997
1998
1999
2000
2001
2002
2003
2004
2005
2006
2007
2008
2009
2010
2011
2012
2013
2014
2015
2016
2017
2018
2019
2020
Market value Sales Net profit

221
Figure II-1-6-14 Net profits, capital investment, sales and market of value of giant IT companies (GAFAM) in the U.S.
Notes: The data in the figure targets five companies of Amazon, Alphabet, Facebook, Apple and Microsoft.
Source: Refinitiv. Figure II-1-6-15 Ratios of R&D investments to overall investments by giant IT companies (GAFAM) in the U.S.
Notes: The data in the figure targets five companies of Amazon, Alphabet, Facebook, Apple and
Microsoft. Source: Refinitiv.
As a result of increases in pricing power and profit margin due to the concentration of market power among particular companies, the influence of large companies on the entire economy increases. When companies not facing the threat from competitors raise prices by taking advantage of their business scale and brand power, consumers have to accept the increase of prices if no alternative option is available. When companies that have increased profit margins by taking advantage of their high market share have created high barriers against market entry through their brand power, they do not need to make investment for competition.
020406080
100120140160180
1994
1996
1998
2000
2002
2004
2006
2008
2010
2012
2014
2016
2018
Net profit Investment
Billion dollars
0
1,000
2,000
3,000
4,000
5,000
6,000
1994
1996
1998
2000
2002
2004
2006
2008
2010
2012
2014
2016
2018
2020
Sales Market value
Billion dollars
0%10%20%30%40%50%60%70%80%90%
100%
1994
1995
1996
1997
1998
1999
2000
2001
2002
2003
2004
2005
2006
2007
2008
2009
2010
2011
2012
2013
2014
2015
2016
2017
2018
2019

222
Therefore, the following analysis will focus on the trends in the concentration of market power among large U.S. companies, and those companies’ profit margin, capital investment, and holdings of cash and deposits.
Figure II-1-6-16 shows the Herfindahl-Hirschman Index (the median value for 15 industries) as an indicator to measure the concentration of market power in industries to which listed U.S. companies that are components of the S&P 500 major U.S. stock price benchmark belong. The Herfindahl-Hirschman Index represents the total sum of the figures obtained by squaring individual companies’ sales shares in individual industries. If the value of this index is 10,000, it means full monopoly by a single company. The value of 5,000 means that two companies have a share of 50% each, while zero means full competition. This is one of the criteria used by the Fair Trade Commission for the review of business combination.
Since the second half of the 1990s, the value of the Herfindahl-Hirschman Index in terms of sales share (the median value for 15 industries) for U.S. companies has been trending upward. Between 2000 and 2019, the value of the Herfindahl-Hirschman Index rose from 225 to 1,055, indicating an increase in concentration. As well as market concentration in terms of sales share, the corporate profit margin (the ratio of net profit to sales) has been trending upward since the 2000s, rising from 6.9% in 2000 to 9.8% in 2019 (Figure II-1-6-16). Figure II-1-6-16 Concentration of market power in industries to which listed U.S. companies belong (median value for 15 industries) and profit ratios thereof
Notes: The Herfindahl-Hirschman indices in the figure (in terms of sales; median value for 15 industries)
are the calculation results based on the shares of sales among component companies in the respective target industries. The ratios of net profit to sales are the calculation results of the median value for 15 industries.
Source: Refinitiv.
0
200
400
600
800
1,000
1,200
0.0%
2.0%
4.0%
6.0%
8.0%
10.0%
12.0%
1995
1996
1997
1998
1999
2000
2001
2002
2003
2004
2005
2006
2007
2008
2009
2010
2011
2012
2013
2014
2015
2016
2017
2018
2019
Ratio of net profit to sales (left axis)Herfindahl-Hirschman Index (in terms of sales; right axis)

223
In addition, in industries for which the value of the Herfindahl-Hirschman Index rose sharply in 2010 and later, the ratio of net profit to sales also increased significantly (Figure II-1-6-7). Industries in which the level of concentration and the profit margin rose at the same time are technology, capital goods, utilities, and pharmaceuticals, while industries in which the level of concentration and the profit margin declined at the same time are oil and coal energy, and raw materials. In some industries, including raw materials and retail/mass-retail trade, the level of concentration rose but the profit margin declined. Figure II-1-6-17 Changes in the Herfindahl-Hirschman indices (in terms of sales) and profit rations of U.S. listed companies for 15 industries (2010-2019)
Notes: The Herfindahl-Hirschman indices in the figure (in terms of sales) are the calculation results based on the shares of sales among component companies in the respective target industries.
Source: Refinitiv.
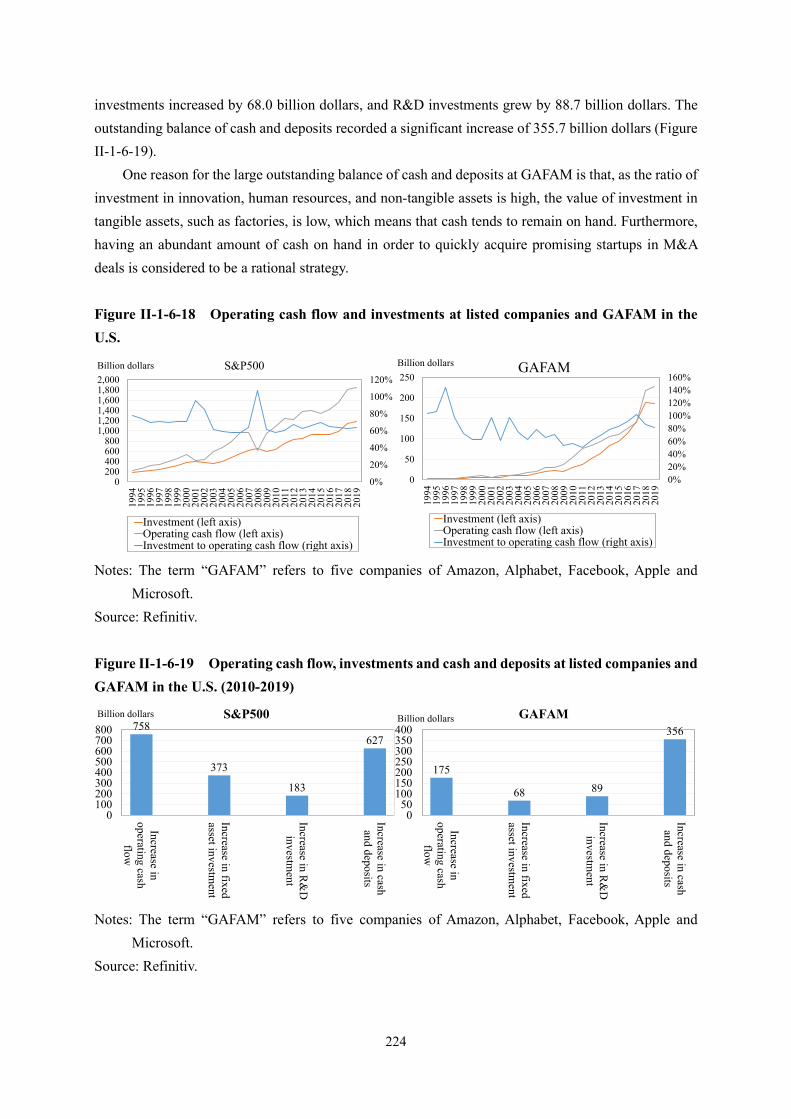
If operating cash flow expands, investment tends to increase. Meanwhile, the ratio of investment to operating cash flow at S&P500 component companies (excluding the financial sector) mostly stayed stable, in the 60-65% range. On the other hand, the ratio of investment to operating cash flow at GAFAM showed relatively large fluctuations, between 50% and 100% (Figure II-1-6-18).
Looking at changes in operating cash flow, investments, and cash and deposits throughout the 2010s, the increase in operating cash flow was used for purposes other than investment, particularly for accumulating cash and deposits. The combined operating cash flow of the S&P500 component companies (excluding the financial sector) has expanded by 758.5 billion dollars since 2010. The value of fixed asset investments increased by 372.9 billion dollars, while R&D investments grew by 183.3 billion dollars. Meanwhile, the outstanding balance of cash and deposits increased by 626.5 billion dollars, representing a larger increase than the increase in investments.
As for GAFAM, their combined operating cash flow expanded by 175.4 billion dollars, fixed asset
-6.0%
-4.0%
-2.0%
0.0%
2.0%
4.0%
6.0%
8.0%
10.0%
-1,500 -1,000 -500 0 500 1,000 1,500 2,000
Range of changes in the Herfindahl-Hirschman indices (in terms of sales; 2010-2019)
Range of changes in the ratios of net profit to sales (2010-2019)
224
investments increased by 68.0 billion dollars, and R&D investments grew by 88.7 billion dollars. The outstanding balance of cash and deposits recorded a significant increase of 355.7 billion dollars (Figure II-1-6-19).
One reason for the large outstanding balance of cash and deposits at GAFAM is that, as the ratio of investment in innovation, human resources, and non-tangible assets is high, the value of investment in tangible assets, such as factories, is low, which means that cash tends to remain on hand. Furthermore, having an abundant amount of cash on hand in order to quickly acquire promising startups in M&A deals is considered to be a rational strategy. Figure II-1-6-18 Operating cash flow and investments at listed companies and GAFAM in the U.S.
Notes: The term “GAFAM” refers to five companies of Amazon, Alphabet, Facebook, Apple and
Microsoft. Source: Refinitiv. Figure II-1-6-19 Operating cash flow, investments and cash and deposits at listed companies and GAFAM in the U.S. (2010-2019)
Notes: The term “GAFAM” refers to five companies of Amazon, Alphabet, Facebook, Apple and
Microsoft. Source: Refinitiv.
0%
20%
40%
60%
80%
100%
120%
0200400600800
1,0001,2001,4001,6001,8002,000
1994
1995
1996
1997
1998
1999
2000
2001
2002
2003
2004
2005
2006
2007
2008
2009
2010
2011
2012
2013
2014
2015
2016
2017
2018
2019
S&P500
Investment (left axis)Operating cash flow (left axis)Investment to operating cash flow (right axis)
Billion dollars
0%20%40%60%80%100%120%140%160%
0
50
100
150
200
250
1994
1995
1996
1997
1998
1999
2000
2001
2002
2003
2004
2005
2006
2007
2008
2009
2010
2011
2012
2013
2014
2015
2016
2017
2018
2019
GAFAM
Investment (left axis)Operating cash flow (left axis)Investment to operating cash flow (right axis)
Billion dollars
758
373
183
627
0100200300400500600700800
Increase inoperating cash
flow
Increase in fixedasset investm
ent
Increase in R&
Dinvestm
ent
Increase in cashand deposits
Billion dollars S&P500
175
68 89
356
050
100150200250300350400
Increase inoperating cash
flow
Increase in fixedasset investm
ent
Increase in R&
Dinvestm
ent
Increase in cashand deposits
Billion dollars GAFAM

225
In addition to market concentration and a rise in profit margin, there have been an increase in corporate profits, a decline in market dynamism in terms of entry and exit, an increase in M&As, and a decrease in the number of listed companies. These are indications of market concentration in the United States (Figure II-1-6-20). Figure II-1-6-20 Trends in market concentration in the U.S.
Source: FRED, U.S. Census Bureau, Thomson One, World Bank. 2. Rapid social implementation of innovative technologies for combating COVID-19
Following the onset of the COVID-19 pandemic, technological innovations for promoting digital services that complement face-to-face interactions and preventing the spread of infections are advancing, and social implementation of those technologies are proceeding. Those technologies are called “Corona Tech.” (1) Corona Tech innovations and social implementation
One example of Corona Tech is a smartphone app intended to deal with COVID-19. For instance, in China and the Republic of Korea (ROK), location and other data are used to grasp information on the behavior and contacts of infected people. In these two countries, apps that indicate the information on smartphone have been developed in order to keep track of the behavior of infected people. Also in the United Kingdom and Singapore, apps that trace close contacts using Bluetooth technology have been introduced.
Next, in order to avoid human-to-human contact, automation is being promoted. AI-based automated diagnosis and health checks make it possible to identify people with a high temperature from
0
5,000
10,000
15,000
1980 1985 1990 1995 2000 2005 2010 2015
Number of M&A deals by U.S. companies(Number of M&A deals)
8
9
10
11
12
13
14
1997
1998
1999
2000
2001
2002
2003
2004
2005
2006
2007
2008
2009
2010
2011
2012
2013
2014
2015
2016
Percentages of companies’ entry and exit (%)
Entry
Exit
0
2
4
6
8
10
12
1947
1950
1953
1956
1959
1962
1965
1968
1971
1974
1977
1980
1983
1986
1989
1992
1995
1998
2001
2004
2007
2010
2013
2016
2019
Companies’ profit to GDP(%)
0100020003000400050006000700080009000
1980
1982
1984
1986
1988
1990
1992
1994
1996
1998
2000
2002
2004
2006
2008
2010
2012
2014
2016
2018
(Number of companies)Number of U.S. listed companies

226
among a crowd of 15 persons/second within a radius of 5 meters. Technology to detect suspected carriers in this way has been put into practical use. In addition, efforts to contain COVID-19 in a safe and efficient manner are underway, including robot- and drone-based activities in contaminated areas, such as distribution of food, surveillance, and disinfection. In China, drone-based transportation of goods is said to have improved efficiency by more than 50%, compared with conventional road transportation, while preventing secondary contamination of medical supplies by reducing contacts between transported goods and personnel.
In addition, the introduction of remote services using telecommunication is being promoted. The use of services that have already been technically feasible, such as remote medicine, remote education and telework, is increasing rapidly in response to the COVID-19 pandemic. In China, 300 million of the country’s population of 1,400 million people are said to have engaged in telework at the peak in February, resulting in explosive diffusion of videophone calls and chats as telework support tools. Alibaba Group’s DingTalk has been adopted by more than 10 million companies and organizations as a telework support service.
In China, there are hospitals introducing 5G and VR. In Wuhan, which was the epicenter of the COVID-19 pandemic, a hospital dedicated to the treatment of COVID-19 patients was constructed. The hospital introduced a system to prevent the spread of infections by preventing contact between medical personnel and infected people through a remote diagnosis service using 5G-based video transmission.
One characteristic of innovation in China is that vast amounts of data are collected and updated through day-to-day usage. Regarding Corona Tech, China is also actively promoting social implementation of technologies by taking advantage of the innovation.
Taiwan responded to the tightening of the supply-demand balance for masks by requiring people purchasing masks to present their health insurance certificate for the purpose of identification.
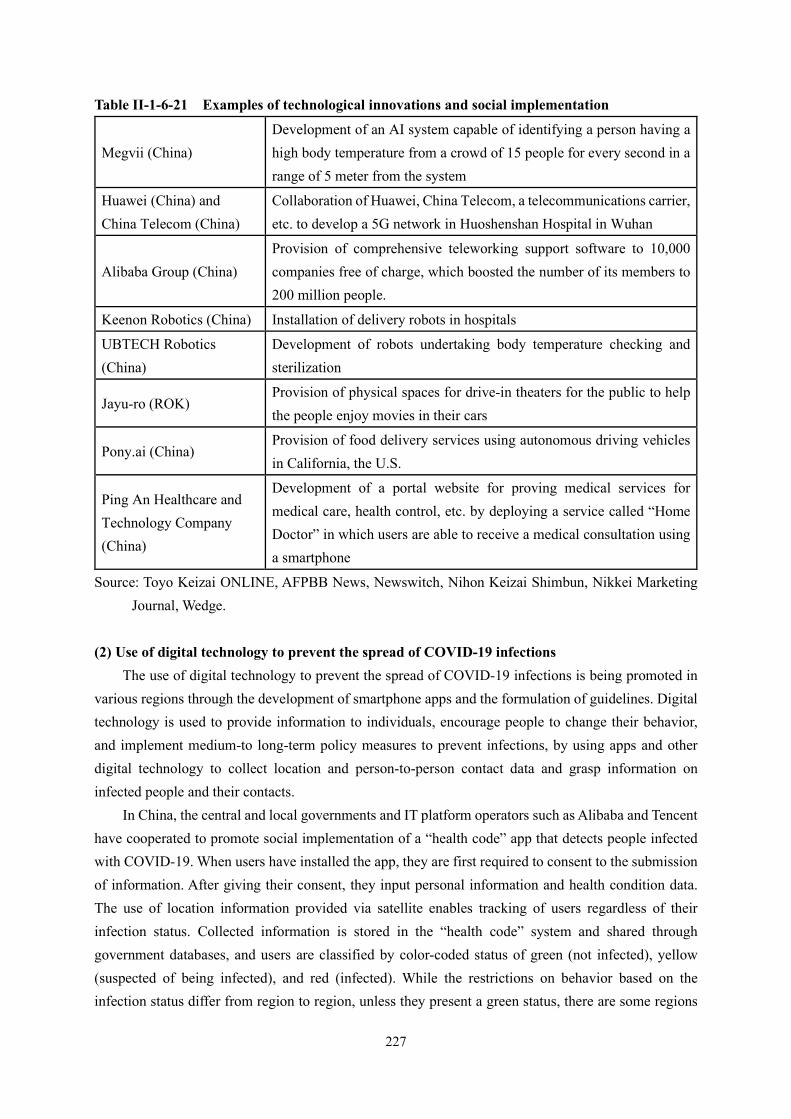
Those initiatives are expected to contribute to the provision of information from governments to individuals and medium- to long-term policies for preventing the spread of infection, such as encouraging people to change their behavior. On the other hand, there is the possibility that concentration of data among IT platform operators may proceed further. Regarding Corona Tech, there is also a tendency to transfer technologies between regions based on the experiences of regions where technological innovation and social implementation are advanced (Table II-1-6-21).
227
Table II-1-6-21 Examples of technological innovations and social implementation
Megvii (China) Development of an AI system capable of identifying a person having a high body temperature from a crowd of 15 people for every second in a range of 5 meter from the system
Huawei (China) and China Telecom (China)
Collaboration of Huawei, China Telecom, a telecommunications carrier, etc. to develop a 5G network in Huoshenshan Hospital in Wuhan
Alibaba Group (China) Provision of comprehensive teleworking support software to 10,000 companies free of charge, which boosted the number of its members to 200 million people.
Keenon Robotics (China) Installation of delivery robots in hospitals
UBTECH Robotics (China)
Development of robots undertaking body temperature checking and sterilization
Jayu-ro (ROK) Provision of physical spaces for drive-in theaters for the public to help the people enjoy movies in their cars
Pony.ai (China) Provision of food delivery services using autonomous driving vehicles in California, the U.S.
Ping An Healthcare and Technology Company (China)
Development of a portal website for proving medical services for medical care, health control, etc. by deploying a service called “Home Doctor” in which users are able to receive a medical consultation using a smartphone
Source: Toyo Keizai ONLINE, AFPBB News, Newswitch, Nihon Keizai Shimbun, Nikkei Marketing Journal, Wedge.
(2) Use of digital technology to prevent the spread of COVID-19 infections
The use of digital technology to prevent the spread of COVID-19 infections is being promoted in various regions through the development of smartphone apps and the formulation of guidelines. Digital technology is used to provide information to individuals, encourage people to change their behavior, and implement medium-to long-term policy measures to prevent infections, by using apps and other digital technology to collect location and person-to-person contact data and grasp information on infected people and their contacts.
In China, the central and local governments and IT platform operators such as Alibaba and Tencent have cooperated to promote social implementation of a “health code” app that detects people infected with COVID-19. When users have installed the app, they are first required to consent to the submission of information. After giving their consent, they input personal information and health condition data. The use of location information provided via satellite enables tracking of users regardless of their infection status. Collected information is stored in the “health code” system and shared through government databases, and users are classified by color-coded status of green (not infected), yellow (suspected of being infected), and red (infected). While the restrictions on behavior based on the infection status differ from region to region, unless they present a green status, there are some regions

228
where people cannot use public transportation systems, offices, and commercial facilities, and visit tourist spots.
In the ROK, the Ministry of the Interior and Safety has developed an app “Self-Quarantine Safety Protection App” through which people in self-isolation report their health conditions to the health authorities. Although installing the app is voluntary, foreign visitors must install it. After receiving reports on health conditions from people in self-isolation, the health authorities keep track of the location of those people through GPS location information in order to prevent them from violating the conditions of self-isolation. If people in self-isolation leave isolation sites, they receive a warning message. As some people have not complied with the self-isolation measure, the ROK has introduced an electronic “safety wristband” to be worn by offenders for the purpose of tracing their behavior. In addition, considering tracing information regarding contacts of infected people to be part of epidemiological investigation, the ROK amended the Infectious Disease Control and Prevention Act in 2015. Under the amended law, the ROK traces the behavior of individuals using GPS location information, credit card records and security camera videos, and discloses information through their websites without revealing names of such individuals. To support such epidemiological investigation, the Ministry of Land, Infrastructure and Transport has developed an epidemiological investigation support system under a national strategy smart city research and development program so that the person in charge of such investigation can expedite identification of infected people and detection of infection clusters in cooperation with the police, telecommunication companies, and credit card companies.
In Singapore, the government has developed a smartphone app called “TraceTogether,” which records users’ contact history using the smartphone’s Bluetooth signals. Although installing the app is voluntary, 1.1 million people, or about 20% of the population, has installed it. When infected people are found, the health authorities directly notify those who had contacts with the infected and provide healthcare guidance.
In Europe, more than 130 scientists and other experts from eight countries have announced “Pan-European Privacy-Preserving Proximity Tracing (PEPP-PT),” an initiative to provide modules and tools for the design and development of apps in order to support member countries’ design and development of contact tracing apps in compliance with the European General Data Protection Regulation (GDPR). In addition, Decentralized Privacy-Preserving Proximity Tracing, or DP-3T, which was designed by researchers from several European research institutions, was announced as an initiative to propose a decentralized management model (a model for managing contact data at individual devices without storing them on a central server) in consideration of privacy. On April 16th, the European Commission announced an EU toolbox for the use of mobile applications for contact tracing and warning, which is a guidance for the development of mobile apps intended to support contact tracing as part of the initiative to prevent the spread of COVID-19 infections.
In the announcement, the European Commission indicated its view that contact tracing plays an important role as a part of confinement measure in all stages of crisis management, particularly at a non-escalation stage. On the other hand, it emphasized the need for a common European approach given the huge impact on privacy and individuals’ rights and freedom. The toolbox shows a practical guide for EU member countries to implement contact tracing and introduce warning apps. It sets out the

229
requirements for the apps, such as full compliance with the relevant rules on EU data protection and privacy, and voluntary installation. The apps are also required to use technology that does not rely on users’ location information, such as Bluetooth proximity technology, and anonymized data and to issue alerts to users, without disclosing information on infected people, so that they can undergo a test or self-isolate.
Apple and Google announced a joint plan to disclose an Application Programming Interface (API) that enables apps provided by the health authorities to work on both Android OS and iOS through Bluetooth technology and incorporate this function at the OS phase in order to detect the possibility of close contact with people infected with COVID-19. National health authorities and developers commissioned by them will develop apps using the API provided by the two companies. Installation of apps is voluntary. As shown in Figure II-1-6-10, Android OS and iOS together have a nearly 100% share as a smartphone operating system.
As described above, measures using digital technology are being implemented to prevent the spread of infections. In the meantime, the consideration given to personal information differs from country to country. Ongoing discussions on how to strike the balance between privacy and public health are taking place (Table II-1-6-22). Table II-1-6-22 Utilization of countries’ digital technology to prevent the spread of COVID-19
Category Type using location data
Type using Bluetooth Type
identifying individuals
Type using anonymity
Title of initiative
Health code (China)
Self-Quarantine
Safety Protection
App (ROK)
TraceTogether (Singapore)
PEPP-PT (Pan-
European initiative)
Apple and Google
Overview
This application aims to categorize the infection status of users based on the satellite data on users’ locations, government databases, etc., thereby allowing the government to send its instructions to users, e.g., quarantine measures.
This application aims to report the current status of users’ self-isolation to the health authority by making use of GPS information on users’ locations.
This contact tracking application aims to record nearby users by using the Bluetooth technology.
This initiative aims to provide modules and tools to companies to help them develop a contact tracking application for recording nearby users by using the Bluetooth technology.
This is a framework to develop a contact tracking application for recording nearby users by using the Bluetooth technology.

230
Access to personal
telephones number, etc.
Yes Yes Yes No Not required
Management of data on infected persons
(on a central server / at an
individual terminal)
Central server Central server Central server
Allowing management
of data on infected
persons both on a central server and at an individual
terminal
Individual terminal
Installation (mandatory / voluntary)
Voluntary in many local
governments while some
differences are seen (some
organizations requires people to
install the app when
permitting them to return
to work or enter a
building)
Voluntary (foreign
visitors must install the
app.)
Voluntary Voluntary Voluntary
Source: Ministry of the Interior and Safety of the ROK, MIT Technology Review, NHK, Nihon Keizai Shimbun, TraceTogether, JETRO, Apple, Google.