section 5.4.2 - landslide
TRANSCRIPT
Section 5.4.2: Risk Assessment – Landslide
Hazard Mitigation Plan – Cattaraugus County, New York 5.4.2-1 December 2020
5.4.2 Landslide
This section provides a profile and vulnerability assessment of the landslide hazard for the Cattaraugus County
Hazard Mitigation Plan (HMP).
5.4.2.1 Hazard Profile
This section provides information regarding the description, extent, location, previous occurrences and losses,
and the probability of future occurrences for the landslide hazard.
Description
Landslides are composed of natural rock, soil, artificial fill, or a combination and move along a downward slope.
They flow rapidly, striking at avalanche speeds that can travel several miles, growing as they pick up trees,
boulders, cars, and other materials (New York State HMP 2019).
Landslides occur when the slope or soil stability changes from stable to unstable, which may be caused by
earthquakes, storms, volcanic eruptions, erosion, fire, or additional human-induced activities. Typically, the
steeper the slope, the higher the risk for landslide occurrence. Slopes greater than 10 degrees are more likely to
slide, as are slopes where the height from the top of the slope to its toe is greater than 40 feet. Slopes are also
more likely to fail if vegetative cover is low and/or soil water content is high. However, landslides can occur
with very little slope, sometimes classified as earth slumping or earth flow (NYS HMP 2019).
Several different types of landslides include:
• Rock Falls: Blocks of rock that fall away from a bedrock unit without a rotational component
• Rock Topples: Blocks of rock that fall away from a bedrock unit with a rotational component
• Rotational Slump: Blocks of fine-grained sediment that rotate and move down slope
• Transitional Slide: Sediments that move along a flat surface without a rotational component
• Earth Flows: Fine-grained sediments that flow downhill and typically form a fan structure
• Creep: A slow-moving landslide often noticed only by presence of crooked trees and disturbed
structures
• Block Slides: Blocks of rock that slide along a slip plane as a unit down a slope
• Debris Avalanche: Predominantly gravel, cobble, boulder, and sediment portions, and trees that move
quickly down slope
• Debris Flows: Coarse sediments that flow downhill and spread out over relatively flat areas (NYS
Division of Homeland Security and Emergency Services [DHSES] 2014)
The amount of damage associated with landslides is small, but they are constantly reoccurring in regular
maintenance and repair costs of impacted roads ($30,000 per year). In addition, if residential damage occurs and
are deemed not able to rehabilitate, private losses could approach $50,000 to $80,000 per residential structure.
Certain conditions can be life threatening such as structural failure, or disruption to utilities (natural gas, propane,
and electric (Cattaraugus HMP 2014).
Extent
Extent of a landslide hazard is determined by identifying affected areas and assessing probability of a landslide
occurring within a time period. Natural variables that contribute to overall extent of potential landslide activity
in any particular area include soil properties, topographic position and slope, and historical incidence. Predicting
Section 5.4.2: Risk Assessment – Landslide
Hazard Mitigation Plan – Cattaraugus County, New York 5.4.2-2 December 2020
a landslide is difficult, even under ideal conditions. As a result, the landslide hazard is often represented by
landslide incidence and susceptibility, defined as follows:
• Landslide incidence: Categorized by percentage of a given geographic area that has undergone
landslides. High incidence means greater than 15 percent of a given area has been involved in
landsliding, medium incidence means that 1.5 to 15% of an area has been involved, and low incidence
means that less than 1.5 percent of an area has been involved. (Radbruch-Hall et al. 1982).
• Landslide susceptibility: Defined as the probable degree of response of geologic formations to natural
or artificial cutting, to loading of slopes, or to unusually high precipitation. Assumedly, unusually high
precipitation or changes in existing conditions can initiate landslide movement in areas where rocks and
soils have been involved with landslides in the past. Landslide susceptibility depends on slope angle
and geologic material underlying the slope. Landslide susceptibility applies only to areas potentially
affected, and does not imply a time frame within which a landslide might occur. High, medium, and
low susceptibility are delimited by the same percentages used for classifying incidence of landslides
(Radbruch-Hall et al. 1982).
Location
The potential for landslides exists throughout New York State, including Cattaraugus County. Generally, the
highest potential for landslides is located along major rivers and lake valleys that were previously glacial lakes
resulting in glacial lake deposits (glacial lake clays) and areas associated with steeper slopes.
Landslides in Cattaraugus County occur after heavy rains when steep banks wash down into the roadways.
Information contained in the Cattaraugus County’s 2014 HMP indicate that the Route 16 corridor, between
Franklinville and Hinsdale, has had large landslides. The Town of New Albion also exhibited several trouble
spots where severe erosion and landslides occur. The Town of Yorkshire noted landslides occurring on Creek
and Bolton Roads with several “sink holes.” The town acquired a structure endangered by landslide along the
Cattaraugus Creek. As stated in the 2014 HMP, areas to note relative to the landslide hazard are Connoisarauley
Road in East Otto and Point Peter and Dewey Roads in the Town of Persia. Skinner Hollow area and the Village
of Cattaraugus are also potentially impacted by the hazard. According to New York State Geological Survey’s
(NYSGS) Landslide Inventory Map of New York, Cattaraugus County has had 17 landslide incidences (NYSGS
1989).
In the 2014 HMP, the Village of Cattaraugus noted that three roads in or near the village have dropped and slid.
The main business district of the village is situated on a steep slope. Threats of a landslide from the nearby hill
are a concern, with Leavenworth and Waverly Streets being especially vulnerable and requiring high
maintenance. About a dozen homes are are at risk in the Village of Cattaraugus due to land subsidence.
As reported in the 2014 HMP, the City of Salamanca noted riverbank scour and settlement along the banks of
the Allegany River. Many landslides have been located along Cattaraugus Creek, which makes up the northern
border of the county. In addition, landslides have occurred near fine-ground soils with poor drainage
characteristic primarily along stream and riverine settings. To date, landslides have impacted many very small
areas. In one instance, along County Road 76 (Lovers Lane Road) in the Town of New Albion, the earth around
one residence dropped approximately 4 feet in spring 2004. The road adjacent to this property needs continual
maintenance to ensure the safety of the travelling public. Other landslide sites would include County Road 12 in
the Town of Otto, Connasauraley in the Town of East Otto, Town Line Road in the towns of Ashford/Yorkshire,
and Creek Road in the Town of Yorkshire. The Village of Cattaraugus has had to repair water and sewer utilities
on a regular basis (for example, four times in spring 2004).

Section 5.4.2: Risk Assessment – Landslide
Hazard Mitigation Plan – Cattaraugus County, New York 5.4.2-3 December 2020
Figure 5.4.2-1 shows landslide incidence and susceptibility (as defined in the Extent section above) in
Cattaraugus County based on terrain slopes and soil type throughout the county and shows the entire county has
low incidence/susceptibility to landslide (U.S. Geological Survey [USGS] 2011).
Figure 5.4.2-1. Landslide Susceptibility in Cattaraugus County
USGS, 2020

Section 5.4.2: Risk Assessment – Landslide
Hazard Mitigation Plan – Cattaraugus County, New York 5.4.2-4 December 2020
Previous Occurrences and Losses
Descriptive data on historic events are limited. The NYS HMP contained no records of any events from 1996–
2017 (NYS DHSES 2019). Between 1954 and 2020, the Federal Emergency Management Agency (FEMA)
issued one disaster declaration (DR) for landslides in NYS (DR-487), but Cattaraugus County was not included
in the DR. Annualized loss is negligible for landslide damage.
Probability of Future Occurrences
Based on historical records and input from the Planning Partnership, probability of occurrence of landslides in
Cattaraugus County is considered “rare” (1 to 10-percent annual probability of a hazard event occurring).
Climate Change Impacts
Projecting future climate change within a specific region is challenging. Shorter-term projections are more
closely tied to existing trends, rendering longer-term projections even more challenging. The further into the
future a prediction extends, the more it is subject to change.
Through the 2020s, average annual temperature is expected to increase by 1.8°F in the region of NYS where
Cattaraugus County is located. By the 2050s, this increase will be 3.6 °F, and by 2100, it will be 4.5 °F (New
York State Energy Research and Development Authority [NYSERDA] 2014). Future climate change may
impact storm patterns, increasing probability of more frequent, intense storms with varying duration. Global
temperature increase could affect the snowpack and its ability to hold and store water. Warming temperatures
also could increase occurrence and duration of droughts, which could increase probability of wildfire and likely
reduce the vegetation that helps support steep slopes. All these factors could increase the probability of landslide
occurrence.
5.4.2.2 Vulnerability Assessment
To understand risk, a community must evaluate what assets are exposed and/or vulnerable to the identified
hazard. Because of the lack of spatially delineated landslide hazard areas in the county, a spatial analysis
referenced areas with slopes greater than 25 percent to delineate the landslide hazard area. Slope degrees greater
than 25 percent are categorized as the most at-risk slopes in the study.
Impact on Life, Health, and Safety
Generally, a landslide event would be an isolated incidence and impact the populations within the immediate
area of the incident. Specifically, the population located downslope of the landslide hazard areas are particularly
vulnerable to this hazard. In addition to causing damages to residential buildings and displacing residents,
landslide events can block off or damage major roadways and inhibit travel for emergency responders or
populations trying to evacuate the area.
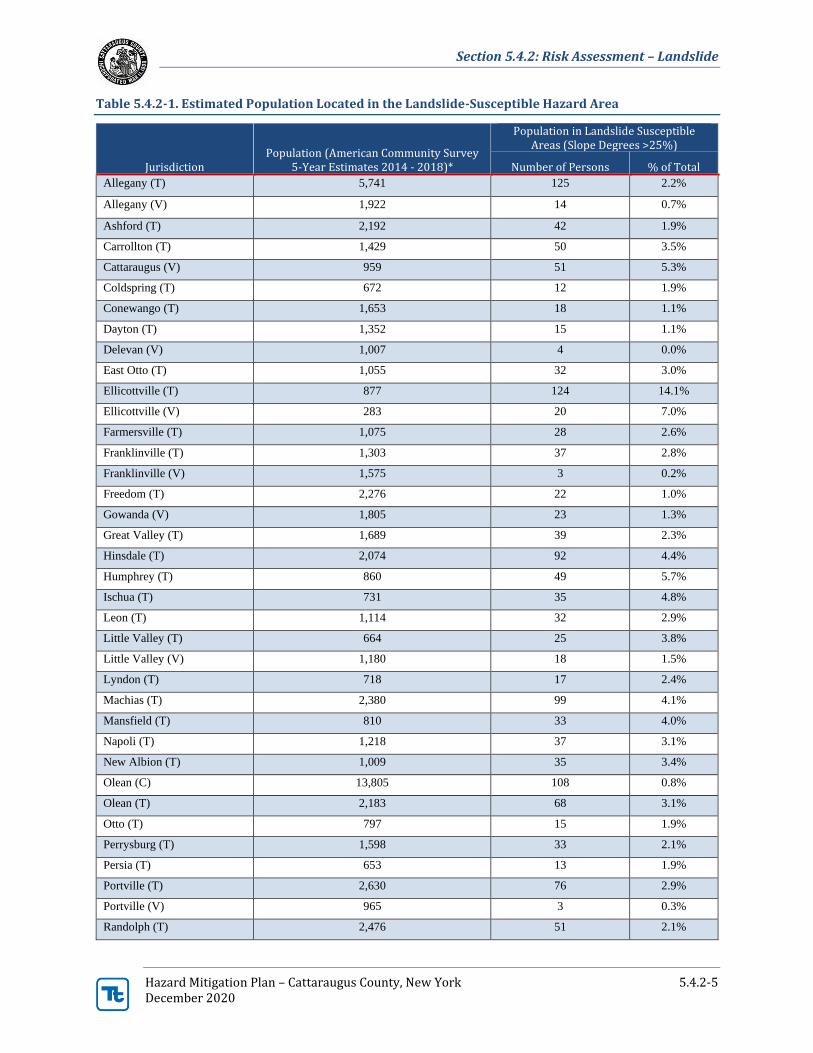
Table 5.4.2-1 summarizes the population located in the landslide-susceptible hazard area, or areas where slopes
have degree angles greater than 25 percent. The Town of Allegany has the greatest number of persons located
in the landslide-susceptible hazard area with 125 people, or 2.2 percent of its total population. The Town of
Ellicottville has the greatest percentage of its population located in the landslide-susceptible hazard area (14.1
percent of its total population).
Section 5.4.2: Risk Assessment – Landslide
Hazard Mitigation Plan – Cattaraugus County, New York 5.4.2-5 December 2020
Table 5.4.2-1. Estimated Population Located in the Landslide-Susceptible Hazard Area
Jurisdiction Population (American Community Survey
5-Year Estimates 2014 - 2018)*
Population in Landslide Susceptible Areas (Slope Degrees >25%)
Number of Persons % of Total
Allegany (T) 5,741 125 2.2%
Allegany (V) 1,922 14 0.7%
Ashford (T) 2,192 42 1.9%
Carrollton (T) 1,429 50 3.5%
Cattaraugus (V) 959 51 5.3%
Coldspring (T) 672 12 1.9%
Conewango (T) 1,653 18 1.1%
Dayton (T) 1,352 15 1.1%
Delevan (V) 1,007 4 0.0%
East Otto (T) 1,055 32 3.0%
Ellicottville (T) 877 124 14.1%
Ellicottville (V) 283 20 7.0%
Farmersville (T) 1,075 28 2.6%
Franklinville (T) 1,303 37 2.8%
Franklinville (V) 1,575 3 0.2%
Freedom (T) 2,276 22 1.0%
Gowanda (V) 1,805 23 1.3%
Great Valley (T) 1,689 39 2.3%
Hinsdale (T) 2,074 92 4.4%
Humphrey (T) 860 49 5.7%
Ischua (T) 731 35 4.8%
Leon (T) 1,114 32 2.9%
Little Valley (T) 664 25 3.8%
Little Valley (V) 1,180 18 1.5%
Lyndon (T) 718 17 2.4%
Machias (T) 2,380 99 4.1%
Mansfield (T) 810 33 4.0%
Napoli (T) 1,218 37 3.1%
New Albion (T) 1,009 35 3.4%
Olean (C) 13,805 108 0.8%
Olean (T) 2,183 68 3.1%
Otto (T) 797 15 1.9%
Perrysburg (T) 1,598 33 2.1%
Persia (T) 653 13 1.9%
Portville (T) 2,630 76 2.9%
Portville (V) 965 3 0.3%
Randolph (T) 2,476 51 2.1%

Section 5.4.2: Risk Assessment – Landslide
Hazard Mitigation Plan – Cattaraugus County, New York 5.4.2-6 December 2020
Jurisdiction Population (American Community Survey
5-Year Estimates 2014 - 2018)*
Population in Landslide Susceptible Areas (Slope Degrees >25%)
Number of Persons % of Total Red House (T) 42 0 0.0%
Salamanca (C) 5,553 91 1.6%
Salamanca (T) 447 6 1.4%
South Dayton (V) 673 4 0.5%
South Valley (T) 276 27 9.7%
Yorkshire (T) 2,762 25 0.9%
Cattaraugus County (Total) 76,483 1,651 2.2%
Source: New York Office of Information Technology Services (NYOIT) 2017; American Community Survey 2018
Notes: % = Percent; C = City; T = Town; V = Village
* Please note, due to the estimated boundaries of villages and towns within Cattaraugus County, there is a small discrepancy of approximately
400 people reported in the 2018 American Community Survey versus the population data used in the geographic information system
(GIS) spatial analysis. A rough estimate was made based on land area for The Village of Gowanda; approximately 60 percent of the
Village of Gowanda remains within Cattaraugus County. Therefore, an assumption was made that 60 percent of the reported
population for the Village of Gowanda remains in Cattaraugus County. The population of the Village of Gowanda that resides in
Cattaraugus County was subtracted from the Town of Persia. Tribal nations and reservation areas are not included in this population
analysis.
Socially vulnerable populations (e.g., the elderly and low-income populations) are particularly vulnerable to a
landslide event. There are approximately 320 persons over 65 and 242 persons living below the poverty level
that are at greatest risk to landslides based on their proximity to the landslide hazard area. The Town of
Ellicottville and the City of Salamanca have the greatest number of vulnerable populations living within
landslide-susceptible hazard areas: approximately 29 persons over 65 years old in the Town of Ellicottville and
approximately 24 persons living below the poverty level in the City of Salamanca.
Impact on General Building Stock
In general, the built environment located in the landslide-susceptibility area and the population, structures and
infrastructure located downslope are vulnerable to this hazard. Landslides also have the potential of destabilizing
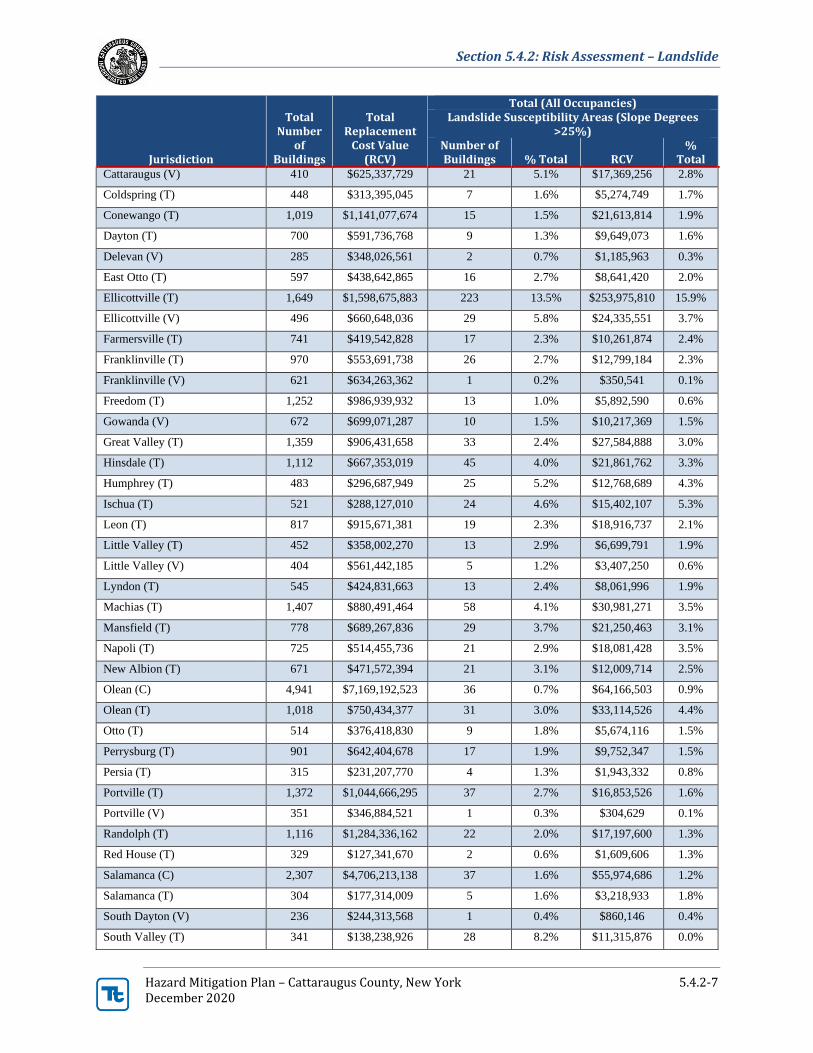
the foundation of structures, which may result in monetary losses to businesses and residents. There are 1,030
buildings with a replacement cost value of $875 million located in the landslide hazard area countywide. The
Town of Ellicottville has the greatest number of buildings and estimated replacement cost value located in
landslide-susceptible hazard area where slopes are greater than 25 percent; there are approximately 223 buildings
with a total replacement cost value of $235.9 million built in the landslide-susceptible hazard area within this
town. Table 5.4.2-2 summarizes the exposed building stock located in the landslide-susceptibility area
throughout the county by jurisdiction.
Table 5.4.2-2. Estimated Number of Buildings in the Landslide Hazard Area
Jurisdiction
Total Number
of Buildings
Total Replacement
Cost Value (RCV)
Total (All Occupancies) Landslide Susceptibility Areas (Slope Degrees
>25%) Number of Buildings % Total RCV
% Total
Allegany (T) 2,455 $1,995,224,472 50 2.0% $47,366,325 2.4%
Allegany (V) 639 $754,717,827 4 0.6% $2,949,592 0.4%
Ashford (T) 1,075 $922,022,498 19 1.8% $9,165,130 1.0%
Carrollton (T) 626 $348,432,403 20 3.2% $9,992,398 2.9%
Section 5.4.2: Risk Assessment – Landslide
Hazard Mitigation Plan – Cattaraugus County, New York 5.4.2-7 December 2020
Jurisdiction
Total Number
of Buildings
Total Replacement
Cost Value (RCV)
Total (All Occupancies) Landslide Susceptibility Areas (Slope Degrees
>25%) Number of Buildings % Total RCV
% Total
Cattaraugus (V) 410 $625,337,729 21 5.1% $17,369,256 2.8%
Coldspring (T) 448 $313,395,045 7 1.6% $5,274,749 1.7%
Conewango (T) 1,019 $1,141,077,674 15 1.5% $21,613,814 1.9%
Dayton (T) 700 $591,736,768 9 1.3% $9,649,073 1.6%
Delevan (V) 285 $348,026,561 2 0.7% $1,185,963 0.3%
East Otto (T) 597 $438,642,865 16 2.7% $8,641,420 2.0%
Ellicottville (T) 1,649 $1,598,675,883 223 13.5% $253,975,810 15.9%
Ellicottville (V) 496 $660,648,036 29 5.8% $24,335,551 3.7%
Farmersville (T) 741 $419,542,828 17 2.3% $10,261,874 2.4%
Franklinville (T) 970 $553,691,738 26 2.7% $12,799,184 2.3%
Franklinville (V) 621 $634,263,362 1 0.2% $350,541 0.1%
Freedom (T) 1,252 $986,939,932 13 1.0% $5,892,590 0.6%
Gowanda (V) 672 $699,071,287 10 1.5% $10,217,369 1.5%
Great Valley (T) 1,359 $906,431,658 33 2.4% $27,584,888 3.0%
Hinsdale (T) 1,112 $667,353,019 45 4.0% $21,861,762 3.3%
Humphrey (T) 483 $296,687,949 25 5.2% $12,768,689 4.3%
Ischua (T) 521 $288,127,010 24 4.6% $15,402,107 5.3%
Leon (T) 817 $915,671,381 19 2.3% $18,916,737 2.1%
Little Valley (T) 452 $358,002,270 13 2.9% $6,699,791 1.9%
Little Valley (V) 404 $561,442,185 5 1.2% $3,407,250 0.6%
Lyndon (T) 545 $424,831,663 13 2.4% $8,061,996 1.9%
Machias (T) 1,407 $880,491,464 58 4.1% $30,981,271 3.5%
Mansfield (T) 778 $689,267,836 29 3.7% $21,250,463 3.1%
Napoli (T) 725 $514,455,736 21 2.9% $18,081,428 3.5%
New Albion (T) 671 $471,572,394 21 3.1% $12,009,714 2.5%
Olean (C) 4,941 $7,169,192,523 36 0.7% $64,166,503 0.9%
Olean (T) 1,018 $750,434,377 31 3.0% $33,114,526 4.4%
Otto (T) 514 $376,418,830 9 1.8% $5,674,116 1.5%
Perrysburg (T) 901 $642,404,678 17 1.9% $9,752,347 1.5%
Persia (T) 315 $231,207,770 4 1.3% $1,943,332 0.8%
Portville (T) 1,372 $1,044,666,295 37 2.7% $16,853,526 1.6%
Portville (V) 351 $346,884,521 1 0.3% $304,629 0.1%
Randolph (T) 1,116 $1,284,336,162 22 2.0% $17,197,600 1.3%
Red House (T) 329 $127,341,670 2 0.6% $1,609,606 1.3%
Salamanca (C) 2,307 $4,706,213,138 37 1.6% $55,974,686 1.2%
Salamanca (T) 304 $177,314,009 5 1.6% $3,218,933 1.8%
South Dayton (V) 236 $244,313,568 1 0.4% $860,146 0.4%
South Valley (T) 341 $138,238,926 28 8.2% $11,315,876 0.0%
Section 5.4.2: Risk Assessment – Landslide
Hazard Mitigation Plan – Cattaraugus County, New York 5.4.2-8 December 2020
Jurisdiction
Total Number
of Buildings
Total Replacement
Cost Value (RCV)
Total (All Occupancies) Landslide Susceptibility Areas (Slope Degrees
>25%) Number of Buildings % Total RCV
% Total
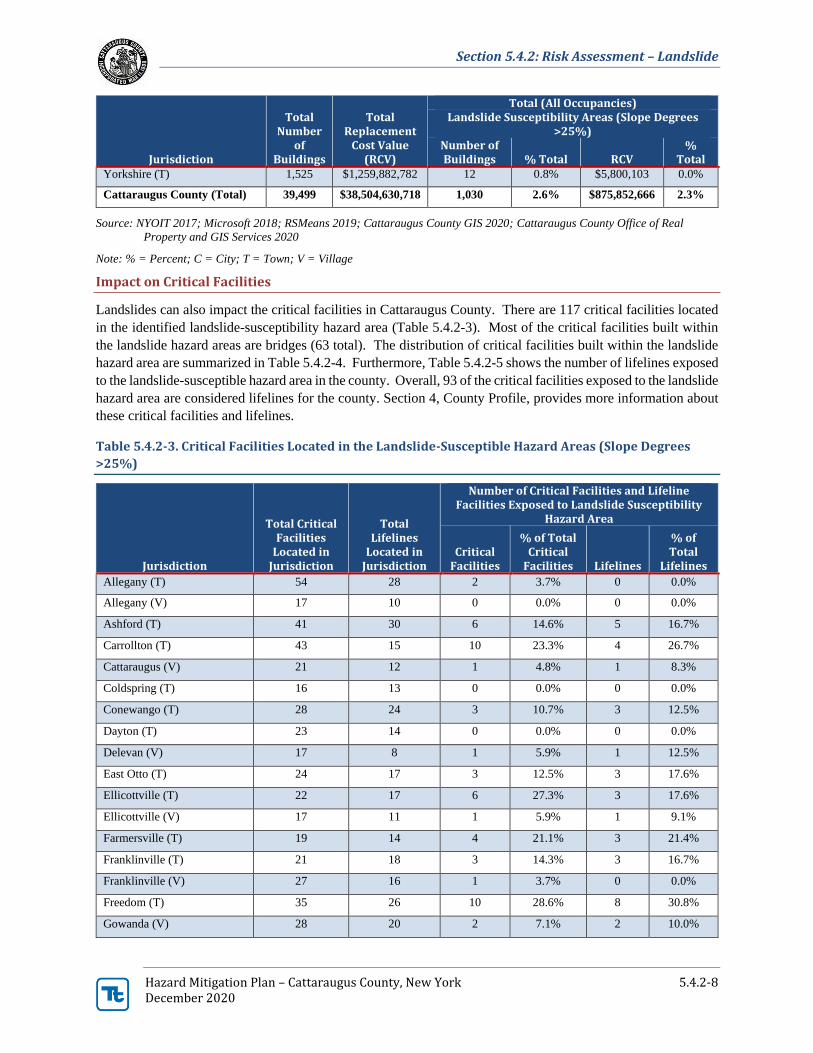
Yorkshire (T) 1,525 $1,259,882,782 12 0.8% $5,800,103 0.0%
Cattaraugus County (Total) 39,499 $38,504,630,718 1,030 2.6% $875,852,666 2.3%
Source: NYOIT 2017; Microsoft 2018; RSMeans 2019; Cattaraugus County GIS 2020; Cattaraugus County Office of Real
Property and GIS Services 2020
Note: % = Percent; C = City; T = Town; V = Village
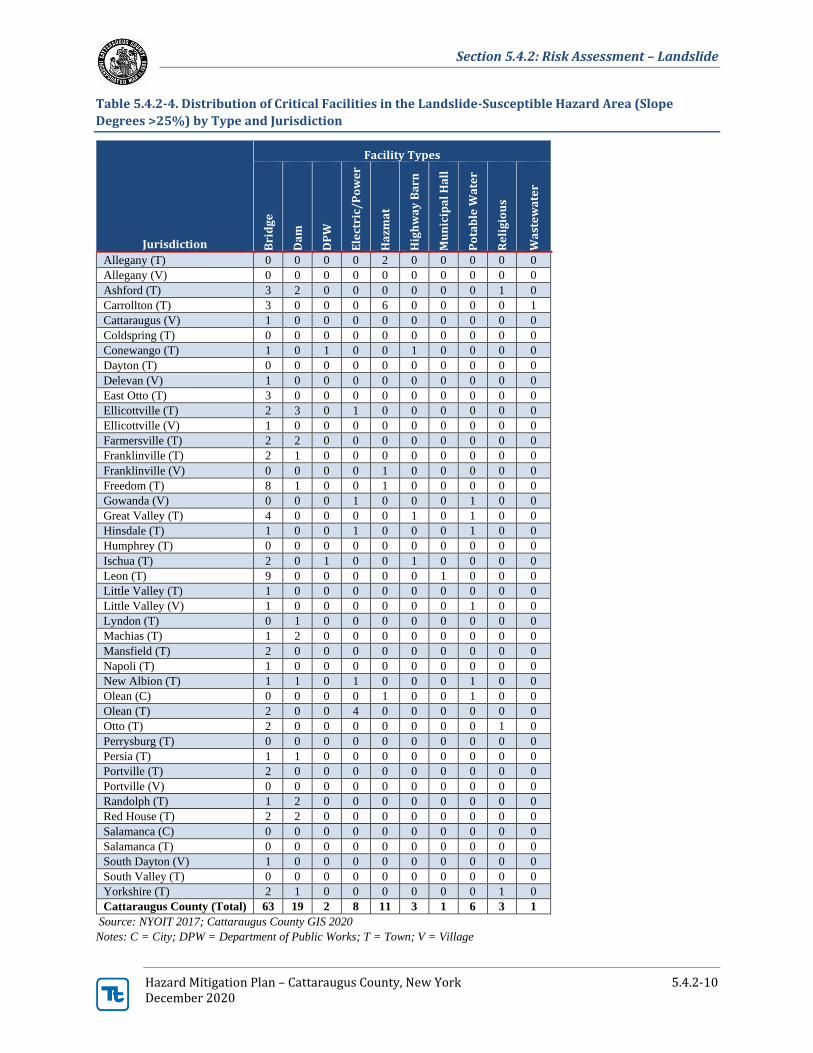
Impact on Critical Facilities
Landslides can also impact the critical facilities in Cattaraugus County. There are 117 critical facilities located
in the identified landslide-susceptibility hazard area (Table 5.4.2-3). Most of the critical facilities built within
the landslide hazard areas are bridges (63 total). The distribution of critical facilities built within the landslide
hazard area are summarized in Table 5.4.2-4. Furthermore, Table 5.4.2-5 shows the number of lifelines exposed
to the landslide-susceptible hazard area in the county. Overall, 93 of the critical facilities exposed to the landslide
hazard area are considered lifelines for the county. Section 4, County Profile, provides more information about
these critical facilities and lifelines.
Table 5.4.2-3. Critical Facilities Located in the Landslide-Susceptible Hazard Areas (Slope Degrees
>25%)
Jurisdiction
Total Critical Facilities
Located in Jurisdiction
Total Lifelines
Located in Jurisdiction
Number of Critical Facilities and Lifeline Facilities Exposed to Landslide Susceptibility
Hazard Area
Critical Facilities
% of Total Critical
Facilities Lifelines
% of Total
Lifelines
Allegany (T) 54 28 2 3.7% 0 0.0%
Allegany (V) 17 10 0 0.0% 0 0.0%
Ashford (T) 41 30 6 14.6% 5 16.7%
Carrollton (T) 43 15 10 23.3% 4 26.7%
Cattaraugus (V) 21 12 1 4.8% 1 8.3%
Coldspring (T) 16 13 0 0.0% 0 0.0%
Conewango (T) 28 24 3 10.7% 3 12.5%
Dayton (T) 23 14 0 0.0% 0 0.0%
Delevan (V) 17 8 1 5.9% 1 12.5%
East Otto (T) 24 17 3 12.5% 3 17.6%
Ellicottville (T) 22 17 6 27.3% 3 17.6%
Ellicottville (V) 17 11 1 5.9% 1 9.1%
Farmersville (T) 19 14 4 21.1% 3 21.4%
Franklinville (T) 21 18 3 14.3% 3 16.7%
Franklinville (V) 27 16 1 3.7% 0 0.0%
Freedom (T) 35 26 10 28.6% 8 30.8%
Gowanda (V) 28 20 2 7.1% 2 10.0%

Section 5.4.2: Risk Assessment – Landslide
Hazard Mitigation Plan – Cattaraugus County, New York 5.4.2-9 December 2020
Jurisdiction
Total Critical Facilities
Located in Jurisdiction
Total Lifelines
Located in Jurisdiction
Number of Critical Facilities and Lifeline Facilities Exposed to Landslide Susceptibility
Hazard Area
Critical Facilities
% of Total Critical
Facilities Lifelines
% of Total
Lifelines Great Valley (T) 26 19 6 23.1% 6 31.6%
Hinsdale (T) 37 25 3 8.1% 3 12.0%
Humphrey (T) 16 13 0 0.0% 0 0.0%
Ischua (T) 18 15 4 22.2% 4 26.7%
Leon (T) 32 29 10 31.3% 10 34.5%
Little Valley (T) 12 10 1 8.3% 1 10.0%
Little Valley (V) 26 19 2 7.7% 2 10.5%
Lyndon (T) 12 10 1 8.3% 1 10.0%
Machias (T) 28 17 3 10.7% 2 11.8%
Mansfield (T) 20 16 2 10.0% 2 12.5%
Napoli (T) 14 11 1 7.1% 1 9.1%
New Albion (T) 19 18 4 21.1% 4 22.2%
Olean (C) 113 51 2 1.8% 1 2.0%
Olean (T) 33 22 6 18.2% 6 27.3%
Otto (T) 17 13 3 17.6% 2 15.4%
Perrysburg (T) 20 14 0 0.0% 0 0.0%
Persia (T) 7 6 2 28.6% 2 33.3%
Portville (T) 21 15 2 9.5% 2 13.3%
Portville (V) 19 10 0 0.0% 0 0.0%
Randolph (T) 47 36 3 6.4% 2 5.6%
Red House (T) 9 6 4 44.4% 2 33.3%
Salamanca (C) 64 37 0 0.0% 0 0.0%
Salamanca (T) 4 3 0 0.0% 0 0.0%
South Dayton (V) 17 7 1 5.9% 1 14.3%
South Valley (T) 8 7 0 0.0% 0 0.0%
Yorkshire (T) 34 23 4 11.8% 2 8.7%
Cattaraugus County (Total) 1,126 745 117 10.4% 93 12.5%
Source: NYOIT 2017; Cattaraugus County GIS 2020
Notes: % = Percent; C = City; T = Town; V = Village
Section 5.4.2: Risk Assessment – Landslide
Hazard Mitigation Plan – Cattaraugus County, New York 5.4.2-10 December 2020
Table 5.4.2-4. Distribution of Critical Facilities in the Landslide-Susceptible Hazard Area (Slope
Degrees >25%) by Type and Jurisdiction
Jurisdiction
Facility Types
Bri
dg
e
Da
m
DP
W
Ele
ctri
c/P
ow
er
Ha
zma
t
Hig
hw
ay
Ba
rn
Mu
nic
ipa
l H
all
Po
tab
le W
ate
r
Re
lig
iou
s
Wa
ste
wa
ter
Allegany (T) 0 0 0 0 2 0 0 0 0 0
Allegany (V) 0 0 0 0 0 0 0 0 0 0
Ashford (T) 3 2 0 0 0 0 0 0 1 0
Carrollton (T) 3 0 0 0 6 0 0 0 0 1
Cattaraugus (V) 1 0 0 0 0 0 0 0 0 0
Coldspring (T) 0 0 0 0 0 0 0 0 0 0
Conewango (T) 1 0 1 0 0 1 0 0 0 0
Dayton (T) 0 0 0 0 0 0 0 0 0 0
Delevan (V) 1 0 0 0 0 0 0 0 0 0
East Otto (T) 3 0 0 0 0 0 0 0 0 0
Ellicottville (T) 2 3 0 1 0 0 0 0 0 0
Ellicottville (V) 1 0 0 0 0 0 0 0 0 0
Farmersville (T) 2 2 0 0 0 0 0 0 0 0
Franklinville (T) 2 1 0 0 0 0 0 0 0 0
Franklinville (V) 0 0 0 0 1 0 0 0 0 0
Freedom (T) 8 1 0 0 1 0 0 0 0 0
Gowanda (V) 0 0 0 1 0 0 0 1 0 0
Great Valley (T) 4 0 0 0 0 1 0 1 0 0
Hinsdale (T) 1 0 0 1 0 0 0 1 0 0
Humphrey (T) 0 0 0 0 0 0 0 0 0 0
Ischua (T) 2 0 1 0 0 1 0 0 0 0
Leon (T) 9 0 0 0 0 0 1 0 0 0
Little Valley (T) 1 0 0 0 0 0 0 0 0 0
Little Valley (V) 1 0 0 0 0 0 0 1 0 0
Lyndon (T) 0 1 0 0 0 0 0 0 0 0
Machias (T) 1 2 0 0 0 0 0 0 0 0
Mansfield (T) 2 0 0 0 0 0 0 0 0 0
Napoli (T) 1 0 0 0 0 0 0 0 0 0
New Albion (T) 1 1 0 1 0 0 0 1 0 0
Olean (C) 0 0 0 0 1 0 0 1 0 0
Olean (T) 2 0 0 4 0 0 0 0 0 0
Otto (T) 2 0 0 0 0 0 0 0 1 0
Perrysburg (T) 0 0 0 0 0 0 0 0 0 0
Persia (T) 1 1 0 0 0 0 0 0 0 0
Portville (T) 2 0 0 0 0 0 0 0 0 0
Portville (V) 0 0 0 0 0 0 0 0 0 0
Randolph (T) 1 2 0 0 0 0 0 0 0 0
Red House (T) 2 2 0 0 0 0 0 0 0 0
Salamanca (C) 0 0 0 0 0 0 0 0 0 0
Salamanca (T) 0 0 0 0 0 0 0 0 0 0
South Dayton (V) 1 0 0 0 0 0 0 0 0 0
South Valley (T) 0 0 0 0 0 0 0 0 0 0
Yorkshire (T) 2 1 0 0 0 0 0 0 1 0
Cattaraugus County (Total) 63 19 2 8 11 3 1 6 3 1
Source: NYOIT 2017; Cattaraugus County GIS 2020
Notes: C = City; DPW = Department of Public Works; T = Town; V = Village

Section 5.4.2: Risk Assessment – Landslide
Hazard Mitigation Plan – Cattaraugus County, New York 5.4.2-11 December 2020
Table 5.4.2-5. Lifelines Exposed to the Landslide-Susceptible Hazard Area (Slope Degrees >25%)
FEMA Lifeline Category Number of
Lifelines
Number of Lifelines Exposed to Landslide
Susceptible Hazard Area
Communications 10 0
Energy 94 8
Food, Water, Shelter 90 10
Health and Medical 50 0
Safety and Security 208 12
Transportation 293 63
Cattaraugus County (Total) 745 93
Source: NYOIT 2017; Cattaraugus County GIS 2020; FEMA 2020
In addition to critical facilities, a significant amount of infrastructure can be exposed to mass movements of
geological material:
▪ Roads—Access to major roads is crucial to life-safety after a disaster event and to response and recovery
operations. Landslides can block egress and ingress on roads, causing isolation for neighborhoods,
traffic problems, and delays for public and private transportation. This can result in economic losses for
businesses.
▪ Bridges—Landslides can significantly impact road bridges. Mass movements can knock out bridge
abutments or significantly weaken the soil supporting them, making them hazardous for use.
▪ Power Lines—Power lines are generally elevated above steep slopes; but the towers supporting them
can be subject to landslides. A landslide could trigger failure of the soil underneath a tower, causing it
to collapse and ripping down the lines. Power and communication failures due to landslides can create
problems for vulnerable populations and businesses.
▪ Rail Lines – Similar to roads, rail lines are important for response and recovery operations after a
disaster. Landslides can block travel along the rail lines, which would become especially troublesome,
because it would not be as easy to detour a rail line as it is on a local road or highway. Many residents
rely on public transport to get to work around the county and into Philadelphia and New York City, and
a landslide event could prevent travel to and from work.
Impact on the Economy
The impact of a landslide on the economy and estimated dollar losses are difficult to measure. As stated earlier,
landslides can exert direct and indirect effects on society. Direct costs include actual damage sustained by
buildings, property, and infrastructure and estimated costs to repair or replace damaged buildings. Indirect costs
include clean-up costs, business interruption, loss of tax revenues, reduced property values, and loss of
productivity. The 2019 NYS HMP shows that Cattaraugus County has experienced zero economic damages
from landslide events between 1996 and 2017 (NYS HMP 2019). Historic losses discussed earlier in this section
also show that Cattaraugus County has not experienced any economic losses from landslides. Therefore, the
impact landslides have on the economy for Cattaraugus County is minimal.
Impact on the Environment
A landslide or sinkhole/subsidence event will alter the landscape. In addition to changes in topography,
vegetation and wildlife habitats may be damaged or destroyed, and soil and sediment runoff will accumulate
downslope potentially blocking waterways and roadways and impacting quality of streams and other water
bodies. Additional environmental impacts include loss of forest productivity.

Section 5.4.2: Risk Assessment – Landslide
Hazard Mitigation Plan – Cattaraugus County, New York 5.4.2-12 December 2020
Furthermore, soil and sediment runoff can accumulate downslope potentially blocking waterways and roadways
and impacting quality of streams and other water bodies. Mudflows that erode into downstream waterways can
threaten the life of freshwater species (USGS 2020). The impacts of eroded landscape can travel for miles
downstream into adjacent waterways and create issues for surrounding watersheds.
Figure 5.4.2-1 shows landslide susceptibility (i.e., where slope degrees are greater than 25 percent) in
Cattaraugus County. Overall, 23.7 percent of Cattaraugus County is susceptible to landslide events (200,386
acres).
Cascading Impacts on Other Hazards
Landslide events can have cascading impacts on utility failure in Cattaraugus County. As discussed in earlier
sections, landslides may disrupt the functionality of utilities if the debris falls, topples, or spreads over the utilities
providing services to the county. For example, electric utilities may become disconnected if power lines are
broken from displaced geologic material. Water utilities may become breached with excess debris and/or
contaminates carried by landslide events. More information about utility interruptions can be found in Section
5.4.5, Utility Failure.
Future Changes that May Impact Vulnerability
Understanding future changes that impact vulnerability in the county can assist in planning for future
development and ensuring that appropriate mitigation, planning, and preparedness measures are in place. The
County considered the following factors to examine potential conditions that may affect hazard vulnerability:
• Potential or projected development
• Projected changes in population
• Other identified conditions as relevant and appropriate, including the impacts of climate change
Projected Development
As discussed in Section 4, areas targeted for future growth and development have been identified across the
county. Any areas of growth located in the landslide-susceptible hazard areas could be potentially impacted by
the geologic ground movement caused by landslides. It is recommended that the county and jurisdictional
partners implement design strategies that mitigate against the risk of landslides. The maps in the jurisdictional
annexes in Section 9 show new development locations throughout the county and their proximity to the landslide-
susceptible hazard areas (i.e., where slope degrees are greater than 25 percent).
Projected Changes in Population
According to the U.S. Census Bureau, the population in Cattaraugus County has decreased by approximately 5.3
percent between 2010 and 2019 (U.S. Census Bureau 2020). Estimated population projections provided by the
2017 Cornell Program on Applied Demographics indicates that the county’s population will continue to decrease
into 2040, reducing total population to approximately 63,500 persons (Cornell Program on Applied
Demographics 2017). While less people will reside in the county, those that remain may move into areas that
are susceptible to landslide events. Section 4, County Profile, provides additional discussion on population
trends.
Climate Change
A direct impact of climate change on landslides is difficult to determine. However as discussed earlier, multiple
secondary effects of climate change have the potential to increase the likelihood of landslides. Warming
temperatures resulting in wildfires would reduce vegetative cover along steep slopes and destabilize the soils
Section 5.4.2: Risk Assessment – Landslide
Hazard Mitigation Plan – Cattaraugus County, New York 5.4.2-13 December 2020
due to destruction of the root system; increased intensity of rainfall events would increase saturation of soils on
steep slopes. Under these future conditions, the county’s assets located on or at the base of these steep slopes
will have an increased risk to landslides. Roadways and other transportation infrastructure located in these areas
will also be at an increased risk of closure, which would impact the county’s risk as described above.
Change of Vulnerability Since 2014 HMP
Because of the county’s negligible risk to landslides, the 2014 HMP included a qualitative assessment of the
county’s population, building stock, and critical facilities within the identified landslide hazard area. For this
HMP, 2017 slope data from the New York Office of Information Technology Services (NYOIT) were referenced
to determine areas within Cattaraugus County that have slope degrees greater than 25 percent. Population
statistics have also been updated using the 5-Year 2014-2018 American Community Survey Population
Estimates. The general building stock was updated using RSMeans 2019 building valuations that estimated
replacement cost value for each building in the inventory. Updated 2018 building stock data downloaded from
Microsoft were utilized to update the user-defined facility inventory and critical facility inventory dataset. Parcel
information from the Cattaraugus tax assessor was used to update building attributes, such as year built, number
of stories, basement type, property class, and square footage.
Overall, this vulnerability assessment uses a more accurate and updated building inventory than that used in the
2014 HMP. This information provides more accurate exposure and potential loss estimates for Cattaraugus
County.