section 5.2 - graphs of the sine and cosine functions
TRANSCRIPT

1
Section 5.2 - Graphs of the Sine and Cosine Functions In this section, we will graph the basic sine function and the basic cosine function and then graph other sine and cosine functions using transformations. Much of what we will do in graphing these problems will be the same as earlier graphing using transformations. Definition: A non-constant function f is said to be periodic if there is a number p > 0 such that ( ) ( )f x p f x+ = for all x in the domain of f. The smallest such number p is called the period of f. The graphs of periodic functions display patterns that repeat themselves at regular intervals. Definition: For a periodic function f with maximum value M and minimum value m. The amplitude of the function is: .
2mM −
In other words the amplitude is half the height.

2
Example 1: State the period and amplitude of the periodic function.

3
Example 2: State the period and amplitude of the periodic function:

4
Graph of Sine Function: Now, we will graph the basic sine function ( ) sin( )f x x= . The domain of this function is ( )∞∞− , and the range is [-1, 1]. We typically graph just one complete period of the graph, that is on the interval [ ]π2,0 . We’ll make a table of values for ( ) sin( )f x x= :
x 0 6π
4π
3π
2π
3
2π
4
3π 6
5π
π 6
7π
4
5π 3
4π 2
3π
3
5π 4
7π 6
11π
π2
sinx
0 21
22
23
1 23
22
21 0
21
−
22
−
23
−
-1 23
−
22
−
21
− 0
Then using these ordered pairs, we can sketch a graph of the function.
5
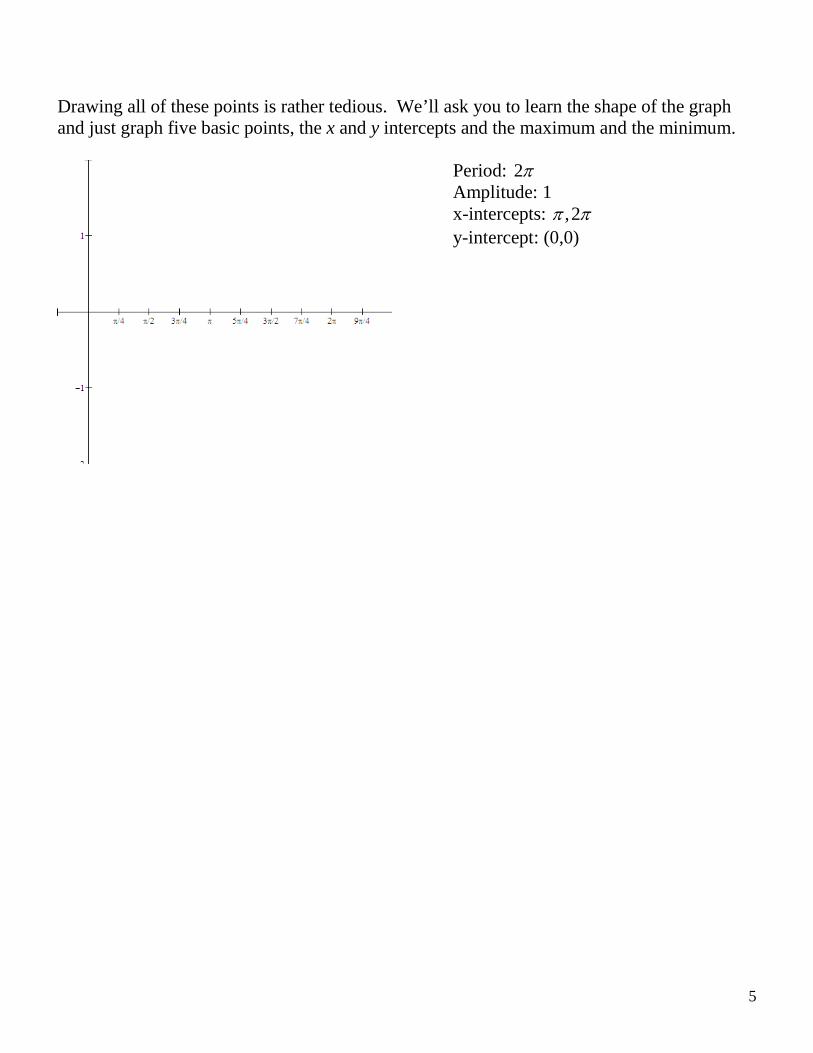
Drawing all of these points is rather tedious. We’ll ask you to learn the shape of the graph and just graph five basic points, the x and y intercepts and the maximum and the minimum.
Period: 2π Amplitude: 1 x-intercepts: ,2π π y-intercept: (0,0)
6
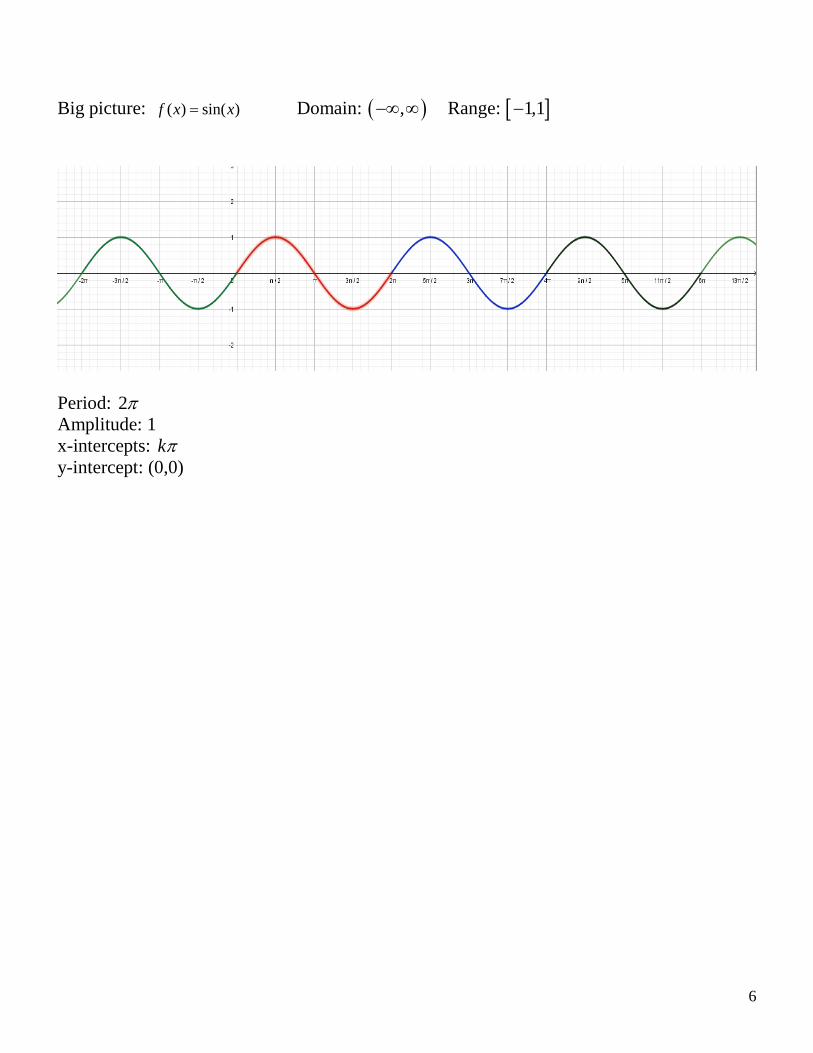
Big picture: )sin()( xxf = Domain: ( ),−∞ ∞ Range: [ ]1,1−
Period: 2π Amplitude: 1 x-intercepts: kπ y-intercept: (0,0)
7
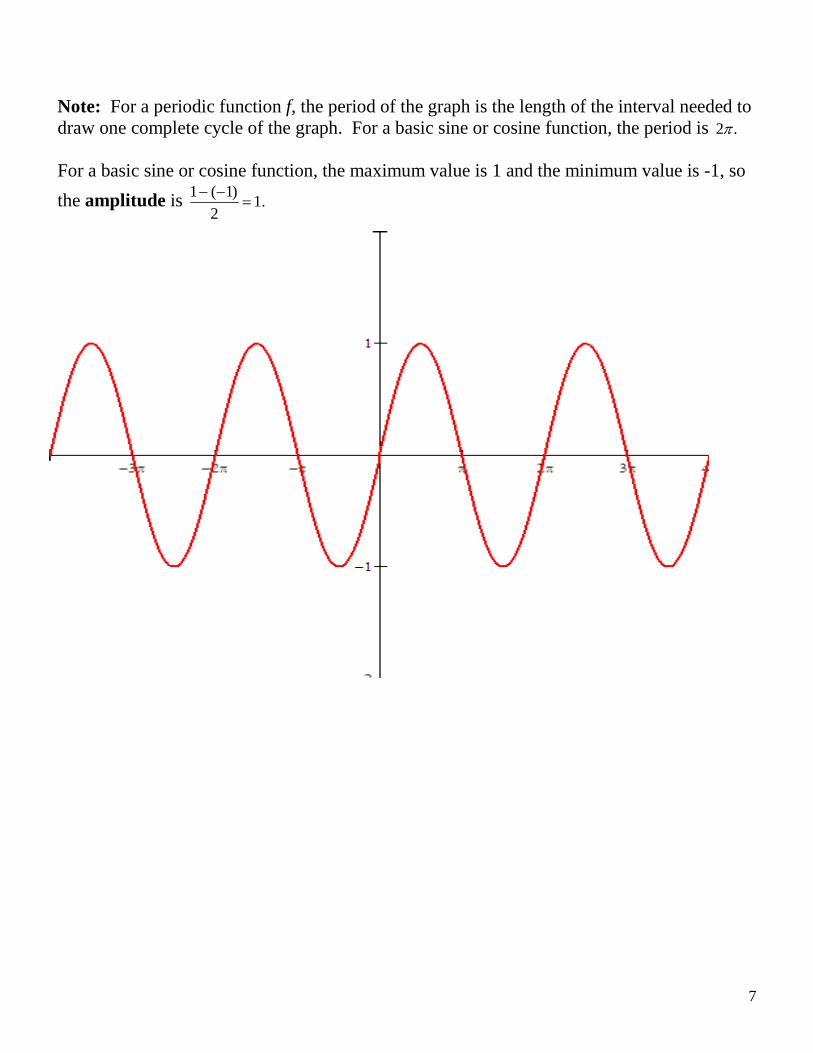
Note: For a periodic function f, the period of the graph is the length of the interval needed to draw one complete cycle of the graph. For a basic sine or cosine function, the period is .2π For a basic sine or cosine function, the maximum value is 1 and the minimum value is -1, so the amplitude is .1
2)1(1=
−−

8
Graph of Cosine Function Now we’ll repeat the process for the basic cosine function )cos()( xxf = . The domain of this function is ( )∞∞− , and the range is [-1, 1]. Again, we typically graph just one complete period of the graph, that is on the interval [ ]π2,0 . Here is the table of values for )cos()( xxf = : x 0
6π
4π
3π
2π
3
2π
4
3π 6
5π π 6
7π 4
5π 3
4π
2
3π
3
5π
4
7π
6
11π
π2
cosx
1 23
22
21 0
21
−
22
−
23
−
-1 2
3−
22
−
21
−
0 21
22
23 1
Now we’ll graph these ordered pairs.

9
For the basic cosine graph, you’ll need to remember the basic shape and graph the x and y intercepts as well as the maximum and minimum points. Period: 2π
Amplitude: 1
x-intercepts: 3,2 2π π
y-intercept: (0,1)

10
Big picture: )cos()( xxf = Domain: ( ),−∞ ∞ Range: [ ]1,1−
Period: 2π Amplitude: 1
x-intercepts: 2
kπ ( k is an odd integer)
y-intercept: (0,1)

11
Transformations of basic sine and cosine functions: Now we’ll turn our attention to transformations of the basic sine and cosine functions. These functions will be of the form .)cos()(or)sin()( DCBxAxgDCBxAxf +−=+−= We can stretch or shrink sine and cosine functions, both vertically and horizontally. We can reflect them about the x axis, the y axis or both axes, and we can translate the graphs either vertically, horizontally or both. Next we’ll see how the values for A, B, C and D affect the graph of the sine or cosine function.
Graphing ( ) sin( ) or ( ) cos( )f x A Bx C D g x A Bx C D= − + = − +
• The amplitude of the graph of is A . Maximum value is A D+ and minimum value is A D− + .
• The period of the function is: .2Bπ
• If A > 1, this will stretch the graph vertically.
0 < A < 1, this will shrink the graph vertically If A < 0, the graph will be a reflection about the x axis.
• If B >1 , this will shrink the graph horizontally by a factor of 1/B. If 0<B<1, this will stretch the graph horizontally by a factor of 1/B.
• Vertical Shift: Shift the original graph D units UP if D > 0, D units DOWN if D < 0.
• Phase shift: The function will be shifted BC units to the right if 0>
BC and to the left if
0<BC . The number
BC is called the phase shift.
Note: Horizontal Shift: If the function is of the form )sin()( Cxxf −= or
)cos()( Cxxf −= , then shift the original graph C units to the RIGHT if C > 0 and C units to the LEFT if C < 0.

12
Vertical Stretch/Shrink: Reflection about x-axis:

13
Horizontal Stretch or Shrink: Vertical Shift:

14
Horizontal Shift/Phase Shift: A combination of transformations:

15
Example 3: Investigate the following functions.
a) ( ) sin(4 )f x x= Period:
Amplitude:
Transformations: Horizontal Shrinking

16
b) 1( ) cos 12
f x x = −
Period:
Amplitude:
Transformations: Horizontal Stretch Vertical Shift: 1 unit downward.

17
c) ( )( ) 4cos 2 1f x x π= − + Period: Amplitude: Maximum Value: Minimum Value:
Transformations: Horizontal shrinking,
Phase shift: 2π to the right.
Vertical shift: 1 unit upward. Vertical Stretch – by a factor of 4.

18
d) ( )( ) 5sin 4f x x π= − + Period: Amplitude:
Maximum Value: Minimum Value:
Transformations:
Horizontal shrinking,
Phase shift: 4π to the left.
Reflect about the x-axis. Vertical Stretch – by a factor of 5.

19
e) ( ) 5sin 42 8xf x π π = − −
Period:
Amplitude:
Maximum Value:
Minimum Value:
Transformations:
Horizontal shrinking
Phase shift: / 8 1/ 2 4
ππ
= to the right.
Vertical shift: 4 units down. Vertical stretch – by a factor of 5.

20
POPPER for Section 5.2 Question#1: Find the period of the function: ( ) 2sin(4 1) 3f x x= − + .
A) 2 B) 4
C) 2π
D) 2π
E) 4π
F) None of these

21
Note: Many times, we will be graphing the given functions over one period. If the function has a phase shift, it can be helpful to identify the starting and ending points for one period of the graph. To do this, solve the equations .2 and 0 π=−=− CBxCBx
( )( ) 5cos 2f x x π= − ; starting point: 2 02
x x ππ− = → =
ending point: 32 2 2 32
x x x ππ π π− = → = → =

22
Now, we will graph some functions. You will need to identify the transformations required to change a basic sine or cosine function to the desired one. You must know the five key points on a basic sine function and the five key points on a basic cosine function. Using the information about the amplitude, reflections, vertical and horizontal stretching or shrinking and vertical and horizontal translations, you will be able to correctly plot the translated key points and sketch the desired function. Example 4: Sketch over one period: ( )( ) 4sinf x x=
x ( )( ) 4sinf x x= 0
2π
π
32π
2π

23
Example 5: Sketch over one period: ( )( ) 2cos 1f x x= + . State the range of this function.
x ( )( ) 2cos 1f x x= + 0
2π
π
32π
2π

24
Example 6: Sketch over one period: ( )( ) 3sin 2f x x= . State the range of this function.
x ( )( ) 3sin 2f x x= 0
4π
2π
32π
π

25
Example 7: Sketch over one period: ( ) 4cos 12xf x = −
. State the range of this function.
x ( ) 4cos 1
2xf x = −
0
π
2π
3π
4π

26
Example 8: Sketch over one period: ( ) 2cos2
f x x π = − −
using transformations.

27
POPPER for Section 5.2 Question#2: List all of the x-intercepts for the function ( ) 4sin(2 )f x x= over the interval [ ]0,π .
A) 0,x x π= =
B) 0,2
x x π= =
C) 0, ,4
x x xπ π= = =
D) 0, ,2
x x xπ π= = =
E) 0, , ,4 2
x x x xπ π π= = = =
F) None of these

28
Example 9: Consider the graph: Write an equation of the form DCBxAxf +−= )sin()( or an equation of the form DCBxAxf +−= )cos()( which could be used to represent the graph. Note: these answers are not unique!

29
Example 10: Consider the graph: Write an equation of the form DCBxAxf +−= )sin()( or an equation of the form DCBxAxf +−= )cos()( which could be used to represent the graph. Note: these answers are not unique!

30
Example 11: Determine the function of the form )sin()( BxAxf = given the following graph:

31
Example 12: Determine the function of the form DCBxAxf +−= )sin()( given the following graph:
32
Modeling Using Sinusoidal Functions Sine and cosine functions model many real-world situations. Physical phenomenon such as tides, temperatures and amount of sunlight are all things that repeat themselves, and so are easily modeled by sine and cosine functions (collectively, they are called “sinusoidal functions”). Here are some other situations that can be modeled by a sinusoidal function:
• Suppose you are on a Ferris wheel at a carnival. Your height (as you are sitting in your seat) varies sinusoidally.
• Suppose you are pushing your child as s/he sits in a swing. Your child’s height varies sinusoidally.
• The motion of a swinging pendulum varies sinusoidally. • Stock prices sometimes vary sinusoidally.
We’ll work a couple of examples involving sinusoidal variation. Recall: Given the functions DCBxAxf +−= )sin()( or DCBxAxf +−= )cos()( ; The period is:
Bπ2
The amplitude is: A The vertical shift is: D (up if positive) The horizontal shift is
BC (to the right if positive)

33
Example 1: Determine the equation of the sine function which has amplitude is 5, the phase shift is 4 to the left, the vertical shift is 3 down, and the period is 2.
34
Example 2: The function )2sin(40120)( ttP π+= models the blood pressure (in millimeters of mercury) for a person; t represents seconds. What is the period of this function? What is the amplitude? What is the maximum blood pressure? What is the minimum blood pressure?
35
Example 3: The number of hours of daylight in Boston is given by
12)79(3652sin3)( +
−= xxf π where x is the number of days after January 1. What is the:
a. amplitude? b. period? c. maximum value of f(x)? d. minimum value of f(x)?

36
Example 4: Assume that you are aboard a research submarine doing submerged training exercises in the Pacific Ocean. At time t = 0 you start porpoising (alternately deeper and then shallower). At time t = 4 min you are at your deepest, y = – 1000 m. At time t = 9 min you next reach your shallowest, y = –200 m. Assume that y varies sinusoidally with time. Find an equation expressing y as a function of t.
A) ( ) 20045
cos600)( −
−−= ttf π
B) ( ) 60045
cos400)( −
−−= ttf π
C) ( ) 40045
cos200)( −
−−= ttf π
D) ( ) 40045
cos600)( −
−−= ttf π
E) ( ) 600915
cos400)( −
−−= ttf π
37
Example 5: A signal buoy in the Gulf of Mexico bobs up and down with the height h of its transmitter (in feet) above sea level modeled by 5)sin()( += BtAth . During a small squall its height varies from 1 ft to 9 ft and there are 4 seconds from one 9-ft height to the next. What are the values of the constants A and B?

38
POPPER for SECTION 5.2 Question #3: Let ( )f x be a sine function with Amplitude: 4, period: π , phase shift: none, vertical shift: 1 unit up. Which of the following can be the formula for ( )f x ? a) ( ) 4sin(2 1) 1f x x= − + b) ( ) 4sin(2 ) 1f x x= − c) ( ) 4sin(2 ) 1f x x= + d) ( ) 4sin(4 ) 1f x x= + e) ( ) 4sin( ) 1f x xπ= + f) None of these