section 3 summary of 2002 and 2003 monitoring data
TRANSCRIPT

2002/3 Water Quality Status Report for Marine Waters Section 3 King County Department of Natural Resources & Parks Summary of 2002/3 Monitoring Data
SECTION 3 Summary of 2002 and 2003 Monitoring Data
This section summarizes data collected in 2002 and 2003 from the ambient, outfall, and Marine Outfall Siting Study (MOSS) monitoring programs. A total of 47 stations were sampled in 2002; 26 ambient, 12 outfall, and 9 MOSS stations. A total of 34 stations were sampled in 2003; 22 ambient and 12 outfall. The MOSS sampling program ended in 2002. In 2003, two stations previously sampled for the MOSS program, ITEDWARDSPT and ITCARKEEKP, were added to the ambient monitoring program. Other changes to the ambient program in 2003 included the addition of a new water column station in East Passage (NSEX01) and the discontinuation of station KSRU02 located in the Lake Washington Ship Canal. Station LTBC41, which is part of the outfall monitoring program, was replaced in 2003 by a new locator, LTBC42, to reflect the offshore location of the newly extended Denny Way CSO outfall. Offshore sediments were sampled in 2002 for the ambient program. No outfall offshore sediments were sampled in either 2002 or 2003. All data for stations monitored are presented in Appendices A through F. Station locator maps are provided in Section 2, along with specific station information such as matrix, parameters, and frequency measured. Also included in this section is a summary of 2002 and 2003 precipitation data as pollutants, particularly fecal indicator bacteria, may increase in nearshore and offshore waters following rainstorms. A summary of results for specific parameters (e.g., salinity, bacteria, metals) and matrices (e.g., water, sediment, shellfish) are provided. A discussion of the results for the ambient, outfall, and MOSS samples are combined in order to facilitate the interpretation of the data. Each matrix is discussed separately. 3.1 2002 and 2003 Precipitation Data Monthly total precipitation data for 2002 and 2003 were obtained from the National Climatic Data Center and are shown in Figure 3-1. The rainfall totals were measured at the Sea-Tac International Airport station (station #24233). The data do not include snow or ice pellet accumulations, as the 30-year average does not include these data. A drier than normal year occurred in 2002, with a total annual rainfall of 31.36 inches compared to 36.54 inches for the 30-year average. A wetter than normal year occurred in 2003 with a total annual precipitation total of 41.78 inches. A total of 8.96 inches of rain fell in October with 5.02 inches falling in a single day on October 20, 2003. This was the wettest day in Seattle weather history since 1891. If the five inches that fell on October 20 are excluded from the annual rainfall total, 2003 would have been an average rainfall year.
Between August and November, 2002 was an unusually dry year with only 4.64 inches of rain recorded compared to the 30-year average of 11.79 inches during those same months. This prolonged dry spell also brought warm temperatures and was the driest period during these
45

2002/3 Water Quality Status Report for Marine Waters Section 3 King County Department of Natural Resources & Parks Summary of 2002/3 Monitoring Data
01
23
456
78
910
Janu
ary
Febr
uary
Mar
ch
Apr
il
May
June
July
Aug
ust
Sep
tem
ber
Oct
ober
Nov
embe
r
Dec
embe
r
Rai
nfal
l (in
ches
)2002 Monthly total2003 Monthly total30 yr. average
Figure 3-1. Monthly Precipitation for 2002 and 2003
months since 1987. Rainfall between July and September, historically among the driest months of the year, accounted for only 1.1% of the total annual rainfall amount. The driest months in 2003 were June through September, accounting for less than 1% of the total annual rainfall. Conversely, January, March, and October rainfall totals were above average in 2003 and the remaining months had typical rainfall amounts.
Rainfall is recorded at the Vashon Treatment Plant, which is located on the northeastern side of Vashon Island (see Figure 1-1 for plant location). Rainfall amounts were higher at this location than at the Sea-Tac station. Annual totals at the Vashon TP were 45.00 and 49.16 inches in 2002 and 2003, respectively. Monthly totals for 11 months (all except July) during 2002 were all higher at the Vashon TP than the monthly rainfall amounts recorded at Sea-Tac and 9 months in 2003 had higher monthly totals than Sea-Tac. Figure 3-2 shows monthly rainfall totals at Sea-Tac and the Vashon TP for the past four years.
0
2
4
6
8
10
12
Jan-
00
Mar
-00
May
-00
Jul-0
0
Sep-
00
Nov
-00
Jan-
01
Mar
-o1
May
-o1
Jul-o
1
Sept
-o1
Nov
-o1
Jan-
02
Mar
-02
May
-02
Jul-0
2
Sep-
02
Nov
-02
Jan-
03
Mar
-03
May
-03
Jul-0
3
Sep-
03
Nov
-03
Rai
nfal
l (in
ches
)
Sea-Tac rainfallVashon TP rainfall
Figure 3-2. Monthly Precipitation Totals at the Vashon TP and Sea-Tac Stations
46

2002/3 Water Quality Status Report for Marine Waters Section 3 King County Department of Natural Resources & Parks Summary of 2002/3 Monitoring Data 3.2 Water Column Data Results Water column sampling is a large component of the County's water quality monitoring program and includes offshore and beach sites (see Figures 2-1 and 2-2). The monitoring program is structured to detect natural seasonal changes in the water column and to identify anthropogenic inputs and influences. Water quality parameters, including temperature, salinity, turbidity, dissolved oxygen, total suspended solids, Secchi disk transparency, light intensity, chlorophyll-a, pheophytin, photosynthetically active radiation, and nutrients (ammonia, nitrate+nitrite, and total phosphorus) were measured at 11 offshore stations in both 2002 and 2003 (see Tables 2-2 through 2-5). Temperature, salinity and nutrients were measured monthly at 9 beach stations in 2002 and twice at 8 other beach stations in 2002. In 2003, temperature, salinity and nutrients were measured monthly at 9 stations. Dissolved metals were measured at 10 beach stations in 2002. Fecal indicator bacteria (fecal coliforms and enterococci) were monitored monthly at 21 beach stations and 11 offshore stations and 6 times (May through October) at 3 stations in 2002. Bacteria were monitored twice (January and February) at six MOSS stations in order to complete two full years of sampling at those stations. E. coli was also monitored at the MOSS beach stations. Bacteria were monitored monthly at 20 beach and 11 offshore stations in 2003 and 6 times at 3 stations. At the sites where only bacteria was monitored (i.e., salinity and nutrients were not measured), temperature data were also collected. All water column data are provided in Appendix A. 3.2.1 Bacteria Both fecal coliforms and enterococci were monitored at all water stations. In addition, E. coli was monitored at the MOSS stations. Data from the freshwater stations located in Piper’s Creek (KTHA01) and the Lake Washington Ship Canal (KSRU02) are compared to freshwater fecal coliform standards and all other stations are compared to the marine fecal coliform standards. Washington State primary contact recreation fecal coliform standards for surface marine waters (formerly Class AA designation) state that organism counts shall not exceed a geometric mean value of 14 colonies/100 ml and not more than 10 percent of the samples used to calculate the geometric mean may exceed 43 colonies/100 ml. Freshwater standards for primary contact recreation (formerly Class A designation) state that organism counts shall not exceed a geometric mean value of 100 colonies/100 ml and not more than 10 percent of the samples used to calculate the geometric mean may exceed 200 colonies/100 ml (WAC 173-201, 2003). Freshwater standards for secondary contact recreation (formerly Class B designation) state that organism counts shall not exceed a geometric mean value of 200 colonies/100 ml and not more than 10 percent of the samples used to calculate the geometric mean may exceed 400 colonies/100 ml (WAC 173-201, 2003). Values from station KSRU02 in the Ship Canal were compared to the primary contact standard and values from KTHA01 in Piper’s Creek were be compared to the secondary contact standard. Previously, King County used results from the 30 most recent surface samples to calculate geometric mean values in accordance with guidelines from the National Shellfish Sanitation Program (NSSP, 1995). The 2003 update to Washington’s Water
47

2002/3 Water Quality Status Report for Marine Waters Section 3 King County Department of Natural Resources & Parks Summary of 2002/3 Monitoring Data Quality Standards for Surface Waters states that when calculating the geometric mean, only results within a 12-month period should be used and be well distributed throughout the reporting period. As samples are collected monthly for bacteria testing, a total of 12 sample results are available to calculate the geometric mean. Although, changes to the fecal coliform standards have not yet been approved by EPA, geometric mean results using 12 sample points will be reported for compliance with bacteria standards in anticipation of EPA approval. Geometric means calculated using the 30 most recent sample points are also provided in Appendix A for comparative purposes. Offshore. All offshore water column stations at ambient and outfall sites met the primary contact fecal coliform geometric mean and peak standards in both 2002 and 2003. Figure 3-3 shows fecal coliform values detected in surface waters (collected one meter below the surface) at all offshore stations in both 2002 and 2003. Over 75% of the samples collected in 2002 and 2003 at both ambient and outfall sites had either no detectable fecal coliforms or contained 1 colony forming unit (CFU)/100 ml. Stations along the Seattle waterfront in Elliott Bay had the highest values of all the offshore stations. Samples were collected at multiple depths at the five wastewater and CSO treatment plant outfalls and at the Denny Way CSO outfall in order to assess fecal coliform levels throughout the water column at these sites. Fecal coliform levels were not higher near the discharge depth and the majority of water column samples had no detectable fecal coliform levels. Table 3-1 provides a summary of the fecal coliform levels detected at various depths at the West Point and South Plant outfalls which have continuous discharges and the highest flows of the three WWTPs.
151
2812 19
312 7 3 1 0 1 0 1
0
40
80
120
160
0 1 2 4 5 10 20 30 40 50 100 150 >150
Counts (cfu/100 ml)
Num
ber o
f Sam
ples
Figure 3-3. Fecal Coliforms in Surface Waters at
Offshore Stations in 2002 and 2003 Enterococci were not detected in the majority of offshore surface water samples in both 2002 and 2003. For the two years combined, 62% of the samples had no detectable levels and 15% had enterococci values of 1 CFU/100 ml. As seen with fecal coliforms, the highest enterococci values
48
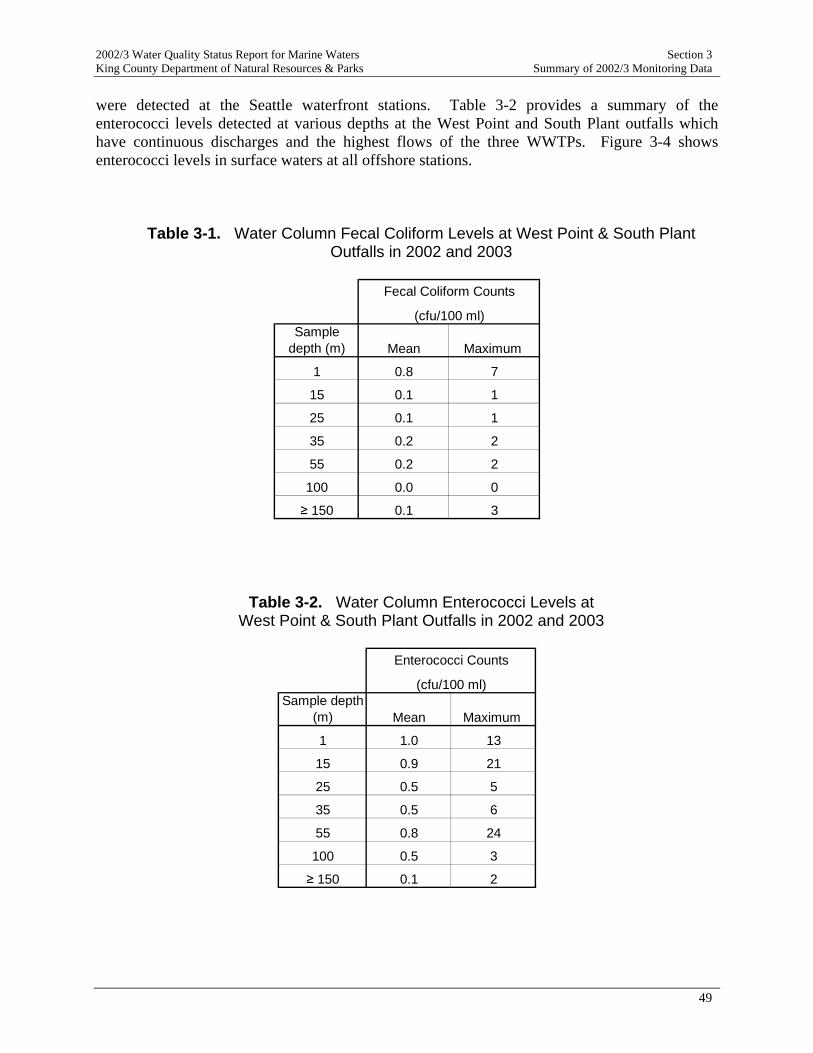
2002/3 Water Quality Status Report for Marine Waters Section 3 King County Department of Natural Resources & Parks Summary of 2002/3 Monitoring Data were detected at the Seattle waterfront stations. Table 3-2 provides a summary of the enterococci levels detected at various depths at the West Point and South Plant outfalls which have continuous discharges and the highest flows of the three WWTPs. Figure 3-4 shows enterococci levels in surface waters at all offshore stations.
Table 3-1. Water Column Fecal Coliform Levels at West Point & South Plant Outfalls in 2002 and 2003
Sample depth (m) Mean Maximum
1 0.8 7
15 0.1 1
25 0.1 1
35 0.2 2
55 0.2 2
100 0.0 0
≥ 150 0.1 3
Fecal Coliform Counts
(cfu/100 ml)
Table 3-2. Water Column Enterococci Levels at West Point & South Plant Outfalls in 2002 and 2003
Sample depth (m) Mean Maximum
1 1.0 13
15 0.9 21
25 0.5 5
35 0.5 6
55 0.8 24
100 0.5 3
≥ 150 0.1 2
Enterococci Counts
(cfu/100 ml)
49

2002/3 Water Quality Status Report for Marine Waters Section 3 King County Department of Natural Resources & Parks Summary of 2002/3 Monitoring Data
36
14 11 4 8 132 1 0 2 0 0
149
0
40
80
120
160
0 1 2 4 5 10 20 30 40 50 100 150 >150
Counts (cfu/100 ml)
Num
ber o
f Sam
ples
Figure 3-4. Enterococci in Surface Waters at
Offshore Stations in 2002 and 2003 Beach. Of the 21 beach stations monitored monthly in 2002, 9 sites met both the geometric mean and peak marine standards throughout the year. Tables 3-3 through 3-6 provide a summary of station results throughout 2002 and 2003. Sample collection at a new beach station near the Vashon TP outfall, MSJL01, began in 2002, therefore, the geometric mean at this station could not be calculated until December 2002. Data at this station indicated low fecal coliform levels that passed both standards. Fecal coliforms at the following five stations failed both standards in 2002: ITBRACKETT, KSQU01, LTEH02, LSVW01, and LSKS01. These sites have failed standards during past years and KSQU01, LTEH02, and LSVW01 are all affected by nearby freshwater sources and fail standards more often than sites away from freshwater input. LSKS01 is located south of Alki Point and it is not clear why water samples consistently fail the fecal coliform standards at this site. Sample collection at the MOSS station ITBRACKETT began in 2000 and ended in December 2002. This site is located in Edmonds at Brackett’s Landing in an area with poor circulation and 47% of the 34 monthly samples exceeded 43 CFU/100 ml. However, Figure 3-5 suggests that bacteria levels are improving at this site as indicated by the downward trend in geometric means (calculated with the most recent 12 sample results). There were four stations sampled in 2002 that met the geometric mean and peak standards at various times throughout the year but failed during some months. Stations KSSN05, KSYV02, and LSKR01 met the standards throughout most of year while KSLU03 failed the standards the majority of the year. Sample results in 2003 were similar to those in 2002, in that sites which passed the standards in 2002 also met the standards in 2003 and sites that failed standards did so in both 2002 and 2003. Stations near Duwamish Head and the north side of Alki Point consistently had the lowest fecal coliform counts in both 2002 and 2003. Results in 2003 were different for stations LSVW01 and KSSN05. Station LSVW01 did not meet the geometric mean standard throughout 2002 but did meet the standard during the latter part of 2003. Station KSSN05 had two exceedences in 2002
50

2002/3 Water Quality Status Report for Marine Waters Section 3 King County Department of Natural Resources & Parks Summary of 2002/3 Monitoring Data
Table 3-3. Summary of 2002 Outfall Station Compliance With Standards
Peakb
(43 CFU/100 mL)J F M A M J J A S O N D
Beach KSHZ03 N N N N N N N Y Y Y Y Y YES
KSSN04 Y Y Y Y Y Y Y Y Y Y Y Y YES
KSSN05 N Y Y Y Y N Y Y Y Y Y Y YES
LSKR01 N N N Y Y Y Y Y Y Y Y Y NO
LSKS01 N N N N N N N N N N N N NO
MSJL01c -- -- -- -- -- -- -- -- -- -- -- Y YES
CK200P Y Y Y Y Y Y Y Y Y Y Y Y YES
KSSK02 Y Y Y Y Y Y Y Y Y Y Y Y YES
LTBC41 Y Y Y Y Y Y Y Y Y Y Y Y YES
LSEP01 Y Y Y Y Y Y Y Y Y Y Y Y YES
LSKQ06 Y Y Y Y Y Y Y Y Y Y Y Y YES
VO50E Y Y Y Y Y Y Y Y Y Y Y Y YES
Station
Meets Primary Contact Recreation Marine Surface Water Standards
Moving Geometric Meana
(≤14 CFU/100 mL)
aThe geometric means were calculated using a sample size of the 12 most recent fecal co liform concentrations.
cM onthly sampling at M SJL01 was initiated January 2002.
bThe peak criterion refers to not more than 10% of the samples taken before Dec. 2002 exceeding this value.
Offshore
but none in 2003. For sampling years 2002 and 2003, the overall conditions at each location are summarized in Figure 3-6 based upon whether at least half of the monthly assessments passed or exceeded the standards. Three stations have been sampled for several years in the Carkeek Park area. Station KSHZ03 is located at the beach close to the outflow of Piper’s Creek and has been sampled for over 15 years. Station KTHA01 is a freshwater site located in Piper’s Creek upstream (above the location) of the Carkeek CSO treatment plant and has also been sampled for over 15 years. Data collection began at the third station located north of the freshwater influence of Piper’s Creek, ITCARKEEKP, in 2000 as part of the MOSS program and continues to be sampled as part of the marine ambient monitoring program.
51

2002/3 Water Quality Status Report for Marine Waters Section 3 King County Department of Natural Resources & Parks Summary of 2002/3 Monitoring Data
Table 3-4. Summary of 2002 Ambient Station Compliance With Standards
Peakb
(43 CFU/100 mL)J F M A M J J A S O N D
Beach ITOCEANAVE Y Y Y Y Y Y Y Y Y Y Y Y YES
ITBRACKETT N N N N N N N N N N N N NO
ITEDWARDSPT Y Y Y Y Y Y Y Y Y Y Y Y YES
JSVW04 Y Y Y Y Y Y Y Y Y Y Y Y YES
KTHA01c Y Y Y Y Y Y Y Y Y Y Y Y NO
KSLU03 Y N N N N N N N Y Y Y Y NO
KSQU01 N N N N N N N N N N N N NO
KSYV02 Y Y Y N N N N Y Y Y Y N NO
LTAB01 Y Y Y Y Y Y Y Y Y Y Y Y YES
LTEH02 N N N N N N N N N N N N NO
LSGY01 Y Y Y Y Y Y Y Y Y Y Y Y YES
LSFX01 Y Y Y Y Y Y Y Y Y Y Y Y YES
LSHV01 Y Y Y Y Y Y Y Y Y Y Y Y YES
LSTU01 Y Y Y Y Y Y Y Y Y Y Y Y YES
LSVW01 N N N N N N N N N N N N NO
PTWELLS1 Y Y Y Y Y Y Y Y Y Y Y Y YES
KSBP01 Y Y Y Y Y Y Y Y Y Y Y Y YES
LTED04 Y Y Y Y Y Y Y Y Y Y Y Y YES
LSNT01 Y Y Y Y Y Y Y Y Y Y Y Y YES
KSRU02d Y Y Y Y Y Y Y Y Y Y Y Y YES
cFreshwater standards for secondary contact recreation (Geomean ≤200 CFU/100 mL; Peak 400 CFU/100 mL) were used for evaluation of KTHA01.dFreshwater standards for primary contact recreation (Geomean ≤100 CFU/100 mL; Peak 200 CFU/100 mL) were used for evaluation of KSRU02.
bThe peak criterion refers to not more than 10% of the samples taken before Dec. 2002 exceeding this value.
Offshore
Station
Meets Primary Contact Recreation Marine Surface Water Standards
Moving Geometric Meana
(≤14 CFU/100 mL)
aThe geometric means were calculated using a sample size of the 12 most recent fecal co liform concentrations.
52
2002/3 Water Quality Status Report for Marine Waters Section 3 King County Department of Natural Resources & Parks Summary of 2002/3 Monitoring Data
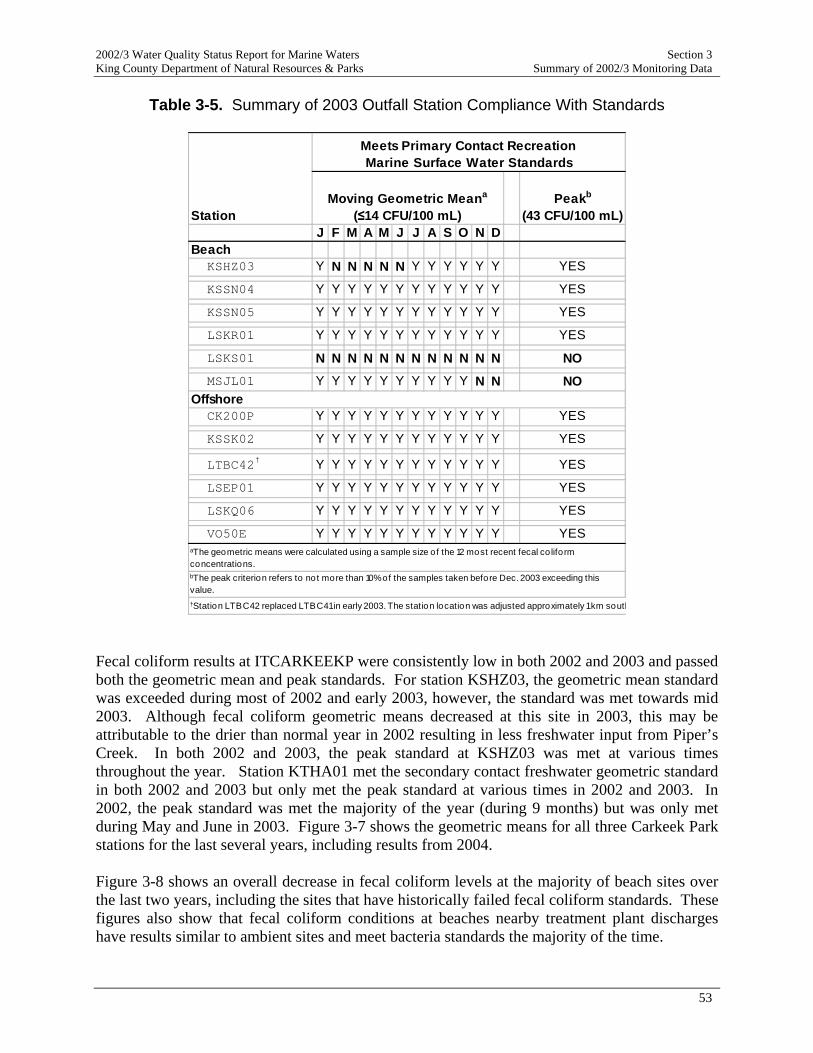
Table 3-5. Summary of 2003 Outfall Station Compliance With Standards
Peakb
(43 CFU/100 mL)J F M A M J J A S O N D
Beach KSHZ03 Y N N N N N Y Y Y Y Y Y YES
KSSN04 Y Y Y Y Y Y Y Y Y Y Y Y YES
KSSN05 Y Y Y Y Y Y Y Y Y Y Y Y YES
LSKR01 Y Y Y Y Y Y Y Y Y Y Y Y YES
LSKS01 N N N N N N N N N N N N NO MSJL01 Y Y Y Y Y Y Y Y Y Y N N NO
CK200P Y Y Y Y Y Y Y Y Y Y Y Y YES
KSSK02 Y Y Y Y Y Y Y Y Y Y Y Y YES
LTBC42† Y Y Y Y Y Y Y Y Y Y Y Y YES
LSEP01 Y Y Y Y Y Y Y Y Y Y Y Y YES
LSKQ06 Y Y Y Y Y Y Y Y Y Y Y Y YES
VO50E Y Y Y Y Y Y Y Y Y Y Y Y YES
†Station LTBC42 replaced LTBC41 in early 2003. The station location was adjusted approximately 1 km south
bThe peak criterion refers to not more than 10% of the samples taken before Dec. 2003 exceeding this value.
Station
Meets Primary Contact Recreation Marine Surface Water Standards
Moving Geometric Meana
(≤14 CFU/100 mL)
Offshore
aThe geometric means were calculated using a sample size of the 12 most recent fecal co liform concentrations.
Fecal coliform results at ITCARKEEKP were consistently low in both 2002 and 2003 and passed both the geometric mean and peak standards. For station KSHZ03, the geometric mean standard was exceeded during most of 2002 and early 2003, however, the standard was met towards mid 2003. Although fecal coliform geometric means decreased at this site in 2003, this may be attributable to the drier than normal year in 2002 resulting in less freshwater input from Piper’s Creek. In both 2002 and 2003, the peak standard at KSHZ03 was met at various times throughout the year. Station KTHA01 met the secondary contact freshwater geometric standard in both 2002 and 2003 but only met the peak standard at various times in 2002 and 2003. In 2002, the peak standard was met the majority of the year (during 9 months) but was only met during May and June in 2003. Figure 3-7 shows the geometric means for all three Carkeek Park stations for the last several years, including results from 2004. Figure 3-8 shows an overall decrease in fecal coliform levels at the majority of beach sites over the last two years, including the sites that have historically failed fecal coliform standards. These figures also show that fecal coliform conditions at beaches nearby treatment plant discharges have results similar to ambient sites and meet bacteria standards the majority of the time.
53

2002/3 Water Quality Status Report for Marine Waters Section 3 King County Department of Natural Resources & Parks Summary of 2002/3 Monitoring Data
Table 3-6. Summary of 2003 Ambient Station Compliance With Standards
Peakb
(43 CFU/100 mL)J F M A M J J A S O N D
Beach ITEDWARDSPT Y Y Y Y Y Y Y Y Y Y Y Y YES
JSVW04 Y Y Y Y Y Y Y Y Y Y Y Y YES
ITCARKEEKP Y Y Y Y Y Y Y Y Y Y Y Y YES
KSLU03 Y Y Y Y Y Y Y Y Y Y Y Y YES
KSQU01 N N N N N N N N N N N N NO
KSYV02 N N N N Y Y Y Y Y Y Y Y NO
LTAB01 Y Y Y Y Y Y Y Y Y Y Y Y NO
LTEH02 N N N N N N N N N N N N NO
LSGY01 Y Y Y Y Y Y Y Y Y Y Y Y YES
LSFX01 Y Y Y Y Y Y Y Y Y Y Y Y YES
LSHV01 Y Y Y Y Y Y Y Y Y Y Y Y YES
LSTU01 Y Y Y Y Y Y Y Y Y Y Y Y YES
LSVW01 N N N N N N N Y Y Y Y Y NO KTHA01d Y Y Y Y Y Y Y Y Y Y Y Y NO
PTWELLS1 Y Y Y Y Y Y Y Y Y Y Y Y YES
KSBP01 Y Y Y Y Y Y Y Y Y Y Y Y YES
LTED04 Y Y Y Y Y Y Y Y Y Y Y Y YES
LSNT01 Y Y Y Y Y Y Y Y Y Y Y Y YES
NSEX01e -- -- -- -- -- -- -- -- -- -- -- Y YESaThe geometric means were calculated using a sample size of the 12 most recent fecal co liform concentrations.
Offshore
Stationc
Meets Primary Contact Recreation Marine Surface Water Standards
Moving Geometric Meana
(≤14 CFU/100 mL)
dFreshwater standards for secondary contact recreation (Geomean ≤200 CFU/100 mL; Peak 400 CFU/100 mL) were used for evaluation of KTHA01.eM onthly sampling at M SJL01 was initiated January 2002.
bThe peak criterion refers to not more than 10% of the samples taken before Dec. 2003 exceeding this value.
cThere were three stations (M TEC01, M TLD03, M SSM 05) with insufficient data to calculate water quality standards.
54

2002/3 Water Quality Status Report for Marine Waters Section 3 King County Department of Natural Resources & Parks Summary of 2002/3 Monitoring Data
0
50
100
150
200
12/6
/199
9
3/15
/200
0
6/23
/200
0
10/1
/200
0
1/9/
2001
4/19
/200
1
7/28
/200
1
11/5
/200
1
2/13
/200
2
5/24
/200
2
9/1/
2002
12/1
0/20
02
Mon
thly
Res
ults
(CFU
/100
ml)
360 730820360 490
0
10
20
30
40
50
60
1/9/
2001
4/19
/200
1
7/28
/200
1
11/5
/200
1
2/13
/200
2
5/24
/200
2
9/1/
2002
12/1
0/20
02
Geo
met
ric m
ean
(CFU
/100
ml)
geometric mean standard
Figure 3-5. Fecal Coliform Results at Brackett’s Landing Station ITBRACKETT
Enterococci counts at beach stations varied from station to station and from month to month. Table 3-7 provides a summary of results at the stations sampled in 2002 and 2003. Values were generally highest in the winter months and at stations LSVW01, ITBRACKETT, KSYV02, LTEH02, and MSJL01. Stations with higher fecal coliform counts did not have correspondingly higher enterococci counts and this lack of correlation has been noted in the past.
55

2002/3 Water Quality Status Report for Marine Waters Section 3 King County Department of Natural Resources & Parks Summary of 2002/3 Monitoring Data
Figure 3-6. 2002 & 2003 Fecal Coliform Results: Comparison with Standards
56

2002/3 Water Quality Status Report for Marine Waters Section 3 King County Department of Natural Resources & Parks Summary of 2002/3 Monitoring Data
0
10
20
30
40
50
5/15
/199
6
9/27
/199
7
2/9/
1999
6/23
/200
0
11/5
/200
1
3/20
/200
3
8/1/
2004
KSH
Z03,
ITC
AR
KEE
KP(
CFU
/100
ml
0
50
100
150
200
250
300
350
400
KTH
A01 (C
FU/100 m
lKSHZ03
ITCARKEEKP
KTHA01
Figure 3-7. Fecal Coliform Geometric Means at Carkeek Park Stations
Table 3-7. Summary of Enteroccocci Values at Beach Stations in 2002 & 2003
Station% of Samples ≥ 104 cfu/100 ml a
% of Samples ≥ 276 cfu/100 ml b
Mean (cfu/100 ml)
Median (cfu/100 ml)
Maximum Value (cfu/100
ml)Number of Samples
ITBRACKETT 17 0 34 14 150 12ITOCEANAVE 0 0 5 2 24 12ITEDWARDSPT 9 0 21 6 119 22JSVW04 0 0 7 4 29 22ITCARKEEKP 0 0 6 2 22 12KSHZ03 0 0 19 8 82 24KSLU03 0 0 13 7 67 24KSQU01 0 0 13 8 53 24KSSN04 0 0 4 2 23 24KSSN05 0 0 10 4 60 24KSYV02 14 9 49 6 430 24LTAB01 4 0 25 4 200 24LTEH02 8 8 70 14 690 24LSFX01 4 0 9 1 130 24LSGY01 4 0 12 1 170 24LSHV01 0 0 8 2 51 24LSKR01 4 0 15 4 85 24LSKS01 8 4 63 8 1005 24LSTU01 0 0 6 1 38 24LSVW01 17 8 76 20 830 24MTLD03 0 0 12 4 52 12MSJL01 8 8 97 14 970 24MSSM05 13 7 52 4 420 15a Indicates EPA marine beach advisory level for single sample concentration.b Indicates EPA marine beach warning level for single sample concentration.
57

2002/3 Water Quality Status Report for Marine Waters Section 3 King County Department of Natural Resources & Parks Summary of 2002/3 Monitoring Data
Station JSVW04: Richmond Beach
Jan-99 Jan-00 Jan-01 Jan-02 Jan-03 Jan-04
CFU
per
100
mL
0
10
20
30
40
50
Station KSHZ03: Carkeek Park
Jan-99 Jan-00 Jan-01 Jan-02 Jan-03 Jan-04
CFU
per
100
mL
0
10
20
30
40
50
Station KSLU03: Golden Gardens Park
Jan-99 Jan-00 Jan-01 Jan-02 Jan-03 Jan-04
CFU
per
100
mL
0
10
20
30
40
50Station KSQU01: Shilshole Bay
Jan-99 Jan-00 Jan-01 Jan-02 Jan-03 Jan-04
CFU
per
100
mL
0
10
20
30
40
50
Station KSSN04: West Point
Jan-99 Jan-00 Jan-01 Jan-02 Jan-03 Jan-04
CFU
per
100
mL
0
10
20
30
40
50Station KSSN05: West Point
Jan-99 Jan-00 Jan-01 Jan-02 Jan-03 Jan-04
CFU
per
100
mL
0
10
20
30
40
50
Figure 3-8. Fecal Coliform Geometric Means for 20 Beach Stations Sampled From 1999-2003 (dashed line indicates geometric mean primary contact standard)
58

2002/3 Water Quality Status Report for Marine Waters Section 3 King County Department of Natural Resources & Parks Summary of 2002/3 Monitoring Data
Station KSYV02: Magnolia
Jan-99 Jan-00 Jan-01 Jan-02 Jan-03 Jan-04
CFU
per
100
mL
0
10
20
30
40
50
Station LSFX01: Duwamish Head
Jan-99 Jan-00 Jan-01 Jan-02 Jan-03 Jan-04
CFU
per
100
mL
0
10
20
30
40
50
Station LSGY01: Seacrest Park
Jan-99 Jan-00 Jan-01 Jan-02 Jan-03 Jan-04
CFU
per
100
mL
0
10
20
30
40
50Station LSHV01: West Seattle
Jan-99 Jan-00 Jan-01 Jan-02 Jan-03 Jan-04
CFU
per
100
mL
0
10
20
30
40
50
Station LSKRO1: Alki Point
Jan-99 Jan-00 Jan-01 Jan-02 Jan-03 Jan-04
CFU
per
100
mL
0
10
20
30
40
50Station LSTUO1: Lincoln Park
Jan-99 Jan-00 Jan-01 Jan-02 Jan-03 Jan-04
CFU
per
100
mL
0
10
20
30
40
50
Figure 3-8 cont. Fecal Coliform Geometric Means for 20 Beach Stations Sampled From 1999-2003 (dashed line indicates geometric mean primary contact standard)
59

2002/3 Water Quality Status Report for Marine Waters Section 3 King County Department of Natural Resources & Parks Summary of 2002/3 Monitoring Data
Station LTAB01: Inner Elliott Bay
Jan-99 Jan-00 Jan-01 Jan-02 Jan-03 Jan-04
CFU
per
100
mL
0
10
20
30
40
50
Station LTEH02: Inner Elliott Bay
Jan-99 Jan-00 Jan-01 Jan-02 Jan-03 Jan-04
CFU
per
100
mL
0
10
20
30
40
50
Station MTEC01: Seahurst Park
Jan-99 Jan-00 Jan-01 Jan-02 Jan-03 Jan-04
CFU
per
100
mL
0
10
20
30
40
50Station MTLD03: Normandy Park
Jan-99 Jan-00 Jan-01 Jan-02 Jan-03 Jan-04
CFU
per
100
mL
0
10
20
30
40
50
Station KTHA01: Piper's Creek (Freshwater)
Jan-99 Jan-00 Jan-01 Jan-02 Jan-03 Jan-04
CFU
per
100
mL
0
100
200
300
400Station LSVW01: Fauntleroy Cove
Jan-99 Jan-00 Jan-01 Jan-02 Jan-03 Jan-04
CFU
per
100
mL
0
20
40
60
80
100
Station MSSM05: Vashon Island - Tramp Harbor
Jan-99 Jan-00 Jan-01 Jan-02 Jan-03 Jan-04
CFU
per
100
mL
0
20
40
60
80
100
120Station LSKS01: Alki Point
Jan-99 Jan-00 Jan-01 Jan-02 Jan-03 Jan-04
CFU
per
100
mL
0
20
40
60
80
100
120
Figure 3-8 cont. Fecal Coliform Geometric Means for 20 Beach Stations Sampled From 1999-2003 (dashed line indicates geometric mean primary contact standard)
60

2002/3 Water Quality Status Report for Marine Waters Section 3 King County Department of Natural Resources & Parks Summary of 2002/3 Monitoring Data 3.2.2 Water Temperature Offshore Stations. Temperature measurements were made throughout the water column from the surface to just above the seafloor at each offshore station. CTD temperature profiles are provided in Appendix F. For offshore stations sampled in 2002 and 2003, temperatures ranged from 7.0 to 16.9 oC (including data from all depths), with a mean temperature of 10.4 oC. This is a slight increase from a mean water temperature of 10.1 oC found in 2001. Water temperatures in 2002 were lower, on average, than those measured in 2003. Temperatures ranged from 7.1 to 15.1 oC (mean = 10.0 oC) in 2002, while temperatures ranged from 7.7 to 16.9 oC (mean = 10.8 oC) in 2003. Temperatures over 15.8 oC were found in surface waters at ten of the eleven offshore stations sampled on July 28 and 29, 2003. Air temperatures for July 2003 averaged 2.6 oF above normal, the fifth-hottest July on record in Seattle. The warmest days were July 29 and 30 when air temperatures reached highs of 93 and 92 oF, respectively. Water temperature variations during the winter and early spring months were minimal, particularly deeper in the water column. Surface temperatures varied significantly from season to season due to differences in air temperature, cloud cover, wind speed, and solar radiation. The seasonal surface temperature pattern observed in central Puget Sound included minimums in January (Figure 3-9), February, and March, followed by increases in April (Figure 3-10), May, June, and July (Figure 3-11). Surface temperatures began decreasing in late September and continued to decrease throughout the remainder of the year (Figure 3-12). In both 2002 and 2003, a seasonal thermocline (a depth range over which temperature decreases rapidly with depth) extending down to approximately 50 meters developed in late spring and persisted into late summer. By late September, the water column was well-mixed. Figures 3-13 and 3-14 provide vertical temperature profiles for 2002 and 2003, respectively, from six stations located throughout the sampling area. Temperature values and patterns observed at these six stations are representative of the other stations monitored. The profiles illustrate the high variability of water temperatures at the surface and the presence of a well-mixed water column at deeper depths even when seasonal stratification is present. Temperature values at discrete depths are provided in Appendix A. Water temperatures measured over a five year period, from 1999 to 2003, are shown in Figure 3-15 for stations KSBP01 and LSNT01. Overall, the figures indicate a well-mixed water column throughout most of the year, with thermocline development during the summer corresponding to a rise in air temperature and an increase in solar radiation. Variations in water temperature from 1999-2003 for all 2002/2003 offshore stations can be found in Appendix E. Mean, minimum, and maximum values for temperature and other general water quality parameters for the past ten years of sampling at stations KSBP01 and LSNT01 are summarized in Table 3-8.
61

2002/3 Water Quality Status Report for Marine Waters Section 3 King County Department of Natural Resources & Parks Summary of 2002/3 Monitoring Data
#S#S
#S
#S#S#S
#S#S
#S
#S
#S#S
#S
#S#S#S
#S#S
#S
#S
#S
#S#S
#S
#S#S#S
#S#S
#S
#S
#S#S
#S
#S#S#S
#S#S
#S
#S
#S#S
#S
#S#S#S
#S#S
#S
#S
#S#S
#S
#S#S#S
#S#S
#S
#S
#S
#S#S
#S
#S#S
#S#S
#S
#S
#S
#S#S
#S
#S#S#S
#S#S
#S
#S
January 2002
January 2003Temperature
Temperature
Salinity
Salinity
Oxygen
OxygenN
N N
N N
N
012 Miles 012 Miles 012 Miles
012 Miles012 Miles012 Miles
Temperature (Celsius)
#S 7.0 - 10.4
#S 10.5 - 13.9
#S 14.0 +
Salinity (PSS)
#S 24.0 - 26.4
#S 26.5 - 28.9
#S 29.0 +
5.0 - 7.9
8.0 - 10.9
11.0 +
Oxygen (mg/L)
#S#S#S
Temperature (Celsius)
#S 7.0 - 10.4
#S 10.5 - 13.9
#S 14.0 +
Salinity (PSS)
#S 24.0 - 26.4
#S 26.5 - 28.9
#S 29.0 +
5.0 - 7.9
8.0 - 10.9
11.0 +
Oxygen (mg/L)
#S#S#S
Figure 3-9. Seasonal Temperature, Salinity, and Dissolved Oxygen Distributions in Surface Water at Offshore Stations for 2002 & 2003 in January
62

2002/3 Water Quality Status Report for Marine Waters Section 3 King County Department of Natural Resources & Parks Summary of 2002/3 Monitoring Data
#S#S
#S
#S#S#S
#S#S
#S
#S
#S
#S#S
#S
#S#S#S
#S#S
#S
#S
#S#S
#S
#S#S#S
#S#S
#S
#S
#S#S
#S
#S#S#S
#S#S
#S
#S
#S#S
#S
#S#S#S
#S#S
#S
#S
#S
#S#S
#S
#S#S#S
#S#S
#S
#S
#S#S
#S#S#S#S
#S#S
#S
#S
#S
April 2002
April 2003
5.0 - 7.9
8.0 - 10.9
11.0 +
Oxygen (mg/L)
#S#S#S
Temperature Salinity
Salinity
Oxygen
Oxygen
N N
N N
N
012 Miles 012 Miles
012 Miles012 Miles012 Miles
012 Miles
N Temperature
5.0 - 7.9
8.0 - 10.9
11.0 +
Oxygen (mg/L)
#S#S#S
Temperature (Celsius)
#S 7.0 - 10.4
#S 10.5 - 13.9
#S 14.0 +
Temperature (Celsius)
#S 7.0 - 10.4
#S 10.5 - 13.9
#S 14.0 +
Salinity (PSS)
#S 24.0 - 26.4
#S 26.5 - 28.9
#S 29.0 +
Salinity (PSS)
#S 24.0 - 26.4
#S 26.5 - 28.9
#S 29.0 +
Figure 3-10. Seasonal Temperature, Salinity, and Dissolved Oxygen
Distributions in Surface Water at Offshore Stations for 2002 & 2003 in April
63

2002/3 Water Quality Status Report for Marine Waters Section 3 King County Department of Natural Resources & Parks Summary of 2002/3 Monitoring Data
#S#S
#S
#S#S#S
#S#S
#S
#S
#S#S
#S
#S#S#S
#S#S
#S
#S
#S#S
#S
#S#S#S
#S#S
#S
#S
#S
#S#S
#S
#S#S#S
#S#S
#S
#S
#S#S
#S#S#S#S
#S#S
#S
#S
#S
#S#S
#S
#S#S#S
#S#S
#S
#S
#S#S
#S
#S#S#S
#S#S
#S
#S
#S
July 2002
July 2003Temperature
Temperature
Salinity
Salinity
Oxygen
OxygenN
N N
N N
N
012 Miles 012 Miles 012 Miles
012 Miles012 Miles012 Miles
Temperature (Celsius)
#S 7.0 - 10.4
#S 10.5 - 13.9
#S 14.0 +
Salinity (PSS)
#S 24.0 - 26.4
#S 26.5 - 28.9
#S 29.0 +
5.0 - 7.9
8.0 - 10.9
11.0 +
Oxygen (mg/L)
#S#S#S
Temperature (Celsius)
#S 7.0 - 10.4
#S 10.5 - 13.9
#S 14.0 +
Salinity (PSS)
#S 24.0 - 26.4
#S 26.5 - 28.9
#S 29.0 +
5.0 - 7.9
8.0 - 10.9
11.0 +
Oxygen (mg/L)
#S#S#S
Figure 3-11. Seasonal Temperature, Salinity, and Dissolved Oxygen
Distributions in Surface Water at Offshore Stations for 2002 & 2003 in July
64

2002/3 Water Quality Status Report for Marine Waters Section 3 King County Department of Natural Resources & Parks Summary of 2002/3 Monitoring Data
#S#S
#S
#S#S#S
#S#S
#S
#S
#S#S
#S
#S#S#S
#S#S
#S
#S
#S#S
#S
#S#S#S
#S#S
#S
#S
#S
#S#S
#S
#S#S#S
#S#S
#S
#S
#S#S
#S#S#S#S
#S#S
#S
#S
#S
#S#S
#S
#S#S#S
#S#S
#S
#S
#S#S
#S
#S#S#S
#S#S
#S
#S
#S
October 2002
October 2003Temperature
Temperature
Salinity
Salinity
Oxygen
OxygenN
N N
N N
N
012 Miles 012 Miles 012 Miles
012 Miles012 Miles012 Miles
Temperature (Celsius)
#S 7.0 - 10.4
#S 10.5 - 13.9
#S 14.0 +
Salinity (PSS)
#S 24.0 - 26.4
#S 26.5 - 28.9
#S 29.0 +
5.0 - 7.9
8.0 - 10.9
11.0 +
Oxygen (mg/L)
#S#S#S
Temperature (Celsius)
#S 7.0 - 10.4
#S 10.5 - 13.9
#S 14.0 +
Salinity (PSS)
#S 24.0 - 26.4
#S 26.5 - 28.9
#S 29.0 +
5.0 - 7.9
8.0 - 10.9
11.0 +
Oxygen (mg/L)
#S#S#S
Figure 3-12. Seasonal Temperature, Salinity, and Dissolved Oxygen
Distributions in Surface Water at Offshore Stations for 2002 & 2003 in October
65

2002/3 Water Quality Status Report for Marine Waters Section 3 King County Department of Natural Resources & Parks Summary of 2002/3 Monitoring Data
KSSK02
Temperature (oC)
7 8 9 10 11 12 13 14 15D
epth
(met
ers)
0
10
20
30
40
50
60
LSEP01
Temperature (oC)
7 8 9 10 11 12 13 14 15
Dep
th (m
eter
s)
0
50
100
150
200
KSBP01
Temperature (oC)
7 8 9 10 11 12 13 14 15D
epth
(met
ers)
0
50
100
150
200
JanFebMarAprMayJunJulAugSepOctNovDec
CK200P
Temperature (oC)
7 8 9 10 11 12 13 14 15
Dep
th (m
eter
s)
0
10
20
30
40
50
60
LSNT01
Temperature (oC)
7 8 9 10 11 12 13 14 15
Dep
th (m
eter
s)
0
50
100
150
200
LTED04
Temperature (oC)
7 8 9 10 11 12 13 14 15
Dep
th (m
eter
s)
0
10
20
30
40
50
60
Figure 3-13. 2002 Vertical Temperature Profiles from Select Offshore Stations
66

2002/3 Water Quality Status Report for Marine Waters Section 3 King County Department of Natural Resources & Parks Summary of 2002/3 Monitoring Data
KSSK02
Temperature (oC)
7 8 9 10 11 12 13 14 15D
epth
(met
ers)
0
10
20
30
40
50
60
LSEP01
Temperature (oC)
7 8 9 10 11 12 13 14 15
Dep
th (m
eter
s)
0
50
100
150
200
KSBP01
Temperature (oC)
7 8 9 10 11 12 13 14 15
Dep
th (m
eter
s)
0
50
100
150
200
JanFebMarAprMayJunJulAugSepOctNovDec
CK200P
Temperature (oC)
7 8 9 10 11 12 13 14 15
Dep
th (m
eter
s)
0
10
20
30
40
50
60
LSNT01
Temperature (oC)
7 8 9 10 11 12 13 14 15
Dep
th (m
eter
s)
0
50
100
150
200
LTED04
Temperature (oC)
7 8 9 10 11 12 13 14 15
Dep
th (m
eter
s)
0
10
20
30
40
50
60
Figure 3-14. 2003 Vertical Temperature Profiles from Select Offshore Stations
67

2002/3 Water Quality Status Report for Marine Waters Section 3 King County Department of Natural Resources & Parks Summary of 2002/3 Monitoring Data
Figure 3-15. Temperature Variations at Stations KSBP01 and
LSNT01 from 1999-2003
68

2002/3 Water Quality Status Report for Marine Waters Section 3 King County Department of Natural Resources & Parks Summary of 2002/3 Monitoring Data
Table 3-8. General Water Quality Parameter Variations at KSBP01 and LSNT01 from 1994-2003 (includes all depths)
Temperature Salinity Dissolved Chlorophyll-a Pheophytin NO3+NO2 NH3-N Phosphorous TSS* Silica
(0C) (PSS) oxygen (mg/L) (mg/m3) (mg/m3) (mg/L) (mg/L) (total) (mg/L) (mg/L) (mg/L)
1994 KSBP01 11.0 30.04 8.0 4.48 1.41 0.28 0.19 0.07 3.0 no dataLSNT01 10.9 30.13 7.7 3.27 1.03 0.28 0.18 0.07 3.9 no data
1995 KSBP01 11.6 29.75 7.9 4.51 1.17 0.26 0.04 0.07 4.3 2.0LSNT01 11.0 29.68 7.7 2.89 0.68 0.28 0.04 0.07 3.8 2.4
1996 KSBP01 10.2 29.17 7.6 1.07 0.62 0.29 0.04 0.07 4.4 2.2LSNT01 10.0 29.27 7.7 1.47 0.61 0.29 0.04 0.07 4.3 2.5
1997 KSBP01 11.1 29.21 7.1 2.22 0.40 0.33 0.03 0.08 4.4 2.8LSNT01 11.4 29.20 6.9 1.77 0.41 0.32 0.03 0.08 4.5 2.8
1998 KSBP01 11.1 29.68 7.5 3.42 0.70 0.29 0.02 0.07 3.4 2.5LSNT01 11.3 29.70 7.4 2.04 0.29 0.29 0.02 0.07 3.2 2.8
1999 KSBP01 9.9 29.57 7.2 3.35 0.70 0.30 0.02 0.06 3.8 2.4LSNT01 10.0 29.62 6.9 1.20 0.44 0.30 0.03 0.07 4.0 2.6
2000 KSBP01 9.8 29.90 7.5 2.78 0.72 0.33 0.03 0.07 2.2 2.8LSNT01 9.8 29.83 7.6 2.60 0.40 0.34 0.02 0.07 2.5 3.1
2001 KSBP01 10.0 30.47 7.1 3.43 0.73 0.37 0.03 0.07 1.8 2.6LSNT01 10.1 30.42 7.1 4.09 0.44 0.32 0.03 0.07 2.0 2.7
2002 KSBP01 9.8 29.99 6.9 2.69 0.63 0.33 0.04 0.07 2.6 2.6LSNT01 9.9 29.97 6.8 3.18 0.46 0.32 0.04 0.07 2.8 2.6
2003 KSBP01 10.6 30.09 6.9 4.15 0.91 0.31 0.02 0.07 2.9 2.4LSNT01 10.5 29.99 6.8 2.04 0.55 0.32 0.02 0.07 2.9 2.6
1994 KSBP01 8.3 25.48 5.8 0.18 0.03 0.08 0.02 0.04 0.6 no dataLSNT01 8.5 27.18 5.2 0.07 0.02 0.06 0.02 0.05 0.8 no data
1995 KSBP01 8.2 22.06 5.3 0.02 0.10 0.07 0.02 0.02 0.7 0.4LSNT01 7.7 25.85 5.5 0.04 0.09 0.07 0.02 0.03 0.8 0.7
1996 KSBP01 7.7 26.53 5.5 0.09 0.06 0.07 0.02 0.05 0.8 1.0LSNT01 7.6 27.39 5.2 0.13 0.09 0.08 0.02 0.05 0.5 1.0
1997 KSBP01 7.5 26.81 5.5 0.03 0.01 0.13 0.02 0.04 0.7 0.5LSNT01 7.8 27.33 5.2 0.13 0.02 0.21 0.02 0.05 0.9 1.2
1998 KSBP01 8.7 26.48 5.4 0.14 0.05 0.07 0.01 0.03 1.2 0.7LSNT01 9.0 28.58 5.5 0.16 0.01 0.12 0.01 0.04 1.2 1.7
1999 KSBP01 8.0 24.22 5.1 0.13 0.07 0.05 0.01 0.03 1.8 0.3LSNT01 8.0 27.81 4.9 0.15 0.08 0.11 0.01 0.04 1.9 1.1
2000 KSBP01 8.0 25.59 4.2 0.21 0.09 0.06 0.01 0.04 0.5 0.3LSNT01 8.0 26.90 4.2 0.21 0.03 0.10 0.01 0.05 0.5 1.2
2001 KSBP01 7.8 26.56 3.9 0.17 0.13 0.09 0.01 0.04 0.5 1.1LSNT01 7.9 28.06 4.5 0.17 0.08 0.16 0.01 0.03 0.6 0.7
2002 KSBP01 7.0 24.18 4.5 0.16 0.09 0.10 0.01 0.04 0.5 0.7LSNT01 8.0 28.40 4.5 0.18 0.03 0.13 0.01 0.05 0.6 1.5
2003 KSBP01 7.7 24.08 4.8 0.05 0.10 0.05 0.01 0.03 0.6 0.3LSNT01 8.0 24.61 4.0 0.20 0.07 0.14 0.01 0.05 0.5 1.8
1994 KSBP01 16.0 31.54 15.0 28.00 7.10 0.45 1.15 0.10 16.0 no dataLSNT01 13.9 31.51 12.0 11.00 4.50 0.44 0.45 0.09 14.0 no data
1995 KSBP01 19.0 31.92 13.0 31.00 5.60 0.41 0.08 0.11 10.0 3.7LSNT01 14.3 31.87 11.0 12.00 2.70 0.48 0.06 0.12 11.4 4.1
1996 KSBP01 14.3 30.66 9.9 8.50 2.80 0.44 0.17 0.11 11.4 3.8LSNT01 14.0 30.72 9.4 5.30 2.80 0.43 0.12 0.10 9.7 4.1
1997 KSBP01 15.0 30.08 12.6 15.90 1.90 0.49 0.04 0.13 13.2 3.9LSNT01 14.6 30.09 9.9 7.10 5.60 0.42 0.06 0.12 10.8 3.6
1998 KSBP01 15.5 30.78 14.1 31.50 3.30 0.39 0.04 0.13 7.9 3.9LSNT01 14.7 30.75 10.5 13.40 1.10 0.39 0.04 0.12 8.8 4.5
1999 KSBP01 14.8 30.67 13.8 26.10 4.00 0.41 0.05 0.08 8.8 3.8LSNT01 13.5 30.55 9.9 17.50 1.50 0.41 0.06 0.08 10.9 3.8
2000 KSBP01 14.0 30.88 11.5 23.00 3.80 0.41 0.05 0.08 8.2 3.9LSNT01 13.1 31.17 9.9 18.40 2.60 0.44 0.05 0.09 6.5 4.2
2001 KSBP01 13.6 30.95 15.1 30.00 2.87 0.43 0.06 0.09 4.4 3.6LSNT01 13.4 30.94 20.1 28.60 2.78 0.43 0.06 0.08 5.2 4.0
2002 KSBP01 14.7 31.61 12.9 24.40 3.38 0.44 0.08 0.09 11.7 3.9LSNT01 14.1 31.12 11.2 13.10 2.66 0.44 0.08 0.09 9.2 3.7
2003 KSBP01 16.6 31.03 13.2 25.10 5.30 0.42 0.05 0.09 7.0 3.3LSNT01 15.7 32.75 10.9 10.50 2.96 0.44 0.05 0.09 5.9 3.4
*Total Suspended Solids
Means
Minimums
Maximums
69

2002/3 Water Quality Status Report for Marine Waters Section 3 King County Department of Natural Resources & Parks Summary of 2002/3 Monitoring Data Beach Stations. Temperatures at beach stations sampled in 2002 and 2003 ranged from 6.5 to 19.5 oC (mean = 11.2 oC). As shown in Figure 3-16, temperatures varied dependent upon location sampled. Temperatures were slightly higher in 2003 (mean = 11.6 oC) than in 2002 (mean = 10.9 oC). The range of maximum temperatures (standard deviation = 1.6 oC and 1.4 oC in 2002 and 2003, respectively) observed was greater than the range of minimum temperatures (standard deviation = 0.4 oC in both years). June and August had the highest temperatures in 2002 and 2003, respectively. Temperature data for beach stations is provided in Appendix A.
5
10
15
20
25
ITBR
ACKE
TT
ITED
WAR
DSP
T
ITO
CEA
NAV
E
JSVW
04
KSH
Z03
KSLU
03
KSQ
U01
KSR
U02
KSSN
04
KSSN
05
KSYV
02
KTH
A01
LSFX
01
LSG
Y01
LSH
V01
LSKR
01
LSKS
01
LSTU
01
LSVW
01
LTAB
01
LTEH
02
MSJ
L01
Tem
pera
ture
o C
MinimumMaximumMean
2002
5
10
15
20
25
ITC
ARKE
EKP
ITED
WAR
DSP
T
JSVW
04
KSH
Z03
KSLU
03
KSQ
U01
KSSN
04
KSSN
05
KSYV
02
KTH
A01
LSFX
01
LSG
Y01
LSH
V01
LSKR
01
LSKS
01
LSTU
01
LSVW
01
LTAB
01
LTEH
02
MSJ
L01
Tem
pera
ture
o C
MinimumMaximumMean
2003
Figure 3-16. Water Temperature at Beach Stations in 2002 & 2003
70

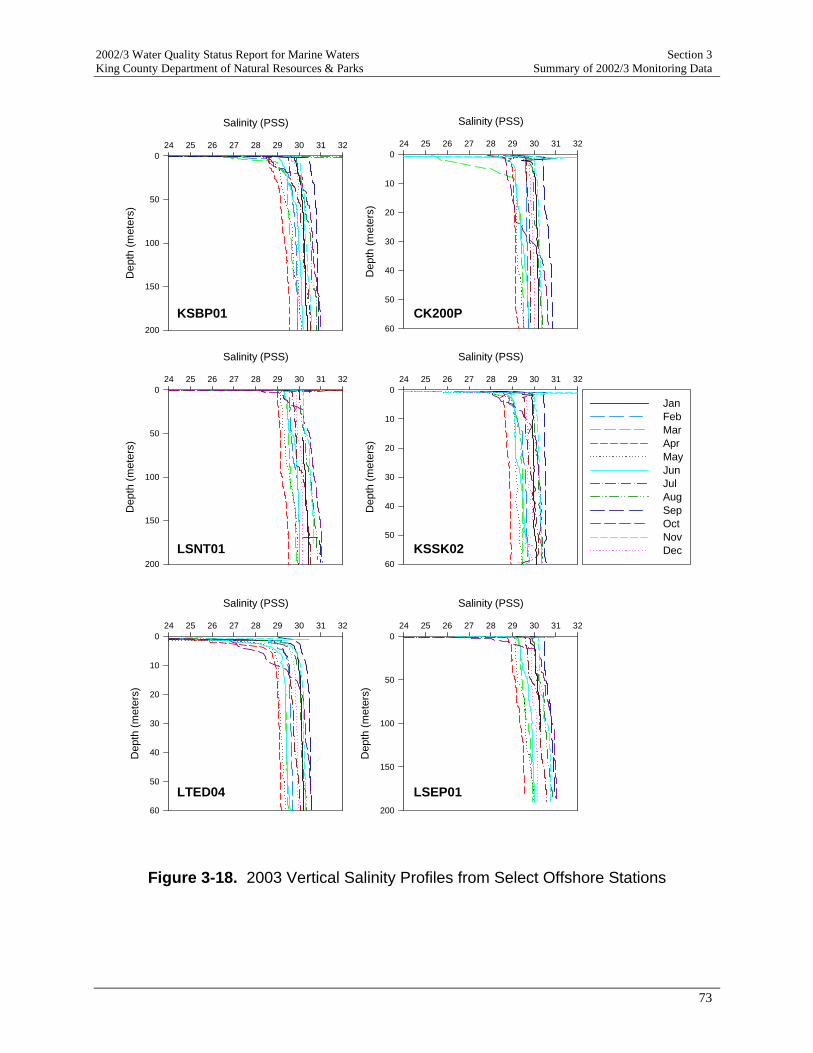
2002/3 Water Quality Status Report for Marine Waters Section 3 King County Department of Natural Resources & Parks Summary of 2002/3 Monitoring Data 3.2.3 Salinity and Density Offshore Salinity. Salinity measurements were made throughout the water column at each offshore station. CTD salinity profiles are provided for select stations in Appendix F. Salinities ranged from 20.91 to 31.61 in 2002, and from 19.36 to 31.13 in 2003 on the Practical Salinity Scale (PSS). Mean salinities varied only slightly between the years with 2002 at 29.85 PSS and 2003 at 30.00 PSS. In both years, the lowest salinities occurred in the surface waters of Elliott Bay (LTBC41 in 2002; LTBC42 in 2003) primarily due to freshwater runoff from the Duwamish River, in addition to discharge from the nearby Denny Way CSO, following rain events on 5/27/02 and 4/29/03. The highest salinities (>31.00 PSS) were found offshore at depths greater than 100 meters during the month of November. This may be attributed to the increased input of salty deep oceanic water upwelled along the Pacific coast and entering Puget Sound during late summer and fall. Salinity values at discrete depths are provided in Appendix A for offshore stations. Salinities varied due to seasonal influences as shown in the vertical salinity profiles for six stations in 2002 (Figure 3-17) and 2003 (Figure 3-18). Apart from the surface layer, where wide ranges were observed (Figures 3-9 through 3-12), salinity showed little variability over the depth profile, indicating a well-mixed water column. Salinities were lowest in surface waters during the winter and spring months when contributions from freshwater sources were highest. The three inner Elliott Bay stations (LTBC41, LTBC42, and LTED04) had persistently low salinities at the surface due to freshwater flow from the Duwamish River. Generally, salinities were highest from August to December, potentially due to an increased contribution of saltier deep Pacific water from upwelling along the outer coast during late summer in combination with a decrease in freshwater input from rivers and runoff. The months in which uniform salinities are seen from surface to depth can be attributed to low rainfall and, therefore, low input from rivers and runoff. Salinities for all depths measured over a five year period, from 1999 to 2003, are shown in Figure 3-19 for stations KSBP01 and LSNT01. Overall, the figures indicate a well-mixed water column throughout most of the year, with no development of a strong halocline (a rapid change in salinity with depth). The seasonal decrease in surface water salinity was notably less in 2001 than in the other years, most likely due to the drought conditions of late 2000/early 2001. The cycle of coastal upwelling and its influence upon the waters of Puget Sound is seen as a deep, salty signal in late summer and fall of each year. Lower salinities in surface waters at station KSBP01 is due to the greater influence of freshwater at this location compared to station LSNT01. Variation in salinity from 1999-2003 for all stations can be found in Appendix E. Mean, minimum, and maximum values for the past ten years of sampling at stations KSBP01 and LSNT01 are summarized in Table 3-8. Beach Salinity. Salinity at beach stations ranged from 11.53 to 30.70 PSS (mean = 26.70 PSS) in 2002, and from 10.25 to 30.45 PSS (mean = 28.08 PSS) in 2003 (Figure 3-20). Salinities were lowest at stations near a freshwater source. Stations KSHZ03 and MSJL01 are near creeks draining into the Sound and station KSRU02 is located within the Lake Washington Ship Canal. There was no notable difference in salinity between stations from north to south other than variations due to proximity to a freshwater source. Seasonal changes in salinity showed highest
71

2002/3 Water Quality Status Report for Marine Waters Section 3 King County Department of Natural Resources & Parks Summary of 2002/3 Monitoring Data
KSSK02
Salinity (PSS)
24 25 26 27 28 29 30 31 32D
epth
(met
ers)
0
10
20
30
40
50
60
LSEP01
Salinity (PSS)
24 25 26 27 28 29 30 31 32
Dep
th (m
eter
s)
0
50
100
150
200
KSBP01
Salinity (PSS)
24 25 26 27 28 29 30 31 32
Dep
th (m
eter
s)
0
50
100
150
200
JanFebMarAprMayJunJulAugSepOctNovDec
CK200P
Salinity (PSS)
24 25 26 27 28 29 30 31 32
Dep
th (m
eter
s)
0
10
20
30
40
50
60
LSNT01
Salinity (PSS)
24 25 26 27 28 29 30 31 32
Dep
th (m
eter
s)
0
50
100
150
200
LTED04
Salinity (PSS)
24 25 26 27 28 29 30 31 32
Dep
th (m
eter
s)
0
10
20
30
40
50
60
Figure 3-17. 2002 Vertical Salinity Profiles from Select Offshore Stations
72
2002/3 Water Quality Status Report for Marine Waters Section 3 King County Department of Natural Resources & Parks Summary of 2002/3 Monitoring Data
KSSK02
Salinity (PSS)
24 25 26 27 28 29 30 31 32D
epth
(met
ers)
0
10
20
30
40
50
60
LSEP01
Salinity (PSS)
24 25 26 27 28 29 30 31 32
Dep
th (m
eter
s)
0
50
100
150
200
KSBP01
Salinity (PSS)
24 25 26 27 28 29 30 31 32
Dep
th (m
eter
s)
0
50
100
150
200
JanFebMarAprMayJunJulAugSepOctNovDec
CK200P
Salinity (PSS)
24 25 26 27 28 29 30 31 32
Dep
th (m
eter
s)
0
10
20
30
40
50
60
LSNT01
Salinity (PSS)
24 25 26 27 28 29 30 31 32
Dep
th (m
eter
s)
0
50
100
150
200
LTED04
Salinity (PSS)
24 25 26 27 28 29 30 31 32
Dep
th (m
eter
s)
0
10
20
30
40
50
60
Figure 3-18. 2003 Vertical Salinity Profiles from Select Offshore Stations
73

2002/3 Water Quality Status Report for Marine Waters Section 3 King County Department of Natural Resources & Parks Summary of 2002/3 Monitoring Data
Figure 3-19. Salinity Variations at Stations KSBP01 and LSNT01 from 1999-2003
74

2002/3 Water Quality Status Report for Marine Waters Section 3 King County Department of Natural Resources & Parks Summary of 2002/3 Monitoring Data
5
10
15
20
25
30
35
ITB
RA
CK
ETT
ITE
DW
AR
DS
PT
ITO
CE
AN
AV
E
JSV
W04
KS
HZ0
3
KS
RU
02
KS
SN
05
LSV
W01
MS
JL01
Salin
ity (
PSS)
MinimumMaximumMean
2002
5
10
15
20
25
30
35
ITC
ARKE
EKP
ITED
WAR
DSP
T
JSVW
04
KSH
Z03
KSSN
05
LSKS
01
LSVW
01
MSJ
L01
Salin
ity (
PSS)
MinimumMaximumMean
2003
Figure 3-20. Water Salinity at Beach Stations in 2002 & 2003
values from September to November, and decreasing values in December due to increased precipitation and runoff, reaching a minimum in February and March. A notable exception to this pattern is the salinity of 10.25 PSS measured at station MSJL01 on 11/18/2003, the lowest beach salinity found in 2003. This measurement corresponds to the 24-hour period in which a significant level of precipitation was recorded in 2003. Salinity data for beach stations is provided in Appendix A. Offshore Density. Water density is a function of both salinity and temperature, with density increasing with higher salinity and lower temperature. Salinity tends to be a stronger influence than temperature on density structure in Puget Sound. Density stratification within the water column impedes vertical mixing and can, therefore, affect the concentration of substances found
75

2002/3 Water Quality Status Report for Marine Waters Section 3 King County Department of Natural Resources & Parks Summary of 2002/3 Monitoring Data at differing depths in the water column. Figures 3-21 and 3-22 show the vertical density profiles at six offshore stations sampled in 2002 and 2003, respectively. In general, density stratification is strongest during the summer due to increased solar heating and freshwater runoff from snow melt, both of which lead to a decrease in surface water density. Stratification weakens in the winter due to reduced solar influence and increased wind-induced mixing of the water column. Due to the seasonal cycles of temperature and salinity in Puget Sound, a light density phase, particularly at surface depths, occurs during the spring and summer months (Figure 3-23). This is followed by a dense phase in fall and winter. The weakened light density phase in 2001 can be attributed to the drought conditions of late 2000/early 2001, which led to reduced input of lighter, fresher water from rivers and runoff. Density values at discrete depths are provided in Appendix A for offshore outfall stations. Variations in density from 1999-2003 for all stations can be found in Appendix E, and vertical density profiles at select stations are located in Appendix F. 3.2.4 Dissolved Oxygen Physical processes affecting dissolved oxygen (DO) in Puget Sound include processes such as the input of low-oxygenated fresh or ocean water, stratification intensity, circulation patterns and mixing regimes, and the exchange of oxygen across the air-sea interface. Biological activity (e.g. photosynthesis, respiration) also affects ambient levels of DO and its distribution both vertically and horizontally. Another factor affecting DO is chemical oxidation. Dissolved oxygen measurements were made throughout the water column from the surface to just above the seafloor at each offshore station. Values at discrete water depths are provided in Appendix A. CTD DO profiles are provided for select stations in Appendix F. Dissolved oxygen concentrations at all offshore stations and depths sampled in 2002 and 2003 ranged from 4.5 to 13.8 mg/L, with no significant variation between years. In 2002, the mean concentration at all depths was 6.96 mg/L and the mean concentration for measurements made at discrete depths was 7.10 mg/L. In 2003, the mean concentration at all depths was 6.95 mg/L and the mean concentration at discrete depths was 7.22 mg/L. Note that the mean calculated from discrete depths is higher than that calculated from all depths at which measurements were taken. This is due to the focus of discrete depth sampling on the upper water column where DO values are usually higher. The range and mean values observed in 2002 and 2003 are similar to measurements made in previous years. As shown in Figures 3-23 and 3-24, DO generally decreased with depth to 50 m, and remained constant at lower depths. Mean DO concentration in surface waters at 1 m during 2002 and 2003 was 9.07 mg/L, compared to a mean of 6.57 mg/L at 200 m. Concentrations decreased with depth as most of the oxygen is obtained through exchange across the air-sea interface and from photosynthetic activity in surface waters, and most oxygen consumption occurs via bacterial respiration below the mixing zone.
76

2002/3 Water Quality Status Report for Marine Waters Section 3 King County Department of Natural Resources & Parks Summary of 2002/3 Monitoring Data
KSSK02
Density (sigma-t)
18 19 20 21 22 23 24 25D
epth
(met
ers)
0
10
20
30
40
50
60
LSEP01
Density (sigma-t)
18 19 20 21 22 23 24 25
Dep
th (m
eter
s)
0
50
100
150
200
KSBP01
Density (sigma-t)
18 19 20 21 22 23 24 25D
epth
(met
ers)
0
50
100
150
200
JanFebMarAprMayJunJulAugSepOctNovDec
CK200P
Density (sigma-t)
18 19 20 21 22 23 24 25
Dep
th (m
eter
s)
0
10
20
30
40
50
60
LSNT01
Density (sigma-t)
18 19 20 21 22 23 24 25
Dep
th (m
eter
s)
0
50
100
150
200
LTED04
Density (sigma-t)
18 19 20 21 22 23 24 25
Dep
th (m
eter
s)
0
10
20
30
40
50
60
Figure 3-21. 2002 Vertical Density Profiles from Select Offshore Stations
77

2002/3 Water Quality Status Report for Marine Waters Section 3 King County Department of Natural Resources & Parks Summary of 2002/3 Monitoring Data
KSSK02
Density (sigma-t)
18 19 20 21 22 23 24 25D
epth
(met
ers)
0
10
20
30
40
50
60
LSEP01
Density (sigma-t)
18 19 20 21 22 23 24 25
Dep
th (m
eter
s)
0
50
100
150
200
KSBP01
Density (sigma-t)
18 19 20 21 22 23 24 25D
epth
(met
ers)
0
50
100
150
200
JanFebMarAprMayJunJulAugSepOctNovDec
CK200P
Density (sigma-t)
18 19 20 21 22 23 24 25
Dep
th (m
eter
s)
0
10
20
30
40
50
60
LSNT01
Density (sigma-t)
18 19 20 21 22 23 24 25
Dep
th (m
eter
s)
0
50
100
150
200
LTED04
Density (sigma-t)
18 19 20 21 22 23 24 25
Dep
th (m
eter
s)
0
10
20
30
40
50
60
Figure 3-22. 2003 Vertical Density Profiles from Select Offshore Stations
78

2002/3 Water Quality Status Report for Marine Waters Section 3 King County Department of Natural Resources & Parks Summary of 2002/3 Monitoring Data
Figure 3-23. Density Variations at Stations KSBP01 and LSNT01 from 1999-2003
79

2002/3 Water Quality Status Report for Marine Waters Section 3 King County Department of Natural Resources & Parks Summary of 2002/3 Monitoring Data Seasonal DO distributions in surface water at offshore stations are shown in Figures 3-24 and 3-25. Dissolved oxygen concentrations below 7 mg/L (the Washington State Water Quality Standard for Class AA marine surface waters) occurred in deep water during late summer and fall as a result of the seasonal influx of deep oceanic water, which has lower concentrations of DO, coinciding with the oxidation of organic matter from phytoplankton blooms. Increased density stratification coincides with low summer DO levels. Density stratification of the water column favors the occurrence of low DO in deep water, as it impedes vertical mixing. Seasonal dissolved oxygen variations from 1999 to 2003 at stations KSBP01 and LSNT01 (Figure 3-26) are due to the input of deep oceanic water and consumption of oxygen by bacterial respiration over the late summer/fall months, and the production of oxygen by primary producers in the upper 25 meters or so during late spring and summer. The maximum seen in dissolved oxygen corresponds to a maximum in chlorophyll-a concentration, temporally and spatially in Puget Sound, and may be attributed to primary productivity. Dissolved oxygen variability from 1999-2003 for all stations can be found in Appendix F. Mean, minimum, and maximum values for the past ten years of sampling at stations KSBP01 and LSNT01 are in Table 3-8. Dissolved oxygen concentrations in Puget Sound are generally above 7.0 mg/L in the late winter and early summer months at all depths and locations sampled. Throughout the year, DO levels rarely drop below 5.0 mg/L, the upper limit for “biological stress” induced by low DO (NOAA, 1998). During summer and fall, a seasonal influx of deep oceanic water low in DO results in naturally occurring DO concentrations below 7.0 mg/L. Figures 3-27 and 3-28 show the seasonal variation in DO concentrations for 2002 and 2003, respectively, at both ambient and outfall offshore sites at discrete depths. There was no apparent difference in DO concentrations between outfall and ambient monitoring stations in either year. Several measurements in 2002 fell below 5.0 mg/L in the late fall/early winter months. However, these samples came from both outfall and ambient stations and were from depths greater than 50 meters. These low levels are possibly due to the input of deep oceanic water which contains low amounts of oxygen. 3.2.5 Transparency and Light Intensity Secchi Disk. Secchi disk measurements were taken to determine the transmission of visible light through the water. Secchi disk measurements of water clarity provide an approximate transparency value. The disk is lowered into the water and the depth at which it is lost to sight is recorded. Therefore, the higher the Secchi disk value, the greater the water transparency. Environmental factors that influence Secchi transparency include turbidity, riverine input, runoff, shoreline erosion, resuspension of bottom sediment, and primary productivity levels (phytoplankton blooms). Secchi disk values ranged from 1.7 to 13 m in 2002, and from 2.2 to 16 m in 2003. Table 3-9 lists the mean Secchi depths by station for 2002 and 2003 combined data. There was no difference in transparency between ambient and point source stations. Monthly Secchi transparency depths, along with chlorophyll-a levels, are presented in Figures 3-29 and 3-30 for 2002 and 2003, respectively. Secchi depths were fairly constant from January through March of 2002. In April, Secchi transparency became shallower at the Elliott Bay stations, most
80

2002/3 Water Quality Status Report for Marine Waters Section 3 King County Department of Natural Resources & Parks Summary of 2002/3 Monitoring Data
KSSK02
Oxygen (mg/L)
4 5 6 7 8 9 10 11 12 13 14D
epth
(met
ers)
0
10
20
30
40
50
60
LSEP01
Oxygen (mg/L)
4 5 6 7 8 9 10 11 12 13 14
Dep
th (m
eter
s)
0
50
100
150
200
KSBP01
Oxygen (mg/L)
4 5 6 7 8 9 10 11 12 13 14D
epth
(met
ers)
0
50
100
150
200
JanFebMarAprMayJunJulAugSepOctNovDec
CK200P
Oxygen (mg/L)
4 5 6 7 8 9 10 11 12 13 14
Dep
th (m
eter
s)
0
10
20
30
40
50
60
LSNT01
Oxygen (mg/L)
4 5 6 7 8 9 10 11 12 13 14
Dep
th (m
eter
s)
0
50
100
150
200
LTED04
Oxygen (mg/L)
4 5 6 7 8 9 10 11 12 13 14
Dep
th (m
eter
s)
0
10
20
30
40
50
60
Figure 3-24. 2002 Vertical Dissolved Oxygen Profiles from Select Offshore Stations
81

2002/3 Water Quality Status Report for Marine Waters Section 3 King County Department of Natural Resources & Parks Summary of 2002/3 Monitoring Data
KSSK02
Oxygen (mg/L)
4 5 6 7 8 9 10 11 12 13 14D
epth
(met
ers)
0
10
20
30
40
50
60
LSEP01
Oxygen (mg/L)
4 5 6 7 8 9 10 11 12 13 14
Dep
th (m
eter
s)
0
50
100
150
200
KSBP01
Oxygen (mg/L)
4 5 6 7 8 9 10 11 12 13 14D
epth
(met
ers)
0
50
100
150
200
JanFebMarAprMayJunJulAugSepOctNovDec
CK200P
Oxygen (mg/L)
4 5 6 7 8 9 10 11 12 13 14
Dep
th (m
eter
s)
0
10
20
30
40
50
60
LSNT01
Oxygen (mg/L)
4 5 6 7 8 9 10 11 12 13 14
Dep
th (m
eter
s)
0
50
100
150
200
LTED04
Oxygen (mg/L)
4 5 6 7 8 9 10 11 12 13 14
Dep
th (m
eter
s)
0
10
20
30
40
50
60
Figure 3-25. 2003 Vertical Dissolved Oxygen Profiles from Select Offshore Stations
82

2002/3 Water Quality Status Report for Marine Waters Section 3 King County Department of Natural Resources & Parks Summary of 2002/3 Monitoring Data
Figure 3-26. Dissolved Oxygen Variations at Stations KSBP01 and LSNT01 from 1999-2003
83

2002/3 Water Quality Status Report for Marine Waters Section 3 King County Department of Natural Resources & Parks Summary of 2002/3 Monitoring Data
Jan Feb Mar Apr May Jun Jul Aug Sep Oct Nov Dec Jan
Dis
solv
ed O
xyge
n (m
g/L)
4
6
8
10
12
14
Ambient Outfall
Figure 3-27. 2002 Dissolved Oxygen Concentrations at Discrete Depths Ranging from
1 – 200 Meters
Jan Feb Mar Apr May Jun Jul Aug Sep Oct Nov Dec Jan
Dis
solv
ed O
xyge
n (m
g/L)
4
6
8
10
12
14
AmbientOutfall
Figure 3-28. 2003 Dissolved Oxygen Concentrations at Discrete Depths
Ranging from 1 – 200 meters
84

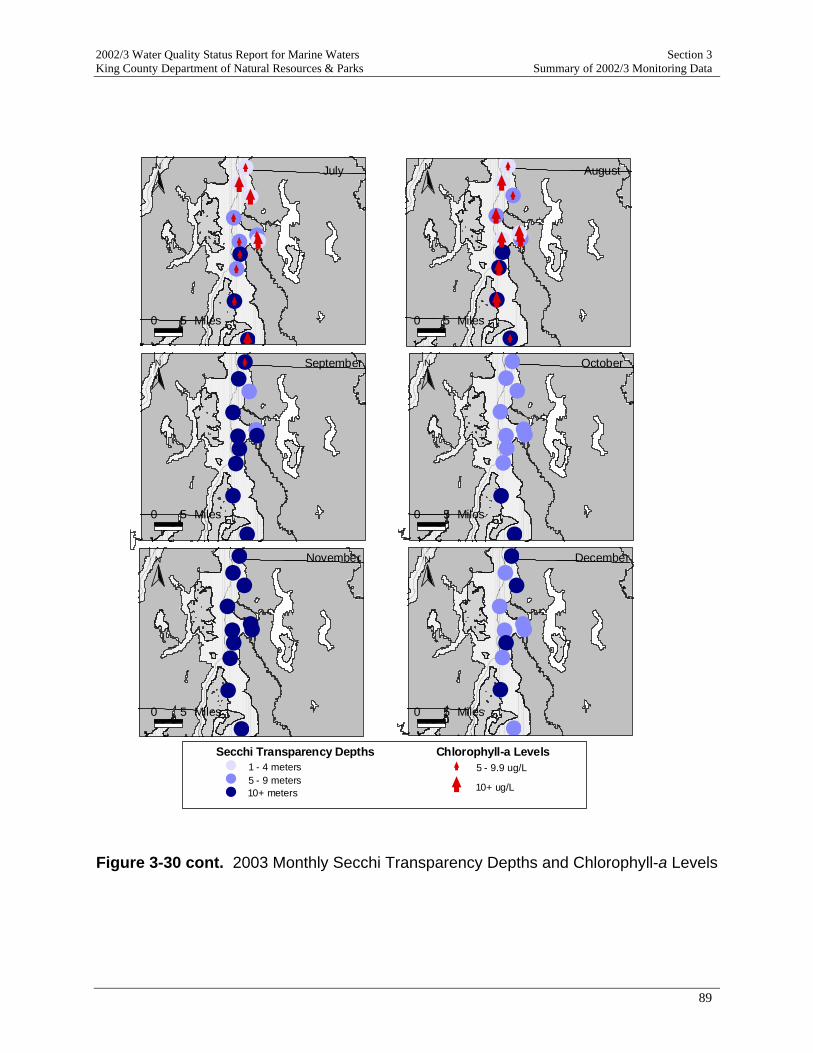
2002/3 Water Quality Status Report for Marine Waters Section 3 King County Department of Natural Resources & Parks Summary of 2002/3 Monitoring Data likely due to run-off from the Duwamish River since chlorophyll levels remained low. Offshore, Secchi depths decreased as chlorophyll-a levels rose due to increasing primary productivity which continued to rise in May and June. In July, chlorophyll-a concentrations remained high and began decreasing in August, particularly at the southern stations where low chlorophyll-a levels and high transparency depths were observed. In Elliott Bay, high chlorophyll-a levels and shallow transparency depths indicated an August bloom. A rise in the chlorophyll-a concentrations occurred in September at the southern stations, yet transparency remained high and became greater at the majority of other stations as well. Chlorophyll-a levels remained low through the remainder of 2002, which coincided with greater Secchi depths. In February 2003, chlorophyll-a levels above 10 µg/L were observed at the far north and far south stations. In April, chlorophyll-a levels rose north of Alki and in the East Passage (Station NSEX01). Secchi transparency declined at Point Wells in May and at Carkeek Park and Vashon Island in June. In July, high chlorophyll-a levels were observed at all stations. A notable increase in Secchi transparency occurred off Vashon Island in July and August during this period of high productivity. High chlorophyll-a levels persisted through August but had decreased significantly by September. Secchi transparency reached maximum depths throughout the study area in November and shallowed somewhat in December. All Secchi measurements made in 2002 and 2003 can be found in Appendix A.
Table 3-9. Average Secchi Disk Depths (m), All Data Combined, 2002 and 2003
PTWELLS1 23 7.6 3.1KSBP01 23 7.0 2.8CK200P 23 7.3 2.6KSSK02 23 7.4 2.4
LTBC41/42 24 6.6 2.2LSEP01 24 8.5 2.8LTED04 24 7.3 2.2LSKQ06 24 9.3 2.6LSNT01 24 8.8 1.9VO50E 23 8.9 2.7
NSEX01 12 9.0 3.4
Station Number of Observations
Mean Secchi Depth (m)
Secchi Depth Standard Deviation
85

2002/3 Water Quality Status Report for Marine Waters Section 3 King County Department of Natural Resources & Parks Summary of 2002/3 Monitoring Data
##
####
##
#
#
######
##
#
#
##
####
##
#
#
##
####
##
#
#
<
<
<
<
NN
0 5 Miles0 5 Miles
March April
N N
0 5 Miles 0 5 Miles
Chlorophyll-a Levels5 - 9.9 ug/L
10+ ug/L
Secchi Transparency Depths# 1 - 4 meters# 5 - 9 meters
10+ meters#
<
<
January February
#<<
<<<
<
<#####
##
#
#<
##
####
##
#
#<
<<
<
<<<
<<
<N N
0 5 Miles 0 5 Miles
May June
Figure 3-29. 2002 Monthly Secchi Transparency Depths and Chlorophyll-a Levels
86

2002/3 Water Quality Status Report for Marine Waters Section 3 King County Department of Natural Resources & Parks Summary of 2002/3 Monitoring Data
######
##
#
#
<<
<
<<
<
<<
<
<
#<<
<
< <<
<
#####
##
#
#
#<
<
<<<
<<
<
<
#####
##
#
#
#####
##
#
#
NN
0 5 Miles0 5 Miles
September October
######
##
#
######
##
#
#
N N
0 5 Miles 0 5 Miles
November December
N N
0 5 Miles 0 5 Miles
July August
Chlorophyll-a Levels5 - 9.9 ug/L
10+ ug/L
Secchi Transparency Depths# 1 - 4 meters# 5 - 9 meters
10+ meters#
<
<
Figure 3-29 cont. 2002 Monthly Secchi Transparency Depths and Chlorophyll-a Levels
87

2002/3 Water Quality Status Report for Marine Waters Section 3 King County Department of Natural Resources & Parks Summary of 2002/3 Monitoring Data
##
###
##
#
#
#
#####
##
#
#
<
<
N
0 5 Miles
February
##
####
##
#
#
#
##
####
##
#
#
#
<<
<<<
<
<NN
0 5 Miles0 5 Miles
March April
##
####
##
#
#
#
<<
<
<
<
<
<#
#
#
##
#
##
#
#
#
<<<
<<<
<
<
<
<
N N
0 5 Miles 0 5 Miles
May June
N
0 5 Miles
January
Chlorophyll-a Levels5 - 9.9 ug/L
10+ ug/L
Secchi Transparency Depths# 1 - 4 meters# 5 - 9 meters
10+ meters#
<
<
Figure 3-30. 2003 Monthly Secchi Transparency Depths and Chlorophyll-a Levels
88
2002/3 Water Quality Status Report for Marine Waters Section 3 King County Department of Natural Resources & Parks Summary of 2002/3 Monitoring Data
##
####
##
#
#
#
<<
<
<<<
<<
<
<
<
#
#
#
####
#
#
#
#
<<
<<<
<<
<
<
<
##
####
##
#
#
#
<
##
####
##
#
#
#
NN
0 5 Miles0 5 Miles
September October
##
####
##
#
#
#
##
####
##
#
#
#
N N
0 5 Miles 0 5 Miles
November December
N N
0 5 Miles 0 5 Miles
July August
Chlorophyll-a Levels5 - 9.9 ug/L
10+ ug/L
Secchi Transparency Depths# 1 - 4 meters# 5 - 9 meters
10+ meters#
<
<
Figure 3-30 cont. 2003 Monthly Secchi Transparency Depths and Chlorophyll-a Levels
89

2002/3 Water Quality Status Report for Marine Waters Section 3 King County Department of Natural Resources & Parks Summary of 2002/3 Monitoring Data Turbidity. Turbidity is another measure of water clarity but differs from Secchi disk measurements in that it is an expression of the amount of light scattered or reflected (the lower the turbidity value, the more transparent the water). Dissolved and suspended solids (including detritus, plankton, and particulates), can affect the water’s optical properties resulting in high turbidity values. Wind and waves can indirectly increase turbidity by stirring up particulates in the water. In 2002, turbidity values ranged from less than 0.5 to 20.5 Nephelometric Turbidity Units (NTU). Highest turbidities were observed at surface and bottom depths. July had the highest turbidity values, which differed from previous years. In 2003, turbidity values ranged from less than 0.5 to 13.8 NTU. The highest turbidity values occurred in November and December. Appendix A contains turbidity values at discrete depths for all offshore stations sampled in 2002 and 2003. Variations in turbidity from 1999-2003 are presented in Appendix F. Photosynthetically Active Radiation. Photosynthetically active radiation (PAR), also expressed as light intensity, is a measure of the amount of light available to macrophytes and phytoplankton for photosynthesis. Light intensity values for both 2002 and 2003 ranged from 0 to 3733 micromoles per second per square meter (µmol/s/m2), with the highest single value measured at station NSEX01 (East Passage) in May 2003. Figure 3-31 shows the seasonal attenuation of PAR with depth. As expected, the highest PAR levels occurred at or near the surface for all stations throughout the year, and dropped rapidly with depth. Less than one percent of the surface PAR was propagated to depths greater than 35 meters. This suggests that photosynthesis is limited to the upper 35 meters of the water column. The highest penetration of surface PAR occurs during winter when productivity is relatively low. Light penetration decreases during the spring and summer blooms, with the lowest light penetration occurring in October. This can be attributed to high particulate loads resulting from the first large rain events of the fall. PAR measurements at discrete depths are located in Appendix A. Variations in PAR from 1999-2003 can be found in Appendix F.
0
10
20
30
40
50
60
70
80
90
100
0 10 20 30 40 50 60 70 80 90
% Surface PAR
Dep
th (m
eter
s)
January
April
July
October
Figure 3-31. Seasonal Attenuation of 2002 and 2003 Mean Photosynthetically
Active Radiation (PAR) with Depth at All Offshore Stations
90

2002/3 Water Quality Status Report for Marine Waters Section 3 King County Department of Natural Resources & Parks Summary of 2002/3 Monitoring Data 3.2.6 Nutrients Nitrogen Compounds Nitrogen is ubiquitous in the marine environment and occurs in many organic and inorganic chemical forms. Dissolved inorganic nitrogen compounds include ammonium ion (NH4
+), nitrate (NO3
-), and nitrite (NO2-), of which nitrate is the predominant form in seawater. King
County reports dissolved ammonia concentrations (ammonium ion that has been converted to ammonia), and the sum of nitrate and nitrite concentrations (nitrate + nitrite) due to the analytical methodology employed. Nitrite concentrations in the water column are naturally low compared to nitrate, so the nitrate + nitrite results can be considered almost entirely nitrate. Discussion of the results for dissolved inorganic nitrogen compounds is provided below. Ammonia-Nitrogen Offshore. Maximum ammonia-nitrogen (NH3-N) concentrations observed at all offshore stations were 0.22 mg/L in 2002, and 0.41 mg/L in 2003. The maximum concentrations were detected at the West Point TP outfall station (KSSK02) in both years. The mean concentrations for all stations and depths were 0.028 mg/L and 0.020 mg/L in 2002 and 2003, respectively. These means were calculated by assigning non-detects (values < MDL) concentrations of 0.01 mg/L, thereby biasing the mean values high. Higher concentrations of NH3-N tended to occur at greater depths at all stations. This distribution reflects the decay of organic nitrogen from phytoplankton settling out of the photic zone. Figures 3-32 and 3-33 show NH3-N vertical profiles for six stations in 2002 and 2003, respectively. Of the 687 NH3-N measurements made in 2002, only four exceeded concentrations of 0.10 mg/L. Three of these occurred at the West Point TP outfall station and one occurred at the South TP outfall station (LSEP01). In 2003, there were eight concentrations greater than 0.10 mg/L: seven at the West Point TP outfall station, and one at the Point Wells station (0.14 mg/L) at a depth of 129 meters in May. This corresponded with high phytoplankton concentrations at that location. The vertical distribution of NH3-N at outfall stations reflect the trapping depth of the outfall plume. This explains the maximum values seen at 25 and 35 meters at KSSK02, and at 100 meters at LSEP01. Ammonia concentrations at stations KSBP01 and LSNT01 from 1994-2003 are presented in Table 3-8. Washington State ammonia criteria for marine surface waters are based upon nonionized ammonia. However, for total ammonia, which is measured by King County, the State uses U.S. EPA’s criteria concentrations based upon total ammonia. These total ammonia criteria are based on water temperature, salinity, and pH. Assuming a temperature of 15 oC, a salinity of 30 PSS, and a pH of 8.0, all ammonia concentrations measured at offshore stations were well below the 1.6 mg/L chronic criterion. The highest concentration measured was almost four times lower than the criterion. Beach Stations. NH3-N concentrations at beach stations ranged from less than the MDL (0.01 mg/L) to a maximum of 0.11 mg/L found at the intertidal station just south of the West Point TP (KSSN05) in 2002. In 2003, NH3-N ranged from less than 0.01 mg/L to a maximum of 0.39 mg/L measured at the Fauntleroy Cove station (LSVW01). Excluding the maximum value measured for each year, all other concentrations were below 0.08 mg/L. Mean concentrations
91

2002/3 Water Quality Status Report for Marine Waters Section 3 King County Department of Natural Resources & Parks Summary of 2002/3 Monitoring Data
KSSK02
Concentration (mg/L)
0.00 0.05 0.10 0.15 0.20 0.25D
epth
(met
ers)
0
10
20
30
40
50
60
LSEP01
Concentration (mg/L)
0.00 0.05 0.10 0.15 0.20 0.25
Dep
th (m
eter
s)
0
25
50
75
100
125
150
KSBP01
Concentration (mg/L)
0.00 0.05 0.10 0.15 0.20 0.25D
epth
(met
ers)
0
50
100
150
200
JanFebMarAprMayJunJulAugSepOctNovDec
CK200P
Concentration (mg/L)
0.00 0.05 0.10 0.15 0.20 0.25
Dep
th (m
eter
s)
0
10
20
30
40
50
60
LSNT01
Concentration (mg/L)
0.00 0.05 0.10 0.15 0.20 0.25
Dep
th (m
eter
s)
0
25
50
75
100
125
150
175
200
LTED04
Concentration (mg/L)
0.00 0.05 0.10 0.15 0.20 0.25
Dep
th (m
eter
s)
0
20
40
60
80
Figure 3-32. Ammonia-Nitrogen Concentrations (mg/L) at Six Stations in 2002
92

2002/3 Water Quality Status Report for Marine Waters Section 3 King County Department of Natural Resources & Parks Summary of 2002/3 Monitoring Data
KSSK02
Concentration (mg/L)
0.0 0.1 0.2 0.3 0.4 0.5D
epth
(met
ers)
0
10
20
30
40
50
60
LSEP01
Concentration (mg/L)
0.0 0.1 0.2 0.3 0.4 0.5
Dep
th (m
eter
s)
0
25
50
75
100
125
150
KSBP01
Concentration (mg/L)
0.0 0.1 0.2 0.3 0.4 0.5D
epth
(met
ers)
0
50
100
150
200
JanFebMarAprMayJunJulAugSepOctNovDec
CK200P
Concentration (mg/L)
0.0 0.1 0.2 0.3 0.4 0.5
Dep
th (m
eter
s)
0
10
20
30
40
50
60
LSNT01
Concentration (mg/L)
0.0 0.1 0.2 0.3 0.4 0.5
Dep
th (m
eter
s)
0
25
50
75
100
125
150
175
200
LTED04
Concentration (mg/L)
0.0 0.1 0.2 0.3 0.4 0.5
Dep
th (m
eter
s)
0
20
40
60
80
Figure 3-33. Ammonia-Nitrogen Concentrations (mg/L) at Six Stations in 2003
93
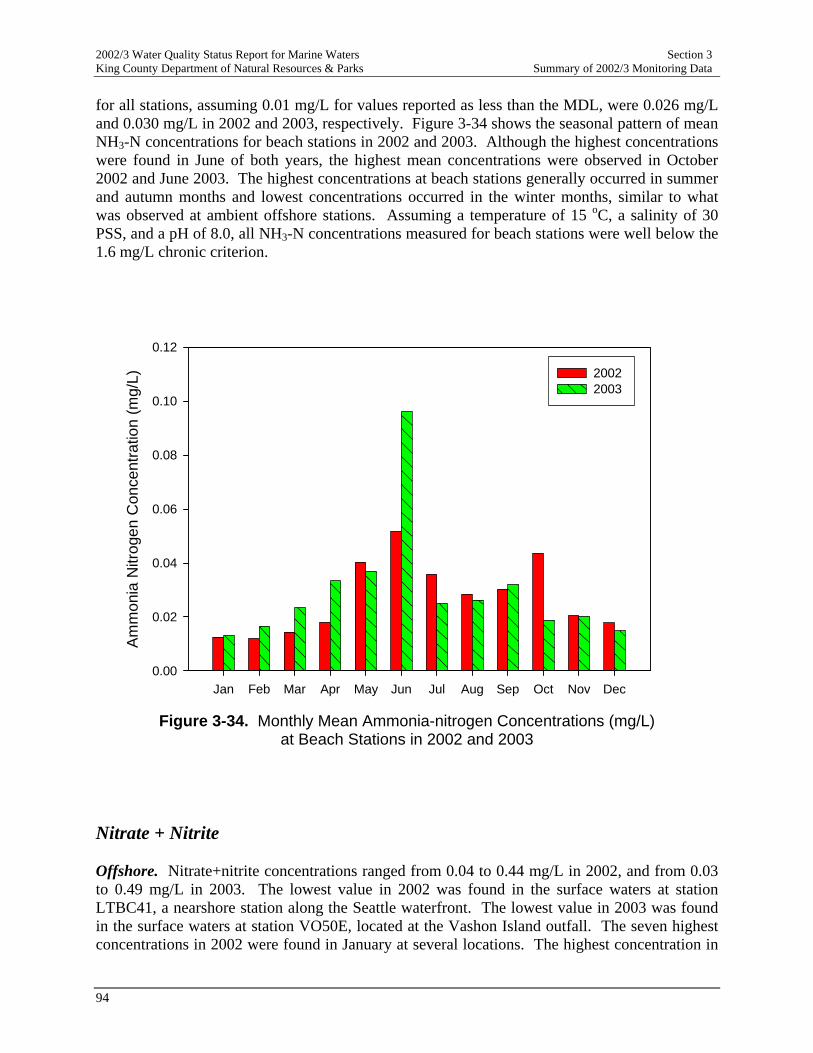
2002/3 Water Quality Status Report for Marine Waters Section 3 King County Department of Natural Resources & Parks Summary of 2002/3 Monitoring Data for all stations, assuming 0.01 mg/L for values reported as less than the MDL, were 0.026 mg/L and 0.030 mg/L in 2002 and 2003, respectively. Figure 3-34 shows the seasonal pattern of mean NH3-N concentrations for beach stations in 2002 and 2003. Although the highest concentrations were found in June of both years, the highest mean concentrations were observed in October 2002 and June 2003. The highest concentrations at beach stations generally occurred in summer and autumn months and lowest concentrations occurred in the winter months, similar to what was observed at ambient offshore stations. Assuming a temperature of 15 oC, a salinity of 30 PSS, and a pH of 8.0, all NH3-N concentrations measured for beach stations were well below the 1.6 mg/L chronic criterion.
Jan Feb Mar Apr May Jun Jul Aug Sep Oct Nov Dec
Am
mon
ia N
itrog
en C
once
ntra
tion
(mg/
L)
0.00
0.02
0.04
0.06
0.08
0.10
0.12
2002 2003
Figure 3-34. Monthly Mean Ammonia-nitrogen Concentrations (mg/L)
at Beach Stations in 2002 and 2003 Nitrate + Nitrite Offshore. Nitrate+nitrite concentrations ranged from 0.04 to 0.44 mg/L in 2002, and from 0.03 to 0.49 mg/L in 2003. The lowest value in 2002 was found in the surface waters at station LTBC41, a nearshore station along the Seattle waterfront. The lowest value in 2003 was found in the surface waters at station VO50E, located at the Vashon Island outfall. The seven highest concentrations in 2002 were found in January at several locations. The highest concentration in
94

2002/3 Water Quality Status Report for Marine Waters Section 3 King County Department of Natural Resources & Parks Summary of 2002/3 Monitoring Data 2003 was measured in October at the southernmost offshore station, NSEX01, at a depth of 55 meters. The mean concentrations for all stations and depths combined were 0.323 mg/L and 0.320 mg/L in 2002 and 2003, respectively. Concentrations were generally higher during the winter months when phytoplankton growth was lowest and fluvial input was highest. Concentrations declined in the upper portion of the water column (surface to 25 meters) during the spring and summer months due to increased levels of nutrient uptake by phytoplankton. As with NH3-N, concentrations tended to increase with depth due to the remineralization of organic nitrogen from settling phytoplankton. Results for six representative stations are shown in Figures 3-35 and 3-36 for vertical nitrate+nitrite distributions in 2002 and 2003, respectively. Nitrate+nitrite concentrations at stations KSBP01 and LSNT01 from 1994-2003 are presented in Table 3-8. Beach. Nitrate+nitrite concentrations at beach stations ranged from less than the MDL (0.02 mg/L) in both years to 0.47 mg/L in 2002 and 0.77 mg/L in 2003. The mean concentrations were 0.248 mg/L and 0.262 mg/L in 2002 and 2003, respectively. Overall, the patterns were similar to those of the offshore stations. Concentrations were highest in the winter and lowest in the summer. Figure 3-37 shows the monthly mean nitrate+nitrite concentrations for all beach stations in both years. Total Phosphorus Offshore. Phosphorus occurs as dissolved inorganic, dissolved organic, and particulate phosphorus in seawater. Generally, particulate phosphorus is the most abundant of the three forms. There are several forms of inorganic phosphorus found in the marine environment, with the most abundant being orthophosphate. Total phosphorus, which includes all forms of inorganic and organic phosphorus, is measured by King County. Phosphorus concentrations at all offshore stations (all depths combined) ranged from 0.032 to 0.119 mg/L in 2002, and from 0.033 to 0.108 mg/L in 2003. Mean concentrations in each year were equivalent and measured 0.069 mg/L. These results are comparable to previous years. There was very little variability in phosphorus concentrations by depth, with mean surface concentrations of 0.064 mg/L and mean concentrations at depths greater than 190 m of 0.071 mg/L. A seasonal trend in phosphorus concentrations was observed; highest concentrations occurred in the winter and lowest concentrations occurred during the summer in surface waters where photosynthesis was actively occurring. Phosphorus concentrations at stations KSBP01 and LSNT01 from 1994-2003 are presented in Table 3-8. Beach. Total phosphorus at the beach stations ranged from 0.032 to 0.258 mg/L in 2002, and from 0.039 to 0.313 mg/L in 2003. Mean concentrations were 0.077 and 0.089 mg/L in 2002 and 2003, respectively. Variability was greater at beach stations than at offshore stations due to differences in freshwater inputs (greater at beach stations due to proximity to streams and rivers). The highest values were measured at the southern West Point Station (KSSN05) in May 2002 and December 2003. The same seasonal trend observed at the offshore stations also occurred at the beach locations.
95

2002/3 Water Quality Status Report for Marine Waters Section 3 King County Department of Natural Resources & Parks Summary of 2002/3 Monitoring Data
KSSK02
Concentration (mg/L)
0.0 0.1 0.2 0.3 0.4 0.5D
epth
(met
ers)
0
10
20
30
40
50
60
LSEP01
Concentration (mg/L)
0.0 0.1 0.2 0.3 0.4 0.5
Dep
th (m
eter
s)
0
25
50
75
100
125
150
KSBP01
Concentration (mg/L)
0.0 0.1 0.2 0.3 0.4 0.5
Dep
th (m
eter
s)
0
50
100
150
200
JanFebMarAprMayJunJulAugSepOctNovDec
CK200P
Concentration (mg/L)
0.0 0.1 0.2 0.3 0.4 0.5
Dep
th (m
eter
s)
0
10
20
30
40
50
60
LSNT01
Concentration (mg/L)
0.0 0.1 0.2 0.3 0.4 0.5
Dep
th (m
eter
s)
0
25
50
75
100
125
150
175
200
LTED04
Concentration (mg/L)
0.0 0.1 0.2 0.3 0.4 0.5
Dep
th (m
eter
s)
0
20
40
60
80
Figure 3-35. Nitrate+Nitrite Concentrations (mg/L) at Six Stations in 2002
96

2002/3 Water Quality Status Report for Marine Waters Section 3 King County Department of Natural Resources & Parks Summary of 2002/3 Monitoring Data
KSSK02
Concentration (mg/L)
0.0 0.1 0.2 0.3 0.4 0.5D
epth
(met
ers)
0
10
20
30
40
50
60
LSEP01
Concentration (mg/L)
0.0 0.1 0.2 0.3 0.4 0.5
Dep
th (m
eter
s)
0
25
50
75
100
125
150
KSBP01
Concentration (mg/L)
0.0 0.1 0.2 0.3 0.4 0.5D
epth
(met
ers)
0
50
100
150
200
JanFebMarAprMayJunJulAugSepOctNovDec
CK200P
Concentration (mg/L)
0.0 0.1 0.2 0.3 0.4 0.5
Dep
th (m
eter
s)
0
10
20
30
40
50
60
LSNT01
Concentration (mg/L)
0.0 0.1 0.2 0.3 0.4 0.5
Dep
th (m
eter
s)
0
25
50
75
100
125
150
175
200
LTED04
Concentration (mg/L)
0.0 0.1 0.2 0.3 0.4 0.5
Dep
th (m
eter
s)
0
20
40
60
80
Figure 3-36. Nitrate+Nitrite Concentrations (mg/L) at Six Stations in 2003
97

2002/3 Water Quality Status Report for Marine Waters Section 3 King County Department of Natural Resources & Parks Summary of 2002/3 Monitoring Data
Jan Feb Mar Apr May Jun Jul Aug Sep Oct Nov Dec
Nitr
ate
+ N
itrite
Con
cent
ratio
n (m
g/L)
0.0
0.1
0.2
0.3
0.4
0.5
0.6
2002 2003
Figure 3-37. Monthly Mean Nitrate+nitrite Concentrations (mg/L)
at Beach Stations in 2002 and 2003 Silica Offshore. Silica concentrations at offshore stations ranged from 0.22 to 4.7 mg/L in 2002, and from 0.34 to 3.9 mg/L in 2003. The mean concentration for all offshore samples combined was 2.6 mg/L in 2002 and 2003. This matches historical levels of silica measured at offshore stations. Silica concentrations are shown in Figures 3-38 and 3-39 for six selected stations in 2002 and 2003, respectively. Concentrations tended to be lower in the surface layer during the summer months when diatoms that use silica for frustule growth were most abundant. Highest concentrations occurred during the winter months when uptake by phytoplankton was low and freshwater inputs were relatively high. Surface concentrations at the Elliott Bay station, LTED04, were higher in the winter months than at the other sites due to riverine input from the Duwamish River. Silica concentrations at stations KSBP01 and LSNT01 from 1994-2003 are presented in Table 3-8. Beach Stations. Silica concentrations at beach stations were slightly higher than those of offshore stations due to the closer proximity of beach stations to sources of freshwater runoff. Values in 2002 ranged from 0.48 to 5.2 mg/L, with a mean concentration of 2.7 mg/L.
98

2002/3 Water Quality Status Report for Marine Waters Section 3 King County Department of Natural Resources & Parks Summary of 2002/3 Monitoring Data
KSSK02
Concentration (mg/L)
0 1 2 3 4 5D
epth
(met
ers)
0
10
20
30
40
50
60
LSEP01
Concentration (mg/L)
0 1 2 3 4 5
Dep
th (m
eter
s)
0
25
50
75
100
125
150
KSBP01
Concentration (mg/L)
0 1 2 3 4 5D
epth
(met
ers)
0
50
100
150
200
JanFebMarAprMayJunJulAugSepOctNovDec
CK200P
Concentration (mg/L)
0 1 2 3 4 5
Dep
th (m
eter
s)
0
10
20
30
40
50
60
LSNT01
Concentration (mg/L)
0 1 2 3 4 5
Dep
th (m
eter
s)
0
25
50
75
100
125
150
175
200
LTED04
Concentration (mg/L)
0 1 2 3 4 5
Dep
th (m
eter
s)
0
20
40
60
80
Figure 3-38. Silica Concentrations (mg/L) at Six Stations in 2002
99

2002/3 Water Quality Status Report for Marine Waters Section 3 King County Department of Natural Resources & Parks Summary of 2002/3 Monitoring Data
KSSK02
Concentration (mg/L)
0 1 2 3 4 5D
epth
(met
ers)
0
10
20
30
40
50
60
LSEP01
Concentration (mg/L)
0 1 2 3 4 5
Dep
th (m
eter
s)
0
25
50
75
100
125
150
KSBP01
Concentration (mg/L)
0 1 2 3 4 5D
epth
(met
ers)
0
50
100
150
200
JanFebMarAprMayJunJulAugSepOctNovDec
CK200P
Concentration (mg/L)
0 1 2 3 4 5
Dep
th (m
eter
s)
0
10
20
30
40
50
60
LSNT01
Concentration (mg/L)
0 1 2 3 4 5
Dep
th (m
eter
s)
0
25
50
75
100
125
150
175
200
LTED04
Concentration (mg/L)
0 1 2 3 4 5
Dep
th (m
eter
s)
0
20
40
60
80
Figure 3-39. Silica Concentrations (mg/L) at Six Stations in 2003
100

2002/3 Water Quality Status Report for Marine Waters Section 3 King County Department of Natural Resources & Parks Summary of 2002/3 Monitoring Data Concentrations in 2003 ranged from 1.1 to 10.0 mg/L, with a mean of 3.0 mg/L. The higher concentrations observed in 2003 can be attributed to increased precipitation and, thus, a higher level of freshwater runoff and associated silica transport to marine waters. Figure 3-40 shows the monthly mean silica concentrations at beach stations for 2002 and 2003. The highest concentrations in both years was measured at station KSHZ03 (Carkeek Park), near the mouth of Piper’s Creek. Station ITCARKEEKP, which is also located near Carkeek Park, but outside the influence of Piper’s Creek, had silica concentrations lower than KSHZ03, the station at the mouth of Piper’s Creek. This suggests that the silica at KSHZ03 is fluvial in origin.
Jan Feb Mar Apr May Jun Jul Aug Sep Oct Nov Dec
Silic
a C
once
ntra
tion
(mg/
L)
0
1
2
3
4
5
6
2002 2003
Figure 3-40. Monthly Mean Silica Concentrations (mg/L)
at Beach Stations in 2002 and 2003 3.2.7 Chlorophyll-a and Pheophytin Chlorophyll-a (a photosynthetic pigment) and pheophytin (a degradation product of chlorophyll) measurements were made at depths between 1 and 35 m at all offshore stations. Chlorophyll-a and pheophytin were not measured at beach stations. Several factors influence chlorophyll concentrations, including availability of light and nutrients, physiological status of phytoplankton, air temperature, wind, and zooplankton grazing. Pheopigments, such as
101

2002/3 Water Quality Status Report for Marine Waters Section 3 King County Department of Natural Resources & Parks Summary of 2002/3 Monitoring Data pheophytin, are degradation products of chlorophyll produced when zooplankton graze on phytoplankton cells. Consequently, pheophytin concentrations tend to be highest when chlorophyll concentrations are high. Chlorophyll-a values for both 2002 and 2003 ranged from 0.05 to 32.70 micrograms per liter (µg/L), with a mean concentration of 2.66 µg/L. Pheophytin values for both 2002 and 2003 ranged from less than the MDL (0.02 µg/L) to 3.94 µg/L, with a mean concentration of 0.59 µg/L. Concentrations were similar in both years with mean chlorophyll-a and pheophytin concentrations of 2.80 and 0.50 µg/L in 2002, and of 2.53 and 0.68 µg/L in 2003, respectively. The highest levels of chlorophyll-a were found in surface waters at Point Wells in May 2002 and June 2003. The highest levels of pheophytin were observed at the Vashon Outfall station in June 2002 and at the West Point Outfall station in August 2003. Chlorophyll-a and pheophytin values for 2002 and 2003 can be found in Appendix A. Mean, minimum, and maximum values for the past ten years of sampling at stations KSBP01 and LSNT01 are summarized in Table 3-8. Seasonal distributions of chlorophyll-a and pheophytin were similar due to reasons discussed above. Concentrations were lowest during the winter and highest from April through August, indicating spring and summer phytoplankton blooms. Vertical distributions of chlorophyll-a at six select stations for 2002 and 2003 are shown in Figures 3-41 and 3-42, respectively. Concentrations were highest at the surface and decreased with depth due to the decreased light available for photosynthesis. Vertical distributions for pheophytin are shown in Figures 3-43 and 3-44, respectively, and are similar to the chlorophyll-a distribution patterns. Tables 3-10 and 3-11 show the timing of phytoplankton blooms, as indicated by chlorophyll-a concentrations, by station location for 2002 and 2003, respectively. The 2001 temporal trend of blooms was not apparent in either 2002 or 2003. Although maximum chlorophyll-a concentrations vary annually, phytoplankton blooms (indicated by high chlorophyll-a levels) generally occur in April or May and June or July of each year. In 2002 and 2003, blooms followed this pattern as evidenced by elevated chlorophyll-a levels during those months (see Figure 3-29). Another large bloom occurred in August of both years in the waters at Jefferson Head and Elliott Bay in 2002 and the Vashon Outfall in 2003. Major blooms were also detected in February 2003 at Jefferson Head and within East Passage. In both years, chlorophyll-a levels were elevated from April through September, with a large phytoplankton bloom in September 2002 near Jefferson Head. Variations in chlorophyll-a from 1999-2003 for stations KSBP01 and LSNT01 are shown in Figure 3-45 (note that this figure’s units are in mg/m3, which is equivalent to µg/L). Variations in chlorophyll-a from 1999-2003 for all stations can be found in Appendix F.
102

2002/3 Water Quality Status Report for Marine Waters Section 3 King County Department of Natural Resources & Parks Summary of 2002/3 Monitoring Data
KSSK02
0 5 10 15 20 25 30D
epth
(met
ers)
0
5
10
15
20
25
30
35
LSEP01
0 5 10 15 20 25 30
Dep
th (m
eter
s)
0
5
10
15
20
25
30
35
KSBP01
Concentration (µg/L)
0 5 10 15 20 25 30D
epth
(met
ers)
0
5
10
15
20
25
30
35
JanFebMarAprMayJunJulAugSepOctNovDec
CK200P
Concentration (µg/L)
0 5 10 15 20 25 30
Dep
th (m
eter
s)
0
5
10
15
20
25
30
35
LSNT01
0 5 10 15 20 25 30
Dep
th (m
eter
s)
0
5
10
15
20
25
30
35
LTED04
0 5 10 15 20 25 30
Dep
th (m
eter
s)
0
5
10
15
20
25
30
35
Concentration (µg/L) Concentration (µg/L)
Concentration (µg/L)Concentration (µg/L)
Figure 3-41. 2002 Chlorophyll-a Concentrations from Select Offshore Stations
103

2002/3 Water Quality Status Report for Marine Waters Section 3 King County Department of Natural Resources & Parks Summary of 2002/3 Monitoring Data
KSSK02
0 5 10 15 20 25 30D
epth
(met
ers)
0
5
10
15
20
25
30
35
LSEP01
0 5 10 15 20 25 30
Dep
th (m
eter
s)
0
5
10
15
20
25
30
35
KSBP01
Concentration (µg/L)
0 5 10 15 20 25 30D
epth
(met
ers)
0
5
10
15
20
25
30
35
JanFebMarAprMayJunJulAugSepOctNovDec
CK200P
Concentration (µg/L)
0 5 10 15 20 25 30
Dep
th (m
eter
s)
0
5
10
15
20
25
30
35
LSNT01
0 5 10 15 20 25 30
Dep
th (m
eter
s)
0
5
10
15
20
25
30
35
LTED04
0 5 10 15 20 25 30
Dep
th (m
eter
s)
0
5
10
15
20
25
30
35
Concentration (µg/L) Concentration (µg/L)
Concentration (µg/L)Concentration (µg/L)
Figure 3-42. 2003 Chlorophyll-a Concentrations from Select Offshore Stations
104

2002/3 Water Quality Status Report for Marine Waters Section 3 King County Department of Natural Resources & Parks Summary of 2002/3 Monitoring Data
KSSK02
Concentration (µg/L)
0 1 2 3 4 5D
epth
(met
ers)
0
5
10
15
20
25
30
35
LSEP01
Concentration (µg/L)
0 1 2 3 4 5
Dep
th (m
eter
s)
0
5
10
15
20
25
30
35
KSBP01
Concentration (µg/L)
0 1 2 3 4 5D
epth
(met
ers)
0
5
10
15
20
25
30
35
JanFebMarAprMayJunJulAugSepOctNovDec
CK200P
Concentration (µg/L)
0 1 2 3 4 5
Dep
th (m
eter
s)
0
5
10
15
20
25
30
35
LSNT01
Concentration (µg/L)
0 1 2 3 4 5
Dep
th (m
eter
s)
0
5
10
15
20
25
30
35
LTED04
Concentration (µg/L)
0 1 2 3 4 5
Dep
th (m
eter
s)
0
5
10
15
20
25
30
35
Figure 3-43. 2002 Pheophytin Concentrations from Select Offshore Stations
105
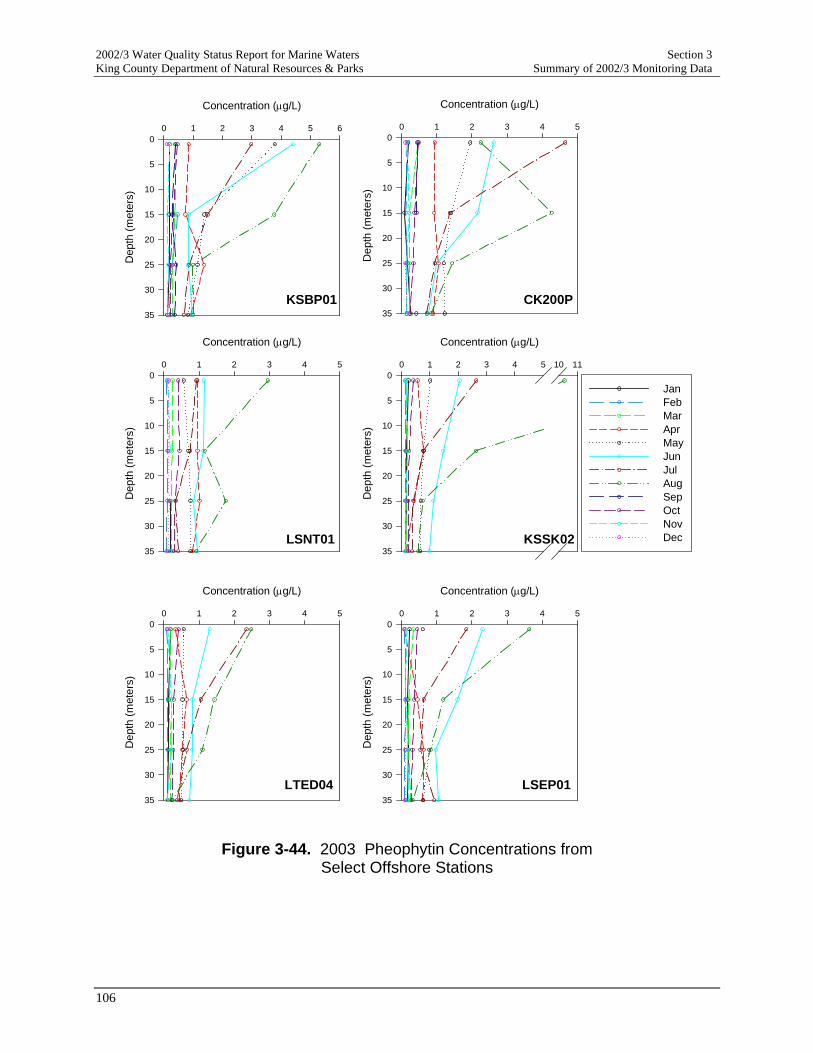
2002/3 Water Quality Status Report for Marine Waters Section 3 King County Department of Natural Resources & Parks Summary of 2002/3 Monitoring Data
KSSK02
Concentration (µg/L)
0 1 2 3 4 5 10 11D
epth
(met
ers)
0
5
10
15
20
25
30
35
LSEP01
Concentration (µg/L)
0 1 2 3 4 5
Dep
th (m
eter
s)
0
5
10
15
20
25
30
35
KSBP01
Concentration (µg/L)
0 1 2 3 4 5 6D
epth
(met
ers)
0
5
10
15
20
25
30
35
JanFebMarAprMayJunJulAugSepOctNovDec
CK200P
Concentration (µg/L)
0 1 2 3 4 5
Dep
th (m
eter
s)
0
5
10
15
20
25
30
35
LSNT01
Concentration (µg/L)
0 1 2 3 4 5
Dep
th (m
eter
s)
0
5
10
15
20
25
30
35
LTED04
Concentration (µg/L)
0 1 2 3 4 5
Dep
th (m
eter
s)
0
5
10
15
20
25
30
35
Figure 3-44. 2003 Pheophytin Concentrations from Select Offshore Stations
106

2002/3 Water Quality Status Report for Marine Waters Section 3 King County Department of Natural Resources & Parks Summary of 2002/3 Monitoring Data
Table 3-10. 2002 Phytoplankton Bloom Occurrence as Indicated by Chlorophyll-a Concentrations (stations are listed from north to south)
Location Jan Feb Mar Apr May Jun Jul Aug Sep Oct Nov Dec
Point Wells B B b b b
Jefferson Head B B b B B
Carkeek CSO Outfall B B b B
West Point Outfall b B B b b b
Denny CSO Outfall b b B b
Elliott Bay B b B b
South Plant Outfall b B B b b b
Alki Outfall b B b b
Dolphin Point b B B B b
Vashon Outfall b b B B b B = Chlorophyll concentrations above 10.0 µg/L
b = Chlorophyll concentrations above 5.0 µg/L and less than 10.0 µg/L
Table 3-11. 2003 Phytoplankton Bloom Occurrence as Indicated by Chlorophyll-a Concentrations (stations are listed from north to south)
Location Jan Feb Mar Apr May Jun Jul Aug Sep Oct Nov Dec
Point Wells b B B b b b
Jefferson Head B B B B B B
Carkeek CSO Outfall b b B B b
West Point Outfall B b b b B
Denny CSO Outfall b b B
Elliott Bay b B B
South Plant Outfall b B b B
Alki Outfall b b B b
Dolphin Point b b B
Vashon Outfall B b B
South East Passage B b B B B b b B = Chlorophyll concentrations above 10.0 µg/L
b = Chlorophyll concentrations above 5.0 µg/L and less than 10.0 µg/L
107

2002/3 Water Quality Status Report for Marine Waters Section 3 King County Department of Natural Resources & Parks Summary of 2002/3 Monitoring Data
Figure 3-45. Chlorophyll-a Variations at Stations KSBPO1 and LSNT01 from 1999-2003
108

2002/3 Water Quality Status Report for Marine Waters Section 3 King County Department of Natural Resources & Parks Summary of 2002/3 Monitoring Data 3.2.8 Beach Water Metals Water samples from 10 beaches were collected and analyzed for dissolved metals in 2002. Water samples were not analyzed for dissolved metals in 2003 after a review of the past five years of data indicated no additional sampling was required at this time. Metals analysis may be added back to the marine beach sampling program in the future on an as needed basis. In 2002, samples were collected in August, filtered, and analyzed for the following 12 metals: antimony, arsenic, cobalt, chromium, copper, lead, nickel, selenium, silver, thallium, vanadium, and zinc. Reportable concentrations for 9 of the 12 metals were detected in every sample (arsenic, cadmium, chromium, cobalt, copper, nickel, thallium, vanadium, and zinc). Zinc values will not be discussed further as the results were compromised by laboratory contamination. It is difficult to avoid laboratory contamination for dissolved zinc analysis and achieve low detection limits as the filters used to separate the dissolved from the total fraction contain trace amounts of zinc. Two metals, silver and selenium, were not detected in any of the 10 samples. Lead was detected in 6 of the 10 samples (Table 3-12). Metal concentrations at sites near wastewater and CSO outfalls were not higher than at ambient sites.
Table 3-12. Dissolved Metal Concentrations (µg/L) in Beach Water Samples from 10 Sites
Metal FOD % Minimum Maximum Mean Median
Antimony 100 0.0645 0.0942 0.0820 0.0822
Arsenic 100 1.16 1.60 1.32 1.30 Cadmium 100 0.036 0.064 0.053 0.056
Chromium 100 0.120 0.180 0.143 0.140
Cobalt 100 0.0259 0.0520 0.0381 0.0393
Copper 100 0.322 1.230 0.571 0.441
Lead 60 < 0.007 0.0180 0.0108 0.0092
Nickel 100 0.301 0.514 0.414 0.424
Selenium 0 -- -- -- --
Silver 0 -- -- -- --
Thallium 100 0.0090 0.0147 0.0104 0.0093
Vanadium 100 1.190 2.160 1.469 1.405
FOD = frequency of detection
109
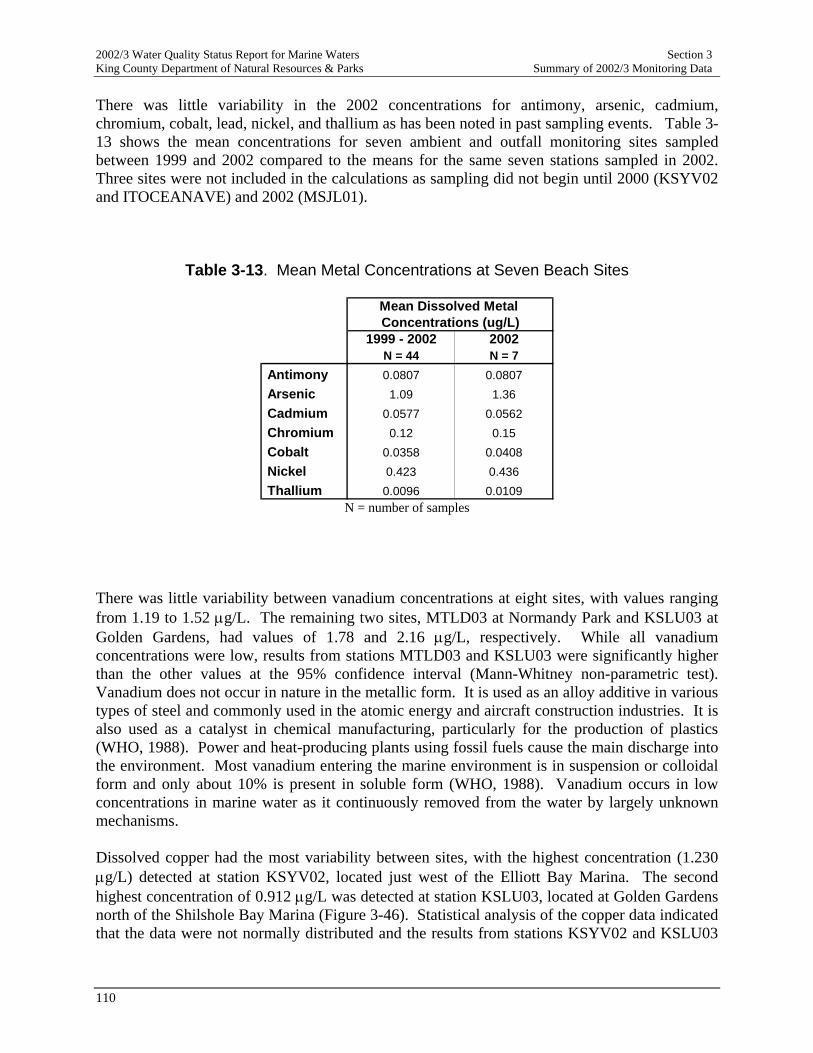
2002/3 Water Quality Status Report for Marine Waters Section 3 King County Department of Natural Resources & Parks Summary of 2002/3 Monitoring Data There was little variability in the 2002 concentrations for antimony, arsenic, cadmium, chromium, cobalt, lead, nickel, and thallium as has been noted in past sampling events. Table 3-13 shows the mean concentrations for seven ambient and outfall monitoring sites sampled between 1999 and 2002 compared to the means for the same seven stations sampled in 2002. Three sites were not included in the calculations as sampling did not begin until 2000 (KSYV02 and ITOCEANAVE) and 2002 (MSJL01).
Table 3-13. Mean Metal Concentrations at Seven Beach Sites
1999 - 2002 2002N = 44 N = 7
Antimony 0.0807 0.0807 Arsenic 1.09 1.36 Cadmium 0.0577 0.0562 Chromium 0.12 0.15 Cobalt 0.0358 0.0408 Nickel 0.423 0.436 Thallium 0.0096 0.0109
Mean Dissolved Metal Concentrations (ug/L)
N = number of samples
There was little variability between vanadium concentrations at eight sites, with values ranging from 1.19 to 1.52 µg/L. The remaining two sites, MTLD03 at Normandy Park and KSLU03 at Golden Gardens, had values of 1.78 and 2.16 µg/L, respectively. While all vanadium concentrations were low, results from stations MTLD03 and KSLU03 were significantly higher than the other values at the 95% confidence interval (Mann-Whitney non-parametric test). Vanadium does not occur in nature in the metallic form. It is used as an alloy additive in various types of steel and commonly used in the atomic energy and aircraft construction industries. It is also used as a catalyst in chemical manufacturing, particularly for the production of plastics (WHO, 1988). Power and heat-producing plants using fossil fuels cause the main discharge into the environment. Most vanadium entering the marine environment is in suspension or colloidal form and only about 10% is present in soluble form (WHO, 1988). Vanadium occurs in low concentrations in marine water as it continuously removed from the water by largely unknown mechanisms. Dissolved copper had the most variability between sites, with the highest concentration (1.230 µg/L) detected at station KSYV02, located just west of the Elliott Bay Marina. The second highest concentration of 0.912 µg/L was detected at station KSLU03, located at Golden Gardens north of the Shilshole Bay Marina (Figure 3-46). Statistical analysis of the copper data indicated that the data were not normally distributed and the results from stations KSYV02 and KSLU03
110

2002/3 Water Quality Status Report for Marine Waters Section 3 King County Department of Natural Resources & Parks Summary of 2002/3 Monitoring Data were significantly higher than the other eight sites at the 95% confidence interval (Mann-Whitney non-parametric test). Station KSLU03 consistently has the highest dissolved copper concentrations compared to other sites, with a mean concentration of 1.18 µg/L measured between 1999 and 2002. The mean dissolved copper concentration at station KSYV02 between 2000 and 2002 is 1.13 µg/L. The mean dissolved copper concentrations for all other sites part of the ambient and outfall monitoring programs between 1999 and 2002 was 0.65 µg/L. It is not unexpected that the two sites in close proximity to marinas had the highest copper concentrations. Copper is a biocide constituent of boat anti-fouling paints and is also used as a wood preservative on pilings and bulkheads in the form of chromated copper arsenate to prevent damage from marine boring organisms. Subsequent to the U.S. EPA restricting use of tributyltin (TBT) as a constituent in anti-fouling paint to ships larger than 25 meters in the late 1980s, copper-based biocides have become the primary anti-fouling paint used on recreational boats and small ships.
0.0
0.2
0.4
0.6
0.8
1.0
1.2
1.4
KSH
Z03
KSSN
04
KSSN
05
LSKR
01
MSJ
L01
ITO
CEA
NAV
E
JSVW
04
KSLU
03
KSYV
02
MTL
D03
Con
cent
ratio
n ( µ
g/L)
Figure 3-46. Dissolved Copper Concentrations at Beach Sites
Table 3-14 shows Washington State water quality criteria for seven metals. All criteria are based upon the dissolved metal fraction with the exception of the selenium criterion, which is based upon the total amount. Concentrations for all measured metals were well below the applicable criteria.
111

2002/3 Water Quality Status Report for Marine Waters Section 3 King County Department of Natural Resources & Parks Summary of 2002/3 Monitoring Data
Table 3-14. Washington State Marine Water Quality Criteria for Metals
Criterion Dissolved or Metal Total Fraction Based Acute Chronic Arsenic Dissolved 69 36
Cadmium Dissolved 42 9.3
Copper Dissolved 4.8 3.1
Lead Dissolved 210 8.1
Nickel Dissolved 74 8.2
Selenium Total 290 71
Silver Dissolved 1.9 --
Marine Water Criteria (µg/L)
3.3 Sediment Chemistry Data Results Marine sediments were collected at seven offshore stations in 2002 for the ambient sampling program. One offshore sediment sample was collected in 2002 for the outfall sampling program at the Denny Way CSO outfall. Beach sediments were collected from eight stations in 2002 (three ambient, four outfall, and one MOSS) and seven in 2003 (three ambient and four outfall). Offshore sediments were analyzed for conventional parameters, including total solids, total volatile solids, total sulfide, oil and grease, ammonia nitrogen, total organic carbon (TOC), and grain size distribution. Beach sediments were analyzed for total solids, total organic carbon, and grain size distribution. Beach sediments are composed mainly of sand and past analysis has shown that volatile solids, ammonia, and total sulfides are below method detection limits, therefore, these parameters were not analyzed in 2002 and 2003. Both offshore and beach sediments were also analyzed for metals and organic compounds including chlorinated pesticides, polychlorinated biphenyls (PCBs), and semi-volatile organics (including polynuclear aromatic hydrocarbons). Metals and ionizable organics data are presented on a dry weight basis. Non-ionizable organics were also normalized to organic carbon content for comparison to organic carbon normalized sediment standards. All sediment data are provided in Appendix B. 3.3.1 Sediment Conventionals The physical structure of the sediments influence conventional parameter results as sandy sediments contain less organic carbon, ammonia, and fine material. Offshore sediments from stations in deep water were composed mainly of silt and clays, whereas the shallow station north of the Ship Canal (KSPS01) and the two Seattle waterfront stations (LTDF01 and LTBC41) were
112

2002/3 Water Quality Status Report for Marine Waters Section 3 King County Department of Natural Resources & Parks Summary of 2002/3 Monitoring Data composed primarily of sand and gravel. Table 3-15 provides conventional parameter mean values for the eight offshore sediment stations partitioned by depth. TOC values at offshore stations ranged between 3,470 and 23,900 mg/Kg dry weight (dw), whereas values at beach stations ranged between < 500 and 3,580 mg/Kg dw. Figure 3-47 shows the relationship between TOC and grain size. The sand and gravel fraction in offshore sediments ranged from 7.1 to 93.2%. The 93.2% value was measured in sediment from the shallowest station, KSPS01, located at a depth of 12 m. Beach sediments were composed almost entirely of coarse-grained sediments, containing sand and gravel ranging from 95.4 to 99.1%. Ammonia-nitrogen was analyzed in offshore sediments only. Values ranged from 2.16 to 18.7 mg/Kg dw, with the lowest values detected at stations containing the highest proportion of sand and gravel and the lowest amount of silt and clay. The highest ammonia value was detected at LSCW02 located in central Elliott Bay, the station with the highest silt and clay fraction at 93%. Ammonia values had a strong correlation with grain size and TOC, which is consistent with previous sampling results.
Table 3-15. Offshore Station Mean Values for Conventional Parameters by Depth
< 20 35 - 90 130 - 250
N = 2 N = 2 N = 4
Total Solids (%) 69.7 46.8 32.5
Total Organic Carbon (mg/Kg dw) 5,260 19,350 21,025
Sand & gravel (%) 80.8 41.2 15.0
Silt & Clay (%) 19.1 58.8 85.0
Ammonia nitrogen (mg/Kg dw) 2.67 6.55 16.2
Total Sulfide (mg/Kg dw) 22.2 32.1 145.0
dw = dry weight
Station Depth (meters)
N= number of samples Total sulfides were analyzed in offshore sediments only and were detected in five of the eight samples at concentrations ranging between 30.4 to 278 mg/Kg dw. Detected concentrations were not strongly correlated with grain size, as was seen with other parameters.
113

2002/3 Water Quality Status Report for Marine Waters Section 3 King County Department of Natural Resources & Parks Summary of 2002/3 Monitoring Data
0
20
40
60
80
100
0 5,000 10,000 15,000 20,000 25,000
Total Organic Carbon (mg/Kg dry weight)
% S
and
& G
rave
l
Figure 3-47. Total Organic Carbon and Grain Size Relationship
3.3.2 Sediment Metals Sixteen metals were analyzed in offshore sediments and 14 were analyzed in beach sediments. Antimony and thallium were not analyzed in beach sediments as these metals have not been detected in previous samples. Table 3-16 provides a summary for metal results in both offshore and beach sediments. All results presented in this section are on a dry weight basis. Of the 16 metals analyzed in the eight offshore sediment samples in 2002, three were never detected (antimony, selenium, and thallium) and cadmium was detected at the method detection limit in only one sample. The earth metals, aluminum, iron, and manganese, were detected in all samples at typical concentrations. For offshore sediments, silver was only detected at the three sites closest to the Seattle waterfront, LTDF01, LTED04, and LTBC41. Silver was not detected in any of the beach samples analyzed in 2002 but was detected just above the method detection limit in all beach samples analyzed in 2003, ranging between 0.23 and 0.35 mg/Kg dry weight. Silver has not been detected in beach sediments in the past and the 2003 results are likely due to a change in analytical instrumentation. Silver is an element that naturally occurs as a soft metal and can enter the marine environment through mining, smelting, photographic film-processing, and sewage wastes. Other sources of silver include steel refining, cement manufacturing, and fossil fuel consumption (PTI, 1991). Silver is commonly detected in sediments along the Seattle waterfront, and other urban Puget Sound embayments, where there is a historical source of contamination. Once in the environment, silver remains until removed by physical or biological processes. Silver can change forms depending upon environmental conditions and sorption and precipitation are the dominant processes affecting movement in water and sediments (PTI, 1991). All detected silver values were at least 10 times below the Sediment Quality Standard of 6.1 mg/Kg dw.
114

2002/3 Water Quality Status Report for Marine Waters Section 3 King County Department of Natural Resources & Parks Summary of 2002/3 Monitoring Data
Table 3-16. Offshore and Beach Sediment Metals Summary
Offshore Beach Offshore Beach2002 2002 & 2003 2002 2002 & 2003
Aluminum 6,180 - 19,200 2,980 - 6,310 100 100
Antimony not detected not analyzed 0 --
Arsenic 3.5 - 17 not detected 100 0
Beryllium 0.11 - 0.46 <0.057 - 0.129 100 93
Cadmium <0.2 - 0.49 not detected 12 0
Chromium 17.0 - 42.8 5.37 - 20.5 100 100
Copper 6.93 - 55.3 3.02 - 8.72 100 100
Iron 8,680 - 28,000 5,130 - 10,700 100 100
Lead 6.5 - 48.0 <1.70 - 8.40 100 93
Manganese 148 - 477 82.3 - 172 100 100
Mercury 0.034 - 0.43 not detected 100 0
Nickel 18.1 - 35.9 6.45 - 27.3 100 100
Selenium not detected not detected 0 0
Silver <0.27 - 0.63 <0.20 - 0.35 38 47
Thallium not detected not analyzed 0 --
Zinc 24.0 - 99.3 14.8 - 29.8 100 100
Detection Frequency (%)Concentration (mg/Kg dry wt.)
Arsenic and mercury were detected in all offshore sediments but none of the beach sediments. Both arsenic and mercury concentrations were highest at the stations along the Seattle waterfront and lowest at the station outside of Elliott Bay, north of the Lake Washington Ship Canal. All arsenic values were at least three times below the Sediment Quality Standard (SQS) but mercury values at stations LTDF01 (0.42 mg/Kg dw) and LSCW02 (0.43 mg/Kg dw) were above the SQS of 0.41 mg/Kg dw. Mercury has exceeded the SQS at station LTDF01 every year sampled since 1988, which includes 10 sampling events. Mercury is a known contaminant along the Seattle waterfront and can enter the environment from atmospheric deposition, boat paints, smelting operations, electrical equipment, fossil fuel combustion, and creosote. Historical data indicates that compounds containing mercury may have been loaded onto ships docked along the waterfront during the Klondike gold rush in the late 1800’s (Seattle Engineering Dept., 1996). Sediments from station LSCW02 in central Elliott Bay exceeded the SQS for mercury in 1992, 2000, and 2002 but did not exceed the SQS in 1991, 1993, 1994, 1995, 1996, and in 1998. Chromium, copper, nickel, and zinc were detected in all offshore and beach samples. The highest concentration detected for each metal was at station LSCW02, the site with the highest
115

2002/3 Water Quality Status Report for Marine Waters Section 3 King County Department of Natural Resources & Parks Summary of 2002/3 Monitoring Data percentage of fine-grained particles. All results for chromium, copper, and zinc were well below the SQS criteria. A sediment standard for nickel does not currently exist for Washington State. As stated in the previous section, some metals have a strong association with fine-grained sediments, particularly aluminum, arsenic, chromium, copper, lead, nickel, and zinc. Figures 3-48 and 3-49 show the correlation between four metals and fine-grained particles for all sediments analyzed in 2002 and 2003. Lead results were also influenced by the amount of fine-grained particles within the sample. However, the highest concentration was detected at station LTDF01 and not the site with the highest percentage of fine-grained particles. Station LTBC41 located near the Denny Way CSO outfall contained a similar amount of fine-grained particles to that of station LTDF01, however, sediments at the Denny Way outfall site contained a lower amount of lead. All lead results were a minimum of nine times below the SQS. Lead can enter the environment through leaded gasoline, motor vehicle emissions, smelter emissions, and is also present in some types of batteries, solder, and plumbing materials. Urban runoff is one of the most common sources of lead in the marine environment, therefore, it is not unexpected that the stations closest to the City of Seattle and sources of runoff had the highest lead value.
R2 = 0.8975
R2 = 0.9097
0
10
20
30
40
50
60
0 20 40 60 80
% Silt & Clay
Con
cent
ratio
n (m
g/K
g dr
y w
eigh
t)
100
ChromiumCopper
Figure 3-48. Sediment Grain Size and Copper & Chromium Values
3.3.3 Sediment Organics Semi-volatile organics, chlorinated pesticides, and polychlorinated biphenyls (PCBs) were analyzed in eight offshore and eight beach samples in 2002 and in seven beach samples in 2003. Organotins were analyzed in the offshore sediment samples in 2002. All organics data are presented in Appendix B. All 2002 offshore semi-volatile results were qualified by the laboratory due to a holding time exceedence. Samples were extracted within the method holding time but analyzed 10 days beyond the extract-analysis holding time. Although the holding time was exceeded, the data are considered acceptable as an indication of the relative presence and concentration of specific compounds in the samples.
116

2002/3 Water Quality Status Report for Marine Waters Section 3 King County Department of Natural Resources & Parks Summary of 2002/3 Monitoring Data
R2 = 0.6342
R2 = 0.9336
0
20
40
60
80
100
120
0 20 40 60 80
% Silt & Clay
Con
cent
ratio
n (m
g/K
g dr
y w
eigh
t)
100
Nickel
Zinc
Figure 3-49. Sediment Grain Size and Nickel & Zinc Values
Offshore Sediments. A total of 27 organic compounds, 15 of which were polynuclear aromatic hydrocarbons (PAHs), were detected in the offshore sediments. Table 3-17 provides a summary of detected compounds. Three PCB Aroclors were detected: Aroclor 1248 in three samples and Aroclors 1254 and 1260 in five samples. All three Aroclors were detected in the three samples collected closest to the Seattle waterfront, LTDF01, LTED04, and LTBC41, with total PCB concentrations (the sum of all individual Aroclors) ranging from 64.0 to 84.2 µg/Kg dry weight. Total PCB concentrations for the other two samples ranged from 39.9 to 47.0 µg/Kg dry weight. Total PCB organic carbon (OC) normalized values for all samples with detectable concentrations ranged between 1.5 and 9.1 mg/Kg OC, which is below the SQS of 12 mg/Kg OC. PCBs were widely used as insulating material until their production was banned in the U.S. in 1977. However, they are present in electrical transformers and capacitors still in use and resist degradation due to their chemical structure. Current evidence suggests that the major source of commonly detected Aroclors (1248, 1254, and 1260) is cycling of previously introduced PCBs into the environment, release from landfills containing PCB waste materials, incineration of municipal refuse, and improper disposal of PCB-laden materials. The cycling process involves volatilization from ground surfaces (water, soil) into the atmosphere with subsequent removal from the atmosphere via deposition and revolatilization. PCBs are also cycled through the environment by biological processes, such as bioaccumulation and food chain transfer. Two chlorinated pesticides, 4,4’-DDT and 4,4’-DDD (a breakdown product of DDT) were detected in sediments from two stations. A value of 2.8 µg/Kg dry weight of 4,4’-DDD was detected at station LTDF01 and a value of 12.0 µg/Kg dry weight of 4,4’-DDT was detected at station LTCA02. There are no Washington State Sediment Standards for these two pesticides.
117

2002/3 Water Quality Status Report for Marine Waters Section 3 King County Department of Natural Resources & Parks Summary of 2002/3 Monitoring Data
Table 3-17. 2002 Sediment Summary for Organics
Compound RangeDetection Frequency Range
Detection Frequency
Aroclor 1248 < 1.8 - 21.7 3/8 --- 0/15Aroclor 1254 < 1.8 - 35.0 5/8 --- 0/15Aroclor 1260 < 1.8 - 34.8 5/8 < 1.3 - 15.2 1/154,4'-DDD < 1.5 - 2.8 1/8 --- 0/154,4'-DDT < 1.5 - 12.0 1/8 --- 0/15Acenapthene < 9.5 - 67.8 1/8 --- 0/15Acenaphthylene < 20 - 74.0 1/8 --- 0/15Anthracene < 13 - 306 7/8 < 4.0 - 6.5 1/15Benzo(a)anthracene 20.0 - 729 8/8 < 2.0 - 19.1 2/15Benzo(a)pyrene 29.4 - 958 8/8 < 3.0 - 18.9 3/15Benzo(b)fluoranthene 25.6 - 1,120 8/8 < 3.0 - 9.57 1/15Benzo(g,h,i)perylene 30 - 466 8/8 < 8.0 - 12.0 2/15Benzo(k)fluoranthene 14 - 569 8/8 < 3.0 - 17.5 2/15Benzoic acid 88 - 130 8/8 < 13 - 43.0 8/15Benzyl butyl phthalate < 8.2 - 24 4/8 < 6.0 - 15.0 1/15Bis(2-ethylhexyl)phthalate 20.8 - 81.7 8/8 < 6.7 - 22.8 12/15Chrysene 21 - 754 8/8 < 4.0 - 19.4 2/15Coprostanol --- 0/8 < 14 - 74.6 1/15Dibenzo(a,h)anthracene 24 - 163 8/8 --- 0/15Dibenzofuran < 19 - 32 1/8 --- 0/15Di-n-butyl phthalate 14.4 - 30 8/8 < 5.0 - 96.5 14/15Fluoranthene 33 - 1,180 8/8 < 8.0 - 41.6 3/15Hexachlorobenzene --- 0/8 < 0.66 - 2.51 1/15Indeno(1,2,3-cd)pyrene 47 - 457 8/8 < 9.0 - 10.0 1/15Naphthalene < 19 - 30 1/8 --- 0/15Phenanthrene 16 - 545 8/8 < 4.0 - 42.2 3/15Phenol < 30 - 852 7/8 < 9.0 - 20.3 1/15Pyrene 41.2 - 1,080 8/8 <4.0 - 55.2 5/15Tri-n-butyltin 0.6 - 56.6 8/8 --- ---
Units are µg/Kg dry weight
Subtidal Beach
Several PAHs were detected in all eight samples. PAHs are constituents in creosote and can also enter the environment from fossil-fuel combustion and asphalt sealants. PAHs are associated with urbanization and can be transported into the marine environment through atmospheric deposition, runoff from streams and storm drains, and from creosote-treated pilings. PAHs are not associated with treated wastewater effluent and PAHs are not usually detected in effluent from the West Point or South Plant Treatment Plants. Creosote is used as a wood preservative
118

2002/3 Water Quality Status Report for Marine Waters Section 3 King County Department of Natural Resources & Parks Summary of 2002/3 Monitoring Data on marine pilings and contains a complex mixture of compounds, typically consisting of about 85% PAHs and 2-17% phenolic compounds. PAHs that contain two or three benzene rings are considered low molecular weight PAHs (LPAHs) and degrade more rapidly than high molecular weight PAHs (HPAHs) which contain four or more benzene rings. HPAHs have a relatively slow degradation rate. Total LPAH concentrations (includes the sum of acenaphthene, acenaphthylene, anthracene, fluorene, naphthalene, 2-methylnaphthalene, and phenanthrene) ranged from 27.7 to 1,091.6 µg/Kg dry weight (1.4 to 68.7 mg/Kg OC). Figure 3-50 shows the spatial distribution of LPAH concentrations. Phenanthrene contributed the highest percentage to overall LPAH concentrations, with concentrations accounting between 57 and 100% (mean was 68%) of the total LPAH value. Although sediments from station LTDF01 along the waterfront contained the highest LPAH concentrations, all sediment results for total LPAHs and individual PAHs that comprise the total LPAH value were below SQS criteria. Total HPAH concentrations includes the sum of benzo(a)anthracene, benzo(a)pyrene, benzo(b)fluoranthene, benzo(k)fluoranthene, benzo(g,h,i)perylene, dibenzo(a,h)anthracene, fluoranthene, indeno(1,2,3-cd)pyrene, pyrene, and chrysene. Total HPAH values ranged from 285 to 7,476 µg/Kg dry weight (15.1 to 470.8 mg/Kg OC). Figure 3-51 shows the spatial distribution of HPAH concentrations. Benzofluoranthenes contributed between 14 and 23%, pyrene between 14 and 21%, and fluoranthene between 13 and 16% of the total HPAH values. Sediment from the station closest to the Seattle shoreline, LTDF01, had the highest HPAH concentration followed by sediment from KSPS01 located near the Shilshole Bay Marina. All sediment values for total HPAHs and individual PAHs that comprise the total HPAH value were below SQS criteria. Other semi-volatile organics detected in offshore sediments included benzoic acid, phenol, and three phthalate compounds. No values exceeded SQS criteria. Organotins, mainly in the form of tri-n-butyltin (TBT), were detected in all sediments but SQS criteria does not exist for organotins. Figure 3-52 and 3-53 show spatial distributions for phenol and TBT. Phenol was detected in seven samples at concentrations ranging from 26.4 to 851.9 µg/Kg dry weight. The highest value, detected at station KSPS01 near the Shilshole Bay Marina, exceeded the phenol SQS of 420 µg/Kg dry weight. As stated above, creosote can contain between 2 and 17% phenolic compounds and is also used as a general disinfectant, in the manufacture of artificial resins and epoxys, and contained in some paints and varnish removers. Although there are still some creosote-treated pilings in and around the marina, phenol was not detected from this site previously. TBT was detected at all sites with the highest concentrations found at stations LTBC41 (56.6 µg/Kg dry weight) and LTDF01 (32.0 µg/Kg dry weight). TBT is allowed as a component in anti-fouling paints on ships over 25 meters, therefore, it is not unexpected that sediments from the two sites in Elliott Bay closest to the shoreline with heavy commercial vessel traffic contained the greatest amount of TBT.
119

2002/3 Water Quality Status Report for Marine Waters Section 3 King County Department of Natural Resources & Parks Summary of 2002/3 Monitoring Data
Figure 3-50. 2002 Offshore Sediment LPAH Concentrations
Figure 3-51. 2002 Offshore Sediment HPAH Concentrations
120

2002/3 Water Quality Status Report for Marine Waters Section 3 King County Department of Natural Resources & Parks Summary of 2002/3 Monitoring Data
Figure 3-52. 2002 Offshore Sediment Phenol Concentrations
Figure 3-53. 2002 Offshore Sediment TBT Concentrations
121

2002/3 Water Quality Status Report for Marine Waters Section 3 King County Department of Natural Resources & Parks Summary of 2002/3 Monitoring Data Beach Sediments. A total of 19 organic compounds were detected in beach sediments: 11 of which were PAHs. Eight compounds were only detected in 1 out of 15 samples analyzed in both 2002 and 2003 (see Table 3-17). Of the beach sites monitored, KSHZ03 (Carkeek Park) had the most compounds detected: 9 and 11 PAHs detected in 2002 and 2003, respectively. Except for station MSJL01, sediments from beach stations contained two percent or less of organic carbon. Station MSJL01 contained between 0.30 and 0.36 % dry weight OC in 2002 and 2003, respectively. Due to the low organic carbon content, it is not appropriate to organic carbon normalize the data to assess compliance with regulatory standards that are organic carbon based. Lowest Apparent Effect Thresholds (LAETs), which are dry weight based, are more appropriate for the beach sediments. All detected values were well below AETs. Sites onshore of treatment plant or CSO outfalls had very few detected compounds compared to the other sites. 3.4 Shellfish Data Results Shellfish tissue composite samples consisting entirely of butter clams, Saxidomus giganteus, were collected from beaches as a part of the ambient and outfall monitoring programs. Shellfish were collected in August 2002 and August 2003 and analyzed for lipids, metals, semi-volatile organics, pesticides, and PCBs. Shellfish were collected at five outfall stations in 2002: KSHZ03 (Carkeek), KSSN04 and KSSN05 (West Point), LSKR01 (Alki Point), and MSJL01 (Vashon). In 2003, shellfish were collected at four outfall stations, with station KSSN04 dropped from the sampling plan. Two ambient stations, JSVW04 (Richmond Beach) and MTLD03 (Normandy Park), were sampled both years. Additionally, station ITOCEANAVE (Edmonds) was sampled in 2002 and station KSLU03 (Golden Gardens) was sampled in 2003. Shellfish were collected monthly from May through September for the analysis of fecal coliforms and enterococci. Shellfish sampling for bacterial analysis included stations KSHZ03, KSSN04, LSKR01, MSJL01, ITEDWARDSPT (Edwards Point), ITOCEANAVE, JSVW04, KSLU03, MSSM05 (Tramp Harbor), MTEC01 (Seahurst Park), and MTLD03 in 2002, and stations KSHZ03, KSSN04, KSSN05, LSKR01, MSJL01, JSVW04, KSLU03, MSSM05, and MTLD03 in 2003. Results are provided in Appendix C and are presented on a wet weight basis unless otherwise noted. Shell lengths measured for each clam included in a composite sample are also provided in Appendix C.
122

2002/3 Water Quality Status Report for Marine Waters Section 3 King County Department of Natural Resources & Parks Summary of 2002/3 Monitoring Data 3.4.1 Lipids Shellfish tissue samples were analyzed for lipid content. The amount of lipid affects the accumulation of certain organic compounds. Lipid content ranged from 0.40 to 0.76 percent in 2002, and from 0.60 to 0.83 percent in 2003 (Figure 3-54). Results were similar to those in previous years, with the exception of station MTLD03 in 2003, where lipid content was almost twice that of 2002.
0
0.1
0.2
0.3
0.4
0.5
0.6
0.7
0.8
0.9
KS
HZ03
KS
LU03
KS
SN
04
KS
SN
05
LSK
R01
LSK
S01
MS
JL01
ITOC
EA
NA
VE
JSV
W04
MTLD
03
% L
ipid
s
2002 2003
Figure 3-54. Percent Lipids in Butter Clams Collected in 2002 and 2003 Reported by
Station 3.4.2 Metals Washington State criteria do not exist for acceptable levels of metals in shellfish tissues. The U.S. Food and Drug Administration (FDA), however, has established guidance values termed Levels of Concern for five metals in molluscs: arsenic, cadmium, chromium, lead, and nickel. These guidance values are risk-based and differ for children and adults. For comparative purposes, the lower of the two values was chosen. Table 3-18 shows the Levels of Concern for the five metals listed above (FDA 1993a, b, c, d, e). The FDA has established an Action Level of 1.0 mg/kg for mercury in fish and shellfish tissues (FDA, 1995). Food products exceeding the Action Level can not be commercially traded, an important distinction from Levels of Concern.
123

2002/3 Water Quality Status Report for Marine Waters Section 3 King County Department of Natural Resources & Parks Summary of 2002/3 Monitoring Data
Table 3-18. FDA Levels of Concern for Shellfish Tissues
mg/Kg wet weightLevel of Concern
Arsenic 55Cadmium 3Chromium 11Lead 0.8Nickel 80
Action LevelMercury 1.0
Shellfish tissue was analyzed for fourteen metals in 2002 and 2003. No results exceeded any of the Levels of Concern or the Action Level for Mercury. As in 2001, beryllium was not detected in any sample. Copper (15.0 mg/Kg-dry weight) and silver (15.4 mg/Kg-dry weight) levels at ITOCEANAVE in 2002 were the highest concentrations found in either year. Arsenic, cadmium, chromium, lead, mercury, nickel, selenium, and zinc concentrations varied only slightly among stations and were similar to previously measured values. A summary of metals in shellfish tissues from 1999-2003 is provided in Table 3-19. 3.4.3 Organics Of the 98 organic compounds analyzed in shellfish tissue, only two were detected: beta-BHC and benzoic acid. Benzoic acid occurred in all samples at concentrations ranging from 1,200 to 13,100 mg/Kg-wet weight. Benzoic acid is used as a food preservative and an anti-fungal agent. However, it is also a degradation product produced by metabolic processes and is commonly found in shellfish samples. Beta-BHC was detected in two samples in 2002: KSSN04 (1.13 mg/Kg-wet weight) and KSSN05 (1.27 mg/Kg-wet weight). Beta-BHC has not been previously detected in shellfish samples at these sites. Beta-BHC was formerly used in the U.S. as an insecticide and is toxic to aquatic organisms when it bioaccumulates. 3.4.4 Bacteria Fecal coliforms and enterococci were measured in shellfish tissues collected from seven ambient and four outfall stations in 2002, and from four ambient and five outfall stations in 2003. Shellfish bacteria results are reported in Appendix C. Fecal coliform counts varied among stations and months. During the five month sampling period, counts at all monitoring stations ranged from less than the MDL (20) to 54,000 MPN/100g (most probable number per 100 grams) in 2002 (Figure 3-55), and from less than 20
124

2002/3 Water Quality Status Report for Marine Waters Section 3 King County Department of Natural Resources & Parks Summary of 2002/3 Monitoring Data
Table 3-19. Summary of Metals in Shellfish Tissue from 1999-2003
Parametermg/Kg dry wt. 2003 2002 2001 2000 1999 2003 2002 2001 2000 1999Arsenic 2.83 2.39 2.31 2.39 2.32 - 2.94 2.73 3.48 3.00Cadmium 0.057 0.057 0.057 0.062 0.048 - 0.052 0.059 0.050 0.054Chromium 0.200 0.280 0.322 0.336 0.411 - 0.438 0.556 0.815 0.565Copper 2.49 1.72 1.97 1.48 1.48 - 2.05 1.94 1.89 1.66Lead 0.153 0.240 0.135 0.144 0.176 - 0.121 0.081 0.109 0.138Nickel 0.684 0.752 0.820 0.956 0.796 - 0.847 0.904 1.05 0.859Zinc 13.8 12.7 16.0 12.7 12.9 - 12.9 17.6 13.8 11.5
2003 2002 2001 2000 1999 2003 2002 2001 2000 1999Arsenic 2.38 2.38 2.45 2.68 2.85 - 2.66 3.19 3.32 3.74Cadmium 0.046 0.059 0.058 0.056 0.054 - 0.054 0.059 0.054 0.054Chromium 0.265 0.359 0.519 0.822 0.587 - 0.200 0.419 0.640 0.420Copper 2.60 1.67 1.71 1.85 1.69 - 1.84 2.20 1.69 1.62Lead 0.106 0.101 0.088 0.110 0.107 - 0.096 0.099 0.092 0.089Nickel 0.961 1.06 1.14 1.31 0.995 - 0.822 0.937 0.988 0.987Zinc 15.0 14.5 17.3 14.1 12.3 - 13.4 16.9 14.1 13.2
2003 2002 2001 2000 1999 2003 2002 2001 2000 1999Arsenic 3.82 - - - - 3.54 2.91 - - -Cadmium 0.063 - - - - 0.068 0.066 - - -Chromium 0.255 - - - - 0.251 0.270 - - -Copper 1.91 - - - - 1.56 1.54 - - -Lead 0.116 - - - - 0.067 0.056 - - -Nickel 0.918 - - - - 0.887 0.934 - - -Zinc 15.1 - - - - 14.5 11.6 - - -
Parametermg/Kg dry wt. 2003 2002 2001 2000 1999 2003 2002 2001 2000 1999Arsenic - 3.14 - - - 3.66 3.20 3.42 2.69 2.93Cadmium - 0.058 - - - 0.074 0.064 0.059 0.082 0.063Chromium - 0.382 - - - 0.264 0.345 0.465 0.291 0.406Copper - 2.34 - - - 2.79 2.00 4.05 1.24 3.58Lead - 0.069 - - - 0.220 0.152 0.137 0.141 0.161Nickel - 0.986 - - - 0.874 0.925 0.798 1.02 0.754Zinc - 12.2 - - - 15.6 13.7 14.2 13.8 12.0
2003 2002 2001 2000 1999 2003 2002 2001 2000 1999Arsenic 2.74 - - - - 4.07 3.47 3.30 4.11 3.68Cadmium 0.060 - - - - 0.080 0.079 0.070 0.063 0.059Chromium 0.200 - - - - 0.282 0.302 0.372 0.671 0.418Copper 1.84 - - - - 1.69 1.49 1.41 1.76 1.22Lead 0.121 - - - - 0.122 0.076 0.060 0.132 0.094Nickel 0.860 - - - - 0.755 0.819 0.722 0.808 0.807Zinc 14.2 - - - - 14.6 12.6 14.4 13.3 12.8
LSKS01 MSJL01
Outfall Stations
Ambient Stations
KSHZ03 KSSN04
KSSN05 LSKR01
ITOCEANAVE JSVW04
KSLU03 MTLD03
125

2002/3 Water Quality Status Report for Marine Waters Section 3 King County Department of Natural Resources & Parks Summary of 2002/3 Monitoring Data to 3,500 MPN/100 g in 2003 (Figure 3-56). The highest counts in each year were detected at the TrampHarbor station (MSSM05) in May 2002 and September 2003. This station was also highest in fecal coliform counts in June (5,600 MPN/100 g) and September (7,900 MPN/100 g) of 2002, and in June 2003 (2,300 MPN/100 g). Richmond Beach (JSVW04) had the highest fecal counts (3,300 MPN/100 g) in August 2002. Enterococci counts also varied between stations and months. Concentrations ranged from less than the MDL (20) to 35,000 MPN/100 g in 2002 (Figure 3-57), and from less than 20 to 17,000 MPN/100 g in 2003 (Figure 3-58). The maximum counts in 2002 and 2003 occurred in samples taken from Tramp Harbor (MSSM05) during the month of June.
KSHZ03
KSSN04
LSKR01
MSJL01
ITEDWARDSPT
ITOCEANAVE
JSVW
04
KSLU03
MSSM05
MTEC01
MTLD03
Feca
l Col
iform
s (M
PN
/100
g)
0
2000
4000
6000
8000
1000050000 May
JunJulAugSep
Figure 3-55. Fecal Coliforms in Shellfish in 2002
126

2002/3 Water Quality Status Report for Marine Waters Section 3 King County Department of Natural Resources & Parks Summary of 2002/3 Monitoring Data
KSHZ03
KSSN04
KSSN05
LSKR01
MSJL01
JSVW
04
KSLU03
MSSM05
MTLD03
Feca
l Col
iform
s (M
PN/1
00 g
)
0
500
1000
1500
2000
2500
3000
3500
4000
MayJunJulAugSep
Figure 3-56. Fecal Coliforms in Shellfish in 2003
KSHZ03
KSSN04
LSKR01
MSJL01
ITEDWARDSPT
ITOCEANAVE
JSVW
04
KSLU03
MSSM05
MTEC01
MTLD03
Ent
eroc
occc
i (M
PN
/100
g)
0
5000
10000
15000
20000
25000
30000
35000MayJunJulAugSep
Figure 3-57. Enterococci in Shellfish in 2002
127

2002/3 Water Quality Status Report for Marine Waters Section 3 King County Department of Natural Resources & Parks Summary of 2002/3 Monitoring Data
KSHZ03
KSSN04
KSSN05
LSKR01
MSJL01
JSVW
04
KSLU03
MSSM05
MTLD03
Ent
eroc
occi
(MP
N/1
00 g
)
0
2 0 0 0
4 0 0 0
6 0 0 0
8 0 0 0
1 0 0 0 0
1 2 0 0 0
1 4 0 0 0
1 6 0 0 0
1 8 0 0 0
M a yJu nJu lA u gS e p
Figure 3-58. Enterococci in Shellfish in 2003
3.5 Macroalgae Data Results Macroalgae samples were collected from five outfall and five ambient beaches in 2002, and from five outfall and three ambient beaches in 2003. Samples consisted entirely of the most prevalent edible algae Ulva fenestrata, known as sea lettuce, and were analyzed for 14 metals. Macroalgae tissues were not analyzed for organic compounds. All macroalgae data discussed below are presented on a dry weight basis and are provided in Appendix D. In 2002, the point source stations KSHZ03 (Carkeek Park), KSSN04 and KSSN05 (north and south side of West Point, respectively), LSKR01 (Alki Point), and MSJL01 (Vashon Island) were sampled. Ambient stations included ITOCEANAVE (Edmonds), JSVW04 (Richmond Beach), KSLU03 (Golden Gardens), KSYV02 (Magnolia), and MTLD03 (Normandy Park). In 2003, stations ITOCEANAVE and KSYV02 were excluded from sampling. Stations were sampled in August of both years. Selenium, beryllium and mercury were not detected in any of the macroalgae samples collected in 2002 and 2003. This is consistent with previous years’ results (Table 3-20). Silver was found (at a level slightly above the detection limit) in one sample only, from the Richmond Beach station in 2002. Aluminum, arsenic, cadmium, copper, iron, manganese, and zinc were detected in all samples. Chromium was detected in all samples except for ITOCEANAVE in 2002, and KSHZ03, LSKR01, and KSLU03 in 2003. Lead was detected in all samples except for ITOCEANAVE in 2002. Nickel was detected in all samples except for ITOCEANAVE in 2002, and KSLU03 in 2003.
128

2002/3 Water Quality Status Report for Marine Waters Section 3 King County Department of Natural Resources & Parks Summary of 2002/3 Monitoring Data
Table 3-20. Metal Concentrations in Algae Over the Past Five Years
Parametermg/Kg dry wt. 2003 2002 2001 2000 1999 2003 2002 2001 2000 1999Arsenic 9.18 4.95 3.85 5.83 5.53 9.08 7.1 5.32 5.95 4.63Cadmium 0.940 0.281 0.292 0.690 0.340 0.830 0.431 0.425 0.300 <0.16Chromium <0.05 0.78 1.60 2.99 2.77 1.14 1.30 2.10 3.18 1.49Copper 6.35 9.08 10.6 17.5 7.19 6.55 8.87 33.2 17.0 8.11Lead 0.300 0.230 0.829 1.25 1.81 0.700 0.840 0.834 0.859 <1.6Nickel 2.66 2.80 2.01 4.51 4.42 3.19 2.80 2.96 3.92 3.79Zinc 16.1 8.58 11.4 14.3 14.1 18.2 15.4 15.8 14.2 16.7
2003 2002 2001 2000 1999 2003 2002 2001 2000 1999Arsenic 6.29 8.17 6.56 4.57 4.39 7.73 5.16 4.95 5.09 4.27Cadmium 0.570 0.567 0.262 0.222 0.240 0.890 0.238 0.557 0.295 0.290Chromium 2.14 4.04 6.62 4.57 4.71 <0.05 0.39 0.87 1.37 0.71Copper 8.30 18.3 29.4 24.2 8.46 4.97 10.2 7.50 22.1 3.23Lead 0.400 0.896 1.51 0.727 <1.3 0.190 0.240 0.140 0.307 <2.3Nickel 3.81 5.70 9.17 6.10 6.24 2.68 2.80 2.20 2.70 2.14Zinc 13.0 19.0 18.9 13.4 18.7 11.8 10.7 9.90 19.6 9.62
2003 2002 2001 2000 1999Arsenic 8.09 6.46 - - -Cadmium 0.670 0.780 - - -Chromium 1.79 1.10 - - -Copper 5.95 11.6 - - -Lead 0.520 0.320 - - -Nickel 6.92 6.20 - - -Zinc 13.6 18.2 - - -
Parametermg/Kg dry wt. 2003 2002 2001 2000 1999 2003 2002 2001 2000 1999Arsenic - 6.96 - - - 6.27 6.12 3.75 4.49 5.56Cadmium - 1.19 - - - 0.600 0.718 0.212 0.458 0.340Chromium - <0.05 - - - 1.20 0.890 0.900 1.66 1.63Copper - 4.41 - - - 6.10 11.0 7.60 14.0 4.51Lead - <0.008 - - - 0.630 0.290 0.604 1.11 <1.8Nickel - <0.2 - - - 4.82 4.00 3.03 2.44 4.15Zinc - 6.38 - - - 13.9 14.0 9.00 7.21 11.5
2003 2002 2001 2000 1999 2003 2002 2001 2000 1999Arsenic 6.35 5.40 4.04 5.79 4.50 - 5.27 6.12 5.46 4.52Cadmium 0.420 0.681 0.274 0.371 0.400 - 0.160 0.201 0.098 <0.16Chromium <0.05 3.60 0.930 2.74 2.11 - 0.920 1.34 3.06 2.68Copper 6.11 24.8 13.6 14.9 9.50 - 17.0 30.9 5.46 10.7Lead 0.360 1.91 0.287 0.938 <1.6 - 0.820 0.625 0.956 2.05Nickel <0.2 5.00 1.71 3.93 3.17 - 2.00 2.35 3.51 10.9Zinc 8.32 19.2 10.5 11.4 20.4 - 19.1 18.5 9.23 76.7
2003 2002 2001 2000 1999Arsenic 11.4 5.05 4.73 3.86 <7.2Cadmium 1.24 0.218 0.661 0.603 <0.42Chromium 1.15 0.590 5.20 3.12 2.19Copper 6.77 10.6 53.0 18.3 9.24Lead 1.41 1.19 1.93 0.805 <4.2Nickel 3.87 3.70 5.61 3.6 <2.9Zinc 15.2 9.16 14.7 9.02 19.2
MTLD03
Outfall Stations
Ambient Stations
MSJL01
ITOCEANAVE JSVW04
KSHZ03 KSSN04
KSSN05 LSKR01
KSLU03 KSYV02
129

2002/3 Water Quality Status Report for Marine Waters Section 3 King County Department of Natural Resources & Parks Summary of 2002/3 Monitoring Data
This Page Intentionally Left Blank.
130