section 2.2 the graph of a function. the graph of f(x) is given below. 4 0 -4 (0, -3) (2, 3) (4, 0)...
TRANSCRIPT

Section 2.2The Graph of a Function

The graph of f(x) is given below.
4
0
-4(0, -3)
(2, 3)
(4, 0) (10, 0)
(1, 0) x
y

What is the domain and range of f ?
Find f(0), f(4), and f(12)
Does the graph represent a function?
For which x is f(x)=0?
For what numbers is f(x) < 0?
For what value of x does f(x) = 3?
What are the intercepts (zeros)?
How often does the line x = 1 intersect the graph?

Section 2.3Properties of Functions

Example of an Even Function. It is symmetric about the y-axis x
y
(0,0)
x
y
(0,0)
Example of an Odd Function. It is symmetric about the origin

A function f is increasing on an open interval I if, for any choice of x1 and x2 in I, with x1 < x2, we have f(x1) < f(x2).
A function f is decreasing on an open interval I if, for any choice of x1 and x2 in I, with x1 < x2, we have f(x1) > f(x2).
A function f is constant on an open interval I if, for any choice of x in I, the values of f(x) are equal.
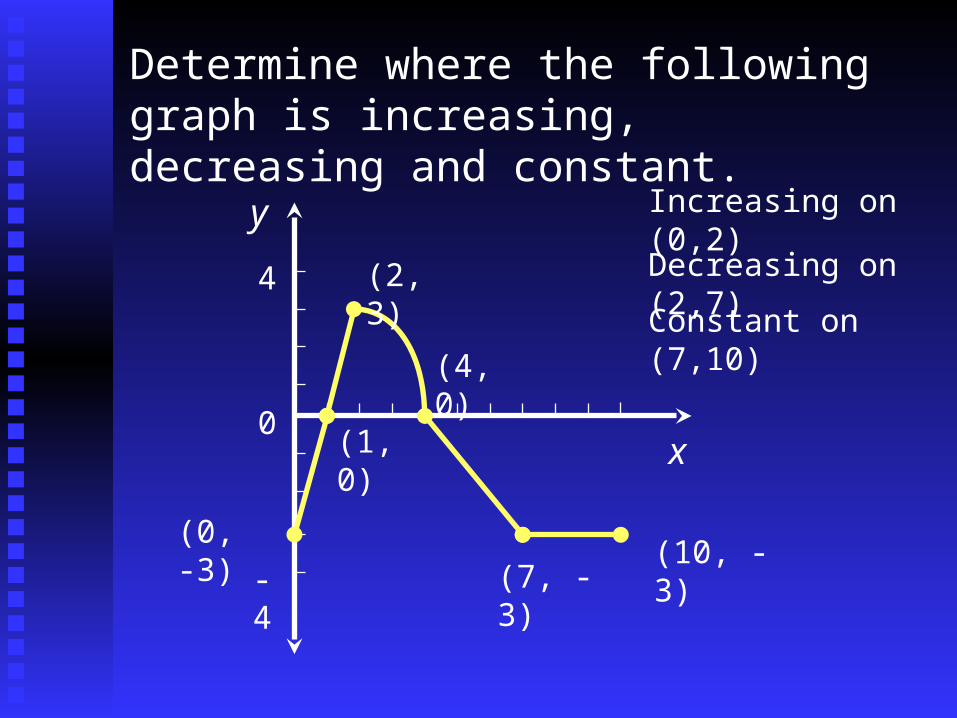
Determine where the following graph is increasing, decreasing and constant.
4
0
-4
(0, -3)
(2, 3)
(4, 0)
(10, -3)
(1, 0) x
y
(7, -3)
Increasing on (0,2)
Decreasing on (2,7)
Constant on (7,10)

A function f has a local maximum at c if there is an interval I containing c so that, for all x in I, f(x) < f(c). We call f(c) a local maximum of f.
A function f has a local minimum at c if there is an interval I containing c so that, for all x in I, f(x) > f(c). We call f(c) a local minimum of f.

Referring to the previous example, find all local maximums and minimums of the function: (hint: must be over an interval)
4
0
-4(0, -3)
(2, 3)
(4, 0)
(10, -3)
(1, 0) x
y
(7, -3)

Extreme Value Theorem: If a function f whose domain is a closed interval [a, b], then f has an absolute maximum and an absolute minimum on [a, b].
Note: An absolute max/min may also be a local max/min.

Referring to the previous example, find the absolute maximums and minimums of the function:
4
0
-4(0, -3)
(2, 3)
(4, 0)
(10, -3)
(1, 0) x
y
(7, -3)

If c is in the domain of a function y = f(x), the average rate of change of f between c and x is defined as
average rate of change =
yx
f x f cx c
( ) ( )
This expression is also called the difference quotient of f at c.

x - c
f(x) - f(c)
(x, f(x))
(c, f(c))
Secant Line
y = f(x)
The average rate of change of a function can be thought of as the average “slope” of the function, the change is y (rise) over the change in x (run).

Example: The function gives the height (in feet) of a ball thrown straight up as a function of time, t (in seconds).
610016)( 2 ttts
a. Find the average rate of change of the height of the ball between 1 and t seconds.
st
s t st
t
( ) ( )
,1
11
s t t t( ) 16 100 62
s( ) ( ) ( )1 16 1 100 1 6 902

s t st
t tt
( ) ( )
11
16 100 6 901
2
16 100 84
1
2t tt
4 4 25 21
1
2t t
t
4 4 25 21
1
2t t
t
4 4 21 1
1( )( )t t
t
4 4 21( )t

b. Using the result found in part a, find the average rate of change of the height of the ball between 1 and 2 seconds.
If t = 2, the average rate of change between 1 second and 2 seconds is: -4(4(2) - 21) = 52 ft/second.
Average Rate of Change between 1 second and t seconds is: -4(4t - 21)

Section 2.4Library of Functions;
Piecewise-Defined Functions

When functions are defined by more than one equation, they are called piecewise- defined functions.
Example: The function f is defined as:
1 3
1 3
12- 3
)(
xx
x
xx
xf
a.) Find f (1) = 3Find f (-1) = (-1) + 3 = 2
Find f (4) = - (4) + 3 = -1

1 3
1 3
12- 3
)(
xx
x
xx
xf
b.) Determine the domain of f
Domain: in interval notation),2[
or in set builder notation}2|{ xx
c.) Graph f
x
y
1 2 3
32
1

d.) Find the range of f from the graph found in part c.
Range: in interval notation)4,(
or in set builder notation}4|{ yy
x
y
1 2 3
32
1