section 10 national security and veterans affairs - census.gov · section 10 national security and...
TRANSCRIPT

Section 10
National Security and Veterans Affairs
This section displays data for nationalsecurity (national defense and homelandsecurity) and benefits for veterans. Dataare presented on national defense and itshuman and financial costs; active andreserve military personnel; and federallysponsored programs and benefits for vet-erans, and funding, budget and selectedagencies for homeland security. The prin-cipal sources of these data are the annualSelected Manpower Statistics and theAtlas/Data Abstract for the United States,Annual Report of Secretary of VeteransAffairs, U.S. Department of VeteransAffairs (VA), Budget in Brief, U.S. Depart-ment of Homeland Security; and The Bud-get of the United States Government,Office of Management and Budget. Fordata on international expenditures andpersonnel, see Table 1369, Section 30.
Department of Defense (DoD)—TheU.S. Department of Defense is responsiblefor providing the military forces of theUnited States. It includes the Office of theSecretary of Defense, the Joint Chiefs ofStaff, the Army, the Navy, the Air Force,and the defense agencies. The Presidentserves as Commander-in-Chief of theArmed Forces; from him, the authorityflows to the Secretary of Defense andthrough the Joint Chiefs of Staff to thecommanders of unified and specifiedcommands (e.g., U.S. Strategic Com-mand).
Reserve components—The ReserveComponents of the Armed Forces consistof the Army National Guard of the UnitedStates, Army Reserve, Naval Reserve,Marine Corps Reserve, Air National Guard,Air Force Reserve, and Coast GuardReserve. They provide trained personneland units available for active duty in theArmed Forces during times of war ornational emergency, and at such othertimes as national security may require.The National Guard has dual federal/stateresponsibilities and uses jointly providedequipment, facilities, and budget support.The President is empowered to mobilizethe National Guard and to use such of the
Armed Forces as he considers necessaryto enforce federal authority in any state.There is in each Armed Force a readyreserve, a standby reserve, and a retiredreserve. The Ready Reserve includes theSelected Reserve, which provides trainedand ready units and individuals to aug-ment the active forces during times ofwar or national emergency, or at othertimes when required; and the IndividualReady Reserve, which is a manpower poolthat can be called to active duty duringtimes of war or national emergency andwould normally be used as individual fill-ers for active, guard, and reserve units,and as a source of combat replacements.Most of the Ready Reserve serves in anactive status. See Table 501 for StandbyReserve and Retired Reserve detail.
Department of Veterans Affairs(VA)—A veteran is someone 18 years andolder (there are a few 17-year-old veter-ans) who is not currently on active duty,but who once served on active duty in theUnited States Army, Navy, Air Force,Marine Corps, or Coast Guard, or whoserved in the Merchant Marine duringWorld War II. There are many groupswhose active service makes them veter-ans including: those who incurred aservice-connected disability during activeduty for training in the Reserves orNational Guard, even though that servicewould not otherwise have counted forveteran status; members of a nationalguard or reserve component who havebeen ordered to active duty by order ofthe President or who have a full-time mili-tary job. The latter are called AGRs (ActiveGuard and Reserve). No one who hasreceived a dishonorable discharge is aveteran.
The VA administers laws authorizing ben-efits for eligible former and present mem-bers of the Armed Forces and for the ben-eficiaries of deceased members. Veterans’benefits available under various acts ofCongress include compensation forservice-connected disability or death;
National Security and Veterans Affairs 323
U.S. Census Bureau, Statistical Abstract of the United States: 2010

pensions for non-service-connected dis-ability or death; vocational rehabilitation,education and training; home loan insur-ance; life insurance; health care; specialhousing and automobiles or other con-veyances for certain disabled veterans;burial and plot allowances; and educa-tional assistance to families of deceasedor totally disabled veterans, servicemenmissing in action, or prisoners of war.Since these benefits are legislated by Con-gress, the dates they were enacted andthe dates they apply to veterans may bedifferent from the actual dates the con-flicts occurred. VA estimates of veteranscover all persons discharged from activeU.S. military service under conditionsother than dishonorable.
Homeland Security—In an effort toincrease homeland security following theSeptember 11, 2001, terrorist attacks onthe United States, President George W.Bush issued the National Strategy forHomeland Security in July 2002 andsigned legislation creating the Depart-ment of Homeland Security (DHS) inNovember 2002.
The funding and activities of homelandsecurity are not only carried out by DHS,but also by other federal agencies, state,and local entities. In addition to DHS,there are over 30 other federal agenciesthat comprise federal homeland securityfunding. DHS, along with four otheragencies—Department of Defense (DoD),Energy (DoE), Health and Human Services(HHS), and Justice (DoJ)—account for mostof the federal spending for homelandsecurity.
Department of Homeland Security(DHS)—The mission of DHS is to lead theunified national effort to secure America.This effort is to prevent and deter terror-ist attacks and to protect against andrespond to threats and hazards to thenation. This effort is to secure ournational borders while welcoming lawfulimmigrants, visitors, and trade.
The creation of DHS, which began opera-tions in March 2003, represents a fusionof 22 federal agencies (legacy agencies)to coordinate and centralize the leader-ship of many homeland security activities
under a single department. Out of theseagencies, the Secret Service and CoastGuard remain intact and report directly tothe Secretary. Immigration and Naturaliza-tion Services (INS) adjudications and ben-efits programs report directly to theDeputy Secretary as the U.S. Citizenshipand Immigration Services (USCIS).
The Customs and Border Protection (CBP)is responsible for managing, securing,and controlling U.S. borders. This includescarrying out traditional border-relatedresponsibilities, such as stemming thetide of illegal drugs and illegal aliens;securing and facilitating legitimate globaltrade and travel; and protecting the foodsupply and agriculture industry frompests and disease. CBP is composed ofthe Border Patrol and Inspections (bothmoved from INS) along with Customs(absorbed from the U.S. Department ofTreasury) and Animal and Plant HealthInspections Services (absorbed from theU.S. Department of Agriculture).
The Immigration and Customs Enforce-ment (ICE) mission is to protect Americaand uphold public safety by targeting thepeople, money, and materials crossing thenation’s borders that support terrorist andcriminal activities. ICE is the largest inves-tigation arm of DHS. ICE is composed offive law enforcement divisions: Investiga-tions, Intelligence, Federal Protective Serv-ice, International Affairs, and Detentionand Removal Operations. ICE investigatesa wide range of national security, financialand smuggling violations including drugsmuggling, human trafficking, illegalarms exports, financial crimes, commer-cial fraud, human smuggling, documentfraud, money laundering, childpornography/exploitation, and immigra-tion fraud.
The Transportation Security Administra-tion (TSA) was created as part of the Avia-tion and Transportation Security Act onNovember 19, 2001. TSA was originallypart of the U.S. Department of Transporta-tion, but was moved to DHS. TSA’s mis-sion is to provide security to our nation’stransportation systems with a primaryfocus on aviation security.
324 National Security and Veterans Affairs
U.S. Census Bureau, Statistical Abstract of the United States: 2010

Enlisted Officers Thousands
Thousands
Source: Chart prepared by U.S. Census Bureau. For data, see Table 498.
Figure 10.1Officers and Enlisted Personnel by Military Branch: 2008
0
100
200
300
400
500
600
Air ForceMarine CorpsNavyArmy
Male Femaie
Source: Chart prepared by U.S. Census Bureau. For data, see Table 498.
Figure 10.2Department of Defense Personnel by Sex: 2008
0
100
200
300
400
500
600
Air ForceMarine CorpsNavyArmy
National Security and Veterans Affairs 325
U.S. Census Bureau, Statistical Abstract of the United States: 2010

Table 491. National Defense Outlays and Veterans Benefits: 1960 to 2010
[In billions of dollars (53.5 represents $53,500,000,000), except percent. For fiscal year ending in year shown, see text, Sec-tion 8. Includes outlays of Department of Defense, Department of Veterans Affairs, and other agencies for activities primarily relatedto national defense and veterans programs. For explanation of average annual percent change, see Guide to Tabular Presenta-tion. Minus sign (-) indicates decrease]
Year
National defense and veterans’ outlays(bil. dol.) Annual percent change 1 Defense outlays
percent of—
Totaloutlays
Defense outlays
Veterans’outlays
Totaloutlays
Defenseoutlays
Veterans’outlays
Federaloutlays
Grossdomesticproduct 2
Currentdollars
Constant(FY2000)
dollars
1960 . . . . . . . . 53.5 48.1 300.2 5.4 2.5 2.4 3.1 52.2 9.31970 . . . . . . . . 90.4 81.7 375.1 8.7 0.3 –1.0 13.6 41.8 8.11980 . . . . . . . . 155.1 134.0 267.1 21.1 13.9 15.2 6.3 22.7 4.91990 . . . . . . . . 328.4 299.3 382.7 29.1 –1.6 –1.4 –3.2 23.9 5.2
1995 . . . . . . . . 310.0 272.1 305.9 37.9 –2.9 –3.4 0.8 17.9 3.71997 . . . . . . . . 309.8 270.5 288.4 39.3 2.3 1.8 6.3 16.9 3.31998 . . . . . . . . 310.0 268.2 282.4 41.8 0.1 –0.8 6.3 16.2 3.11999 . . . . . . . . 320.2 274.8 286.6 43.2 3.3 2.5 3.4 16.1 3.0
2000 . . . . . . . . 341.5 294.4 294.4 47.1 6.6 7.1 9.0 16.5 3.02001 . . . . . . . . 349.8 304.8 297.2 45.0 2.4 3.5 –4.3 16.4 3.02002 . . . . . . . . 399.5 348.5 329.3 51.0 14.2 14.3 13.2 17.3 3.42003 . . . . . . . . 461.8 404.8 364.4 57.0 15.6 16.2 11.8 18.7 3.72004 . . . . . . . . 515.6 455.8 394.3 59.8 11.7 12.6 4.8 19.9 4.0
2005 . . . . . . . . 565.5 495.3 407.3 70.2 9.7 8.7 17.4 20.0 4.02006 . . . . . . . . 591.7 521.8 411.9 69.8 4.6 5.4 –0.4 19.7 4.02007 . . . . . . . . 624.1 551.3 422.1 72.8 5.5 5.6 4.3 20.2 4.02008 . . . . . . . . 700.8 616.1 461.3 84.7 12.3 11.8 16.3 20.7 4.32009, est. . . . . . 787.0 690.3 511.9 96.7 12.3 12.0 14.2 17.3 4.82010, est. . . . . . 821.8 712.9 522.2 108.9 4.4 3.3 12.7 19.9 4.8
1 Change from immediate prior year; for 1960, change from 1955. 2 Represents fiscal year GDP; for definition, see text,Section 13.
Source: U.S. Office of Management and Budget, ″Budget of the United States Government, Historical Tables,″ annual;<http://www.whitehouse.gov/omb/budget/>.
Table 492. National Defense Budget Authority and Outlays for DefenseFunctions: 1990 to 2009
[In billions of dollars (303.3 represents $303,300,000,000). For year ending September 30. Data includes defense budgetauthority and outlays by other departments. Minus sign (–) indicates decrease]
Function 1990 1995 2000 2002 2003 2004 2005 2006 2007 20082009,
est.
Total budget authority . . . . . 303.3 266.4 304.0 362.0 456.0 490.6 505.8 556.3 625.9 696.3 693.6Department of Defense–Military . . . 293.0 255.7 290.3 344.9 437.7 470.9 483.9 532.9 603.0 674.7 663.7
Military personnel . . . . . . . . . . . 78.9 71.6 73.8 87.0 109.1 116.1 121.3 128.5 131.8 139.0 146.5Operation and maintenance . . . . 88.4 93.7 108.7 133.2 178.3 189.8 179.2 213.5 240.2 256.2 272.4Procurement . . . . . . . . . . . . . . 81.4 43.6 55.0 62.7 78.5 83.1 96.6 105.4 133.8 165.0 132.7Research, development, test,and evaluation . . . . . . . . . . . . 36.5 34.5 38.7 48.7 58.1 64.6 68.8 72.9 77.5 79.6 80.9
Military construction. . . . . . . . . . 5.1 5.4 5.1 6.6 6.7 6.1 7.3 9.5 14.0 22.1 26.4Family housing . . . . . . . . . . . . . 3.1 3.4 3.5 4.0 4.2 3.8 4.1 4.4 4.0 2.9 3.8Other . . . . . . . . . . . . . . . . . . . –0.4 3.4 5.5 2.6 2.9 7.4 6.6 –1.3 1.7 9.9 1.1
Atomic energy defense activities . . . 9.7 10.1 12.4 15.2 16.4 16.8 17.9 17.4 17.2 16.6 22.9Defense-related activities . . . . . . . . 0.7 1.0 1.3 1.9 2.0 2.8 4.0 5.9 5.7 4.9 7.0
Total outlays . . . . . . . . . . . . 299.3 272.1 294.4 348.5 404.8 455.8 495.3 521.8 551.3 616.1 690.3Department of Defense–Military . . . 289.8 259.4 281.1 331.9 387.2 436.5 474.1 499.3 528.6 594.7 665.0
Military personnel . . . . . . . . . . . 75.6 70.8 76.0 86.8 106.7 113.6 127.5 127.5 127.5 138.9 146.8Operation and maintenance . . . . 88.3 91.0 105.8 130.0 151.4 174.0 188.1 203.8 216.6 244.8 271.8Procurement . . . . . . . . . . . . . . 81.0 55.0 51.7 62.5 67.9 76.2 82.3 89.8 99.6 117.4 142.7Research, development, test,and evaluation . . . . . . . . . . . . 37.5 34.6 37.6 44.4 53.1 60.8 65.7 68.6 73.1 75.2 78.2
Military construction. . . . . . . . . . 5.1 6.8 5.1 5.1 5.9 6.3 5.3 6.2 7.9 11.6 20.0Family housing . . . . . . . . . . . . . 3.5 3.6 3.4 3.7 3.8 3.9 3.7 3.7 3.5 3.6 3.9Other . . . . . . . . . . . . . . . . . . . –1.2 –2.4 1.5 –0.6 –1.6 1.6 1.5 –0.4 0.2 3.2 1.7
Atomic energy activities . . . . . . . . . 9.0 11.8 12.1 14.8 16.0 16.6 18.0 17.5 17.1 17.1 18.5Defense-related activities . . . . . . . . 0.6 0.9 1.2 1.8 1.6 2.8 3.2 5.1 5.7 4.3 6.8
Source: U.S. Office of Management and Budget, ″Budget Authority by Function and Subfunction, Outlay by Function andSubfunction,″ annual; <http://www.whitehouse.gov/omb/budget/>.
326 National Security and Veterans Affairs
U.S. Census Bureau, Statistical Abstract of the United States: 2010
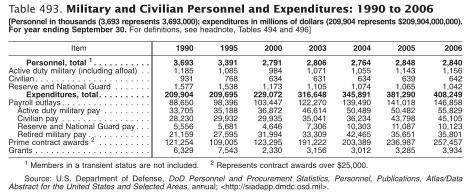
Table 493. Military and Civilian Personnel and Expenditures: 1990 to 2006[Personnel in thousands (3,693 represents 3,693,000); expenditures in millions of dollars (209,904 represents $209,904,000,000).For year ending September 30. For definitions, see headnote, Tables 494 and 496]
Item 1990 1995 2000 2003 2004 2005 2006
Personnel, total 1 . . . . . . . . . . . 3,693 3,391 2,791 2,806 2,764 2,848 2,840Active duty military (including afloat) . . 1,185 1,085 984 1,071 1,055 1,143 1,156Civilian . . . . . . . . . . . . . . . . . . . . . . 931 768 634 631 634 639 642Reserve and National Guard . . . . . . . 1,577 1,538 1,173 1,105 1,074 1,065 1,042
Expenditures, total . . . . . . . . . . 209,904 209,695 229,072 316,648 345,891 381,290 408,249Payroll outlays . . . . . . . . . . . . . . . . . 88,650 98,396 103,447 122,270 139,490 141,018 146,858
Active duty military pay . . . . . . . . . 33,705 35,188 36,872 46,614 50,489 50,482 55,829Civilian pay . . . . . . . . . . . . . . . . . 28,230 29,932 29,935 35,041 36,234 43,798 45,105Reserve and National Guard pay . . . 5,556 5,681 4,646 7,306 10,303 11,087 10,123Retired military pay . . . . . . . . . . . . 21,159 27,595 31,994 33,309 42,465 35,651 35,801
Prime contract awards 2 . . . . . . . . . . 121,254 109,005 123,295 191,222 203,389 236,987 257,457Grants . . . . . . . . . . . . . . . . . . . . . . 6,329 7,543 2,330 3,156 3,012 3,285 3,934
1 Members in a transient status are not included. 2 Represents contract awards over $25,000.
Source: U.S. Department of Defense, DoD Personnel and Procurement Statistics, Personnel, Publications, Atlas/DataAbstract for the United States and Selected Areas, annual; <http://siadapp.dmdc.osd.mil>.
Table 494. Department of Defense Payroll and Contract Awards—States: 2007
[(In millions of dollars (154,326 represents $154,326,000,000). For year ending September 30. Payroll outlays include thegross earnings of civilian, active duty military personnel, reserve and national guard, and retired military for services rendered tothe government and for cash allowances for benefits. Excludes employer’s share of employee benefits, accrued military retirementbenefits and most permanent change of station costs. Contracts, refer to awards made in year specified; expenditures relating toawards may extend over several years. Military awards for supplies, services, and construction. Net value of contracts of over$25,000 for work in each state and DC. Figures reflect impact of prime contracting on state distribution of defense work. Often thestate in which a prime contractor is located in is not the state where the subcontracted work is done. Undistributed civilians andmilitary personnel, their payrolls, and prime contract awards for performance in classified locations are excluded]
State
Payroll
Contractawards GrantsTotal
Activeduty
military
U.S.. . . 154,326 61,918 297,363 4,080AL . . . . . . . 3,868 890 8,729 130AK . . . . . . . 2,202 1,658 1,907 23AZ . . . . . . . 3,035 1,342 11,409 107AR . . . . . . . 1,389 511 695 47CA . . . . . . . 13,008 4,874 36,135 443CO. . . . . . . 3,851 2,004 4,391 48CT . . . . . . . 604 167 8,586 31DE . . . . . . . 583 316 268 20DC. . . . . . . 2,593 1,209 4,279 52FL . . . . . . . 9,309 3,463 11,985 129GA. . . . . . . 7,723 3,725 8,760 58HI . . . . . . . 4,245 2,582 2,158 74ID . . . . . . . 737 364 185 26IL. . . . . . . . 2,775 974 5,081 110IN . . . . . . . 1,518 213 5,832 108IA . . . . . . . 497 82 1,110 62KS . . . . . . . 2,122 1,194 1,879 40KY . . . . . . . 2,823 1,787 6,102 31LA . . . . . . . 1,945 969 3,112 39ME. . . . . . . 806 105 1,458 43MD. . . . . . . 5,489 1,748 10,670 182MA. . . . . . . 1,301 319 10,489 193MI . . . . . . . 1,410 163 5,289 116MN. . . . . . . 857 119 1,882 103MS. . . . . . . 1,877 727 4,873 69
State
Payroll
Contractawards GrantsTotal
Activeduty
military
MO . . . . . . 2,513 806 10,131 46MT. . . . . . . 557 289 206 38NE . . . . . . . 1,277 682 686 60NV . . . . . . . 1,499 814 905 33NH. . . . . . . 335 62 1,387 27NJ . . . . . . . 2,255 608 6,884 59NM. . . . . . . 1,854 912 1,263 33NY . . . . . . . 2,852 1,339 7,676 238NC. . . . . . . 6,570 3,745 2,991 76ND. . . . . . . 751 533 413 30OH. . . . . . . 3,416 838 6,434 94OK. . . . . . . 3,430 1,387 2,110 37OR. . . . . . . 821 105 1,131 72PA . . . . . . . 3,177 335 11,564 243RI . . . . . . . 626 97 511 24SC . . . . . . . 3,112 1,335 3,977 43SD . . . . . . . 490 256 347 11TN . . . . . . . 1,687 204 3,258 46TX . . . . . . . 13,822 7,145 30,799 211UT . . . . . . . 1,958 500 3,052 27VT . . . . . . . 170 41 807 16VA . . . . . . . 17,310 5,361 34,014 126WA . . . . . . 5,661 2,542 5,432 109WV . . . . . . 419 69 301 36WI . . . . . . . 756 137 3,608 45WY . . . . . . 441 269 209 18
Source: U.S. Department of Defense, DoD Personnel and Procurement Statistics; Atlas/Data Abstract for the United Statesand Selected Areas, annual; <http://siadapp.dmdc.osd.mil/>.
Table 495. Expenditures and Personnel by Selected Major Locations: 2007[In thousands of dollars (9,923,355 represents $9,923,355,000), except for personnel. For year ending September 30. Seeheadnote, Table 498]
Major locations
Expenditures
Major locations
Military and civilian personnel
TotalPayrolloutlays
Contracts/grants Total
Activeduty
military Civilian
Fort Worth, TX. . . . . . . . 9,923,355 214,637 9,708,718 Camp Pendleton,CA . . . 58,981 56,658 2,323St. Louis, MO . . . . . . . . 7,581,702 127,028 7,454,674 Camp Lejeune,NC. . . . . 27,958 25,134 2,824Washington, DC. . . . . . . 6,923,030 2,592,616 4,330,414 Arlington,Va . . . . . . . . . 23,065 7,901 15,164San Diego, CA. . . . . . . . 6,632,733 1,826,168 4,806,565 Lackland AFB,TX . . . . . 19,959 15,958 4,001Huntsville, AL . . . . . . . . 5,445,876 172,577 5,273,299 Tinker AFB,OK . . . . . . . 19,676 5,957 13,719Arlington, VA . . . . . . . . . 5,325,803 2,582,763 2,743,040 San Diego,CA. . . . . . . . 19,623 13,345 6,278Long Beach, CA . . . . . . 5,063,024 46,447 5,016,547 Robins AFB,GA. . . . . . . 18,962 5,124 13,838Marietta, GA . . . . . . . . . 4,438,633 82,439 4,356,194 Wright Patterson,OH . . . 16,069 5,120 10,949Sunnyvale, CA. . . . . . . . 3,871,091 42,343 3,828,748 Hill AFB,UT . . . . . . . . . 15,787 4,427 11,360Louisville, KY. . . . . . . . . 3,649,256 122,429 3,526,827 Norfolk,VA . . . . . . . . . . 11,160 9,185 1,975
Source: U.S. Department of Defense, DoD Personnel and Procurement Statistics, Personnel, Publications, Atlas/DataAbstract for the United States and Selected Areas, annual; <http://siadapp.dmdc.osd.mil/>.
National Security and Veterans Affairs 327
U.S. Census Bureau, Statistical Abstract of the United States: 2010

Table 496. Military and Civilian Personnel in Installations: 2006[As of September 30. Civilian personnel includes United States citizens and foreign national direct-hire civilians subject to Officeof Management and Budget (OMB) ceiling controls and civilian personnel involved in civil functions in the United States. Excludesindirect-hire civilians and those direct-hire civilians not subject to OMB ceiling controls. Military personnel include active duty per-sonnel based ashore or afloat, excludes personnel temporarily shore-based in a transient status]
State
Active military personnel Reserveand
NationalGuard,
total
Civilian personnel
Total 1 Army
Navy/Marine
Corps 2 Air Force Total 1 Army
Navy/MarineCorps Air Force
United States. . . . . 1,156,308 423,825 443,658 288,825 1,041,542 642,214 232,243 170,667 157,270Alabama . . . . . . . . . . 9,742 6,022 419 3,301 30,012 22,312 18,326 43 2,344Alaska . . . . . . . . . . . 20,363 11,183 101 9,079 5,845 4,894 2,689 17 1,844Arizona . . . . . . . . . . . 21,997 5,267 5,456 11,274 18,496 9,047 3,938 528 3,620Arkansas. . . . . . . . . . 4,905 88 59 4,758 17,798 3,977 2,944 5 894California. . . . . . . . . . 149,481 7,004 122,707 19,770 84,352 55,709 7,966 31,079 10,173
Colorado . . . . . . . . . . 29,932 15,593 808 13,531 16,112 10,907 3,074 45 5,489Connecticut . . . . . . . . 6,594 23 6,465 106 8,175 2,388 499 1,021 263Delaware. . . . . . . . . . 3,297 7 24 3,266 5,390 1,564 243 2 1,253District of Columbia . . . 12,351 4,740 4,634 2,977 8,022 14,634 4,119 8,851 929Florida . . . . . . . . . . . 58,100 2,419 30,569 25,112 49,726 26,072 3,281 10,920 9,367Georgia . . . . . . . . . . 68,928 52,107 6,907 9,914 36,150 32,862 11,697 4,216 14,729
Hawaii . . . . . . . . . . . 45,366 18,687 21,561 5,118 11,337 17,079 4,750 9,130 2,109Idaho . . . . . . . . . . . . 4,042 20 41 3,981 7,095 1,522 696 49 710Illinois . . . . . . . . . . . . 24,536 504 18,652 5,380 32,779 13,617 7,084 1,590 3,584Indiana . . . . . . . . . . . 805 420 275 110 22,628 9,281 1,949 3,067 1,027Iowa. . . . . . . . . . . . . 390 190 141 59 14,342 1,582 1,032 5 501
Kansas . . . . . . . . . . . 17,645 14,725 197 2,723 15,446 6,577 5,043 1 1,103Kentucky. . . . . . . . . . 38,799 38,335 266 198 15,555 9,170 7,817 193 228Louisiana . . . . . . . . . 15,069 7,999 1,303 5,767 22,081 6,212 3,511 870 1,518Maine . . . . . . . . . . . . 2,096 224 1,853 19 5,592 6,445 326 5,301 277Maryland. . . . . . . . . . 29,626 7,552 15,021 7,053 21,587 30,749 12,441 14,660 2,232
Massachusetts . . . . . . 2,175 208 576 1,391 18,916 6,491 2,339 218 2,986Michigan . . . . . . . . . . 1,073 379 562 132 22,874 8,147 5,336 22 1,108Minnesota . . . . . . . . . 729 25 389 85 24,637 2,522 1,523 17 794Mississippi. . . . . . . . . 10,158 401 3,729 6,028 19,136 8,630 3,444 2,211 2,708Missouri . . . . . . . . . . 16,241 11,053 1,537 3,651 25,726 9,483 6,421 444 1,258
Montana . . . . . . . . . . 3,589 15 28 3,546 5,761 1,358 560 1 745Nebraska . . . . . . . . . 6,784 136 469 6,179 8,553 3,774 1,360 12 2,082Nevada. . . . . . . . . . . 9,127 97 1,003 8,027 7,394 2,178 384 278 1,353New Hampshire . . . . . 912 3 861 48 4,550 1,069 542 46 329New Jersey . . . . . . . . 6,293 888 6,964 4,741 20,060 13,959 9,773 1,907 1,545
New Mexico. . . . . . . . 10,834 444 158 10,232 7,342 6,863 2,919 44 3,431New York . . . . . . . . . 26,240 23,464 2,376 400 39,353 11,145 6,946 141 2,414North Carolina . . . . . . 102,845 43,384 49,775 9,686 30,031 17,447 6,837 7,273 1,370North Dakota . . . . . . . 7,013 23 11 6,979 5,640 1,853 526 2 1,237Ohio. . . . . . . . . . . . . 6,745 539 608 5,698 35,074 21,789 1,455 79 12,422
Oklahoma . . . . . . . . . 25,064 14,297 1,953 8,814 18,399 21,539 4,763 78 15,479Oregon . . . . . . . . . . . 558 190 306 62 13,421 3,241 2,411 18 787Pennsylvania . . . . . . . 2,979 1,075 1,655 249 43,478 25,266 9,048 6,440 1,547Rhode Island . . . . . . . 2,403 109 2,214 80 5,112 4,213 298 3,586 230South Carolina . . . . . . 38,090 12,372 16,695 9,023 21,677 9,640 3,115 3,501 1,899
South Dakota. . . . . . . 3,150 23 4 3,123 5,668 1,237 507 1 683Tennessee. . . . . . . . . 2,441 302 1,918 221 23,695 5,334 2,419 1,004 1,081Texas . . . . . . . . . . . . 119,176 73,654 6,986 38,536 72,955 41,462 21,777 1,352 14,758Utah. . . . . . . . . . . . . 5,188 291 163 4,734 13,770 15,081 2,377 26 11,930Vermont . . . . . . . . . . 70 16 31 23 4,130 608 312 1 263
Virginia . . . . . . . . . . . 128,515 24,084 90,758 13,673 35,668 81,342 21,247 35,582 4,763Washington . . . . . . . . 49,887 22,787 20,285 6,815 25,925 24,501 6,928 14,682 1,957West Virginia . . . . . . . 373 30 308 35 10,068 1,745 1,213 90 423Wisconsin . . . . . . . . . 449 193 176 80 20,270 2,695 1,802 18 773Wyoming. . . . . . . . . . 3,043 4 1 3,038 3,739 1,002 236 – 721
– Represents zero. 1 Includes Other Defense Activities (ODA) not shown separately. 2 Navy and Marine Corps personnelwho are in afloat duty status at the time of the report are included in the strength counts of their homeport locations.
Source: U.S. Department of Defense, DoD Personnel and Procurement Statistics, Personnel, Publications, Atlas/DataAbstract for the United States and Selected Areas, annual; <http://siadapp.dmdc.osd.mil/>.
Table 497. Military Personnel on Active Duty by Location: 1980 to 2008
[In thousands (2,051 represents 2,051,000). As of September 30]
Location 1980 1990 1995 2000 2003 2004 2005 2006 2007 2008
Total . . . . . . . . . . . . . . 2,051 2,046 1,518 1,384 1,434 1,427 1,389 1,385 1,380 1,402
Shore-based 1 . . . . . . . . . . . 1,840 1,794 1,351 1,237 1,287 1,291 1,262 1,263 1,264 1,294Afloat 2. . . . . . . . . . . . . . . . 211 252 167 147 148 136 127 121 115 108United States 3 . . . . . . . . . . 1,562 1,437 1,280 1,127 1,182 1,139 1,098 1,100 1,085 1,113Foreign countries . . . . . . . . . 489 609 238 258 253 288 291 285 295 289
1 Includes Navy personnel temporarily on shore. 2 Includes Marine Corps. 3 Includes Puerto Rico and Island areas.
Source: U.S. Department of Defense, DoD Personnel and Procurement Statistics, Personnel, Publications, Atlas/DataAbstract for the United States and Selected Areas, annual; <http://siadapp.dmdc.osd.mil>.
328 National Security and Veterans Affairs
U.S. Census Bureau, Statistical Abstract of the United States: 2010
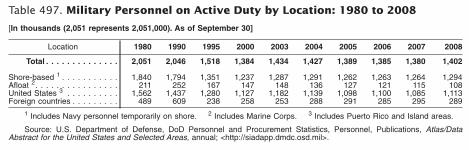
Table 496. Military and Civilian Personnel in Installations: 2006[As of September 30. Civilian personnel includes United States citizens and foreign national direct-hire civilians subject to Officeof Management and Budget (OMB) ceiling controls and civilian personnel involved in civil functions in the United States. Excludesindirect-hire civilians and those direct-hire civilians not subject to OMB ceiling controls. Military personnel include active duty per-sonnel based ashore or afloat, excludes personnel temporarily shore-based in a transient status]
State
Active military personnel Reserveand
NationalGuard,
total
Civilian personnel
Total 1 Army
Navy/Marine
Corps 2 Air Force Total 1 Army
Navy/MarineCorps Air Force
United States. . . . . 1,156,308 423,825 443,658 288,825 1,041,542 642,214 232,243 170,667 157,270Alabama . . . . . . . . . . 9,742 6,022 419 3,301 30,012 22,312 18,326 43 2,344Alaska . . . . . . . . . . . 20,363 11,183 101 9,079 5,845 4,894 2,689 17 1,844Arizona . . . . . . . . . . . 21,997 5,267 5,456 11,274 18,496 9,047 3,938 528 3,620Arkansas. . . . . . . . . . 4,905 88 59 4,758 17,798 3,977 2,944 5 894California. . . . . . . . . . 149,481 7,004 122,707 19,770 84,352 55,709 7,966 31,079 10,173
Colorado . . . . . . . . . . 29,932 15,593 808 13,531 16,112 10,907 3,074 45 5,489Connecticut . . . . . . . . 6,594 23 6,465 106 8,175 2,388 499 1,021 263Delaware. . . . . . . . . . 3,297 7 24 3,266 5,390 1,564 243 2 1,253District of Columbia . . . 12,351 4,740 4,634 2,977 8,022 14,634 4,119 8,851 929Florida . . . . . . . . . . . 58,100 2,419 30,569 25,112 49,726 26,072 3,281 10,920 9,367Georgia . . . . . . . . . . 68,928 52,107 6,907 9,914 36,150 32,862 11,697 4,216 14,729
Hawaii . . . . . . . . . . . 45,366 18,687 21,561 5,118 11,337 17,079 4,750 9,130 2,109Idaho . . . . . . . . . . . . 4,042 20 41 3,981 7,095 1,522 696 49 710Illinois . . . . . . . . . . . . 24,536 504 18,652 5,380 32,779 13,617 7,084 1,590 3,584Indiana . . . . . . . . . . . 805 420 275 110 22,628 9,281 1,949 3,067 1,027Iowa. . . . . . . . . . . . . 390 190 141 59 14,342 1,582 1,032 5 501
Kansas . . . . . . . . . . . 17,645 14,725 197 2,723 15,446 6,577 5,043 1 1,103Kentucky. . . . . . . . . . 38,799 38,335 266 198 15,555 9,170 7,817 193 228Louisiana . . . . . . . . . 15,069 7,999 1,303 5,767 22,081 6,212 3,511 870 1,518Maine . . . . . . . . . . . . 2,096 224 1,853 19 5,592 6,445 326 5,301 277Maryland. . . . . . . . . . 29,626 7,552 15,021 7,053 21,587 30,749 12,441 14,660 2,232
Massachusetts . . . . . . 2,175 208 576 1,391 18,916 6,491 2,339 218 2,986Michigan . . . . . . . . . . 1,073 379 562 132 22,874 8,147 5,336 22 1,108Minnesota . . . . . . . . . 729 25 389 85 24,637 2,522 1,523 17 794Mississippi. . . . . . . . . 10,158 401 3,729 6,028 19,136 8,630 3,444 2,211 2,708Missouri . . . . . . . . . . 16,241 11,053 1,537 3,651 25,726 9,483 6,421 444 1,258
Montana . . . . . . . . . . 3,589 15 28 3,546 5,761 1,358 560 1 745Nebraska . . . . . . . . . 6,784 136 469 6,179 8,553 3,774 1,360 12 2,082Nevada. . . . . . . . . . . 9,127 97 1,003 8,027 7,394 2,178 384 278 1,353New Hampshire . . . . . 912 3 861 48 4,550 1,069 542 46 329New Jersey . . . . . . . . 6,293 888 6,964 4,741 20,060 13,959 9,773 1,907 1,545
New Mexico. . . . . . . . 10,834 444 158 10,232 7,342 6,863 2,919 44 3,431New York . . . . . . . . . 26,240 23,464 2,376 400 39,353 11,145 6,946 141 2,414North Carolina . . . . . . 102,845 43,384 49,775 9,686 30,031 17,447 6,837 7,273 1,370North Dakota . . . . . . . 7,013 23 11 6,979 5,640 1,853 526 2 1,237Ohio. . . . . . . . . . . . . 6,745 539 608 5,698 35,074 21,789 1,455 79 12,422
Oklahoma . . . . . . . . . 25,064 14,297 1,953 8,814 18,399 21,539 4,763 78 15,479Oregon . . . . . . . . . . . 558 190 306 62 13,421 3,241 2,411 18 787Pennsylvania . . . . . . . 2,979 1,075 1,655 249 43,478 25,266 9,048 6,440 1,547Rhode Island . . . . . . . 2,403 109 2,214 80 5,112 4,213 298 3,586 230South Carolina . . . . . . 38,090 12,372 16,695 9,023 21,677 9,640 3,115 3,501 1,899
South Dakota. . . . . . . 3,150 23 4 3,123 5,668 1,237 507 1 683Tennessee. . . . . . . . . 2,441 302 1,918 221 23,695 5,334 2,419 1,004 1,081Texas . . . . . . . . . . . . 119,176 73,654 6,986 38,536 72,955 41,462 21,777 1,352 14,758Utah. . . . . . . . . . . . . 5,188 291 163 4,734 13,770 15,081 2,377 26 11,930Vermont . . . . . . . . . . 70 16 31 23 4,130 608 312 1 263
Virginia . . . . . . . . . . . 128,515 24,084 90,758 13,673 35,668 81,342 21,247 35,582 4,763Washington . . . . . . . . 49,887 22,787 20,285 6,815 25,925 24,501 6,928 14,682 1,957West Virginia . . . . . . . 373 30 308 35 10,068 1,745 1,213 90 423Wisconsin . . . . . . . . . 449 193 176 80 20,270 2,695 1,802 18 773Wyoming. . . . . . . . . . 3,043 4 1 3,038 3,739 1,002 236 – 721
– Represents zero. 1 Includes Other Defense Activities (ODA) not shown separately. 2 Navy and Marine Corps personnelwho are in afloat duty status at the time of the report are included in the strength counts of their homeport locations.
Source: U.S. Department of Defense, DoD Personnel and Procurement Statistics, Personnel, Publications, Atlas/DataAbstract for the United States and Selected Areas, annual; <http://siadapp.dmdc.osd.mil/>.
Table 497. Military Personnel on Active Duty by Location: 1980 to 2008
[In thousands (2,051 represents 2,051,000). As of September 30]
Location 1980 1990 1995 2000 2003 2004 2005 2006 2007 2008
Total . . . . . . . . . . . . . . 2,051 2,046 1,518 1,384 1,434 1,427 1,389 1,385 1,380 1,402
Shore-based 1 . . . . . . . . . . . 1,840 1,794 1,351 1,237 1,287 1,291 1,262 1,263 1,264 1,294Afloat 2. . . . . . . . . . . . . . . . 211 252 167 147 148 136 127 121 115 108United States 3 . . . . . . . . . . 1,562 1,437 1,280 1,127 1,182 1,139 1,098 1,100 1,085 1,113Foreign countries . . . . . . . . . 489 609 238 258 253 288 291 285 295 289
1 Includes Navy personnel temporarily on shore. 2 Includes Marine Corps. 3 Includes Puerto Rico and Island areas.
Source: U.S. Department of Defense, DoD Personnel and Procurement Statistics, Personnel, Publications, Atlas/DataAbstract for the United States and Selected Areas, annual; <http://siadapp.dmdc.osd.mil>.
328 National Security and Veterans Affairs
U.S. Census Bureau, Statistical Abstract of the United States: 2010

Table 498. Department of Defense Personnel: 1960 to 2008
[In thousands (2,475 represents 2,475,000). As of end of fiscal year; see text, Section 8. Includes National Guard, Reserve, and retired regular personnel on extended or continuous active duty. Excludes Coast Guard.Other officer candidates are included under enlisted personnel]
Year
Total
Army Navy 2 Marine Corps Air Force
Total 1
Male Female
Total 1
Male Female
Total 1
Male Female
Total 1
Male Female
Officers Enlisted Officers Enlisted Officers Enlisted Officers Enlisted Officers Enlisted Officers Enlisted Officers Enlisted Officers Enlisted
1960 . . . 2,475 873 97 762 4.3 8.3 617 67 540 2.7 5.4 171 16 153 0.1 1.5 815 126 677 3.7 5.71965 . . . 2,654 969 108 846 3.8 8.5 670 75 583 2.6 5.3 190 17 172 0.1 1.4 825 128 685 4.1 4.7
1970 . . . 3,065 1,323 162 1,142 5.2 11.5 691 78 600 2.9 5.8 260 25 233 0.3 2.1 791 125 648 4.7 9.01975 . . . 2,128 784 98 640 4.6 37.7 535 62 449 3.7 17.5 196 19 174 0.3 2.8 613 100 478 5.0 25.2
1980 . . . 2,051 777 91 612 7.6 61.7 527 58 430 4.9 30.1 189 18 164 0.5 6.2 558 90 404 8.5 51.91981 . . . 2,083 781 94 610 8.3 65.3 540 60 435 5.3 34.6 191 17 165 0.5 7.1 570 90 413 9.1 54.41982 . . . 2,109 780 94 609 9.0 64.1 553 61 444 5.7 37.3 192 18 165 0.6 7.9 583 92 421 9.9 54.51983 . . . 2,123 780 97 602 9.5 66.5 558 62 444 6.3 40.8 194 19 166 0.6 8.3 592 94 428 10.6 55.31984 . . . 2,138 780 98 601 10.2 67.1 565 62 448 6.6 42.6 196 19 167 0.6 8.6 597 95 430 11.2 55.9
1985 . . . 2,151 781 99 599 10.8 68.4 571 64 449 6.9 45.7 198 19 169 0.7 9.0 602 96 431 11.9 58.11986 . . . 2,169 781 99 597 11.3 69.7 581 65 457 7.3 47.2 200 19 170 0.6 9.2 608 97 434 12.4 61.21987 . . . 2,174 781 96 596 11.6 71.6 587 65 462 7.2 47.7 200 19 170 0.6 9.1 607 94 432 12.6 63.21988 . . . 2,138 772 95 588 11.8 72.0 593 65 466 7.3 49.7 197 19 168 0.7 9.0 576 92 405 12.9 61.51989 . . . 2,130 770 95 584 12.2 74.3 593 65 464 7.5 52.1 197 19 168 0.7 9.0 571 91 399 13.4 63.7
1990 . . . 2,044 732 92 553 12.4 71.2 579 64 451 7.8 52.1 197 19 168 0.7 8.7 535 87 370 13.3 60.81991 . . . 1,986 711 91 535 12.5 67.8 570 63 444 8.0 51.4 194 19 166 0.7 8.3 510 84 350 13.3 59.11992 . . . 1,807 610 83 449 11.7 61.7 542 61 417 8.3 51.0 185 18 157 0.6 7.9 470 77 320 12.7 56.11993 . . . 1,705 572 77 420 11.1 60.2 510 58 390 8.3 49.3 178 17 153 0.6 7.2 444 72 302 12.3 54.51994 . . . 1,610 541 74 394 10.9 59.0 469 54 355 8.0 47.9 174 17 149 0.6 7.0 426 69 287 12.3 54.0
1995 . . . 1,518 509 72 365 10.8 57.3 435 51 324 7.9 47.9 175 17 150 0.7 7.4 400 66 266 12.1 52.11996 . . . 1,472 491 70 347 10.6 59.0 417 50 308 7.8 46.9 175 17 149 0.8 7.8 389 64 256 12.0 52.81997 . . . 1,439 492 69 346 10.4 62.4 396 48 290 7.8 44.8 174 17 148 0.8 8.5 377 62 246 12.0 53.81998 . . . 1,407 484 68 340 10.4 61.4 382 47 280 7.8 42.9 173 17 146 0.9 8.9 368 60 237 12.0 54.21999 . . . 1,386 479 67 337 10.5 61.5 373 46 271 7.7 43.9 173 17 145 0.9 9.3 361 58 232 11.8 54.6
2000 . . . 1,384 482 66 339 10.8 62.9 373 46 272 7.8 43.8 173 17 146 0.9 9.5 356 57 227 11.8 55.02001 . . . 1,385 481 65 337 11.0 63.4 378 46 273 8.0 46.6 173 17 145 1.0 9.6 354 57 224 12.0 55.62002 . . . 1,414 487 66 341 11.5 63.2 385 47 279 8.2 47.3 174 17 146 1.0 9.5 368 59 233 12.9 58.62003 . . . 1,434 499 68 352 12.0 63.5 382 47 276 8.2 47.3 178 18 149 1.1 9.6 375 61 237 13.5 60.02004 . . . 1,427 500 69 358 12.3 61.0 373 46 273 8.1 46.1 178 18 149 1.1 9.7 377 61 242 13.6 60.22005 . . . 1,389 493 69 353 12.4 57.9 363 45 266 7.8 44.5 180 18 151 1.0 9.8 354 60 225 13.4 55.62006 . . . 1,385 505 69 365 12.5 58.5 350 44 255 7.6 43.2 180 18 151 1.1 10.0 349 58 223 12.8 55.82007 . . . 1,380 522 71 379 13.0 58.8 338 44 244 7.6 42.2 186 18 156 1.1 10.5 333 54 214 11.8 53.42008 . . . 1,402 544 74 392 13.5 59.7 332 44 235 7.7 41.4 199 19 167 1.2 11.1 327 53 207 11.9 51.4
1 Includes cadets, midshipmen, and others not shown separately. 2 Beginning 1980, excludes Navy Reserve personnel on active duty for Training and Administration of Reserves (TARS).
Source: U.S. Dept. of Defense, Selected Manpower Statistics, annual; and unpublished data.
Natio
nal
Security
and
Veteran
sA
ffairs3
29
U.S
.C
ensusB
ureau,S
tatisticalAbstract
ofthe
United
States:
2010

Table 499. Military Personnel on Active Duty by Rank or Grade: 1990 to 2008
[In thousands (2,043.7 represents 2,043,700). As of Sept. 30]
Rank/grade 1990 2000 2004 2005 2006 2007 2008
Total . . . . . . . . . . . . . . . . . . . . 2,043.7 1,384.3 1,426.8 1,389.4 1,385.0 1,379.6 1,401.8Total Officers . . . . . . . . . . . . . . . . . 296.6 217.2 226.7 226.6 223.2 221.3 223.7
General-Admiral . . . . . . . . . . . . . . (Z) (Z) (Z) (Z) (Z) (Z) (Z)Lieutenant General-Vice Admiral . . . 0.1 0.1 0.1 0.1 0.1 0.1 0.1Major General-Rear Admiral (U). . . . 0.4 0.3 0.3 0.3 0.3 0.3 0.3Brigadier General-Rear Admiral (L). . 0.5 0.4 0.4 0.4 0.5 0.4 0.5Colonel-Captain . . . . . . . . . . . . . . 14.0 11.3 11.5 11.4 11.3 11.3 11.6Lieutenant Colonel-Commander. . . . 32.3 27.5 28.4 28.1 27.5 27.7 28.1Major-LT Commander . . . . . . . . . . 53.2 43.2 44.0 44.4 45.1 44.2 43.4Captain-Lieutenant . . . . . . . . . . . . 106.6 68.1 69.5 72.5 71.9 70.6 71.01st Lieutenant-Lieutenant (JG) . . . . 37.9 24.7 31.1 27.5 24.9 23.4 23.92nd Lieutenant-Ensign . . . . . . . . . . 31.9 26.4 26.9 25.9 25.2 26.0 26.4Chief Warrant Officer W-5. . . . . . . . (Z) 0.1 0.1 0.5 0.6 0.6 0.6Chief Warrant Officer W-4. . . . . . . . 3.0 2.0 1.9 2.2 2.4 2.9 3.1Chief Warrant Officer W-3. . . . . . . . 5.0 3.8 4.1 4.6 4.6 4.6 4.7Chief Warrant Officer W-2. . . . . . . . 8.4 6.7 6.0 6.2 6.0 5.7 6.4Warrant Officer W-1. . . . . . . . . . . . 3.2 2.1 3.1 2.5 2.9 3.4 3.4
Total Enlisted . . . . . . . . . . . . . . . . . 1,733.8 1,154.6 1,172.0 1,149.9 1,148.6 1,145.0 1,164.7E-9. . . . . . . . . . . . . . . . . . . . . . . 15.3 10.2 10.7 10.5 10.4 10.6 10.5E-8. . . . . . . . . . . . . . . . . . . . . . . 38.0 26.0 27.1 27.1 26.7 27.4 27.4E-7. . . . . . . . . . . . . . . . . . . . . . . 134.1 97.7 99.6 97.8 99.3 97.1 97.2E-6. . . . . . . . . . . . . . . . . . . . . . . 239.1 164.9 173.1 172.4 170.3 168.4 170.3E-5. . . . . . . . . . . . . . . . . . . . . . . 361.5 229.5 251.1 248.5 248.8 247.4 249.0E-4. . . . . . . . . . . . . . . . . . . . . . . 427.8 251.0 264.1 261.7 261.4 260.1 266.1E-3. . . . . . . . . . . . . . . . . . . . . . . 280.1 196.3 220.1 201.7 185.4 192.5 194.9E-2. . . . . . . . . . . . . . . . . . . . . . . 140.3 99.0 84.3 70.8 83.5 79.9 83.6E-1. . . . . . . . . . . . . . . . . . . . . . . 97.6 80.0 55.8 59.5 62.8 61.7 65.6
Cadets and Midshipmen . . . . . . . . . 13.3 12.5 12.6 12.9 13.2 13.2 13.4
Z Fewer than 50.
Source: U.S. Department of Defense, DoD Personnel and Procurement Statistics, Personnel, Military, Military PersonnelStatistics, annual; <http://siadapp.dmdc.osd.mil>.
Table 500. Military Retirement System: 2008
[Payment in millions of dollars (3,567 represents $3,567,000,000). As of September 30. The data published in this report areproduced from the files maintained by the Defense Manpower Data Center (DMDC). This report compiles data primarily from the‘‘Retiree Pay and Survivor Pay’’ files. Any grouping of members by address reflects mailing, not necessarily residence address.Only those members in plans administered by the Department of Defense (DoD) are included in this table. The data are preliminarybecause of reporting delays due to the information about many members who retired or died within one month of the September30 reporting date. These data were not processed in time to be included in this report. For more information, please seeIntroduction and Overview at <http://www.defenselink.mil/actuary/statbook2008.pdf>]
State orother area
Retired military personnel 1
MonthlypaymentTotal
Disabled2
Non-disabled
Total3 . . . 2,002,852 179,129 1,823,723 3,567U.S. . . . . . . 1,962,806 175,873 1,786,933 3,502
AL . . . . . . . . . 55,056 4,426 50,630 96AK . . . . . . . . . 9,429 594 8,835 16AZ . . . . . . . . . 53,873 4,518 49,355 100AR . . . . . . . . . 25,564 2,336 23,228 41CA . . . . . . . . . 168,647 15,735 152,912 306CO. . . . . . . . . 48,165 3,760 44,405 99CT . . . . . . . . . 10,711 1,320 9,391 17DE . . . . . . . . . 8,146 539 7,607 13DC. . . . . . . . . 2,953 427 2,526 5FL . . . . . . . . . 185,582 15,197 170,385 353GA. . . . . . . . . 88,355 7,354 81,001 155HI . . . . . . . . . 15,832 1,020 14,812 30ID . . . . . . . . . 12,657 1,067 11,590 21IL. . . . . . . . . . 35,146 4,420 30,726 57IN . . . . . . . . . 23,765 2,979 20,786 34IA . . . . . . . . . 11,734 1,276 10,458 16KS . . . . . . . . . 20,515 1,600 18,915 36KY . . . . . . . . . 26,324 2,729 23,595 42LA . . . . . . . . . 25,570 2,686 22,884 41ME. . . . . . . . . 12,130 1,121 11,009 19MD. . . . . . . . . 50,439 3,805 46,634 98MA. . . . . . . . . 19,155 2,510 16,645 28MI . . . . . . . . . 27,486 4,092 23,394 38MN. . . . . . . . . 17,369 2,014 15,355 24MS. . . . . . . . . 26,020 2,238 23,782 41
State orother area
Retired military personnel 1
MonthlypaymentTotal
Disabled2
Non-disabled
MO . . . . . . . . 36,436 3,769 32,667 57MT. . . . . . . . . 8,527 782 7,745 14NE . . . . . . . . . 13,721 1,023 12,698 25NV . . . . . . . . . 27,225 1,811 25,414 49NH. . . . . . . . . 9,429 783 8,646 17NJ . . . . . . . . . 20,374 2,606 17,768 30NM. . . . . . . . . 21,350 1,703 19,647 40NY . . . . . . . . . 37,480 5,726 31,754 49NC. . . . . . . . . 83,688 7,212 76,476 150ND. . . . . . . . . 4,738 360 4,378 7OH. . . . . . . . . 43,965 5,569 38,396 69OK. . . . . . . . . 34,432 2,833 31,599 56OR. . . . . . . . . 21,366 2,496 18,870 35PA . . . . . . . . . 48,837 5,885 42,952 75RI . . . . . . . . . 5,552 534 5,018 10SC . . . . . . . . . 54,718 4,199 50,519 95SD . . . . . . . . . 7,025 571 6,454 11TN . . . . . . . . . 50,496 4,537 45,959 84TX . . . . . . . . . 185,400 15,206 170,194 349UT . . . . . . . . . 14,707 1,123 13,584 25VT . . . . . . . . . 3,641 336 3,305 5VA . . . . . . . . . 143,582 7,836 135,746 341WA . . . . . . . . 70,403 5,155 65,248 128WV . . . . . . . . 10,737 1,308 9,429 16WI . . . . . . . . . 19,403 2,339 17,064 27WY . . . . . . . . 4,951 408 4,543 8
1 Represents military personnel (officers and enlisted) receiving and not receiving pay from DoD. 2 A disabled militarymember is entitled to disability retired pay if the disability is not the result of the member’s intentional misconduct or willful neglect,was not incurred during a period of unauthorized absence, and either: (1) the member has at least 20 years of service; or (2) atthe time of determination, the disability is at least 30 percent (under a standard schedule of rating disabilities by the VeteransAdministration) and one of three additional conditions are met—For the continuation of this footnote, see U.S. Census Bureau,Statistical Abstract, National Security and Veterans Affairs, Military Personnel and Expenditures, Military Retirement System;<http://www.census.gov/compendia/statab/>. 3 Includes states, U.S. territories, and retirees living in foreign countries.
Source: U.S. Department of Defense, Office of the Actuary, Statistical Report, Fiscal Year 2008 (issued May 2009);<http://www.defenselink.mil/actuary/>.
330 National Security and Veterans Affairs
U.S. Census Bureau, Statistical Abstract of the United States: 2010

Table 501. Military Reserve Personnel: 1995 to 2008[As of September 30. The Ready Reserve data include the Selected Reserve which is scheduled to augment active forces dur-ing times of war or national emergency, and the Individual Ready Reserve, which, during times of war or national emergency, wouldbe used to fill out Active, Guard, and Reserve units, and which would also be a source for casualty replacements; Ready Reserv-ists serve in an active status (except for the Inactive National Guard—a very small pool within the Army National Guard). The StandbyReserve cannot be called to active duty, other than for training, unless authorized by Congress under ‘‘full mobilization,’’ and a deter-mination is made that there are not enough qualified members in the Ready Reserve in the required categories who are readilyavailable. The Retired Reserve represents a lower potential for involuntary mobilization]
Reserve status andbranch of service 1995 2000 2004 2005 2006 2007 2008
Total reserves 1 . . . . 1,674,164 1,276,843 1,166,937 1,136,200 1,119,902 1,109,805 1,099,915
Ready reserve . . . . . . . 1,648,388 1,251,452 1,145,035 1,113,427 1,101,565 1,088,587 1,080,617Army 2 . . . . . . . . . . . . . . 999,462 725,771 663,209 636,355 631,856 621,422 626,892Navy . . . . . . . . . . . . . . . 267,356 184,080 148,643 140,821 131,802 128,421 123,159Marine Corps . . . . . . . . . . 103,668 99,855 101,443 99,820 100,522 100,787 95,748Air Force 3. . . . . . . . . . . . 263,011 229,009 219,159 223,551 224,637 226,806 224,545Coast Guard . . . . . . . . . . 14,891 12,737 12,581 12,880 12,748 11,151 10,273
Standby reserve . . . . . . 25,776 25,391 21,902 22,773 18,337 21,218 19,298Army . . . . . . . . . . . . . . . 1,128 701 715 1,668 1,586 45,294 2,136Navy . . . . . . . . . . . . . . . 12,707 7,213 2,502 4,038 4,514 3,046 3,310Marine Corps . . . . . . . . . . 216 895 992 1,129 1,210 1,372 1,691Air Force. . . . . . . . . . . . . 11,453 16,429 17,340 15,897 10,932 10,154 10,384Coast Guard . . . . . . . . . . 272 153 353 41 95 1,352 1,777
Retired reserve . . . . 505,905 573,305 614,904 627,424 637,262 648,346 658,251Army . . . . . . . . . . . . . . . 259,553 296,004 315,477 321,312 325,288 330,121 334,258Navy . . . . . . . . . . . . . . . 97,532 109,531 115,210 117,093 118,803 120,859 122,000Marine Corps . . . . . . . . . . 11,319 12,937 14,319 14,693 15,000 15,264 15,558Air Force. . . . . . . . . . . . . 137,501 154,833 169,898 174,326 178,171 182,102 186,435
1 Less retired reserves. 2 Includes Army National Guard. 3 Includes Air National Guard. 4 The Army did a ″scrub″ oftheir Individual Ready Reserve (IRR) categories and dropped personnel awaiting retirement or discharge into the Standby Reserveduring FY2007 in order to give them a better perspective on actual IRR members cleared for mobilization, if required.
Source: U.S. Department of Defense, DoD Personnel and Procurement Statistics, Personnel, Publications, Atlas/DataAbstract for the United States and Selected Areas, Selected Manpower Statistics, annual. See also <http://siadapp.dmdc.osd.mil>.
Table 502. Ready Reserve Personnel by Race, Hispanic Origin, and Sex:1990 to 2008
[In thousands (1,658.7 represents 1,658,700). As of September 30]
Year
Total 1
Race
Hispanic 2
Sex
White Black AsianAmerican
Indian
Officer Enlisted
Male Female Male Female
1990 . . . 1,658.7 1,304.6 272.3 14.9 7.8 83.1 226.8 40.5 1,204.7 186.7
1995 . . . 1,648.4 1,267.7 274.5 22.0 8.8 96.2 209.9 44.7 1,196.8 196.91997 . . . 1,451.0 1,113.7 230.6 21.7 8.4 91.5 188.7 43.2 1,037.6 181.51998 . . . 1,353.4 1,033.9 210.4 21.7 7.8 88.2 175.9 40.3 964.1 173.11999 . . . 1,288.8 980.0 202.6 22.6 7.6 88.9 166.2 38.4 911.2 173.12000 . . . 1,251.5 942.2 199.6 26.7 8.4 91.8 159.4 36.9 879.9 175.32001 . . . 1,224.1 912.7 198.4 27.9 8.5 94.3 158.0 36.6 852.2 177.32002 . . . 1,199.3 891.3 193.2 27.9 8.8 96.0 152.1 35.6 835.2 176.42003 . . . 1,167.1 865.7 187.5 25.4 8.5 98.0 145.1 34.0 813.7 174.32004 . . . 1,145.0 845.3 181.3 26.2 9.1 100.2 141.9 33.6 799.7 169.82005 . . . 1,113.4 825.4 169.9 26.9 9.5 99.8 139.2 33.3 778.0 162.92006 . . . 1,101.6 822.4 163.5 27.7 10.1 101.1 136.7 33.1 769.4 162.32007 . . . 1,088.6 818.1 156.6 28.1 10.8 102.7 130.0 31.8 766.5 160.22008 . . . 1,080.6 815.2 153.4 29.0 10.9 102.6 128.0 31.2 760.8 160.6
1 Includes other races not shown separately. 2 Persons of Hispanic origin may be any race.
Source: U.S. Department of Defense, DoD Personnel and Procurement Statistics, Personnel, Publications, Atlas/DataAbstract for the United States and Selected Areas, annual; <http://siadapp.dmdc.osd.mil>.
Table 503. National Guard by Sex and Race: 1995 to 2008[In thousands (375 represents 375,000). As of September 30]
YearArmy National Guard Air National Guard
Total Male1 Female White Black Total Male1 Female White Black
1995 . . . . . . . . 375 344 31 299 59 110 94 16 96 92000 . . . . . . . . 353 313 40 278 55 106 88 18 90 102002 . . . . . . . . 351 308 43 277 54 112 93 19 94 102003 . . . . . . . . 351 307 44 277 52 108 89 19 91 102004 . . . . . . . . 343 299 44 271 50 107 88 19 89 102005 . . . . . . . . 333 290 43 264 46 106 87 19 89 92006 . . . . . . . . 346 300 47 276 47 106 87 19 88 92007 . . . . . . . . 353 304 49 283 47 106 87 19 88 92008 . . . . . . . . 360 309 51 288 49 108 88 20 89 9
1 Male population includes unknown sex.
Source: U.S. Department of Defense, DoD Personnel and Procurement Statistics, Personnel, Publications, Atlas/DataAbstract for the United States and Selected Areas, Selected Manpower Statistics, annual. See also <http://siadapp.dmdc.osd.mil>.
National Security and Veterans Affairs 331
U.S. Census Bureau, Statistical Abstract of the United States: 2010

Table 504. U.S. Active Duty Military Deaths by Manner of Death: 1980 to 2008
[As of December 31. ]
Manner of death 1980–2008 1980 1990 1995 2000 2002 2003 2004 2005 2006 2007 2008
Deaths, total. . . . . . . 45,706 2,392 1,507 1,040 758 999 1,410 1,873 1,941 1,882 1,953 1,441
Accident . . . . . . . . . . . . 24,048 1,556 880 538 397 543 576 605 649 562 561 470Hostile action . . . . . . . . . 4,040 – – – – 18 344 739 739 769 847 352Homicide . . . . . . . . . . . . 2,195 174 74 67 34 54 43 45 52 47 47 43Illness . . . . . . . . . . . . . . 8,011 419 277 174 139 195 234 272 289 256 235 235Pending. . . . . . . . . . . . . 130 – – – – – 1 3 5 9 29 83Self-inflicted . . . . . . . . . . 6,270 231 232 250 151 163 187 201 181 212 211 235Terrorist attack . . . . . . . . 428 1 1 7 17 – – – – – – –Undetermined. . . . . . . . . 584 11 43 4 20 26 25 8 26 27 23 23
Deaths per 100,000 ofpersonnel strength. . . . (X) 110.7 66.8 62.5 49.5 61.4 81.4 109.4 116.7 116.8 121.4 85.6
Accident . . . . . . . . . . . . (X) 72.0 39.0 32.4 25.9 33.4 33.2 35.3 39.0 34.9 34.9 27.9Hostile action . . . . . . . . . (X) – – – – 1.1 19.9 43.2 44.4 47.7 52.7 20.9Homicide . . . . . . . . . . . . (X) 8.1 3.3 4.0 2.2 3.3 2.5 2.6 3.1 2.9 2.9 2.6Illness . . . . . . . . . . . . . . (X) 19.4 12.3 10.5 9.1 12.0 13.5 15.9 17.4 15.9 14.6 14.0Pending. . . . . . . . . . . . . (X) – – – – – 0.1 0.2 0.3 0.6 1.8 4.9Self-inflicted . . . . . . . . . . (X) 10.7 10.3 15.0 9.9 10.0 10.8 11.7 10.9 13.2 13.1 14.0Terrorist attack . . . . . . . . (X) – – 0.4 1.1 – – – – – – –Undetermined. . . . . . . . . (X) 0.5 1.9 0.2 1.3 1.6 1.4 0.5 1.6 1.7 1.4 1.4
– Represents zero. X Not applicable.
U.S. Department of Defense, ‘‘Military Casualty Information’’; <http://siadapp.dmdc.osd.mil/personnel/Pubs.htm>.
Table 505. U.S. Military Personnel on Active Duty in Selected ForeignCountries: 1995 to 2008
[As of September 30]
Country 1995 2000 2003 2004 2005 2006 2007 2008
In foreign countries 1 . . . 238,064 257,817 252,764 287,802 290,997 284,967 295,003 288,550Ashore . . . . . . . . . . . . . . . 208,836 212,858 226,570 265,594 268,214 262,586 272,124 269,260Afloat . . . . . . . . . . . . . . . . 29,228 44,959 26,194 20,208 22,783 22,381 22,879 19,290
Australia . . . . . . . . . . . . . . . . 314 175 574 196 196 347 140 140Bahrain . . . . . . . . . . . . . . . . . 618 949 1,514 1,712 1,641 1,357 1,495 1,545Belgium . . . . . . . . . . . . . . . . 1,689 1,554 1,526 1,474 1,366 1,361 1,328 1,266Bosnia and Herzegovina . . . . . 1 5,708 3,041 951 263 232 209 14Canada. . . . . . . . . . . . . . . . . 214 156 141 156 150 133 141 134Colombia. . . . . . . . . . . . . . . . 44 224 54 55 52 104 123 114Cuba (Guantanamo) . . . . . . . . 5,129 688 697 682 950 953 932 969Diego Garcia 2 . . . . . . . . . . . . 897 625 528 816 683 157 260 244Djibouti . . . . . . . . . . . . . . . . . 7 2 498 412 622 1,375 2,100 1,780Egypt . . . . . . . . . . . . . . . . . . 1,123 499 385 348 410 360 250 284Germany. . . . . . . . . . . . . . . . 73,280 69,203 74,796 76,058 66,418 64,319 57,080 55,140Greece . . . . . . . . . . . . . . . . . 489 678 583 473 428 395 363 366Greenland . . . . . . . . . . . . . . . 131 125 139 133 146 137 126 134Honduras . . . . . . . . . . . . . . . 193 351 414 448 438 414 403 429Italy . . . . . . . . . . . . . . . . . . . 12,007 11,190 13,152 12,606 11,841 10,449 9,855 9,601Korea, South . . . . . . . . . . . . . 36,016 36,565 41,145 40,840 30,983 29,086 27,014 25,062Kuwait . . . . . . . . . . . . . . . . . 771 4,602 (3) (3) (3) (3) (3) (3)Netherlands . . . . . . . . . . . . . . 687 659 703 701 583 591 579 547Portugal . . . . . . . . . . . . . . . . 1,066 1,005 1,094 1,006 970 922 826 783Qatar . . . . . . . . . . . . . . . . . . 2 52 2,997 273 463 446 411 433Saudi Arabia . . . . . . . . . . . . . 1,077 7,053 953 235 258 282 243 284Senegal . . . . . . . . . . . . . . . . 13 10 8 9 42 7 11 7Singapore . . . . . . . . . . . . . . . 166 411 171 237 169 164 125 129Spain . . . . . . . . . . . . . . . . . . 2,799 2,007 1,893 2,012 1,660 1,521 1,286 1,220Turkey . . . . . . . . . . . . . . . . . 3,111 2,006 2,021 1,762 1,780 1,810 1,594 1,575United Kingdom . . . . . . . . . . . 12,131 11,207 11,616 11,469 10,752 10,331 9,825 9,426
DEPLOYMENTSOperation Enduring Freedom(OEF)4 . . . . . . . . . . . . . . . . (X) (X) (NA) (NA) 19,500 21,500 25,240 32,300
Operation Iraqi Freedom(OIF)5 . . . . . . . . . . . . . . . . . (X) (X) 183,002 170,647 192,600 185,500 218,500 190,400
X Not applicable. NA Not available. 1 Includes areas not shown separately. 2 British Indian Ocean Territory. 3 Militarypersonnel data for Kuwait are included with the Operation Iraqi Freedom (OIF) data. 4 Total (in/around Afghanistan as ofSeptember 30)—includes deployed Reserve/National Guard. 5 Total (in/around Iraq as of September 30)—includes deployedReserve/National Guard.
Source: U.S. Department of Defense, DoD Personnel and Procurement Statistics, ‘‘Active Duty Military Personnel Strengthsby Regional Area and by Country.’’ See also <http://siadapp.dmdc.osd.mil/personnel/MMIDHOME.HTM>.
332 National Security and Veterans Affairs
U.S. Census Bureau, Statistical Abstract of the United States: 2010

Table 506. U.S. Military Sales and Assistance to Foreign Governments:1995 to 2007
[In millions of dollars (8,495 represents $8,495,000,000). For year ending September 30. Department of Defense (DoD) salesdeliveries cover deliveries against sales orders authorized under Arms Export Control Act, as well as earlier and applicable legis-lation. For details regarding individual programs, see source]
Item 1995 2000 2001 2002 2003 2004 2005 2006 2007
Military sales agreements . . . . . . 8,495 10,678 12,512 12,049 12,654 13,218 9,561 18,089 19,119Military construction salesagreements . . . . . . . . . . . . . . . 24 284 124 71 224 674 313 173 419
Military sales deliveries 1 . . . . . . . 12,100 10,888 12,427 10,442 9,717 11,154 11,278 11,718 12,615Military construction salesdeliveries . . . . . . . . . . . . . . . . . (NA) 183 244 216 245 281 350 323 197Military financing program . . . . . . 3,712 4,333 3,535 4,032 5,955 4,584 4,956 4,450 4,519Commercial exports licensedunder arms export control act 2 . . (NA) 478 821 341 2,728 7,895 30,146 31,605 8,874
Military assistance programdelivery 3 . . . . . . . . . . . . . . . . 20 14 21 34 182 28 62 46 14
IMET program/deliveries 4 . . . . . . 26 50 54 70 79 89 87 85 98
NA Not available. 1 Includes military construction sales deliveries. 2 The total dollar value of deliveries made againstpurchases of munitions-controlled items by foreign governments directly from U.S. manufacturers. 3 Includes Military AssistanceService Funded (MASF) program data and Section 506(a) drawdown authority. 4 International Military Education & Training.Includes military assistance service funded and emergency draw downs.
Source: U.S. Department of Defense, Defense Security Cooperation Agency, ‘‘DSCA Data and Statistics.’’ See also<http://www.dsca.osd.mil/data_stats.htm>.
Table 507. U.S. Military Sales Deliveries by Selected Country: 1995 to 2007
[In millions of dollars (12,100 represents $12,100,000,000). For year ending September 30. Represents Department ofDefense military sales.]
Country 1995 2000 2001 2002 2003 2004 2005 2006 2007
Total 1. . . . . . . . . . 12,100 10,888 12,427 10,442 9,717 11,154 11,278 11,718 12,615
Australia . . . . . . . . . . . . 303 332 303 216 208 196 350 351 789Bahrain . . . . . . . . . . . . 40 55 339 84 90 88 65 56 84Belgium . . . . . . . . . . . . 8 61 169 68 71 42 50 53 49Canada . . . . . . . . . . . . 127 84 113 85 155 144 151 183 281
Denmark. . . . . . . . . . . . 54 44 109 23 14 22 40 49 63Egypt . . . . . . . . . . . . . . 1,479 1,092 875 1,860 1,081 1,518 1,459 1,219 1,281France . . . . . . . . . . . . . 64 217 142 206 276 99 69 43 47Germany . . . . . . . . . . . 257 131 330 221 241 264 208 149 206Greece. . . . . . . . . . . . . 220 389 448 469 1,324 1,225 468 180 222Israel . . . . . . . . . . . . . . 327 585 778 630 927 1,204 1,524 1,286 1,269
Italy . . . . . . . . . . . . . . . 54 52 188 103 185 281 127 300 158Japan . . . . . . . . . . . . . 693 458 491 466 430 392 410 769 654Jordan . . . . . . . . . . . . . 47 52 80 67 69 104 141 106 172Korea, South . . . . . . . . . 442 1,399 735 533 560 601 606 601 598Kuwait . . . . . . . . . . . . . 471 321 502 131 143 209 278 542 467
Netherlands . . . . . . . . . 153 278 569 406 224 277 178 231 216Norway. . . . . . . . . . . . . 25 64 192 87 123 80 106 95 165Portugal . . . . . . . . . . . . 88 20 42 28 116 30 84 83 46Saudi Arabia . . . . . . . . . 3,567 1,975 1,876 1,308 1,011 1,223 994 995 1,084Singapore . . . . . . . . . . . 59 131 244 407 168 205 229 355 174
Spain . . . . . . . . . . . . . . 193 141 467 178 160 188 124 105 151Taiwan 2 . . . . . . . . . . . . 1,332 784 1,162 1,393 710 917 1,415 1,074 789Thailand . . . . . . . . . . . . 356 114 119 171 153 180 92 83 50Turkey . . . . . . . . . . . . . 368 216 466 281 277 290 190 247 196United Arab Emirates . . . 345 39 9 40 87 155 171 203 72United Kingdom . . . . . . . 419 347 525 386 350 453 384 295 430
1 Includes countries not shown. 2 See footnote 4, Table 1296.
Source: U.S. Department of Defense, Defense Security Cooperation Agency, ‘‘DSCA Data and Statistics.’’ See also<http://www.dsca.osd.mil/data_stats.htm>.
National Security and Veterans Affairs 333
U.S. Census Bureau, Statistical Abstract of the United States: 2010
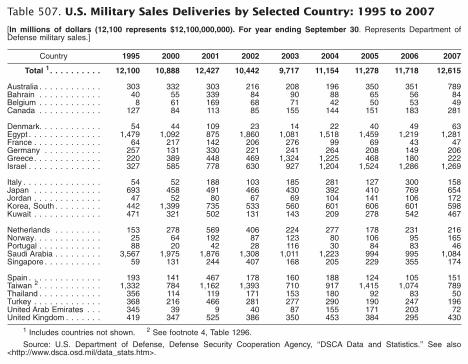
Table 506. U.S. Military Sales and Assistance to Foreign Governments:1995 to 2007
[In millions of dollars (8,495 represents $8,495,000,000). For year ending September 30. Department of Defense (DoD) salesdeliveries cover deliveries against sales orders authorized under Arms Export Control Act, as well as earlier and applicable legis-lation. For details regarding individual programs, see source]
Item 1995 2000 2001 2002 2003 2004 2005 2006 2007
Military sales agreements . . . . . . 8,495 10,678 12,512 12,049 12,654 13,218 9,561 18,089 19,119Military construction salesagreements . . . . . . . . . . . . . . . 24 284 124 71 224 674 313 173 419
Military sales deliveries 1 . . . . . . . 12,100 10,888 12,427 10,442 9,717 11,154 11,278 11,718 12,615Military construction salesdeliveries . . . . . . . . . . . . . . . . . (NA) 183 244 216 245 281 350 323 197Military financing program . . . . . . 3,712 4,333 3,535 4,032 5,955 4,584 4,956 4,450 4,519Commercial exports licensedunder arms export control act 2 . . (NA) 478 821 341 2,728 7,895 30,146 31,605 8,874
Military assistance programdelivery 3 . . . . . . . . . . . . . . . . 20 14 21 34 182 28 62 46 14
IMET program/deliveries 4 . . . . . . 26 50 54 70 79 89 87 85 98
NA Not available. 1 Includes military construction sales deliveries. 2 The total dollar value of deliveries made againstpurchases of munitions-controlled items by foreign governments directly from U.S. manufacturers. 3 Includes Military AssistanceService Funded (MASF) program data and Section 506(a) drawdown authority. 4 International Military Education & Training.Includes military assistance service funded and emergency draw downs.
Source: U.S. Department of Defense, Defense Security Cooperation Agency, ‘‘DSCA Data and Statistics.’’ See also<http://www.dsca.osd.mil/data_stats.htm>.
Table 507. U.S. Military Sales Deliveries by Selected Country: 1995 to 2007
[In millions of dollars (12,100 represents $12,100,000,000). For year ending September 30. Represents Department ofDefense military sales.]
Country 1995 2000 2001 2002 2003 2004 2005 2006 2007
Total 1. . . . . . . . . . 12,100 10,888 12,427 10,442 9,717 11,154 11,278 11,718 12,615
Australia . . . . . . . . . . . . 303 332 303 216 208 196 350 351 789Bahrain . . . . . . . . . . . . 40 55 339 84 90 88 65 56 84Belgium . . . . . . . . . . . . 8 61 169 68 71 42 50 53 49Canada . . . . . . . . . . . . 127 84 113 85 155 144 151 183 281
Denmark. . . . . . . . . . . . 54 44 109 23 14 22 40 49 63Egypt . . . . . . . . . . . . . . 1,479 1,092 875 1,860 1,081 1,518 1,459 1,219 1,281France . . . . . . . . . . . . . 64 217 142 206 276 99 69 43 47Germany . . . . . . . . . . . 257 131 330 221 241 264 208 149 206Greece. . . . . . . . . . . . . 220 389 448 469 1,324 1,225 468 180 222Israel . . . . . . . . . . . . . . 327 585 778 630 927 1,204 1,524 1,286 1,269
Italy . . . . . . . . . . . . . . . 54 52 188 103 185 281 127 300 158Japan . . . . . . . . . . . . . 693 458 491 466 430 392 410 769 654Jordan . . . . . . . . . . . . . 47 52 80 67 69 104 141 106 172Korea, South . . . . . . . . . 442 1,399 735 533 560 601 606 601 598Kuwait . . . . . . . . . . . . . 471 321 502 131 143 209 278 542 467
Netherlands . . . . . . . . . 153 278 569 406 224 277 178 231 216Norway. . . . . . . . . . . . . 25 64 192 87 123 80 106 95 165Portugal . . . . . . . . . . . . 88 20 42 28 116 30 84 83 46Saudi Arabia . . . . . . . . . 3,567 1,975 1,876 1,308 1,011 1,223 994 995 1,084Singapore . . . . . . . . . . . 59 131 244 407 168 205 229 355 174
Spain . . . . . . . . . . . . . . 193 141 467 178 160 188 124 105 151Taiwan 2 . . . . . . . . . . . . 1,332 784 1,162 1,393 710 917 1,415 1,074 789Thailand . . . . . . . . . . . . 356 114 119 171 153 180 92 83 50Turkey . . . . . . . . . . . . . 368 216 466 281 277 290 190 247 196United Arab Emirates . . . 345 39 9 40 87 155 171 203 72United Kingdom . . . . . . . 419 347 525 386 350 453 384 295 430
1 Includes countries not shown. 2 See footnote 4, Table 1296.
Source: U.S. Department of Defense, Defense Security Cooperation Agency, ‘‘DSCA Data and Statistics.’’ See also<http://www.dsca.osd.mil/data_stats.htm>.
National Security and Veterans Affairs 333
U.S. Census Bureau, Statistical Abstract of the United States: 2010

Table 508. Veterans by Sex, Selected Period of Service, and State: 2008
[In thousands (23,215 represents 23,215,000). As of September 30. VetPop2007 is the Department of Veterans Affairs (VA)latest official estimate and projection of the veteran population. It is based on detailed tabulations of Census 2000 data (preparedfor the VA Office of the Actuary by the Census Bureau) and on recent American Community Survey data. VetPop2007 also usesadministrative data and projections of service member separations from active duty provided by the Department of Defense (theDefense Manpower Data Center and the Office of the Actuary), as well as VA administrative data on veterans benefits]
State Total 1, 2Gulf
War 3Vietnam
era
United States . . . . 23,215 5,193 7,700Alabama . . . . . . . . . . . 414 105 140Alaska . . . . . . . . . . . . 76 25 27Arizona . . . . . . . . . . . . 565 125 181Arkansas. . . . . . . . . . . 260 60 89California. . . . . . . . . . . 2,078 464 678Colorado . . . . . . . . . . . 426 108 154Connecticut . . . . . . . . . 246 38 82Delaware. . . . . . . . . . . 80 18 26District of Columbia. . . . 39 9 12Florida . . . . . . . . . . . . 1,715 365 522Georgia . . . . . . . . . . . 770 222 260Hawaii . . . . . . . . . . . . 118 33 37Idaho . . . . . . . . . . . . . 137 33 47Illinois . . . . . . . . . . . . . 822 172 264Indiana . . . . . . . . . . . . 509 102 171Iowa. . . . . . . . . . . . . . 246 47 83Kansas . . . . . . . . . . . . 233 57 77Kentucky. . . . . . . . . . . 344 80 117Louisiana . . . . . . . . . . 319 85 101Maine . . . . . . . . . . . . . 142 28 51Maryland. . . . . . . . . . . 480 127 153Massachusetts . . . . . . . 425 64 136Michigan . . . . . . . . . . . 742 128 259Minnesota . . . . . . . . . . 399 64 145Mississippi. . . . . . . . . . 213 56 69
State Total 1, 2Gulf
War 3Vietnam
era
Missouri . . . . . . . . . . . 523 109 176Montana . . . . . . . . . . . 104 22 36Nebraska . . . . . . . . . . 150 34 52Nevada. . . . . . . . . . . . 246 57 87New Hampshire . . . . . . 131 23 46New Jersey . . . . . . . . . 485 73 150New Mexico. . . . . . . . . 178 46 59New York . . . . . . . . . . 1,026 165 324North Carolina . . . . . . . 772 204 254North Dakota . . . . . . . . 58 14 18Ohio. . . . . . . . . . . . . . 935 178 314Oklahoma . . . . . . . . . . 334 85 113Oregon . . . . . . . . . . . . 346 65 123Pennsylvania . . . . . . . . 1,026 168 335Rhode Island . . . . . . . . 77 13 25South Carolina . . . . . . . 410 107 141South Dakota. . . . . . . . 74 18 24Tennessee. . . . . . . . . . 507 116 179Texas . . . . . . . . . . . . . 1,705 471 576Utah. . . . . . . . . . . . . . 156 36 52Vermont . . . . . . . . . . . 54 9 19Virginia . . . . . . . . . . . . 814 276 261Washington . . . . . . . . . 640 159 227West Virginia . . . . . . . . 174 36 59Wisconsin . . . . . . . . . . 437 80 147Wyoming. . . . . . . . . . . 56 14 21
1 Veterans serving in more than one period of service are counted only once in the total. 2 Current civilians discharged fromactive duty, other than for training only without service-connected disability. 3 Service from August 2, 1990 to the present.
Source: Department of Veterans Affairs, Veteran Data and Information, Veteran Demographics; <http://www1.va.gov/vetdata/page.cfm?pg=15>.
Table 509. Employment Status of Persons 18 Years and Over byVeteran Status, Period of Service, and Sex: 2008
[The Current Population Study (CPS), defines veterans as men and women who have previously served on active duty in the U.S.Armed Forces and who were civilians at the time they were surveyed. Data about veteran status and period of service are collectedmonthly in the CPS; these data are the source for the 2008 annual averages presented. Period-of-service designations identifywhen the veteran served rather than where; thus, wartime veterans did not necessarily serve in a war zone. For more informationon this report (technical note and definitions), go to <http://www.bls.gov/news.release/pdf/vet.pdf>]
Veteran status, period ofservice, and sex Civilian
noninsti-tutionalpopula-
tion
Civilian labor force
Not inlaborforceTotal
Percentof
civiliannoninsti-tutionalpopula-
tion
Employed Unemployed
Total
Percentof
civiliannoninsti-tutionalpopula-
tion Total
Percentof
civilianlaborforce
Total . . . . . . . . . . . . . . . . . . . . . . 224,655 151,735 67.5 143,373 63.8 8,361 5.5 72,920Veterans. . . . . . . . . . . . . . . . . . . . . . . . 22,429 12,368 55.1 11,795 52.6 573 4.6 10,061
Gulf War era, total. . . . . . . . . . . . . . . . 4,592 3,989 86.9 3,782 82.4 207 5.2 604Gulf War era I 1. . . . . . . . . . . . . . . . 2,939 2,583 87.9 2,479 84.4 103 4.0 356Gulf War era II2 . . . . . . . . . . . . . . . . 1,653 1,406 85.0 1,303 78.8 103 7.3 247
WW II, Korean War, and Vietnam era 3 . . 11,855 4,690 39.6 4,492 37.9 198 4.2 7,165Other service periods 4 . . . . . . . . . . . . 5,983 3,690 61.7 3,522 58.9 168 4.6 2,293
Nonveterans 5 . . . . . . . . . . . . . . . . . . . . 202,226 139,366 68.9 131,578 65.1 7,788 5.6 62,859Male . . . . . . . . . . . . . . . . . . . . . . . 108,488 81,282 74.9 76,560 70.6 4,722 5.8 27,206
Veterans. . . . . . . . . . . . . . . . . . . . . . . . 20,712 11,253 54.3 10,739 51.8 515 4.6 9,458Gulf War era, total. . . . . . . . . . . . . . . . 3,848 3,425 89.0 3,256 84.6 169 4.9 423
Gulf War era I 1. . . . . . . . . . . . . . . . 2,488 2,231 89.7 2,147 86.3 84 3.8 257Gulf War era II2 . . . . . . . . . . . . . . . . 1,359 1,193 87.8 1,109 81.6 84 7.1 166
WW II, Korean War, and Vietnam era 3 . . 11,455 4,542 39.7 4,349 38.0 193 4.3 6,913Other service periods 4 . . . . . . . . . . . . 5,409 3,287 60.8 3,134 57.9 153 4.6 2,123
Nonveterans 5 . . . . . . . . . . . . . . . . . . . . 87,776 70,028 79.8 65,821 75.0 4,207 6.0 17,748Female . . . . . . . . . . . . . . . . . . . . . 116,167 70,453 60.6 66,813 57.5 3,639 5.2 45,715
Veterans. . . . . . . . . . . . . . . . . . . . . . . . 1,718 1,115 64.9 1,057 61.5 58 5.2 603Gulf War era, total. . . . . . . . . . . . . . . . 745 564 75.7 526 70.6 38 6.8 181
Gulf War era I 1. . . . . . . . . . . . . . . . 451 351 77.9 332 73.7 19 5.5 99Gulf War era II2 . . . . . . . . . . . . . . . . 294 212 72.3 194 65.9 19 8.9 81
WW II, Korean War, and Vietnam era 3 . . 399 148 37.0 143 35.8 5 3.2 252Other service periods 4 . . . . . . . . . . . . 574 403 70.3 388 67.6 16 3.8 170
Nonveterans 5 . . . . . . . . . . . . . . . . . . . . 114,450 69,338 60.6 65,757 57.5 3,581 5.2 45,112
1 Gulf War era I; August 1990–August 2001. 2 Gulf War era II; September 2001–present. 3 World War II; December 1941–December 1945. Korea War; July 1950–January 1955. Vietnam era; August 1964–April 1975. 4 Other service periods; all othertime periods. 5 Nonveterans are men and women who never served on active duty in the U.S. Armed Forces.
Source: Bureau of Labor Statistics, ‘‘Current Population Study, CPS New Release, Employment Situation of Veterans″(released 20 March 2009); <http://www.bls.gov/news.release/vet.nr0.htm>.
334 National Security and Veterans Affairs
U.S. Census Bureau, Statistical Abstract of the United States: 2010

Table 510. Veterans by Sex, Race, and Hispanic or Latino Origin: 2007[In thousands (22,892.1 represents 22,892,100). Data are based on the American Community Survey (ACS). The survey universeincludes the household population and the population living in institutions, college dormitories, and other group quarters. Basedon a sample and subject to sampling variability; see text of this section and Appendix III]
Characteristics Total number 18 to 64 years 65 years and over
Total1 . . . . . . . . . . . . . . . . . . . . . . . . . 22,892.1 13,906.3 8,985.8Male. . . . . . . . . . . . . . . . . . . . . . . . . . . . . . . . . 21,334.5 12,628.4 8,706.1Female . . . . . . . . . . . . . . . . . . . . . . . . . . . . . . . 1,557.6 1,278.0 279.6White alone . . . . . . . . . . . . . . . . . . . . . . . . . . . . 19,397.8 11,182.8 8,215.0
Male . . . . . . . . . . . . . . . . . . . . . . . . . . . . . . . 18,224.7 10,268.0 7,956.6Female . . . . . . . . . . . . . . . . . . . . . . . . . . . . . 1,173.2 914.8 258.4
Black or African American alone . . . . . . . . . . . . . . 2,365.4 1,857.2 508.2Male . . . . . . . . . . . . . . . . . . . . . . . . . . . . . . . 2,083.7 1,588.6 495.0Female . . . . . . . . . . . . . . . . . . . . . . . . . . . . . 281.8 268.5 13.2
American Indian/Alaska Native alone . . . . . . . . . . . 165.2 124.3 40.9Male . . . . . . . . . . . . . . . . . . . . . . . . . . . . . . . 150.1 110.7 39.4Female . . . . . . . . . . . . . . . . . . . . . . . . . . . . . 15.1 13.6 1.5
Asian alone . . . . . . . . . . . . . . . . . . . . . . . . . . . . 277.8 186.5 91.2Male . . . . . . . . . . . . . . . . . . . . . . . . . . . . . . . 254.1 165.4 88.6Female . . . . . . . . . . . . . . . . . . . . . . . . . . . . . 23.7 21.1 2.6
Native Hawaiian and Other Pacific Islander alone . . . 26.9 21.0 5.9Male . . . . . . . . . . . . . . . . . . . . . . . . . . . . . . . 23.5 17.9 5.7Female . . . . . . . . . . . . . . . . . . . . . . . . . . . . . 3.3 3.1 0.2
Some other race alone . . . . . . . . . . . . . . . . . . . . 358.3 299.0 59.3Male . . . . . . . . . . . . . . . . . . . . . . . . . . . . . . . 327.6 269.6 58.0Female . . . . . . . . . . . . . . . . . . . . . . . . . . . . . 30.7 29.4 1.3
Hispanic or Latino origin 2 . . . . . . . . . . . . . . . . . . 1,096.4 839.2 257.2Male . . . . . . . . . . . . . . . . . . . . . . . . . . . . . . . 1,007.9 756.3 251.6Female . . . . . . . . . . . . . . . . . . . . . . . . . . . . . 88.5 82.9 5.6
1 Includes data for two or more races not shown separately. 2 Persons of Hispanic or Latino origin may be any race.
Source: U.S. Census Bureau, 2007 American Community Survey; using American FactFinder, tables B21001, B21001A,B21001B, B21001C, B21001D, B21001E, B21001F, and B21001I; <http://factfinder.census.gov/>.
Table 511. Veterans Benefits—Expenditures by Program and Compensation forService-Connected Disabilities: 1990 to 2008
[In millions of dollars (28,998 represents $28,998,000,000). For years ending September 30. Minus sign (–) indicatesdecrease]
Program 1990 1995 2000 2004 2005 2006 2007 2008
Total expenditures . . . . . . . . . . . . 28,998 37,775 47,086 59,555 69,564 69,950 72,805 84,410Medical programs. . . . . . . . . . . . . . . . . 11,582 16,255 19,637 28,158 29,191 31,308 33,705 37,914Construction . . . . . . . . . . . . . . . . . . . . 661 641 466 318 480 497 704 643General operating expenses. . . . . . . . . . 811 954 1,016 1,252 1,285 1,545 1,476 1,253Compensation and pension . . . . . . . . . . 14,674 17,765 22,012 29,937 32,131 34,681 34,600 40,241Vocational rehabilitation and education. . . 452 1,317 1,610 2,827 3,033 3,163 3,180 3,210All other 1 . . . . . . . . . . . . . . . . . . . . . . 818 844 2,345 –2,937 3,445 –1,244 –860 1,149
Compensation for service-connected disabilities 2. . . . . . . . 9,284 11,644 15,511 22,387 24,515 26,551 28,200 36,255
1 Includes insurance, indemnities, and miscellaneous funds and expenditures and offsets from public receipts. (Excludesexpenditures from personal funds of patients.) 2 Represents veterans receiving compensation for service-connected disabilities.
Source: U.S. Department of Veterans Affairs, Expenditures and Workload, annual; <http://www1.va.gov/vetdata/page.cfm?pg=3>.
Table 512. Veterans Compensation and Pension Benefits—Number on Rolls byPeriod of Service and Status: 1990 to 2008
[In thousands (3,584 represents 3,584,000), except as indicated. As of September 30. Living refers to veterans receivingcompensation for disability incurred or aggravated while on active duty and war veterans receiving pension and benefits fornon-service connected disabilities. Deceased refers to deceased veterans whose dependents were receiving pensions andcompensation benefits]
Period of service and veteran status 1990 1995 2000 2004 2005 2006 2007 2008
Total . . . . . . . . . . . . . . . . . . . . . 3,584 3,330 3,236 3,432 3,503 3,582 3,691 3,801Living veterans. . . . . . . . . . . . . . . . . . 2,746 2,669 2,672 2,899 2,973 3,056 3,167 3,268
Service-connected . . . . . . . . . . . . . . 2,184 2,236 2,308 2,556 2,637 2,726 2,844 2,952Nonservice-connected . . . . . . . . . . . 562 433 364 343 336 330 323 316
Deceased veterans . . . . . . . . . . . . . . . 838 662 564 533 530 527 524 533Service-connected . . . . . . . . . . . . . . 320 307 307 318 323 326 330 338Nonservice-connected . . . . . . . . . . . 518 355 257 215 207 201 195 196
World War I . . . . . . . . . . . . . . . . . . . . 198 89 34 16 13 11 9 8Living . . . . . . . . . . . . . . . . . . . . . . 18 3 (Z) (Z) (Z) (Z) (Z) (Z)
World War II . . . . . . . . . . . . . . . . . . . 1,723 1,307 968 766 718 674 634 598Living . . . . . . . . . . . . . . . . . . . . . . 1,294 961 676 506 466 430 397 362
Korean conflict 1 . . . . . . . . . . . . . . . . . 390 368 323 302 295 290 287 282Living . . . . . . . . . . . . . . . . . . . . . . 305 290 255 237 231 226 223 218
Vietnam era 2. . . . . . . . . . . . . . . . . . . 774 868 969 1,172 1,218 1,260 1,305 1,347Living . . . . . . . . . . . . . . . . . . . . . . 685 766 848 1,028 1,068 1,104 1,142 1,175
Gulf War 3 . . . . . . . . . . . . . . . . . . . . . (X) 138 334 552 630 716 819 923Living . . . . . . . . . . . . . . . . . . . . . . (X) 134 326 540 617 701 802 904
Peacetime . . . . . . . . . . . . . . . . . . . . . 495 559 607 624 627 631 637 644Living . . . . . . . . . . . . . . . . . . . . . . 444 514 567 587 591 596 602 609
X Not applicable. Z Fewer than 500. 1 Service during period June 27, 1950 to January 31, 1955. 2 Service from August5, 1964 to May 7, 1975. 3 Service from August 2, 1990 to the present.
Source: U.S. Department of Veterans Affairs, 1990 to 1995, Annual Report of the Secretary of Veterans Affairs; beginning2000, Annual Accountablility Report and unpublished data; <http://www1.va.gov/vetdata/>.
National Security and Veterans Affairs 335
U.S. Census Bureau, Statistical Abstract of the United States: 2010

Table 513. Homeland Security Funding by Agency: 2007 to 2009
[In millions of dollars (56,925.9 represents $56,925,900,000). For year ending September 30. A total of 31 agencies compriseFederal homeland security funding for 2009. Department of Homeland Security (DHS) is the designated department to coordinateand centralize the leadership of many homeland security activities under a single department. In addition to DHS, the Departmentsof Defense (DoD), Energy (DoE), Health and Human Services (HHS), Justice (DoJ), and the State Department account for mostof the total government-wide homeland security funding]
Agency 2007 2008 2009
Total budget authority, excluding BioShield 1, 2 . . . . . . . . . . . . 56,925.9 61,227.8 68,818.5
Department of Agriculture . . . . . . . . . . . . . . . . . . . . . . . . . . . . . . 540.5 574.6 507.1Department of Commerce . . . . . . . . . . . . . . . . . . . . . . . . . . . . . . 205.0 206.9 258.1Department of Defense . . . . . . . . . . . . . . . . . . . . . . . . . . . . . . . . 16,538.3 17,374.4 19,413.5Department of Education . . . . . . . . . . . . . . . . . . . . . . . . . . . . . . . 26.2 27.1 31.8Department of Energy . . . . . . . . . . . . . . . . . . . . . . . . . . . . . . . . . 1,719.2 1,827.3 1,938.8Department of Health and Human Services. . . . . . . . . . . . . . . . . . . 4,327.0 4,300.6 4,626.8Department of Homeland Security 3. . . . . . . . . . . . . . . . . . . . . . . . 26,857.9 29,755.8 34,350.9
Department of Housing and Urban Development . . . . . . . . . . . . . . . 1.9 1.9 4.8Department of the Interior . . . . . . . . . . . . . . . . . . . . . . . . . . . . . . 47.8 50.2 52.7Department of Justice . . . . . . . . . . . . . . . . . . . . . . . . . . . . . . . . . 3,306.4 3,277.5 3,641.3Department of Labor . . . . . . . . . . . . . . . . . . . . . . . . . . . . . . . . . . 49.4 47.8 48.5Department of State . . . . . . . . . . . . . . . . . . . . . . . . . . . . . . . . . . 1,241.6 1,719.1 1,809.2Department of Transportation . . . . . . . . . . . . . . . . . . . . . . . . . . . . 205.7 205.3 220.9Department of the Treasury . . . . . . . . . . . . . . . . . . . . . . . . . . . . . 126.8 120.0 133.7
Department of Veterans Affairs . . . . . . . . . . . . . . . . . . . . . . . . . . . 259.8 308.9 304.6Corps of Engineers. . . . . . . . . . . . . . . . . . . . . . . . . . . . . . . . . . . 42.0 42.0 42.0Environmental Protection Agency . . . . . . . . . . . . . . . . . . . . . . . . . 166.7 138.1 157.0Executive Office of the President. . . . . . . . . . . . . . . . . . . . . . . . . . 20.8 21.0 19.1General Services Administration . . . . . . . . . . . . . . . . . . . . . . . . . . 168.2 143.0 159.4National Aeronautics and Space Administration . . . . . . . . . . . . . . . . 199.2 205.2 221.8National Science Foundation . . . . . . . . . . . . . . . . . . . . . . . . . . . . 385.4 365.1 377.2
Office of Personnel Management . . . . . . . . . . . . . . . . . . . . . . . . . 2.8 2.3 1.9Social Security Administration. . . . . . . . . . . . . . . . . . . . . . . . . . . . 194.0 184.2 214.6District of Columbia . . . . . . . . . . . . . . . . . . . . . . . . . . . . . . . . . . 8.5 3.4 39.0Federal Communications Commission . . . . . . . . . . . . . . . . . . . . . . 2.3 2.3 2.3Intelligence Community Management Account . . . . . . . . . . . . . . . . . 56.0 122.0 32.8National Archives and Records Administration . . . . . . . . . . . . . . . . . 17.9 17.7 20.7
Nuclear Regulatory Commission . . . . . . . . . . . . . . . . . . . . . . . . . . 72.2 72.1 72.8Securities and Exchange Commission . . . . . . . . . . . . . . . . . . . . . . 14.3 13.4 14.0Smithsonian Institution . . . . . . . . . . . . . . . . . . . . . . . . . . . . . . . . 80.7 91.0 92.3United States Holocaust Memorial Museum . . . . . . . . . . . . . . . . . . 7.8 8.0 9.0Corporation for National and Community Service . . . . . . . . . . . . . . . 33.6 (NA) (NA)
NA Not available. 1 The federal spending estimates are for the Executive Branch’s homeland security efforts. Theseestimates do not include the efforts of the Legislative or Judicial Branches. 2 The Department of Homeland SecurityAppropriations Act, 2004, provided $5.6 billion for Project BioShield, to remain available through 2013. Including this unevenfunding stream can distort year-over-year comparisons. 3 Not all actitivies carried out by DHS constitute homeland securityfunding (e.g. response to natural disasters and Coast Guard search and rescue activities), DHS estimates in this table do notrepresent the entire DHS budget. See Table 514.
Source: U.S. Office of Management and Budget, Budget of the United States Government Fiscal Year 2010, The BudgetDocuments, Analytical Perspectives, Budget of the United States Government Fiscal Year 2010, Crosscutting Programs,Homeland Security Funding Analysis; <http://www.whitehouse.gov/omb/budget/>.
Table 514. Department of Homeland Security Total Budget Authority andPersonnel by Organization: 2008 and 2009
[In thousands of dollars (47,454,648 represents $47,454,648,000). For the fiscal year ending September 30. Not all activitiescarried out by DHS constitute homeland security funding (e.g., Coast Guard search and rescue activities)]
OrganizationBudget authority Full-time employees
2008 2009 2008 2009
Total 1. . . . . . . . . . . . . . . . . . . . . . . . . . . . . . . . . . . . . 47,454,648 52,543,592 195,865 203,554Departmental operations 2 . . . . . . . . . . . . . . . . . . . . . . . . . . . 573,983 644,553 1,119 1,307Analysis and operations . . . . . . . . . . . . . . . . . . . . . . . . . . . . 304,500 327,373 518 594Office of the Inspector General . . . . . . . . . . . . . . . . . . . . . . . . 108,711 98,513 551 577U.S. Customs & Border Protection. . . . . . . . . . . . . . . . . . . . . . 9,285,001 11,274,783 50,417 54,868U.S. Immigration & Customs Enforcement . . . . . . . . . . . . . . . . 5,054,317 5,928,210 17,938 18,965Transportation Security Administration . . . . . . . . . . . . . . . . . . . 6,809,359 6,990,778 50,871 51,488U.S. Coast Guard. . . . . . . . . . . . . . . . . . . . . . . . . . . . . . . . . 8,631,053 9,623,779 48,558 48,930U.S. Secret Service . . . . . . . . . . . . . . . . . . . . . . . . . . . . . . . 1,629,496 1,637,954 6,700 6,732National Protection and Program Directorate . . . . . . . . . . . . . . . 896,476 1,158,263 664 849Office of Health Affairs . . . . . . . . . . . . . . . . . . . . . . . . . . . . . 118,375 157,191 49 80Federal Emergency Management Agency (FEMA) . . . . . . . . . . . 5,515,178 5,985,805 6,689 6,917FEMA Grants 3 . . . . . . . . . . . . . . . . . . . . . . . . . . . . . . . . . . 4,117,800 4,245,700 (4) (4)U.S. Citizenship & Immigration Services . . . . . . . . . . . . . . . . . . 2,822,012 2,690,926 10,264 10,623Federal Law Enforcement Training Center . . . . . . . . . . . . . . . . 273,302 332,986 1,056 1,106Science & Technology Directorate (S&T) . . . . . . . . . . . . . . . . . 830,335 932,587 350 381Domestic Nuclear Detection Office . . . . . . . . . . . . . . . . . . . . . 484,750 514,191 121 137
1 See footnote 3, Table 513. 2 Departmental operations is comprised of the Office of the Secretary & ExecutiveManagement, the Office of the Federal Coordinator for Gulf Coast Rebuilding, the Office of the Undersecretary for Management,the Office of the Chief Financial Officer, and the Office of the Chief Information Officer. 3 Includes the following FEMAappropriations: State and Local Programs & Emergency Management Perf. Grants, and Assistance to Firefighters Grants. 4
Employee data are included in the FEMA full-time employees.
Source: U.S. Department of Homeland Security, ‘‘Budget-in-Brief, Fiscal Year 2010’’; <http://www.dhs.gov/xabout/budget/>(accessed 20 May 2009).
336 National Security and Veterans Affairs
U.S. Census Bureau, Statistical Abstract of the United States: 2010

Table 515. Homeland Security Funding by National Strategy Mission Area:2006 to 2008
[In millions of dollars (54,639.4 represents $54,639,400,000). For Homeland Security funding analysis by OMB, agencies cat-egorize their funding data based on the critical mission areas defined in the National Strategy]
Agency 2006 1 2007 2008
Total budget authority excluding BioShield 2, 3 . . . . . . . . . . . . . 54,639.4 56,925.9 61,808.4
Intelligence and warning . . . . . . . . . . . . . . . . . . . . . . . . . . . . . . . 443.0 670.8 682.7Border and transportation security . . . . . . . . . . . . . . . . . . . . . . . . . 18,042.3 19,365.3 22,286.8Domestic counterterrorism . . . . . . . . . . . . . . . . . . . . . . . . . . . . . . 4,535.6 5,026.6 4,896.8Protecting critical infrastructure and key assets . . . . . . . . . . . . . . . . 17,933.2 18,388.2 19,926.1Defending against catastrophic threats . . . . . . . . . . . . . . . . . . . . . . 8,573.7 8,595.9 8,278.1Emergency preparedness and response. . . . . . . . . . . . . . . . . . . . . 4,992.3 4,822.2 5,551.4Other . . . . . . . . . . . . . . . . . . . . . . . . . . . . . . . . . . . . . . . . . . . . 119.3 56.9 186.5
1 FY 06 reflects the adjustments made for the Coast Guard and re-estimates for DoD. See ‘‘Source’’ for further details.2 Enacted budgets. 3 See footnote 2 in Table 513.
Source: U.S. Office of Management and Budget, Budget of the United States Government Fiscal Year 2009, The BudgetDocuments, Analytical Perspectives, Budget of the United States Government Fiscal Year 2009, Crosscutting Programs,Homeland Security Funding Analysis. <http://www.whitehouse.gov/omb/budget/fy2009/>.
Table 516. Homeland Security Grants by State/Territories: 2007 and 2008
[In thousands of dollars (1,666,460 represents 1,666,460,000). For years ending September 30. Grants consist of thefollowing programs: Citizen Corps Program (CCP), State Homeland Security Program (SHSP), Metropolitan Medical ResponseSystem (MMRS), and Urban Areas Security Initiative (UASI)]
State/Territory 2007 2008
Total . . . 1,666,460 1,697,314
U.S. . . . . . 1,650,810 1,682,304
AL . . . . . . . . 11,574 12,698AK . . . . . . . . 7,195 6,941AZ . . . . . . . . 33,774 31,292AR . . . . . . . . 7,238 6,682CA . . . . . . . . 242,245 260,824CO. . . . . . . . 19,899 20,708CT . . . . . . . . 10,479 14,845DE . . . . . . . . 6,684 6,304DC. . . . . . . . 71,985 71,247FL . . . . . . . . 84,743 77,483GA. . . . . . . . 39,959 37,127HI . . . . . . . . 12,114 11,642ID . . . . . . . . 6,701 6,322IL. . . . . . . . . 86,248 81,622IN . . . . . . . . 23,397 21,063IA . . . . . . . . 7,043 6,687KS . . . . . . . . 8,375 8,362
State/Territory 2007 2008
KY . . . . . . . . 11,757 11,885LA . . . . . . . . 21,873 23,663ME. . . . . . . . 6,697 6,317MD. . . . . . . . 32,670 30,145MA. . . . . . . . 35,509 32,252MI . . . . . . . . 39,237 36,984MN. . . . . . . . 20,504 21,367MS. . . . . . . . 7,002 6,695MO . . . . . . . 31,244 30,884MT. . . . . . . . 6,686 6,307NE . . . . . . . . 7,226 6,973NV . . . . . . . . 19,357 18,925NH. . . . . . . . 6,955 6,638NJ . . . . . . . . 61,109 63,770NM. . . . . . . . 6,973 6,657NY . . . . . . . . 208,039 233,090NC. . . . . . . . 25,256 22,435ND. . . . . . . . 6,678 6,298OH. . . . . . . . 46,321 43,168OK. . . . . . . . 14,198 13,182OR. . . . . . . . 16,033 17,035
State/Territory 2007 2008
PA . . . . . . . . 61,306 56,291RI . . . . . . . . 12,119 11,646SC . . . . . . . . 11,001 9,538SD . . . . . . . . 6,682 6,302TN . . . . . . . . 20,045 20,688TX . . . . . . . . 121,629 142,270UT . . . . . . . . 6,989 9,162VT . . . . . . . . 6,677 6,297VA . . . . . . . . 33,278 33,540WA . . . . . . . 28,926 31,379WV . . . . . . . 6,712 6,332WI . . . . . . . . 17,796 16,044WY . . . . . . . 6,674 6,294
AS . . . . . . 2,218 1,888GU . . . . . . 2,221 1,891NMI . . . . . 2,218 1,889PR . . . . . . 6,773 8,352VI . . . . . . . 2,220 1,890
– Represents zero. 1 AS—America Samoa, GU—Guam, NMI—Northern Mariana Islands, PR—Puerto Rico, VI—VirginIslands.
Source: U.S. Department of Homeland Security, State Contacts and Grants Award Administration. See <http://www.dhs.gov/xgovt/grants/index.shtm>.
Table 517. Urban Areas Security Initiative (UASI) Grant Program: 2008[In thousands of dollars (781,630 represents $781,630,000). For year ending September 30. The UASI Program providesfinancial assistance to address the unique multi-disciplinary planning, operations, equipment, training, and exercise needs ofhigh-threat, high-density urban areas. The sixty highest risk urban areas were eligible for funding. The seven highest risk urbanareas are designated Tier 1. For a listing of all grant programs and their descriptions, see <http://www.dhs.gov/xgovt/grants/index.shtm>.]
State/territory Urban area Amount
Total . . . 781,630
TIER 1 .CA . . . . Bay Area 37,155
Los Angeles/Long Beach 70,403
DC . . . . National Capital 59,801IL . . . . . Chicago 45,862NJ . . . . Jersey City/Newark 34,988NY . . . . New York City 144,189TX . . . . Houston 37,500
TIER 2AZ . . . . Phoenix 11,563
Tucson 4,753CA . . . . Anaheim/Santa Ana 13,425
Riverside 3,252Sacramento 4,045San Diego 15,511
CO . . . . Denver 7,615CT . . . . Bridgeport 1,967
Hartford 1,997FL . . . . Fort Lauderdale 6,383
State/territory Urban area Amount
Jacksonville 5,723Miami 11,621Orlando 5,432Tampa 8,352
GA . . . . Atlanta 14,220HI. . . . . Honolulu 5,005IN. . . . . Indianapolis 7,479KY . . . . Louisville 1,422LA . . . . Baton Rouge 1,787
New Orleans 4,249MD . . . . Baltimore 11,553MA . . . . Boston 13,784MI . . . . Detroit 14,191MN . . . . Twin Cities 8,206MO. . . . Kansas City 8,100
. . . . St. Louis 8,982NV . . . . Las Vegas 9,031NY . . . . Albany 1,757
Buffalo 5,306Rochester 1,466Syracuse 1,601
NC . . . . Charlotte 4,821OH . . . . Cincinnati 5,083
State/territory Urban area Amount
Cleveland 5,355Columbus 4,579Toledo 1,265
OK . . . . Oklahoma City 4,637OR . . . . Portland 7,557PA . . . . Philadelphia 18,139
Pittsburgh 6,732PR . . . . San Juan 2,033RI. . . . . Providence 5,015TN . . . . Memphis 4,453
Nashville 1,784TX . . . . Austin 1,823
Dallas/FortWorth/Arlington 20,322El Paso 5,665San Antonio 6,548
UT . . . . Salt Lake City 1,845VA . . . . Norfolk 7,760
Richmond 1,722WA . . . . Seattle 10,340WI . . . . Milwaukee 4,491
Source: Department of Homeland Security, FEMA, Grants Program Directorate; <http://www.dhs.gov/xlibrary/assets/grant-program-overview-fy2008.pdf> (released July 25, 2008).
National Security and Veterans Affairs 337
U.S. Census Bureau, Statistical Abstract of the United States: 2010
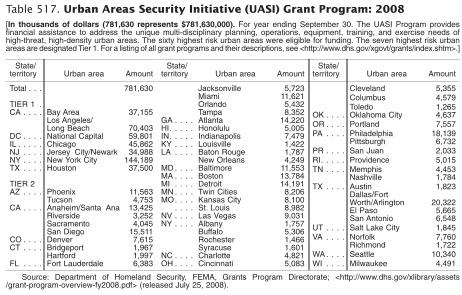
Table 515. Homeland Security Funding by National Strategy Mission Area:2006 to 2008
[In millions of dollars (54,639.4 represents $54,639,400,000). For Homeland Security funding analysis by OMB, agencies cat-egorize their funding data based on the critical mission areas defined in the National Strategy]
Agency 2006 1 2007 2008
Total budget authority excluding BioShield 2, 3 . . . . . . . . . . . . . 54,639.4 56,925.9 61,808.4
Intelligence and warning . . . . . . . . . . . . . . . . . . . . . . . . . . . . . . . 443.0 670.8 682.7Border and transportation security . . . . . . . . . . . . . . . . . . . . . . . . . 18,042.3 19,365.3 22,286.8Domestic counterterrorism . . . . . . . . . . . . . . . . . . . . . . . . . . . . . . 4,535.6 5,026.6 4,896.8Protecting critical infrastructure and key assets . . . . . . . . . . . . . . . . 17,933.2 18,388.2 19,926.1Defending against catastrophic threats . . . . . . . . . . . . . . . . . . . . . . 8,573.7 8,595.9 8,278.1Emergency preparedness and response. . . . . . . . . . . . . . . . . . . . . 4,992.3 4,822.2 5,551.4Other . . . . . . . . . . . . . . . . . . . . . . . . . . . . . . . . . . . . . . . . . . . . 119.3 56.9 186.5
1 FY 06 reflects the adjustments made for the Coast Guard and re-estimates for DoD. See ‘‘Source’’ for further details.2 Enacted budgets. 3 See footnote 2 in Table 513.
Source: U.S. Office of Management and Budget, Budget of the United States Government Fiscal Year 2009, The BudgetDocuments, Analytical Perspectives, Budget of the United States Government Fiscal Year 2009, Crosscutting Programs,Homeland Security Funding Analysis. <http://www.whitehouse.gov/omb/budget/fy2009/>.
Table 516. Homeland Security Grants by State/Territories: 2007 and 2008
[In thousands of dollars (1,666,460 represents 1,666,460,000). For years ending September 30. Grants consist of thefollowing programs: Citizen Corps Program (CCP), State Homeland Security Program (SHSP), Metropolitan Medical ResponseSystem (MMRS), and Urban Areas Security Initiative (UASI)]
State/Territory 2007 2008
Total . . . 1,666,460 1,697,314
U.S. . . . . . 1,650,810 1,682,304
AL . . . . . . . . 11,574 12,698AK . . . . . . . . 7,195 6,941AZ . . . . . . . . 33,774 31,292AR . . . . . . . . 7,238 6,682CA . . . . . . . . 242,245 260,824CO. . . . . . . . 19,899 20,708CT . . . . . . . . 10,479 14,845DE . . . . . . . . 6,684 6,304DC. . . . . . . . 71,985 71,247FL . . . . . . . . 84,743 77,483GA. . . . . . . . 39,959 37,127HI . . . . . . . . 12,114 11,642ID . . . . . . . . 6,701 6,322IL. . . . . . . . . 86,248 81,622IN . . . . . . . . 23,397 21,063IA . . . . . . . . 7,043 6,687KS . . . . . . . . 8,375 8,362
State/Territory 2007 2008
KY . . . . . . . . 11,757 11,885LA . . . . . . . . 21,873 23,663ME. . . . . . . . 6,697 6,317MD. . . . . . . . 32,670 30,145MA. . . . . . . . 35,509 32,252MI . . . . . . . . 39,237 36,984MN. . . . . . . . 20,504 21,367MS. . . . . . . . 7,002 6,695MO . . . . . . . 31,244 30,884MT. . . . . . . . 6,686 6,307NE . . . . . . . . 7,226 6,973NV . . . . . . . . 19,357 18,925NH. . . . . . . . 6,955 6,638NJ . . . . . . . . 61,109 63,770NM. . . . . . . . 6,973 6,657NY . . . . . . . . 208,039 233,090NC. . . . . . . . 25,256 22,435ND. . . . . . . . 6,678 6,298OH. . . . . . . . 46,321 43,168OK. . . . . . . . 14,198 13,182OR. . . . . . . . 16,033 17,035
State/Territory 2007 2008
PA . . . . . . . . 61,306 56,291RI . . . . . . . . 12,119 11,646SC . . . . . . . . 11,001 9,538SD . . . . . . . . 6,682 6,302TN . . . . . . . . 20,045 20,688TX . . . . . . . . 121,629 142,270UT . . . . . . . . 6,989 9,162VT . . . . . . . . 6,677 6,297VA . . . . . . . . 33,278 33,540WA . . . . . . . 28,926 31,379WV . . . . . . . 6,712 6,332WI . . . . . . . . 17,796 16,044WY . . . . . . . 6,674 6,294
AS . . . . . . 2,218 1,888GU . . . . . . 2,221 1,891NMI . . . . . 2,218 1,889PR . . . . . . 6,773 8,352VI . . . . . . . 2,220 1,890
– Represents zero. 1 AS—America Samoa, GU—Guam, NMI—Northern Mariana Islands, PR—Puerto Rico, VI—VirginIslands.
Source: U.S. Department of Homeland Security, State Contacts and Grants Award Administration. See <http://www.dhs.gov/xgovt/grants/index.shtm>.
Table 517. Urban Areas Security Initiative (UASI) Grant Program: 2008[In thousands of dollars (781,630 represents $781,630,000). For year ending September 30. The UASI Program providesfinancial assistance to address the unique multi-disciplinary planning, operations, equipment, training, and exercise needs ofhigh-threat, high-density urban areas. The sixty highest risk urban areas were eligible for funding. The seven highest risk urbanareas are designated Tier 1. For a listing of all grant programs and their descriptions, see <http://www.dhs.gov/xgovt/grants/index.shtm>.]
State/territory Urban area Amount
Total . . . 781,630
TIER 1 .CA . . . . Bay Area 37,155
Los Angeles/Long Beach 70,403
DC . . . . National Capital 59,801IL . . . . . Chicago 45,862NJ . . . . Jersey City/Newark 34,988NY . . . . New York City 144,189TX . . . . Houston 37,500
TIER 2AZ . . . . Phoenix 11,563
Tucson 4,753CA . . . . Anaheim/Santa Ana 13,425
Riverside 3,252Sacramento 4,045San Diego 15,511
CO . . . . Denver 7,615CT . . . . Bridgeport 1,967
Hartford 1,997FL . . . . Fort Lauderdale 6,383
State/territory Urban area Amount
Jacksonville 5,723Miami 11,621Orlando 5,432Tampa 8,352
GA . . . . Atlanta 14,220HI. . . . . Honolulu 5,005IN. . . . . Indianapolis 7,479KY . . . . Louisville 1,422LA . . . . Baton Rouge 1,787
New Orleans 4,249MD . . . . Baltimore 11,553MA . . . . Boston 13,784MI . . . . Detroit 14,191MN . . . . Twin Cities 8,206MO. . . . Kansas City 8,100
. . . . St. Louis 8,982NV . . . . Las Vegas 9,031NY . . . . Albany 1,757
Buffalo 5,306Rochester 1,466Syracuse 1,601
NC . . . . Charlotte 4,821OH . . . . Cincinnati 5,083
State/territory Urban area Amount
Cleveland 5,355Columbus 4,579Toledo 1,265
OK . . . . Oklahoma City 4,637OR . . . . Portland 7,557PA . . . . Philadelphia 18,139
Pittsburgh 6,732PR . . . . San Juan 2,033RI. . . . . Providence 5,015TN . . . . Memphis 4,453
Nashville 1,784TX . . . . Austin 1,823
Dallas/FortWorth/Arlington 20,322El Paso 5,665San Antonio 6,548
UT . . . . Salt Lake City 1,845VA . . . . Norfolk 7,760
Richmond 1,722WA . . . . Seattle 10,340WI . . . . Milwaukee 4,491
Source: Department of Homeland Security, FEMA, Grants Program Directorate; <http://www.dhs.gov/xlibrary/assets/grant-program-overview-fy2008.pdf> (released July 25, 2008).
National Security and Veterans Affairs 337
U.S. Census Bureau, Statistical Abstract of the United States: 2010

Table 518. Coast Guard Migrant Interdictions by Nationality of Alien:2000 to 2008
[For the year ending September 30]
Year Total HaitiDominican
Republic China 1 Cuba Mexico Ecuador Other
2000 . . . . . 4,210 1,113 499 261 1,000 49 1,244 442003 . . . . . 6,068 2,013 1,748 15 1,555 – 703 342004 . . . . . 10,899 3,229 5,014 68 1,225 86 1,189 882005 . . . . . 9,455 1,850 3,612 32 2,712 55 1,149 452006 . . . . . 7,886 1,198 3,011 31 2,810 52 693 912007 . . . . . 6,338 1,610 1,469 73 2,868 26 125 1672008 . . . . . 4,802 1,582 688 1 2,199 47 220 65
– Represents zero. 1 See footnote 4, Table 1296.
Source: U.S. Department of Homeland Security, ″United States Coast Guard, USCG Migrant Interdiction Statistics″;<http://www.uscg.mil/hq/cg5/cg531/AMIO/FlowStats/currentstats.asp/> (accessed 10 June 2009).
Table 519. Deportable Aliens Located by Program and Border Patrol Sector:2000 to 2007
[As of the end of September. For purposes of statistical reporting there is no difference between the terms ‘‘apprehension’’ and‘‘deportable alien located.’’ For definitions for Immigration statistics, see <http://www.dhs.gov/ximgtn/statistics/stdfdef.shtm>]
Program and sector 2000 2003 2004 2005 2006 2007
Total . . . . . . . . . . . . . . . . . . . . 1,814,729 1,046,422 1,264,232 1,291,142 1,206,457 960,756Investigations 1. . . . . . . . . . . . 138,291 114,865 103,837 102,034 101,854 53,562Detention and RemovalOperations 2. . . . . . . . . . . . . (X) (X) (X) (X) 15,467 30,407
Border Patrol . . . . . . . . . . . . . 1,676,438 931,557 1,160,395 1,189,108 1,089,136 876,787
All southwest sectors . . . . . . . . 1,643,679 905,065 1,139,282 1,171,428 1,072,018 858,722San Diego, CA . . . . . . . . . . . . 151,681 111,515 138,608 126,909 142,122 152,459El Centro, CA. . . . . . . . . . . . . 238,126 92,099 74,467 55,726 61,469 55,881Yuma, AZ . . . . . . . . . . . . . . . 108,747 56,638 98,060 138,438 118,537 37,994Tucson, AZ . . . . . . . . . . . . . . 616,346 347,263 491,771 439,090 392,104 378,323El Paso, TX . . . . . . . . . . . . . . 115,696 88,816 104,399 122,689 122,261 75,464Marfa, TX . . . . . . . . . . . . . . . 13,689 10,319 10,530 10,536 7,517 5,537Del Rio, TX . . . . . . . . . . . . . . 157,178 50,145 53,794 68,510 42,634 22,919Laredo, TX . . . . . . . . . . . . . . 108,973 70,521 74,706 75,342 74,843 56,715Rio Grande Valley, TX . . . . . . . 133,243 77,749 92,947 134,188 110,531 73,430
All other sectors. . . . . . . . . . . . 32,759 26,492 21,113 17,680 17,118 18,065Blaine, WA . . . . . . . . . . . . . . 2,581 1,380 1,354 1,001 809 749Buffalo, NY . . . . . . . . . . . . . . 1,570 564 671 400 1,517 2,190Detroit, MI . . . . . . . . . . . . . . . 2,057 2,345 1,912 1,792 1,282 902Grand Forks, ND . . . . . . . . . . 562 1,223 1,225 754 517 500Havre, MT . . . . . . . . . . . . . . . 1,568 1,406 986 949 567 486Houlton, ME. . . . . . . . . . . . . . 489 292 263 233 175 95Livermore, CA 3 . . . . . . . . . . . 6,205 3,565 1,850 117 (X) (X)Miami, FL . . . . . . . . . . . . . . . 6,237 5,931 4,602 7,243 6,032 7,121New Orleans, LA . . . . . . . . . . 6,478 5,151 2,889 1,358 3,054 4,018Ramey, PR . . . . . . . . . . . . . . 1,731 1,688 1,813 1,619 1,436 548Spokane, WA . . . . . . . . . . . . . 1,324 992 847 279 185 337Swanton, VT . . . . . . . . . . . . . 1,957 1,955 2,701 1,935 1,544 1,119
X Not applicable. 1 The Immigration and Customs Enforcement (ICE) Office of Investigations focuses on the enforcementof a wide variety of laws that include immigration and customs statutes. 2 Include arrests of fugitive and nonfugitive aliens underthe Office of Detention and Removal Operations (DRO) National Fugitive Operations Program. 3 Livermore sector closed July30, 2004.
Source: U.S. Department of Homeland Security, Office of Immigration Statistics, Yearbook of Immigration Statistics, 2007.See also <http://www.dhs.gov/files/statistics/publications/yearbook.shtm/>.
Table 520. Deportable Aliens Located: 1925 to 2007
[See headnote, Table 519. Detention and Removal Operations (DRO) data are included beginning in Fiscal Year 2006.]
Year Number
1925 . . . . . . 22,1991930 . . . . . . 20,8801935 . . . . . . 11,0161940 . . . . . . 10,4921945 . . . . . . 69,1641950 . . . . . . 468,3391955 . . . . . . 254,0961960 . . . . . . 70,6841965 . . . . . . 110,3711970 . . . . . . 345,3531971 . . . . . . 420,1261972 . . . . . . 505,949
Year Number
1973 . . . . . . 655,9681974 . . . . . . 788,1451975 . . . . . . 766,6001976 1. . . . . 1,097,7391977 . . . . . . 1,042,2151978 . . . . . . 1,057,9771979 . . . . . . 1,076,4181980 . . . . . . 910,3611981 . . . . . . 975,7801982 . . . . . . 970,2461983 . . . . . . 1,251,3571984 . . . . . . 1,246,981
Year Number
1985 . . . . . . 1,348,7491986 . . . . . . 1,767,4001987 . . . . . . 1,190,4881988 . . . . . . 1,008,1451989 . . . . . . 954,2431990 . . . . . . 1,169,9391991 . . . . . . 1,197,8751992 . . . . . . 1,258,4811993 . . . . . . 1,327,2611994 . . . . . . 1,094,7191995 . . . . . . 1,394,5541996 . . . . . . 1,649,986
Year Number
1997 . . . . . . 1,536,5201998 . . . . . . 1,679,4391999 . . . . . . 1,714,0352000 . . . . . . 1,814,7292001 . . . . . . 1,387,4862002 . . . . . . 1,062,2792003 . . . . . . 1,046,4222004 . . . . . . 1,264,2322005 . . . . . . 1,291,1422006 . . . . . . 1,206,4572007 . . . . . . 960,756
1 Includes the 15 months from July 1, 1975 to September 30, 1976, because the end date of fiscal years was changed fromJune 30 to September 30.
Source: U.S. Department of Homeland Security, Office of Immigration Statistics, 2007 Yearbook of Immigration Statistics.See also <http://www.dhs.gov/files/statistics/publications/yearbook.shtm/>.
338 National Security and Veterans Affairs
U.S. Census Bureau, Statistical Abstract of the United States: 2010

Table 521. Principal Immigration-Related Activities of Immigration andCustoms Enforcement (ICE) Investigations: 2006
[Data refer to criminal cases only; administrative cases are not included due to changes in reporting]
Activities Criminalarrests
Criminalindict-ments
Criminalcon-
victionsNumberseizures
Value ofseizures(dollars)
Total, all immigration-related categories . . . . . 8,778 6,514 6,872 3,755 33,861,911Financial investigations 1 . . . . . . . . . . . . . . . . . . . 27 16 14 60 3,996,732Human smuggling and trafficking investigations 2 . . . 2,154 1,585 1,596 1,609 11,046,622General and criminal alien investigations 3 . . . . . . . 4,589 3,434 3,689 532 4,804,781Identity and benefit fraud (IBF) investigations 4 . . . . 1,272 1,032 1,073 1,281 12,230,727Compliance and worksite enforcement 5 . . . . . . . . . 20 6 7 12 602Worksite enforcement 6 . . . . . . . . . . . . . . . . . . . . 716 441 493 261 1,782,447
1 Financial investigations refer to cases developed to counteract organizations involved in money laundering and relatedfinancial crimes. 2 Human smuggling and trafficking investigations refer to cases targeted against persons or organizations thatbring, transport, harbor, or smuggle illegal aliens into or within the United States. 3 General investigations refer to generalinvestigative activities, including those targeting aliens who attempt illegal reentry, have absconded, or commit other crimes in theUnited States. Criminal alien investigations focus on large-scale organizations engaged in ongoing criminal activity. 4 Identityand benefit fraud investigations seek to penetrate fraud schemes that are used to violate immigration and related laws, or used toshield the true status of illegal aliens in order to obtain entitlement benefits from federal, state, or local agencies. 5 Thecompliance enforcement program focuses on preventing foreign nationals from exploiting the nations immigration system bydeveloping cases for investigation from Department of Homeland Security systems containing information on the status of studentsand other nonimmigrants. 6 The worksite enforcement program focuses on monitoring and inspecting work sites to apprehendunauthorized alien workers and to provide for penalties and fines against employers who knowingly hire, recruit, or refer aliens foremployment for a fee.
Source: U.S. Department of Homeland Security, Office of Immigration Statistics, 2006 Yearbook of Immigration Statistics. Seealso <http://uscis.gov/graphics/shared/statistics/yearbook/index.htm>.(accessed 10 June 2008).
Table 522. Aliens Returned or Removed by Crime Categories and Country ofNationality: 2003 to 2007
[As of the end of September. For definitions of immigration enforcement terms, see ‘‘Immigration Enforcement Actions, 2007Yearbook of Immigration Statistics’’]
Crime category andcountry of nationality 2003 2004 2005 2006 2007
Total Aliens Returned or Removed: . . . . . . . . . . 1,152,725 1,403,508 1,343,351 1,324,355 1,210,772
Returns 1 . . . . . . . . . . . . . . . . . . . . . . . . . . . . . 945,294 1,166,576 1,096,920 1,043,381 891,390Removals 2 . . . . . . . . . . . . . . . . . . . . . . . . . . . . 207,431 236,932 246,431 280,974 319,382
Noncriminal . . . . . . . . . . . . . . . . . . . . . . . . . . 125,097 146,029 154,706 183,609 219,458Criminal 3 . . . . . . . . . . . . . . . . . . . . . . . . . . . 82,334 90,903 91,725 97,365 99,924
Leading crime categories . . . . . . . . . . . . . . . . .Dangerous drugs. . . . . . . . . . . . . . . . . . . . . 32,441 34,071 34,215 33,485 33,449Immigration . . . . . . . . . . . . . . . . . . . . . . . . 11,790 15,174 17,106 23,176 21,538Assault . . . . . . . . . . . . . . . . . . . . . . . . . . . 8,878 9,654 9,633 9,574 11,048Burglary . . . . . . . . . . . . . . . . . . . . . . . . . . . 3,324 3,406 3,351 3,506 3,466Robbery. . . . . . . . . . . . . . . . . . . . . . . . . . . 2,887 2,924 3,023 2,915 2,908Larceny . . . . . . . . . . . . . . . . . . . . . . . . . . . 2,606 2,830 2,742 2,757 2,878Sexual assault . . . . . . . . . . . . . . . . . . . . . . 2,316 2,777 2,649 2,571 2,786Family offenses . . . . . . . . . . . . . . . . . . . . . . 2,277 2,478 2,172 2,262 2,410Stolen vehicles . . . . . . . . . . . . . . . . . . . . . . 1,577 1,797 1,806 1,934 1,875Sex offenses. . . . . . . . . . . . . . . . . . . . . . . . 1,631 1,984 1,922 1,868 1,874Other . . . . . . . . . . . . . . . . . . . . . . . . . . . . 12,607 13,808 13,106 13,371 15,692
Leading country of nationalityof criminals removed . . . . . . . . . . . . . . . . . . .Mexico . . . . . . . . . . . . . . . . . . . . . . . . . . . 64,641 70,113 70,178 72,157 75,243Honduras . . . . . . . . . . . . . . . . . . . . . . . . . . 1,996 2,483 2,659 5,674 5,032El Salvador . . . . . . . . . . . . . . . . . . . . . . . . 2,066 2,768 2,808 3,731 4,669Guatemala . . . . . . . . . . . . . . . . . . . . . . . . . 1,565 1,937 1,935 3,649 3,477Dominican Republic . . . . . . . . . . . . . . . . . . . 2,194 2,556 2,370 2,277 2,108Colombia . . . . . . . . . . . . . . . . . . . . . . . . . . 1,380 1,493 1,393 1,322 1,226Jamaica. . . . . . . . . . . . . . . . . . . . . . . . . . . 1,522 1,670 1,506 1,260 1,160Canada . . . . . . . . . . . . . . . . . . . . . . . . . . . 474 565 590 537 521Nicaragua . . . . . . . . . . . . . . . . . . . . . . . . . 323 407 357 593 498Brazil. . . . . . . . . . . . . . . . . . . . . . . . . . . . . 220 763 1,433 563 328Other . . . . . . . . . . . . . . . . . . . . . . . . . . . . 5,953 6,148 6,496 5,602 7,343
1 Returns are the confirmed movement of an inadmissible or deportable alien out of the United States not based on an orderof removal. Most of the voluntary departures are of Mexican nationals who have been apprehended by the U.S. Border Patrol andare returned to Mexico. 2 Removals are the compulsory and confirmed movement of an inadmissible or deportable alien out ofthe United States based on an order of removal. An alien who is removed has administrative or criminal consequences placed onsubsequent reentry owing to the fact of the removal. 3 Refers to persons removed based on a criminal charge or those with acriminal conviction.
Source: U.S. Department of Homeland Security, Office of Immigration Statistics, 2007 Yearbook of Immigration Statistics andunpublished data. See also <http://www.dhs.gov/ximgtn/statistics/publications/yearbook.shtm>.
National Security and Veterans Affairs 339
U.S. Census Bureau, Statistical Abstract of the United States: 2010

Table 523. Customs and Border Protection (CBP)—Processed and ClearedPassengers, Planes, Vehicles, and Containers: 2000 to 2007
[In thousands (80,519 represents 80,519,000). For year ending September 30]
Characteristic 2000 2003 2004 2005 2006 2007
AirPassengers. . . . . . . . . . . . . . . . 80,519 72,959 80,866 86,123 87,906 91,574Commercial planes 1. . . . . . . . . . 829 790 824 866 881 916Private planes . . . . . . . . . . . . . . 146 132 140 135 139 139
LandPassengers 2, 3 . . . . . . . . . . . . . 397,312 329,998 326,693 317,765 289,048 299,004Autos 2. . . . . . . . . . . . . . . . . . . 127,095 120,376 121,419 121,654 119,372 112,428Rail containers. . . . . . . . . . . . . . 2,157 2,472 2,588 2,655 2,735 2,737Truck containers 4 . . . . . . . . . . . 10,397 11,163 11,252 11,308 11,489 11,459
SeaPassengers 5. . . . . . . . . . . . . . . 10,990 15,127 22,234 26,228 26,223 27,059Vessels 6 . . . . . . . . . . . . . . . . . 211 204 142 113 168 170Vessel containers 7. . . . . . . . . . . 5,813 9,092 9,796 11,341 11,622 11,703
1 A commercial aircraft is any aircraft transporting passengers and/or cargo for some payment or other consideration, includingmoney or services rendered. 2 See Table 1234 for more details. 3 Includes pedestrians. 4 Truck containers—number oftrucks entering the U.S. 5 Does not include passengers on ferries. 6 Number of vessels. Includes every description of watercraft or other contrivance used or capable of being used as a means of transportation on water, does not include aircraft.7 Number of vessel containers.
Source: U.S. Department of Homeland Security, Customs and Border Protection, About CBP, Statistics and Accomplishments,National Workload Statistics, 2000–2007 and unpublished data.
Table 524. Prohibited Items Intercepted at U.S. Airport Screening Checkpoints:2004 to 2008
[Passengers boarding aircraft in thousands (702,921 represents 702,921,000). Transportation Security Administration (TSA)assumed responsibility for airport security on February 17, 2002; and by November 19, 2002, TSA assumed control over allpassenger screenings from private contractors]
Year 2004 2005 2006 2007 2008
Passengers boarding aircraft, total 1 . . . . . . . . . 702,921 738,327 744,242 769,370 741,450Domestic . . . . . . . . . . . . . . . . . . . . . . . . . . . . 640,698 670,418 671,796 693,374 664,714International . . . . . . . . . . . . . . . . . . . . . . . . . . 62,222 67,908 72,445 75,996 76,735
Total prohibited items . . . . . . . . . . . . . . . . . . . . 7,104,095 15,886,404 13,709,684 6,516,026 (NA)Knife 2. . . . . . . . . . . . . . . . . . . . . . . . . . . . . 2,055,404 1,822,892 1,607,125 1,056,691 (9)
Other cutting items 3 . . . . . . . . . . . . . . . . . . . 3,409,888 3,276,941 163,419 101,387 (9)
Club 4 . . . . . . . . . . . . . . . . . . . . . . . . . . . . . 28,998 20,531 12,296 9,443 (9)
Box cutter . . . . . . . . . . . . . . . . . . . . . . . . . . 22,430 21,319 15,999 11,908 (9)
Firearm 5 . . . . . . . . . . . . . . . . . . . . . . . . . . . 254 850 820 1,416 902Incendiary 6 . . . . . . . . . . . . . . . . . . . . . . . . . 697,606 374,487 94,097 73,670 116,200Lighters 7. . . . . . . . . . . . . . . . . . . . . . . . . . . 178 9,420,991 11,616,688 5,124,344 (9)
Other 8 . . . . . . . . . . . . . . . . . . . . . . . . . . . . 889,337 949,243 200,060 137,167 (9)
NA Not available. 1 Data comes from the Air Transport Association. Data are for U.S. passenger and cargo airlines only.2 Knife includes any length and type except round-bladed, butter, and plastic cutlery. 3 Other cutting instruments refer to, e.g.,scissors, screwdrivers, swords, sabers, and ice picks. 4 Club refers to baseball bats, night sticks, billy clubs, bludgeons; etc.5 Firearm refers to items like pistols, revolvers, rifles, automatic weapons, shotguns, parts of guns and firearms. 6 Incendiariesrefer to categories of ammunition and gunpowder, flammables/irritants, and explosives. 7 As of April 14, 2005, passengers areprohibited from carrying all lighters on their person or in carry-on luggage or onboard an airplane. 8 Other refer to categories ofammunition and gunpowder, dangerous objects, fireworks,replica weapons, and tools. 9 The data for this prohibited itemcategory is no longer collected as of August 8, 2008.
Source: U.S. Department of Homeland Security, Transportation Security Administration, unpublished data (June 2009);<http://www.tsa.gov>; Air Transport Association of America, Washington, DC; Annual Traffic and Operations: U.S. Airlines;<http://www.airlines.org/economic/traffic/>.
Table 525. Seizure Statistics for Intellectual Property Rights (IPR) byCommodity and Trading Partner: 2007 and 2008
[In thousands of dollars (196,754 represents $196,754,000, except as indicated). Customs and Border Protection (CBP) isdedicated to protecting against the importation of goods which infringe/violate Intellectual Property Rights (IPR) by devotingsubstantial resources toward identifying and seizing shipments of infringing articles]
Commodity 2007 2008 Trading partner 2007 2008
Number of IPR seizures . . . . . . . . . . . . . . . . . . . 13,657 14,992
Total domestic value of IPR seizures 1 . . . . . . . . . . 196,754 272,729 China . . . . . . . . . . . . . . . . . . . . 158,083 221,662Footwear . . . . . . . . . . . . . . . . . . . . . . . . . . . . 77,781 102,317 India . . . . . . . . . . . . . . . . . . . . . 855 16,258Wearing apparel . . . . . . . . . . . . . . . . . . . . . . . 27,006 25,120 Hong Kong . . . . . . . . . . . . . . . . . 12,729 13,434Handbags/wallets/backpacks. . . . . . . . . . . . . . . 14,214 29,609 Taiwan. . . . . . . . . . . . . . . . . . . . 3,454 2,632Computers/hardware . . . . . . . . . . . . . . . . . . . . 9,337 7,590 Korea, South . . . . . . . . . . . . . . . 903 1,028Pharmaceuticals . . . . . . . . . . . . . . . . . . . . . . . 11,138 28,107 Dominican Republic . . . . . . . . . . . 23 942Consumer electronics 2 . . . . . . . . . . . . . . . . . . 16,042 22,998 Pakistan. . . . . . . . . . . . . . . . . . . 2,531 780Sunglasses . . . . . . . . . . . . . . . . . . . . . . . . . . 3,952 7,919 Vietnam . . . . . . . . . . . . . . . . . . . 484 748Computers/Technology Components. . . . . . . . . . 9,337 7,590 United Arab Emirates . . . . . . . . . . 373 659Media 3 . . . . . . . . . . . . . . . . . . . . . . . . . . . . . 7,884 5,967 Indonesia . . . . . . . . . . . . . . . . . . 97 649All others. . . . . . . . . . . . . . . . . . . . . . . . . . . . 27,616 29,942 All other countries . . . . . . . . . . . . 17,223 13,938
1 Domestic value is the cost of the seized goods, plus the costs of shipping and importing the goods into the U.S. and anamount for profit. 2 Consumer electronics includes cell phones and accessories, radios, power strips, electrical tools andappliances. 3 Includes motion pictures on tape, laser disc, and DVD; interactive and computer software on CD-ROM, and floppydiscs; and music on CD or tape.
Source: U.S. Department of Homeland Security, Customs and Border Protection, ‘‘Import, Commercial Enforcement,Intellectual Property Rights, Seizure Statistics’’; <http://www.cbp.gov/xp/cgov/trade/priority_trade/ipr/seizure/>.
340 National Security and Veterans Affairs
U.S. Census Bureau, Statistical Abstract of the United States: 2010