section 1 - social security: the old-age, …€¦ · 1-1 section 1 - social security: the old-age,...
TRANSCRIPT
1-1
SECTION 1 - SOCIAL SECURITY: THE OLD-AGE, SURVIVORS, AND DISABILITY INSURANCE (OASDI) PROGRAMS
CONTENTS
General
Brief History of Social Security Programs Who is Covered by Social Security?
Social Security's Financing and the Social Security Trust Funds Current Law Where Do Social Security Taxes Go and How Are They Used? How the Solvency of the Trust Funds is Measured Findings in Latest Trustees Report Historical Status of the Trust Funds
Trends Affecting the Financial Status of the Social Security Trust Funds Social Security Benefits and Eligibility
Benefit Eligibility Benefits for the Worker’s Family Benefit Computation Taxation of Benefits Disability Determination and the Claims Process
Social Security's Treatment in the Federal Budget Social Security's Off-Budget Status Budgetary Treatment of Administrative Expenses House and Senate Budget Procedures to Protect Social Security
Balances Legislative History
104th Congress 105th Congress 106th Congress 107th Congress
Statistical Tables Tax Rates and Covered Earnings Covered Workers Benefit and Recipient Data Benefit Adjustments Effect of Current Earnings and Taxation of Benefits Trust Fund and Related Data Disability Program Data
Appendix: Relationship of Taxes to Benefits for Social Security Retirees.--How Long It Takes To Recover the Value of Taxes Paid
Plus Interest References

1-2 OVERVIEW
BRIEF HISTORY OF SOCIAL SECURITY PROGRAMS
Prior to the 20th century, the majority of people in the United States lived
and worked on farms, and economic security was provided by the extended family. However, this arrangement changed as America underwent the Industrial Revolution. The extended family and the family farm as sources of economic security became less common. Then, the Great Depression triggered a crisis in the Nation's economic life. It was against this backdrop that the Social Security programs emerged.
Beginning in 1932, the Federal Government first made loans, then grants, to States to pay for direct relief and work relief. After that, special Federal emergency relief and public works programs were started. In 1935, President Franklin D. Roosevelt proposed to Congress economic security legislation embodying the recommendations of a specially created Committee on Economic Security. Then followed the passage of the Social Security Act (the Act), signed into law August 14, 1935.
This law established two social insurance programs on a national scale to help meet the risks of old age and unemployment: a Federal system of old-age benefits for retired workers who had been employed in industry and commerce, and a Federal-State system of unemployment insurance. The choice of old age and unemployment as the risks to be covered by social insurance was a natural development, since the Depression had wiped out much of the lifetime savings of the aged and reduced opportunities for gainful employment. The Act also provided Federal grants-in-aid to the States for the means-tested programs of Old-Age Assistance and Aid to the Blind, which were replaced by the Supplemental Security Income program that was enacted in 1972. These programs supplemented the incomes of persons who were either ineligible for Social Security (Old-Age and Survivors Insurance (OASI)) or whose benefits could not provide a basic living. The intent of Federal participation was to encourage States to adopt such programs. The law established other Federal grants to enable States to extend and strengthen maternal and child health and welfare services. These latter grants became the Aid to Families with Dependent Children program, which was replaced in 1996 with a new block grant program, Temporary Assistance for Needy Families. The Act also provided Federal grants to States for public health and vocational rehabilitation services. Provisions for these grants were later removed from the Social Security Act and incorporated into other legislation. The Old-Age Insurance Program was not yet in full operation when significant changes were adopted. In 1939, Congress made the old-age insurance system a family program when it added benefits for dependents of retired workers and surviving dependents of deceased workers. Benefits also first became payable in 1940, instead of 1942 as originally planned. No major changes were made again in the program until the 1950s, when it was broadened to cover many jobs that previously had been excluded--in some cases because experience was needed to

1-3 work out procedures for reporting the earnings and collecting the taxes of persons in certain occupational groups. The scope of the basic national social insurance system was significantly broadened in 1956 through the addition of disability insurance (DI). Benefits were provided for severely disabled workers aged 50 or older and for adult disabled children of deceased or retired workers. In 1958, the Social Security Act was further amended to provide benefits for dependents of disabled workers similar to those already provided for dependents of retired workers. In 1960, the age 50 requirement for disabled worker benefits was removed. The 1967 amendments provided disability benefits for widows and widowers aged 50 or older.
The 1972 amendments provided for automatic cost-of-living increases in benefits tied to increases in the Consumer Price Index (CPI) and created the delayed retirement credit, which increased benefits for workers who retire after the full retirement age (FRA) (then age 65).
The 1977 amendments changed the method of benefit computation to ensure stable earnings replacement rates over time. Earnings included in the computation were to be indexed to account for changes in the economy from the time they were earned.
The 1983 amendments made coverage compulsory for newly hired Federal civilian employees and for employees of nonprofit organizations. State and local governments were prohibited from opting out of the system once they had joined. The amendments also provided for gradual increases in the age of eligibility for full retirement benefits from 65 to 67, beginning with persons born in 1938. For certain higher income beneficiaries, benefits became subject to income tax. Amendments in 1993 increased the amount of benefits subject to taxation. The 1996 amendments relaxed earnings limits for seniors who have reached the FRA (age 65-67, depending on year of birth). The 1999 amendments reformed certain provisions under the DI Program, specifically to create stronger incentives and better supports for individuals to work. An amendment passed in April 2000 (Public Law 106-182) eliminated the earnings limit for seniors who have reached the FRA, effective for the year 2000. Concept of social insurance When the OASDI Programs were created, “insurance” was included in their titles to show that their purpose is to replace income lost to a family through the retirement, death, or disability of a worker who earned protection against these risks. This protection is earned by working in jobs that are covered under Social Security and therefore subject to payroll taxes that finance Social Security benefits. Once individuals work long enough in covered jobs to be insured, they and their families become eligible for their benefits as a matter of earned right. The level of benefits is based on the amount the worker earned in covered jobs, and is paid without a test of economic need. However, the social ends the programs serve diverge somewhat from the insurance analogy. The programs are national, and coverage is generally compulsory and nearly universal. They are designed to address social purposes such as alleviating poverty, providing added protection for
1-4 families versus single workers, and providing a larger degree of earnings replacement for low-paid versus high-paid workers. The OASDI Programs were therefore described as “social” insurance.
WHO IS COVERED BY SOCIAL SECURITY? In 1937, approximately 33 million persons worked in employment covered by the Social Security system. Over the years, major categories of workers were brought under the system, such as self-employed individuals, State and local government employees (on a voluntary basis at the option of the State), regularly employed farm and domestic workers, members of the armed services, and members of the clergy and religious orders (on a voluntary basis). In 2002, of a total work force of approximately 159.3 million workers, about 152.8 million workers and an estimated 96 percent of all jobs in the United States were covered under Social Security (Table 1-6). In 2002, an estimated 85 percent of all earnings from jobs covered by Social Security were taxable (Table 1-3). While coverage is compulsory for most types of employment, approximately 6.5 million workers did not have coverage under Social Security in 2002. The majority of these non-covered workers are in State and local governments or the Federal government (Tables 1-6 and 1-8). Beginning January 1, 1983, Federal employees were covered under the Medicare (HI) portion of the Social Security tax, and all Federal employees hired after 1983 are covered under the OASDI portion as well. In 2001, 72 percent of State and local government workers (16.9 million out of 23.6 million) were covered by Social Security. Beginning January 1, 1984, all employees of nonprofit organizations became covered, and as of April 1983, termination of Social Security coverage by State government entities was no longer allowed. State and local employees hired after March 31, 1986 are mandatorily covered under the Medicare program and must pay Hospital Insurance (HI) payroll taxes. Beginning July 1, 1991, State and local employees who were not members of a public retirement system were mandatorily covered under Social Security. This requirement was contained in the 1990 Omnibus Budget Reconciliation Act (OBRA 1990, Public Law 101-508).
SOCIAL SECURITY'S FINANCING AND THE SOCIAL SECURITY TRUST FUNDS
CURRENT LAW
The OASDI program and the Medicare HI program are primarily financed through the collection of payroll taxes under the Federal Insurance Contributions Act (FICA) and the Self-Employment Contributions Act (SECA). These taxes are levied on the wages and net self-employment income of workers covered by Social Security and Medicare.

1-5 The FICA tax is levied at a rate of 15.3 percent. The tax is shared by
employees and their employers, with each paying half of the total amount.1
Employers may deduct their share of the FICA tax for income tax purposes, but the employee's share is not tax deductible. Of the total 15.3 percent FICA tax, 12.4 percent is used to finance the OASDI Program, and 2.9 percent is used to finance the Medicare HI Program. The OASDI portion of the tax is levied on earnings up to $87,900 in 2004. This “taxable wage base” increases annually with average wage growth in the economy. The HI portion of the tax is levied on all earnings. When the FICA tax was first levied in 1937, the tax rate was 2 percent on earnings up to $3,000.
The SECA tax also is levied at a rate of 15.3 percent, with the same 12.4 percent and 2.9 percent split between OASDI and HI as the FICA tax. Prior to 1984, the SECA tax rate paid by self-employed workers was lower than the total FICA tax rate paid by employees and employers. Effective for 1984 through 1989, self-employed workers paid the same total tax as employees and employers, but received a partial credit against that tax liability. Effective in 1990 and thereafter, the credit was replaced with a system designed to achieve parity between employees and the self-employed. Under this system:
The base of the SECA tax is adjusted downward to reflect the fact that employees do not pay FICA taxes on the employer's portion of the FICA tax. The adjusted base is equivalent to net earnings from self-employment (up to the taxable wage base) less 7.65 percent.
In addition, self-employed workers are allowed to deduct half of their SECA tax liability for income tax purposes to reflect the fact that employees do not pay income tax on the employer's portion of the FICA tax.
Tables 1-1 and 1-2 show FICA and SECA tax rates and maximum taxable earnings, both past and future. The following workers are exempt from FICA and SECA taxes:
1. State and local government workers participating in alternative retirement systems (HI tax is mandatory for State and local government workers hired since April 1,1986);
2. Election workers earning $1,200 or less a year; 3. Ministers who choose not to be covered, and certain religious sects; 4. Federal workers hired before 1984 (the HI portion is mandatory for all
Federal workers2; 5. College students working at their academic institutions; 6. Household workers earning less than $1,400 in 2004, or those under
age 18 for whom household work is not their principal occupation; and 7. Self-employed workers with annual net earnings below $400.
1 Although the FICA tax is shared between employers and employees, most economists agree that the total burden of the tax is borne by employees in the form of lower wages or fringe benefits. 2 Elected office holders, political appointees, and judges are mandatorily covered by both OASDI and HI regardless of when their service began.
1-6 In addition to payroll taxes, the Social Security system is credited with
income from the taxation of Social Security benefits and interest on trust fund balances. In combination, these sources of income are used to pay Social Security benefits and administrative expenses. Administrative expenses are subject to an annual limitation set by appropriations acts.
WHERE DO SOCIAL SECURITY TAXES GO AND HOW ARE THEY USED? The costs of the Social Security program, both its benefits and administrative expenses, are financed primarily by the FICA and SECA taxes. These taxes flow each day into thousands of depository accounts maintained by the government with financial institutions across the country. Along with many other forms of revenues, these Social Security taxes become part of the government's operating cash pool, or what is more commonly referred to as the U.S. Treasury. In effect, once these taxes are received, they become indistinguishable from other moneys the government takes in. They are accounted for separately through the issuance of Federal securities to the Social Security Trust Funds--which basically involves a series of bookkeeping entries by the Treasury Department--but the trust funds themselves do not hold money.3 They are simply accounts. Similarly, Social Security checks are paid from the Treasury, not the trust funds. As the checks are paid, securities of an equivalent value are removed from the trust funds. In a sense, the mechanics of a Federal trust fund are similar to those of a bank account. The bank takes in a depositor's money, credits the amount to the depositor's account, and then loans it out. As long as the account shows a balance, the depositor can write checks that the bank must honor. When more Social Security taxes are received than spent, the balance of securities posted to the Social Security Trust Funds rises. The surplus taxes themselves are then used for any of the many functions of government. The trust funds’ Federal securities, like those sold to the public, are legal obligations of the government. The Social Security Trustees projected in March 2003 that the balances of the trust funds would reach $1.5 trillion by the end of calendar year 2003 (Table 1-29). While generally the securities issued to the trust funds are not marketable, they do earn interest at market rates, have specific maturity dates, and represent legal obligations of the U.S. Government. What often confuses people is that they see these securities as assets for the government. When an individual buys a government bond, she has established a financial claim against the government. When the government issues a security to one of its own accounts, it hasn't purchased anything or established a claim against some other person or entity. It is simply creating an IOU from one of its accounts to another. Hence, building up Federal securities in Federal trust funds--like those of Social Security--is not a means in and of itself for the government to accumulate assets. It certainly establishes claims against the government for the Social Security program, but the program is part of the government. Those claims are not resources the government
3 Public Law 103-296 requires the Secretary of the Treasury to issue “physical documents” to the trust funds. Under prior practice, trust fund securities were recorded only electronically.

1-7 may use to pay future Social Security benefits. The key point is that the trust funds themselves do not hold resources to pay benefits. Rather, they provide authority for the Treasury Department to use whatever money it has on hand to pay them. The significance of having trust funds for Social Security is that they represent a long-term commitment of the government to the program. While the funds do not hold “resources” that the government can call on to pay Social Security benefits, the balances of Federal securities posted to them represent and have served as financial claims against the government--claims on which the Treasury has never defaulted, nor used directly as a basis to finance anything but Social Security expenditures. The trust fund arrangement is different from that used by other programs in government in that many other programs, particularly those not accounted for through trust funds, get their operating balances--i.e., their permission to spend--through the annual appropriations process. Congress must pass an appropriations act each year giving the Treasury Department permission to expend funds for them. In technical jargon, this permission to spend is referred to as “budget authority.” For many programs accounted for through trust funds, annual appropriations are not needed. As long as their trust fund accounts show a balance of Federal securities, the Treasury Department has “budget authority” to expend funds for them. Another difference between trust fund programs and other programs is that a trust fund account earns interest, because it contains Federal securities. In the case of the Social Security Trust Funds, the interest is equal to the prevailing average rate on outstanding Federal securities with a maturity of 4 years or longer. This interest is credited to the trust funds twice a year (on June 30th and December 31st) by issuing more securities to them. So in effect, a trust fund account can automatically build future “budget authority” for the program, but other accounts that depend on annual appropriations cannot. Legislation enacted in 1990 (the Budget Enforcement Act, included in Public Law 101-508) removed Social Security taxes and benefits from calculations of the budget. In large part this was done to prevent Social Security from masking the size of Federal budget deficits and to protect it from benefit cuts motivated by budgetary concerns. It was based on the supposition that Congress would act differently in trying to reduce budget deficits if Social Security surpluses were not counted in reaching the budget totals (i.e., that Congress would ignore Social Security in devising the Nation's overall fiscal policies). It was not done to change where Social Security taxes go. The Federal budget is not a cash management account. It is simply a summary of what policymakers want the government's financial flows to be during any given time period. Whether this summary is presented in a unified or fragmented form will not in and of itself change how much money the government receives and spends, and it will not alter where Federal tax receipts of any sort go. Social Security taxes will go into the Treasury whether or not the program is counted in the budget. Social Security taxes will go elsewhere only if Congress decides they will go elsewhere.
1-8 HOW THE SOLVENCY OF THE TRUST FUNDS IS MEASURED
Social Security's financial condition is assessed annually by its Board of Trustees, composed of the Secretaries of Treasury (who is the Managing Trustee), Labor, Health and Human Services, as well as the Commissioner of Social Security and two representatives of the public. The Social Security Act requires that the Board of Trustees, among other duties, report to the Congress annually on the financial status of the Social Security Trust Funds. In the short range, the financial soundness of each of the trust funds can be assessed by considering the size of the trust fund balance in absolute terms, as a percentage of the annual expenditures, and with reference to whether the balance is growing or declining. In the long range, the traditional measure of financial soundness has been the actuarial balance of the system. The actuarial balance is defined as the difference between the total summarized income rate (ratio of the present value of tax income to the present value of taxable payroll over a 75-year period) and the total summarized cost rate (ratio of the present value of expenditures to the present value of taxable payroll over a 75-year period). Because the Social Security program has been designed as a contributory system in which those who pay payroll taxes supporting the system are considered to be earning the right to future benefits, Congress has traditionally required long-range estimates of the program's actuarial balance and has set future tax rates with a view to ensuring that the income of the program will be sufficient to cover its outgo. Under current procedures, the long-range actuarial analysis of the program covers a 75-year period, which would generally be long enough to cover the anticipated retirement years of those currently in the work force. The long-range status of the trust funds is often expressed in terms of percent of taxable payroll rather than in dollar amounts. This permits a direct comparison between the tax rate in the law and the cost of the program. For example, if the program is projected to have a deficit of 2 percent of taxable payroll, the OASDI tax rates now in the law would have to be increased by 1 percentage point each for employee and employer (a total of 2 percent) in order to pay for the benefits due. Alternatively, the program could be brought back into balance by an equivalent reduction in benefit outgo or by a combination of revenue increases and outgo reductions. If the program is projected to have a deficit of 2 percent of taxable payroll, and expenditures are projected to be 10 percent of taxable payroll, then under the given set of assumptions, 20 percent (2 divided by 10) of expenditures could not be met with that tax schedule. In 2003, the total taxable payroll is estimated to be $4,387 billion. Thus, in 2003 terms, 2 percent of payroll represented about $88 billion. Long-range projections are affected by three basic types of factors: (1) demographic factors, such as rates of fertility, life expectancy, and immigration, which determine the number of workers in relation to beneficiaries; (2) economic factors such as unemployment, productivity, and inflation; and (3) factors specifically related to the Social Security Program, such as eligibility rules, benefit levels, and the categories of covered employment. The actuaries at the Social
1-9 Security Administration (SSA) employ three sets of alternative economic and demographic assumptions. Alternative I is based on optimistic assumptions; alternative II is based on intermediate assumptions; and alternative III is based on pessimistic assumptions. Alternative II is considered the “best guess” of long-term solvency and is the most frequently cited. It is clear that underlying factors cannot be predicted with any certainty as far into the future as 75 years. As a result, long-range projections should not be taken as absolute predictions of deficits or surpluses in the funds. Beginning with their 1988 report, the Trustees used an alternative method of determining the actuarial balance. Under this method, the actuarial balance for any given period is the difference between the present value of income and costs for the period, each divided by the present value of taxable payroll for the period. The present value equals the value today of the future tax revenue, benefit payments, and taxable payroll expected each year during the period, after taking into account a specified interest rate. Traditionally, the Trustees based their conclusion about the long-range actuarial condition of the program on the “closeness” of the income and cost rates when averaged over a 75-year period. If the income rate was between 95 and 105 percent of the cost rate over this projection period, the system was said to be in close actuarial balance. The 1991 Trustees' Report incorporated a more refined measure of actuarial soundness designed to reveal problems occurring at any time during the 75-year measuring period. The 5-percent tolerance (i.e., the amount of acceptable actuarial deficit) was retained in measuring the program's actuarial soundness for the 75-year period as a whole, but less tolerance is now permitted for shorter periods of valuation. The spread between income and outgo is evaluated throughout the measuring period in reaching a conclusion of whether close actuarial balance exists, with the amount of acceptable deviation gradually declining from 5 percent for the full 75-year period to 0 (or no acceptable deviation) for the first 10-year segment of the measuring period. To meet the short-range test of financial adequacy, the reserve balance at the end of the first 10-year segment must be at least 100 percent of annual expenditures, a condition that is consistent with the 10-year segment of the long-range test of close actuarial balance. The reserve balance also must be expected to reach that level within the first 5 years and then remain there. Under this revised limit, if income were at least 95 percent of the cost level for the 75-year period as a whole, the trust funds still could be deemed to be out of close actuarial balance if financial adequacy requirements are not met for shorter periods of valuation. Under these measures, the Trustees concluded in their 2003 report, as they did in their twelve previous reports, that the Social Security system is not in close actuarial balance over the long run. Overall, for the period 2003-77, the difference between the summarized income and cost rates for the OASDI Program is a deficit of 1.92 percent of taxable payroll based on the intermediate assumptions (Table 1-33). Therefore, on a combined basis, the OASDI Program is not in close actuarial
1-10 balance over the next 75 years. In addition, the individual OASI and DI Trust Funds are not in close actuarial balance. Income from OASDI payroll taxes represents 12.4 percent of taxable payroll. Because the tax rate is not scheduled to change under present law, OASDI payroll tax income as a percentage of taxable payroll remains constant at 12.4 percent. Adding the OASDI income from the income taxation of benefits to the income from payroll taxes yields a total “income rate” of 12.70 percent. This rate is estimated to increase gradually to 13.43 percent of taxable payroll by the end of the 75-year projection period based on the intermediate assumptions. The growth is attributable, in part, to increasing proportions in both the number of beneficiaries and the amount of their benefits subject to taxation in the future. These proportions will increase because the income thresholds, above which benefits are taxable, are fixed dollar amounts, and as time goes by, the incomes of more people will exceed them due to the expected rise in wages and prices. OASDI expenditures for benefit payments and administrative expenses currently represent about 10.89 percent of taxable payroll. This cost rate is estimated to remain below the corresponding income rate for the next 15 years, based on the intermediate assumptions. However, with the retirement of the 76 million members of the baby boom generation starting in about 2010, OASDI costs will increase rapidly relative to the taxable earnings of workers. By 2080 the OASDI cost rate is estimated to reach 20.09 percent under the intermediate assumptions, resulting in an annual deficit of 6.67 percent (Table 1-32). Table 1-30 shows estimated trust fund balances as a percentage of annual expenditures, and Tables 1-28 and 1-29 show estimated trust fund operations for selected calendar years 2003-40 in nominal and constant dollars, respectively.
FINDINGS IN LATEST TRUSTEES’ REPORT The Board of Trustees 2003 Report was released on March 17, 2003. The Congressional Budget Office (CBO) also makes Social Security projections, the latest of which were released in March 2003. The Trustees' projections cover a period of 75 years, whereas CBO's projections are only for the next 10 years. Both the Trustees and CBO show that through the next 10 years the favorable demographic pattern of a large baby boom generation at peak earning years, combined with the retirement of the relatively small generation born during the Depression, should ensure large trust fund balances. Under the Trustees' intermediate (or “best guess”) set of assumptions, the annual excess of income over outlays will reach $316 billion by fiscal year 2012, and the balance of the trust funds will represent 4.5 years' worth of outgo. Over the long run, the projections are troubling. For a number of years, the Trustees’ reports have projected long-range financing problems for the system. Although the latest report continues to show a near-term buildup of trust fund reserves, the intermediate forecast for the next 75 years shows that, on average, Social Security expenditures will be 14 percent more than its income. On a combined basis, the trust funds’ tax revenue would fall short of benefit costs in

1-11 2018. Interest paid to the trust funds would allow the trust fund balances to keep growing until they peak at $7.5 trillion in nominal dollars in 2027, after which trust fund balances would decline as the post-World War II baby boomers retire. The Trustees estimate that by 2028 the DI Trust Fund would be exhausted, and by 2044 the OASI Trust Fund would be exhausted as shown in Table 1-31. On a combined basis, the two trust funds would be exhausted in 2042. (The term “exhausted” is commonly used to indicate that trust fund balance plus payroll taxes and other revenues would be insufficient to pay all benefits when they are due.)
HISTORICAL STATUS OF THE TRUST FUNDS For more than three decades after Social Security taxes were first levied in 1937, the system's income routinely exceeded its outgo, and its trust funds grew. However, the situation changed in the early 1970s. Enactment of major benefit increases in the 1968-72 period was followed by higher inflation and leaner economic conditions than had been expected. Prices rose faster than wages, the post-World War II baby boom ended precipitously (leading to a large cut in projected birth rates), and Congress adopted faulty benefit rules in 1972 that overcompensated new Social Security retirees for inflation. These factors combined to sour the outlook for Social Security and it remained poor through the mid-1980s. Before 1971, the balances of the trust funds had never fallen below 1 year's worth of outgo. Beginning in 1973, the program's income lagged its outgo, and the trust funds declined rapidly. Congress had to step in five times during the late 1970s and early 1980s to keep them from being exhausted. Although major changes enacted in 1977 greatly reduced the program's long-run deficit, they did not eliminate it, and the short-run changes made by the legislation were not large enough to enable the program to withstand back-to-back recessions in 1980 and 1982. A disability bill in 1980 and temporary fixes in 1980 and 1981 were followed by another major reform package in 1983. The 1983 changes, along with better economic conditions, helped alter the short-range picture. Income began to exceed outgo in 1983 and the trust funds grew substantially. Cumulatively, the changes were projected to yield $96 billion in surplus income by 1990, and to raise the trust funds' balances to $123 billion. The funds actually were credited with $200 billion in surplus income by 1990, and their balances reached $225 billion by the end of that year. By the end of fiscal year 2002, they reached $1.3 trillion. These balances would be equivalent to 288 percent of expenditures in 2003 (or almost 3 years' worth of benefits). The longer range picture for Social Security has been worsening gradually since 1983. By gradually raising Social Security's age for receiving full benefits from 65 to 67, subjecting benefits to income taxes, and making new Federal and nonprofit workers join the system, Congress had attempted in 1983 to eliminate the long-run problem. In fact, projections made then showed that Congress had stemmed the red ink, at least on average, for the following 75 years. However, the average condition of the two trust funds did not represent their condition over the entire period. The funds were not shown to be insolvent at any point, but their

1-12 expenditures were expected to exceed their income by 2025 and to remain higher thereafter. Simply Stated, 40 years of surpluses were to be followed by an indefinite period of deficits. With each passing year since 1983, the Trustees' 75-year averaging period has picked up 1 deficit year at the back end and dropped a surplus year from the front end. This, by itself, would cause the average condition to worsen. However in recent reports, assumptions about birth rates, economic growth, and wages have been lowered, causing further deterioration in the long-term outlook.
TRENDS AFFECTING THE FINANCIAL STATUS OF THE SOCIAL SECURITY TRUST FUNDS
The 2003 Trustees’ report shows an average 75-year deficit equal to 14 percent of the program's income, and projects that the trust funds would be exhausted in 2042 (one year later than last year's projection). As a percent of the Nation's payrolls, their income would average 13.78 percent, their outgo 15.70 percent, and the deficit would be 1.92 percent (compared to 1.87 and 1.86 percent in the 2002 and 2001 reports respectively). This average deficit is slightly lower than the deficit addressed by Congress in 1983. These long-range projections assume that the gross domestic product (GDP) (adjusted for inflation) will rise annually at rates ranging from 3.6 percent in 2004 to 1.8 percent in 2080, wages would rise at an ultimate rate of 4.1 percent per year, the cost of living would go up at a rate of 3.0 percent, unemployment would average 5.5 percent, and that Social Security benefits would fall in relative terms as the age at which full benefits are payable rises from 65 to 67 over the 2000-22 period. The higher age for full benefits will mean that people retiring at age 67 or younger will get less than under the previous rules. These assumptions by themselves would seem to bode well for the system; however, looming demographic shifts are projected to overwhelm them. During the next fifteen years, the baby boomers will be in their prime productive years, and the baby-trough generation of the 1930s will be in retirement. Together these factors will lead to a stable ratio of workers to recipients. However, as the baby boomers begin retiring around 2010, this ratio will erode quickly. By 2025, most of the surviving baby boomers will be 65 and older. The number of people 65 and older will have risen by 73 percent, growing from over 36 million today to 63 million then. The number of workers will have grown from 154 million to 178 million, or by only 16 percent. Consequently, the ratio of workers to recipients will have fallen from 3.3 to 1 today to 2.3 to 1 in 2025 (and, by 2035, 2.1 to 1). Under this forecast, the trust funds (on a combined basis) would be credited with surplus income through 2027 bringing their balances to a level of $7.5 trillion. They would decline in 2028 and thereafter, and would be depleted by 2042 (chart 1-1). However, tax receipts begin lagging outgo much sooner, in 2018. At that point, the program would have to rely on the interest credited to its trust funds for part of its income, which would have to be drawn from general revenues. In 2028, the balance of the trust funds would begin to be drawn down. By 2028, $1 out of

1-13 every $5 of the program's outgo would be funded by general revenues from interest payments and the redemption of the government bonds in the trust funds. The government has never defaulted on the securities it posts to its trust funds, but the magnitude of these potential claims has prompted many observers to ask where the government will find the money to cover them. Basically, in the absence of surpluses for the rest of the government's operations, policymakers would have three options: raise other taxes, curtail other spending, or borrow money from the financial markets. There is nothing in the law that will dictate or determine what they actually will (or can) do then.
CHART 1-1--SOCIAL SECURITY TRUST FUNDS’ END OF YEAR BALANCES, 2003-2042
Trust Funds exhausted in
2042$0
$2,000
$4,000
$6,000
$8,000
2003
2006
2009
2012
2015
2018
2021
2024
2027
2030
2033
2036
2039
2042
Dol
lars
in B
illio
ns
Source: Board of Trustees (2003; intermediate assumptions). Economists argue that if the surplus Social Security taxes projected for the next 15 years were to cause the government to reduce the Federal debt held by the public, more money would be available in the financial markets for investment, which could lead to greater economic growth. If this occurred, extracting resources from the economy in the future to honor Social Security claims would not necessarily be as burdensome. Said another way, if one accepts the premise that reductions in the Federal debt held by the public today will increase the resources available for investment, then surplus Social Security taxes today could help build a higher economic base from which to draw the needed resources in the future. However, running Social Security surpluses will not by itself reduce government borrowing from the markets. Reductions in the debt occur when the government runs an overall or unified budget surplus, not when one of its programs generates surplus taxes. Even if economic growth were enhanced in the coming decades by reductions in government debt, Social Security's problems would not necessarily be resolved. Further, as their numbers swell, the baby boomers and subsequent retirees will raise financial demands on other public programs for the elderly such as Medicare.
1-14 These projections are not based on pessimistic economic assumptions. A
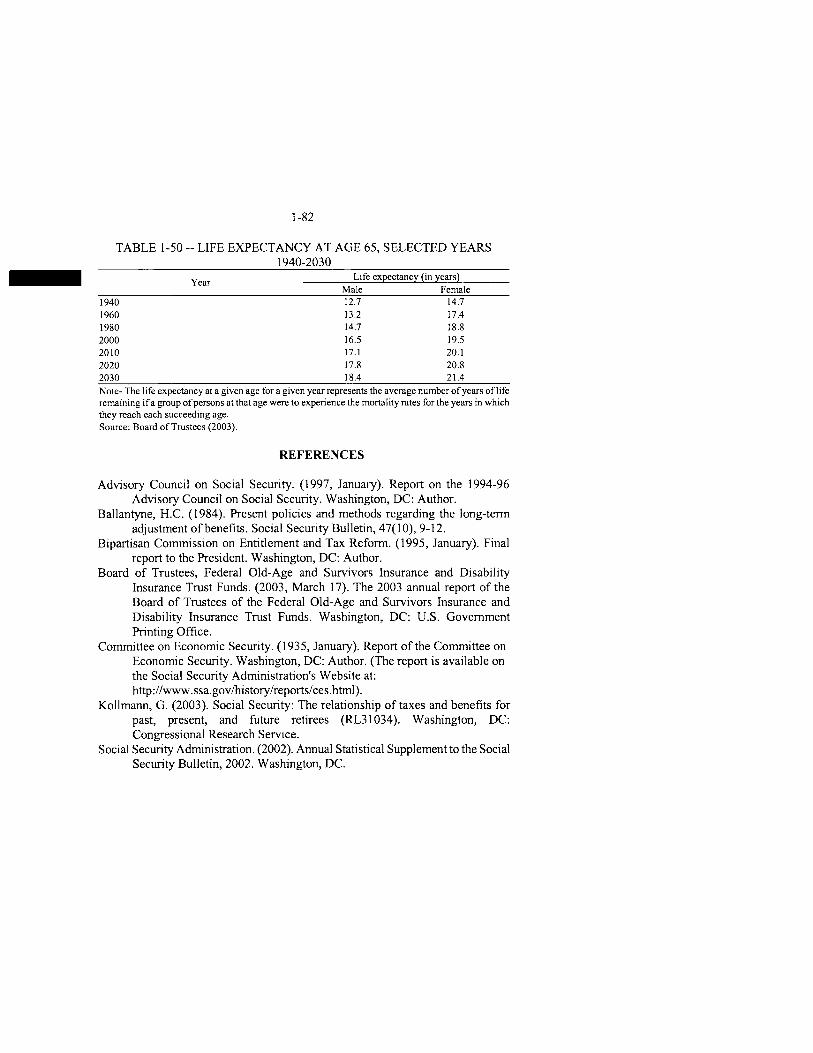
modest but sustained rise in GDP and moderate inflation and unemployment are assumed as shown in Table 1-37. In large part, the projections hinge on demographic factors that are in place today--the post-World War II baby boom, the subsequent birth dearth, and the general aging of society. Table 1-36 shows how life expectancies have increased since Social Security benefits were first paid in 1940, and what they are projected to be in the future, as well as fertility and death rates. These projections suggest that to restore long-run solvency, Social Security program income needs to be raised or expenditures cut.
SOCIAL SECURITY BENEFITS AND ELIGIBILITY
BENEFIT ELIGIBILITY Benefits can be paid to workers and their dependents or survivors only if the worker has worked long enough in covered employment to be insured for these benefits. Insured status is measured in terms of “credits,” previously called “quarters of coverage.” In determining whether a person has the required credits for insured status, Social Security uses the lifetime record of earnings reported under the worker's Social Security number (SSN) and counts the number of quarters which are covered credits. Before 1978, one credit was earned for each calendar quarter in which a worker was paid $50 or more in wages for covered employment, or received $100 in self-employment income. A worker also could receive a credit for each multiple of $100 in annual agricultural earnings, up to a maximum of four credits per year. Since the beginning of 1978, the crediting of quarters of coverage has been on an annual rather than a quarterly basis, up to a maximum of four credits per year. In 1978, a worker earned one credit (up to a maximum of four) for each $250 of annual earnings reported from covered employment or self-employment. The amount of annual earnings needed for a credit is increased each year in proportion to increases in average wages in the economy. In 2004 the amount of earnings needed for a credit is $900. Table 1-5 shows amounts needed for selected calendar years, 1978-2012. For the purpose of the Old-Age and Survivors Insurance (OASI) Program, there are two types of insured status: “fully insured” and “currently insured.” Workers are fully insured for benefits for themselves and for their eligible dependents if they have total credits equaling one credit for each calendar year after the year they reached age 21 up to the year before they reach age 62, become disabled, or die, whichever occurs earlier. Fully-insured status is required for eligibility for all types of benefits except certain survivor benefits. No matter how young, a worker must have at least six credits to be fully insured, with the minimum number increasing with age. A worker with 40 credits is fully insured for life. Survivors of a worker who was not fully insured may still be eligible for benefits if the worker was currently insured. Workers are currently insured if they

1-15 have 6 credits during the 13 calendar quarters ending with the quarter in which they died. Workers are insured for disability if they are fully insured and have a total of at least 20 credits during the 40-quarter period ending with the quarter in which they became disabled. Workers who are disabled before age 31 are insured for disability if they have credits equal to half the calendar quarters which have elapsed since the worker reached age 21, ending in the quarter in which they became disabled. However, a minimum of six credits is required. The Personal Responsibility and Work Opportunity Reconciliation Act of 1996 requires persons applying for Old-Age, Survivors, and Disability Insurance (OASDI) monthly benefits in the United States to provide evidence they are U.S. citizens, nationals, or aliens who are lawfully present in the United States in order to get Social Security benefits. To be considered a lawfully present alien in the United States, the beneficiary must be: lawfully admitted for permanent residence; admitted as a refugee under section 207 of the Immigration and Nationality Act (INA); granted asylum under section 208 of the INA; granted conditional entry as a refugee under section 203(a)(7) of the INA prior to April 1, 1980; an alien who has submitted an application for political asylum under section 208 of the INA; or an alien who belongs to any class permitted to reside in the United States for humanitarian or other reasons. Retirement benefits Workers must be at least age 62 to be eligible for retirement benefits. There is no minimum age requirement for disability benefits, but disabled workers who attain the full retirement age (FRA) (see later section on “Adjustments related to age at retirement”) automatically receive full retirement benefits, rather than disability benefits. Disability benefits are computed as if the worker reached FRA on the day he became totally disabled. Disability Benefits Generally, disability is defined as the inability to engage in “substantial gainful activity” (SGA) by reason of a physical or mental impairment. The impairment must be medically determinable and expected to last for not less than 12 months, or to result in death. Applicants may be determined to be disabled only if, due to such an impairment, they are unable to engage in any kind of substantial gainful work, considering their age, education, and work experience. The work need not exist in the immediate area in which the applicant lives, nor must a specific job vacancy exist for the individual. Moreover, no showing is required that the worker would be hired for the job if he or she applied. In 2004, the SGA earnings level for non-blind beneficiaries is $810 a month (net of impairment-related work expenses). For blind beneficiaries, the SGA earnings level is $1,350 a month. Both limits are indexed annually to average wage growth. Table 1-24 shows SGA amounts applicable since 1968. An initial 5-month waiting period is required before disability insurance (DI) benefits are paid. Benefits are payable beginning with the sixth full month of
1-16 disability. However, benefits may be paid for the first full month of disability to a worker who becomes disabled within 60 months after termination of DI benefits from an earlier period of disability (for a disabled widow or widower the period is 84 months).
BENEFITS FOR THE WORKER’S FAMILY Dependents' benefits are payable in addition to benefits payable to the worker. What follows is a review of the various types of dependents and their benefits. Spouse's benefit.--A monthly benefit is payable to a spouse of an entitled retired or disabled worker under one of the following conditions: (1) a currently-married spouse is at least 62 or is caring for one or more of the worker's entitled children who are disabled or have not reached age 16; or (2) a divorced spouse is at least 62, is not married, and the marriage had lasted at least 10 years before the divorce became final. A divorced spouse may be entitled independently of the worker's retirement if both the worker and divorced spouse are age 62, and if the divorce has been final for at least 2 years. Widow(er)'s benefit.--A monthly survivor benefit is payable to a widow(er) or divorced spouse of a worker who was fully insured at the time of death. The widow(er) or divorced spouse must be unmarried (unless the remarriage occurred after the widow(er) first became eligible for benefits as a widow(er)); and must be either (1) age 60 or older or (2) age 50-59 and disabled throughout a waiting period of 5 consecutive calendar months that began no later than 7 years after the latest of the month the worker died, the last month of entitlement to benefits as a widowed mother or father, or the last month entitlement to benefits as a disabled widow(er) ended because the disability ended. Child's benefit.--A monthly benefit is payable to a dependent, unmarried biological or adopted child, stepchild, or grandchild, of a retired, disabled, or deceased worker who was fully or currently insured at death. (To be entitled as a grandchild, the child's parents must be deceased or disabled.) Dependency is deemed for the insured's biological children and most adopted children. The child must be either: (1) under age 18; (2) a full-time elementary or secondary student under age 19; or (3) a disabled person age 18 or older whose disability began before age 22. Mother's/father's benefit.--A monthly survivor benefit is payable to a mother (father) or surviving divorced mother (father) if: (1) the deceased worker on whose account the benefit is payable was fully or currently insured at time of death; and (2) the mother (father) or surviving divorced mother (father) is not married and has one or more entitled children of the worker in care. In the case of a surviving divorced mother or father, the child must also be the applicant's natural or legally adopted child. These payments continue as long as the youngest child being cared for is under age 16 or disabled (see “Child's benefit” above). Parent's benefit.--A monthly survivor benefit is payable to a parent of a deceased fully insured worker who is age 62 or older and has not married since the

1-17 worker's death. The parent must have been receiving at least one-half of her support from the worker at the time of the worker's death or, if the worker had a period of disability which continued until death, at the beginning of the period of disability. Proof of support must be filed within 2 years after the worker's death or the month in which the worker filed for disability. Lump-sum death benefit.--A one-time lump-sum benefit of $255 is payable upon the death of a fully or currently-insured worker to the surviving spouse who was living with the deceased worker or was eligible to receive monthly cash survivor benefits upon the worker's death. If there is no eligible spouse, the lump-sum death benefit is payable to any child of the deceased worker who is eligible to receive monthly cash benefits as a surviving child. If the worker had no surviving spouse or children, then the lump-sum death benefit is not paid. Tables 1-10 and 1-11 provide detailed information on the number of OASDI beneficiaries in various categories, and the average amount of monthly benefits by type of beneficiary. Tables 1-40 and 1-41 present data on the demographic, social, and medical characteristics of the disabled population over time. For example, Table 1-40 shows an increase in the receipt of disability benefits by women, reflecting larger societal trends in female work force participation.
BENEFIT COMPUTATION Primary insurance amount All monthly benefits are computed based on a worker's primary insurance amount (PIA). The PIA is a monthly amount determined by applying the Social Security benefit formula to a worker's average lifetime covered earnings. It is also the monthly benefit amount payable to a worker who retires at the full retirement age (FRA) or becomes entitled to disability benefits. Except for workers who are eligible for a “special minimum benefit” (see description below), the PIA is determined through a formula applied to the worker's average indexed monthly earnings (AIME). The AIME is a dollar amount that represents the average monthly earnings from Social Security-covered employment over most of the worker's adult life indexed to the increase in average annual wages. Indexing the earnings to changes in wage levels ensures that the same relative value is accorded to wages, no matter when they were earned. Because actual average-wage data take over a year to become available, past earnings are updated to the second calendar year (the “indexing year”) before the worker becomes eligible for retirement (age 62) or, if earlier, becomes disabled or dies. This means that the year a worker turns age 60 is used as the indexing year for computing retirement benefits. Earnings in and after the indexing year are not indexed. In determining the AIME: each year's earnings prior to age 60 is multiplied by the ratio of the average wage for the indexing year to the average wage in the economy for that year; and a specific number of “computation years” is determined based on the number of years elapsing after 1950 (or year of attaining age 21, if
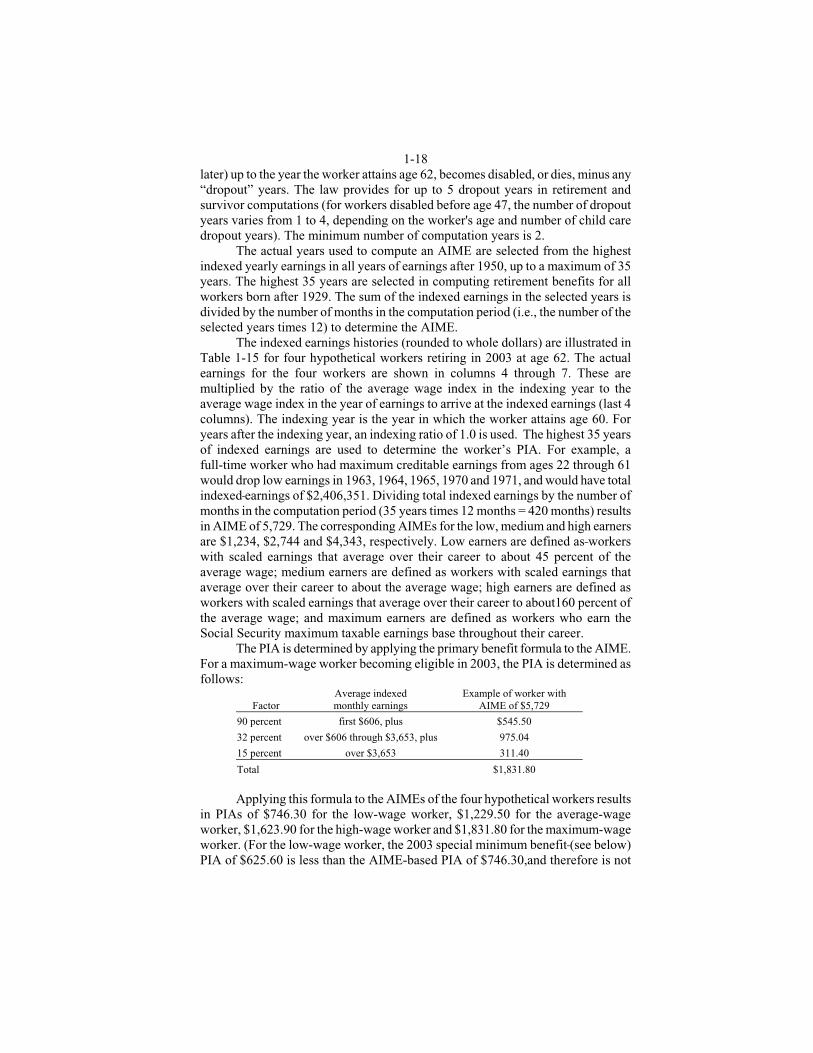
1-18 later) up to the year the worker attains age 62, becomes disabled, or dies, minus any “dropout” years. The law provides for up to 5 dropout years in retirement and survivor computations (for workers disabled before age 47, the number of dropout years varies from 1 to 4, depending on the worker's age and number of child care dropout years). The minimum number of computation years is 2. The actual years used to compute an AIME are selected from the highest indexed yearly earnings in all years of earnings after 1950, up to a maximum of 35 years. The highest 35 years are selected in computing retirement benefits for all workers born after 1929. The sum of the indexed earnings in the selected years is divided by the number of months in the computation period (i.e., the number of the selected years times 12) to determine the AIME. The indexed earnings histories (rounded to whole dollars) are illustrated in Table 1-15 for four hypothetical workers retiring in 2003 at age 62. The actual earnings for the four workers are shown in columns 4 through 7. These are multiplied by the ratio of the average wage index in the indexing year to the average wage index in the year of earnings to arrive at the indexed earnings (last 4 columns). The indexing year is the year in which the worker attains age 60. For years after the indexing year, an indexing ratio of 1.0 is used. The highest 35 years of indexed earnings are used to determine the worker’s PIA. For example, a full-time worker who had maximum creditable earnings from ages 22 through 61 would drop low earnings in 1963, 1964, 1965, 1970 and 1971, and would have total indexed earnings of $2,406,351. Dividing total indexed earnings by the number of months in the computation period (35 years times 12 months = 420 months) results in AIME of 5,729. The corresponding AIMEs for the low, medium and high earners are $1,234, $2,744 and $4,343, respectively. Low earners are defined as workers with scaled earnings that average over their career to about 45 percent of the average wage; medium earners are defined as workers with scaled earnings that average over their career to about the average wage; high earners are defined as workers with scaled earnings that average over their career to about160 percent of the average wage; and maximum earners are defined as workers who earn the Social Security maximum taxable earnings base throughout their career. The PIA is determined by applying the primary benefit formula to the AIME. For a maximum-wage worker becoming eligible in 2003, the PIA is determined as follows:
Factor Average indexed monthly earnings
Example of worker with AIME of $5,729
90 percent first $606, plus $545.50
32 percent over $606 through $3,653, plus 975.04
15 percent over $3,653 311.40
Total $1,831.80 Applying this formula to the AIMEs of the four hypothetical workers results in PIAs of $746.30 for the low-wage worker, $1,229.50 for the average-wage worker, $1,623.90 for the high-wage worker and $1,831.80 for the maximum-wage worker. (For the low-wage worker, the 2003 special minimum benefit (see below) PIA of $625.60 is less than the AIME-based PIA of $746.30,and therefore is not

1-19 used to determine her benefits.) The numbers $606 and $3,653 are often referred to as “bend points” of the PIA formula. These amounts are adjusted each year by the change in average wages. After the year of initial eligibility (age 62 for retired workers), the PIA is increased each year for the increase in the Consumer Price Index (CPI). The PIAs of $746.30, $1,229.50, $1,623.90 and $1,831.80 would be in effect for January through November 2003, and will be increased by the cost-of-living adjustment (COLA) effective beginning December 2003 (see section on COLAs below). The PIA is recomputed after each year that an entitled worker has earnings that may lead to a higher benefit. Other methods for determining a PIA also exist, and PIAs based on different methods must be compared to select the highest one, which is used to determine the worker's benefits. The most common of these other methods is the one used to determine the special minimum PIA. This PIA is designed to assist workers with long-term low earnings. The monthly benefit amount payable to a disabled worker under the FRA, or to a retired worker who first receives benefits at the FRA, is the PIA rounded to the next lower dollar, if not already a multiple of $1. Auxiliary benefit amounts are also based on the worker's PIA. Table 1-12 lists major types of auxiliary benefits and the percent of the insured worker's PIA that is applicable to benefits paid at the full rate, unreduced for early election of retirement. Special minimum benefit.--The special minimum benefit is not based on the amount of a worker's average earnings, but instead on his number of years of covered employment. It is structured to provide a larger benefit than would otherwise be payable to those who worked in covered employment for many years but had low earnings. The amount of the special minimum is computed by multiplying the number of years of coverage in excess of 10 years and up to 30 years by $11.50 for monthly benefits payable in 1979, with automatic cost-of-living increases applicable to years 1979 and later. The number of years of coverage for the purpose of qualifying for a special minimum benefit equals the number obtained by dividing total creditable wages in 1937-50 by $900 (not to exceed 14), plus the number of years after 1950 and before 1991 for which the worker is credited with at least 25 percent of the annual maximum taxable earnings. For this purpose, for years after 1978, annual maximum taxable earnings are defined as the “old-law” taxable earnings base (i.e., the hypothetical earnings base that would be in effect if the ad hoc increases in the base enacted in 1977 were disregarded). In addition, for years after 1990, a year of coverage is earned if the worker is credited with at least 15 percent of the “old-law” taxable earnings base. The special minimum benefit is not subject to the delayed retirement credit provisions described earlier. Cost-of-living adjustments As a result of the Social Security Amendments of 1972, monthly cash benefits are automatically adjusted for inflation each year to maintain the purchasing power of benefits over time. Prior to the 1972 amendments, monthly cash benefits were increased on an ad hoc basis 10 times. Automatic annual cost-of-living adjustments (COLAs) have been provided since 1975, except during
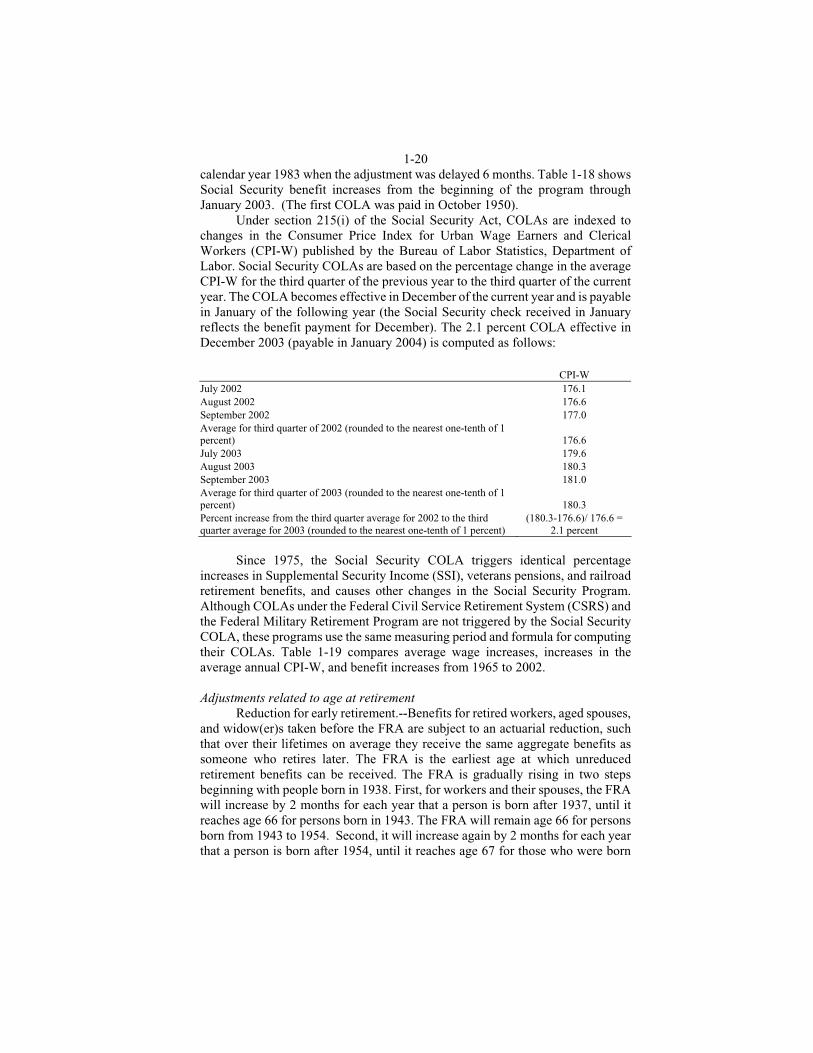
1-20 calendar year 1983 when the adjustment was delayed 6 months. Table 1-18 shows Social Security benefit increases from the beginning of the program through January 2003. (The first COLA was paid in October 1950). Under section 215(i) of the Social Security Act, COLAs are indexed to changes in the Consumer Price Index for Urban Wage Earners and Clerical Workers (CPI-W) published by the Bureau of Labor Statistics, Department of Labor. Social Security COLAs are based on the percentage change in the average CPI-W for the third quarter of the previous year to the third quarter of the current year. The COLA becomes effective in December of the current year and is payable in January of the following year (the Social Security check received in January reflects the benefit payment for December). The 2.1 percent COLA effective in December 2003 (payable in January 2004) is computed as follows:
CPI-W July 2002 176.1 August 2002 176.6 September 2002 177.0 Average for third quarter of 2002 (rounded to the nearest one-tenth of 1 percent) 176.6 July 2003 179.6 August 2003 180.3 September 2003 181.0 Average for third quarter of 2003 (rounded to the nearest one-tenth of 1 percent) 180.3 Percent increase from the third quarter average for 2002 to the third quarter average for 2003 (rounded to the nearest one-tenth of 1 percent)
(180.3-176.6)/ 176.6 = 2.1 percent
Since 1975, the Social Security COLA triggers identical percentage increases in Supplemental Security Income (SSI), veterans pensions, and railroad retirement benefits, and causes other changes in the Social Security Program. Although COLAs under the Federal Civil Service Retirement System (CSRS) and the Federal Military Retirement Program are not triggered by the Social Security COLA, these programs use the same measuring period and formula for computing their COLAs. Table 1-19 compares average wage increases, increases in the average annual CPI-W, and benefit increases from 1965 to 2002. Adjustments related to age at retirement Reduction for early retirement.--Benefits for retired workers, aged spouses, and widow(er)s taken before the FRA are subject to an actuarial reduction, such that over their lifetimes on average they receive the same aggregate benefits as someone who retires later. The FRA is the earliest age at which unreduced retirement benefits can be received. The FRA is gradually rising in two steps beginning with people born in 1938. First, for workers and their spouses, the FRA will increase by 2 months for each year that a person is born after 1937, until it reaches age 66 for persons born in 1943. The FRA will remain age 66 for persons born from 1943 to 1954. Second, it will increase again by 2 months for each year that a person is born after 1954, until it reaches age 67 for those who were born
1-21 after 1959. For widow(er)s, the increase to age 67 will be phased in similarly, but will begin for persons born after 1935. Early retirement still will be available, but benefits will be lower. The actuarial reduction on retirement benefits at age 62 ultimately will be 30 percent, instead of the present 20 percent. Delayed retirement credits.--Benefits of workers who choose to retire after their FRA are increased by delayed retirement credits, as are the benefits payable to their widow(er)s. The delayed retirement credit was 1 percent per year for workers who attained age 65 before 1982, and 3 percent per year for workers who attained age 65 between 1982 and 1989. Starting in 1990, the delayed retirement credit has been increasing by one-half of 1 percent every other year until it reaches 8 percent for workers reaching age 65 after 2007. Table 1-20 shows the schedule of increases in the FRA and adjustments related to a worker's age at the time he elects to receive benefits. Table 1-14 shows the percentage of workers electing to receive retirement benefits at various ages since the beginning of the Social Security Program. The data illustrate a trend toward early retirement in the 1960-85 period. Since that time, the trend has generally leveled out. For the past two decades, the average age (combined average for men and women) at which workers elect retirement benefits has hovered around the current average age of 63.6. Recently, the average age at which women elect to receive retirement benefits has turned upward. Table 1-13 shows the number and percentage of retired workers electing reduced benefits since they first became available (totals for men and women are shown separately). Adjustments for multiple beneficiaries Maximum family benefit.--A maximum family benefit is payable based on a worker's PIA. For benefits payable on the earnings records of retired and deceased workers, the maximum varies from 150 to 188 percent of the PIA. The family maximum cannot be exceeded regardless of the number of recipients entitled on that earnings record. The family maximum is computed by adding fixed percentages of dollar amounts that are part of the PIA. For the family of a worker who turns 62 or dies in 2003 before attaining age 62, the total amount of benefits payable is limited to:
150 percent of the first $774 of PIA; plus 272 percent of PIA over $774 through $1,118; plus 134 percent of PIA over $1,118 through $1,458; plus 175 percent of PIA over $1,458.
The dollar amounts in this benefit formula (i.e., the “bend points”) are indexed to average wage growth as in the primary benefit formula. Whenever the total of the individual monthly benefits payable to all recipients entitled on one earnings record exceeds the maximum, each dependent's or survivor's benefit is reduced in equal proportion to bring the total within the maximum. In computing the maximum family benefit, any benefit payable to a divorced spouse or to a surviving divorced spouse is not included.

1-22 For the family of a worker who is entitled to disability benefits, the maximum family benefit is the smaller of 85 percent of the worker's AIME, or 150 percent of the worker's PIA. However, in no case can the benefit be less than 100 percent of the worker's PIA. Adjustments related to earnings and other benefits Earnings limit.--The earnings limit is a provision in the law that reduces benefits for nondisabled recipients under the FRA who earn income from work in excess of a certain sum (the “exempt” amount). The earnings limit was part of the original plan that led to Social Security. The 1935 report of the Committee on Economic Security appointed by President Franklin D. Roosevelt recommended that no benefits be paid before a person had “retired from gainful employment.” Initially, the Social Security Act provided that benefits would not be paid for any month in which the individual had received “wages with respect to regular employment.” The earnings limit has been changed many times over the years. Effective in 2000, it no longer applies to individuals when they attain the FRA. For recipients below the FRA, the law provides that recipients who will not attain the FRA in that year may earn up to $11,640 (in 2004) in annual wages or self-employment income without having their benefits affected. For earnings above these amounts, recipients lose $1 of benefits for each $2 of excess earnings. There is a different reduction factor and exempt amount in the year recipients attain the FRA. In 2004, these individuals can earn up to $31,080 a year in the months before they attain the FRA. For earnings above these amounts, they lose $1 in benefits for each $3 of excess earnings. The exempt amounts rise each year at the same rate as average wages in the economy. The test does not apply to recipients at the FRA or older, or to those who are disabled (who are subject to separate limits on earnings known as substantial gainful activity or SGA). In December 2001, 136,788 recipients had all of their benefits withheld because of the earnings limit. Retired workers whose benefits are not paid due to the earnings limit for one or more months are compensated through future increases in their benefit amount because their actuarial reduction factor is lowered. Example of effect of the earnings limit: John-age 63 with $8,000 in annual benefits before the earnings limit is applied:
Earnings in 2004 ......................................................... $12,640 Exempt amount for under FRA..................................... 11,640 Excess over exempt amount.......................................... 1,000
Benefit reduction = 50 percent of excess ...................... 500 Benefits John will receive in 2004 ................................ 7,500
The earnings limit does not apply to pensions, rents, dividends, interest, and other types of “unearned” income. These forms of income always have been exempted in order to encourage savings for retirement to supplement Social Security.
1-23 Of 10 million recipients entitled to retired worker benefits who were under the age of 70 in 2000, about 3 million had earnings from work. Table 1-23 shows the distribution of the earnings of these workers. Dual entitlement.--An individual may be entitled to benefits both as a worker, based on his or her own earnings, and also as a dependent (spouse or widow(er)) of another worker. In this case, the individual does not collect the full amount of both benefits. The amount of the benefit payable as a spouse or widow(er) is offset dollar for dollar by the amount of any benefit the individual is entitled to as a worker. In other words, workers first receive the benefit based on their work record. A dependent benefit is only payable if it is higher than the benefit based on the spouse’s own work. The dependent benefit equals the difference between the full spouse benefit and the benefit based on the spouse’s own work. Government pension offset.--Social Security benefits payable to spouses of retired, disabled, or deceased workers are generally reduced to take account of any public pension the spouse receives as a result of work in a government job (Federal, State, or local) not covered by Social Security. The amount of the reduction is equal to two-thirds of the government pension. This provision is intended to place spouses who worked in jobs not covered by Social Security in a position similar to other workers by applying the equivalent of the Social Security “dual entitlement” rule, which imposes a dollar-for-dollar offset of spouses' benefits (discussed above). Two-thirds of the government pension represents an approximation of the Social Security worker's benefit that would be subtracted from any Social Security spousal benefit. The offset does not apply to workers whose government job is covered by Social Security on the last day of the person's employment. Generally, Federal workers hired before 1984 are part of the Civil Service Retirement System (CSRS) and are not covered by Social Security. Federal workers hired after 1983 are covered by the Federal Employee's Retirement System Act of 1986 (FERS), which includes coverage by Social Security. Employees covered by the CSRS were given opportunities in 1987 and 1998 to join FERS and thereby obtain Social Security coverage. Workers who switched from CSRS to FERS must have at least 5 years of FERS coverage to be exempt from the government pension offset. Windfall elimination provision.--The Social Security Amendments of 1983 included a provision known as the windfall elimination provision. Under this provision, the benefits of workers who also have pensions from work that was not covered by Social Security are calculated using a different formula designed to equalize the rate at which Social Security replaces their career earnings that were covered by Social Security with those of workers who had all their work covered by Social Security. Social Security’s benefit formula is designed to help keep people out of poverty by replacing more of low-wage worker’s career earnings than higher-wage workers. However, if a job is not covered by Social Security, the formula records “zero” earnings for that year. If a person had many years of “zero” earnings averaged into the benefit formula, they would appear to have low earnings during
1-24 their work career when that was not the case. Before the law was changed, workers who were employed for only a portion of their careers in jobs covered by Social Security received an unintended “windfall” because their benefits replaced more of their pre-retirement wages compared to identical workers who were covered by Social Security their entire careers. This happened because many years of “zero” earnings were recorded for the jobs not covered under Social Security, making the public employee appear to have low lifetime earnings. The windfall benefit formula is intended to remove this unintentional advantage for these workers. It does so by substituting 40 percent for the 90 percent factor in the first bracket of the benefit formula (see discussion in earlier section on “Benefit Computation”). The resulting reduction in the worker's Social Security benefit is limited to one-half the amount of the non-covered pension. The new law was phased in over a 5-year period and affects those first eligible for both Social Security benefits and non-covered pensions after 1985. Workers who have 30 years or more of substantial Social Security covered earnings are fully exempt from this provision. For workers who have 21-29 years of substantial covered earnings, the percentage in the first bracket in the formula increases by 5 percentage points for each year over 20, as shown in Table 1-21. Offset for other public disability benefits.--When a worker receiving Social Security disability benefits also qualifies for other disability benefits that are provided by Federal, State or local governments or worker's compensation, any Social Security benefits payable to the worker and his family are reduced by the amount, if any, that the total monthly benefits payable under the two or more programs exceed 80 percent of average current earnings before the worker became disabled. Needs-tested benefits, Veterans Administration disability benefits, and benefits based on public employment covered by Social Security are not subject to the reduction. A worker's average current earnings for this purpose are the largest of: (1) the average monthly earnings used for computing Social Security benefits; (2) the average monthly earnings in employment or self-employment covered by Social Security during the 5 consecutive years of highest covered earnings after 1950; or (3) the average monthly earnings for the calendar year of highest covered earnings during the year disability began and the preceding 5 years (based on total earnings, not limited to maximum taxable earnings). The combined payments after the reduction are never less than the total amount of the DI benefits payable before the reduction. In addition, the Social Security benefit after the reduction is increased by the full amount of the cost-of-living increase as applied to the unreduced benefit. Every 3 years the original amount of benefits subject to reduction is redetermined to reflect changes in average wage levels. If increases in average national wages would result in a higher benefit than that payable based on the original computation, the benefit is increased effective in January of the redetermination year. The reduction begins in the month during which concurrent entitlement begins under a Federal or State law. However, the offset will not be made if the State workers' compensation law provides for an offset against Social Security disability benefits and was in effect as of February 18, 1981.
1-25 Suspension of benefits to prisoners In 1980, legislation was enacted barring payment of disability benefits to prisoners who committed felonies (Public Law 96-473). In 1983, the prohibition was broadened to include retirement and survivor benefits (Public Law 98-21); and in 1994, payment of benefits was barred to those in public institutions who committed serious crimes, but who were found incompetent to stand trial, or not guilty by reason of insanity (Public Law 103-387). Only benefits to the prisoner are barred; benefits to a prisoner's eligible spouse and children are payable. The Ticket to Work and Work Incentives Improvement Act of 1999 (Public Law 106-170) further revised the bar on OASDI benefits to include prisoners who are convicted of a criminal offense and are confined (for more than 30 days) to (1) a penal institution; (2) a public institution if found guilty but insane; or (3) a public institution upon completion of a prison term for a sex offense, pursuant to a court finding that they remain a danger to others. It also provided for incentive payments of up to $400 to State and local institutions for each Social Security beneficiary found ineligible because of their incarceration.
TAXATION OF BENEFITS Beneficiaries with income (defined as adjusted gross income plus tax-exempt bond interest plus one-half of Social Security benefits) above certain thresholds are required to include a portion of their Social Security benefits (and railroad retirement tier 1 benefits) in their Federally taxable income. The Social Security Amendments of 1983 required beneficiaries with income of more than $25,000 if single, and $32,000 if married filing jointly, to include up to 50 percent of their benefits in their taxable income, beginning in 1984. Revenues from this provision are credited to the OASDI Trust Funds. The Omnibus Budget Reconciliation Act of 1993 required beneficiaries with incomes of more than $34,000 if single, and $44,000 if married filing jointly, to include up to 85 percent of their benefits in their taxable income, beginning in 1994. Revenues from this provision are credited to the Medicare Hospital Insurance (HI) Trust Fund. (There is no separate threshold for married persons who live together and file separately.) These income thresholds are specified in the law. By design, they are not indexed to wage growth. Thus over time, an increasing number of individuals will be subject to the income tax on Social Security benefits. When the first tier of benefit taxation was enacted in 1983, the Social Security Trust Funds faced almost immediate insolvency. Fixed thresholds were established to provide the program with a growing source of revenue from the income tax on benefits to help shore up the Social Security Trust Funds. When taxes on benefits were first imposed, 8 percent of recipients were affected. As shown in Table 1-25, the Congressional Budget Office (CBO) estimates that under 2003 law (simulated using 2000 population and incomes), 39 percent of recipients had some benefits taxed . Table 1-26 shows amounts credited to the trust funds from the taxation of benefits. Table 1-27 provides a worksheet for determining the taxable portion of Social Security benefits. Examples of the effects of the taxation of benefits are shown below:

1-26 Single Single Married Married Married
Total income (including Social Security)
$31,000 $35,000 $38,000 $50,000 $80,000
Social Security benefits
12,000 7,000 12,000 12,000 18,000
Amount of taxable benefits
0 3,250 0 6,000 15,300
Percent of benefit taxable
0 46 0 50 85
Income tax liability on all benefits taxable
0 488 0 900 2,750
DISABILITY DETERMINATION AND THE CLAIMS PROCESS
The Claims Process The Social Security claims process is a complex multilayered structure that is inextricably linked with the disability determination process. Application for disability benefits is made at the Social Security field office where the applicant is interviewed and the sources of medical evidence are recorded. After determining whether the applicant meets the insured status requirements, the SSA field office sends the case to the State Disability Determination Service (DDS), which makes the initial determination of disability. If an applicant or beneficiary is dissatisfied with an initial denial or termination of disability benefits by the DDS, she can request a reconsideration within 60 days of receipt of the notice of denial. The reconsideration on the disability claim is carried out by DDS by personnel other than those who made the initial determination. An applicant denied benefits at the reconsideration stage may request a hearing before an administrative law judge (ALJ) in SSA's Office of Hearings and Appeals, provided he files a request for a hearing within 60 days of receipt of the notice of denial. If the claim is denied by the ALJ, the applicant has 60 days to request review by the Appeals Council. The Appeals Council is a 24-member body located in the Office of Hearings and Appeals. The Appeals Council may also, on its own motion, review a decision within 60 days of the ALJ's decision. The 1980 disability amendments required the Appeals Council to review a percentage of ALJ hearing decisions. The Appeals Council may affirm, modify, or reverse the decision of the ALJ, or may remand it to the ALJ for further development. The applicant is notified in writing of the final action of the Appeals Council and his right to obtain further review by commencing a civil action within 60 days in a U.S. District Court. Under current law, as amended by the 1984 Disability Benefits Reform Act, disability insurance (DI) beneficiaries whose benefits have been terminated because of recovery or improvement in the medical condition that was the basis for the disability have the opportunity to receive a hearing at the reconsideration stage and can elect to continue to receive disability and Medicare benefits through the ALJ hearing stage of the appeals process, subject to repayment if the individual is
1-27 ultimately found not disabled. Chart 1-2 shows the number of cases allowed and appealed at various decision levels for claim applications and continuing disability reviews (CDRs) processed by State agencies. Table 1-43 presents information for fiscal years 1980-2002 on the number of cases that were reviewed and reversed at the ALJ level. Table 1-44 presents information on the number of CDRs that were conducted in fiscal years 1977-2001 on DI cases. Due to an unprecedented increase in initial claims, the number of CDRs processed declined sharply in the early 1990s. National implementation of a new review process in 1993 has enabled the Social Security Administration to increase the number of CDRs significantly. State agencies, which are 100 percent Federally funded, generally make disability decisions. These agencies agree to make such determinations, and in doing so to substantially comply with the regulations of the Commissioner that specify performance standards, administrative requirements, and procedures to be followed in performing the disability determination function. The law authorizes the Commissioner to terminate State administration and assume responsibility for making disability determinations when a State DDS is substantially failing to make determinations consistent with regulations. The law also allows for termination by the State. Claims are determined on a sequential basis. The first step is to determine whether the individual is engaging in SGA. Under current regulations, in most cases if a nonblind person is earning more than $810 a month (net of impairment-related work expenses) in 2004, he will be considered to be engaging in SGA. In the case of blind individuals, SGA is $1,350 a month in 2004. If it is determined that the individual is engaging in SGA, a decision is made that she is not disabled without considering medical factors. If an individual is found not to be engaging in SGA, the severity and duration of the impairment are explored. If the impairment is determined to be “not severe” (i.e., it does not significantly limit the individual's capacity to perform basic work activities), the individual's disability claim is denied. If the impairment is “severe,” a determination is made as to whether the impairment “meets” or “equals” the medical listings published in regulations by SSA,4 and whether it will last for 12 months. If the impairment neither “meets” nor “equals” the listing (which would result in an allowance), but meets the 12-month duration rule, the individual's residual functional capacity (what an individual still can do despite his limitations) and the physical and mental demands of past relevant work must be evaluated. If the impairment does not prevent the individual from meeting the demands of past relevant work, benefits are denied. If the impairment does, then it must be determined whether the impairment prevents other work.
4 The listing of impairments contains over 100 examples of medical conditions that are considered significant enough to prevent an individual from engaging in SGA. Each listing describes a degree of severity such that an individual who is not working, and has such an impairment, is considered unable to work by reason of the medical impairment. The listing describes specific medically acceptable clinical and laboratory findings and signs which establish the severity of the impairments. An impairment or combination of impairments is said to “equal the listings” if the medical findings for the impairment are at least equivalent in severity and duration to the findings of a listed impairment.
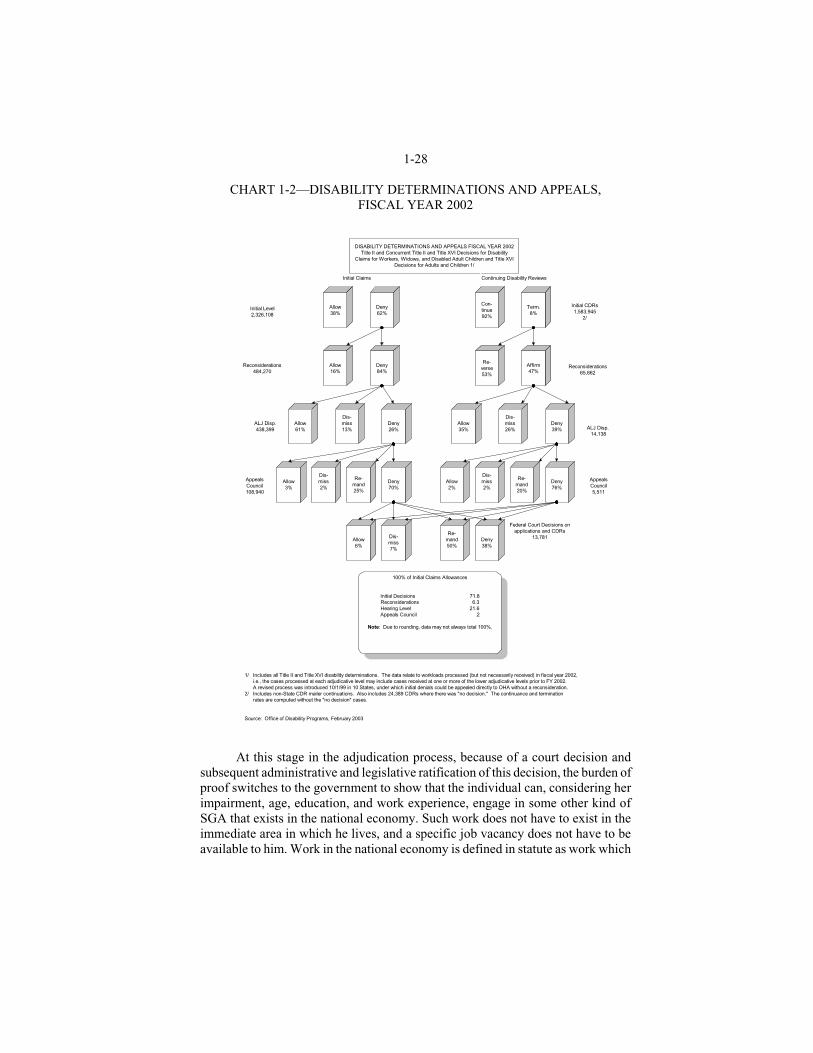
1-28
CHART 1-2—DISABILITY DETERMINATIONS AND APPEALS, FISCAL YEAR 2002
At this stage in the adjudication process, because of a court decision and subsequent administrative and legislative ratification of this decision, the burden of proof switches to the government to show that the individual can, considering her impairment, age, education, and work experience, engage in some other kind of SGA that exists in the national economy. Such work does not have to exist in the immediate area in which he lives, and a specific job vacancy does not have to be available to him. Work in the national economy is defined in statute as work which
DISABILITY DETERMINATIONS AND APPEALS FISCAL YEAR 2002Title II and Concurrent Title II and Title XVI Decisions for Disability
Claims for Workers, Widows, and Disabled Adult Children and Title XVIDecisions for Adults and Children 1/
1/ Includes all Title II and Title XVI disability determinations. The data relate to workloads processed (but not necessarily received) in fiscal year 2002, i.e., the cases processed at each adjudicative level may include cases received at one or more of the lower adjudicative levels prior to FY 2002. A revised process was introduced 10/1/99 in 10 States, under which initial denials could be appealed directly to OHA without a reconsideration.2/ Includes non-State CDR mailer continuations. Also includes 24,389 CDRs where there was "no decision." The continuance and termination rates are computed without the "no decision" cases.
Source: Office of Disability Programs, February 2003
100% of Initial Claims Allowances
Initial Decisions 71.8Reconsiderations 6.3Hearing Level 21.6Appeals Council .2
Note: Due to rounding, data may not always total 100%.
Deny62%
Allow16%
Deny84%
Allow61%
Deny26%
Allow3%
Dis-miss2%
Re-mand25%
Con-tinue92%
Term.8%
Re-verse53%
Affirm47%
Allow35%
Dis-miss26%
Deny39%
Re-mand20%
Dis-miss2%
Allow2%
Dis-miss7%
Re-mand50%
Deny38%
Allow38%
Initial Level2,326,108
Initial CDRs1,583,945
2/
Reconsiderations65,662
Reconsiderations484,270
ALJ Disp.438,399
AppealsCouncil108,940
AppealsCouncil5,511
ALJ Disp. 14,138
Federal Court Decisions onapplications and CDRs
13,781
Dis-miss13%
Allow6%
Deny70%
Deny76%
Initial Claims Continuing Disability Reviews
1-29 exists in significant numbers either in the region where such individual lives or in several regions of the country. SSA has developed a vocational “grid” designed to reduce the subjectivity and lack of uniformity in applying the vocational factor. Through a formula, the grid regulations relate certain worker characteristics such as age, education, and past work experience to the individual's residual functional capacity to perform work-related physical and mental activities. If the applicant has a particular level of residual work capability--characterized by the terms sedentary, light, medium, heavy and very heavy--an automatic finding of “disabled” or “not disabled” is required when such capability is applied to various combinations of age, education, and work experience. The Commissioner must review 50 percent of the disability allowances and a sufficient number of other determinations to ensure a high degree of accuracy. The Commissioner may also, on her own initiative, review any determination by a DDS. The 1980 disability amendments required that, at least once every 3 years, the Social Security Administration reexamine every individual on the rolls who is determined to be non-permanently disabled. Where there is a finding of permanent disability, the Commissioner may reexamine the individual at such times as are determined to be appropriate. These reviews are in addition to the administrative eligibility review procedures existing before the 1980 amendments. Effective in 2001, these reviews cannot begin while an individual is “using a ticket” as defined by the Commissioner (see “Changes in the 106th Congress” below). The 1984 Disability Benefits Reform Act required that in continuing eligibility review cases, benefits may be terminated only if the Commissioner finds that there has been medical improvement in the person's condition and that the individual is now able to engage in SGA. Individuals are not considered to be disabled unless they furnish such medical and other evidence as the Commissioner may require. The Commissioner will generally reimburse physicians or hospitals for supplying medical evidence in support of claims for DI benefits. The Commissioner also pays for medical examinations that are needed to adjudicate the claim. Representation and attorneys' fees.--Claimants may appoint an attorney or any other qualified person to serve as their representative in proceedings before SSA. The representative may submit evidence, make statements about facts and law, and make any request or give any notice concerning the proceedings. The representative may not sign an application on behalf of a claimant for rights or benefits, or testify on the claimant's behalf in any administrative proceeding. The amount of any fee that an attorney or other person may charge and collect from the claimant for services performed as a representative must be authorized by SSA. SSA has two methods of authorizing fees for representation: fee petition and fee agreement. Under the fee petition process, representatives must promptly file a fee petition with SSA after completing their services on a claim and send a copy of the fee petition to the claimant. SSA determines the amount of the fee authorized under the fee petition process based on several factors, including, but not limited to, the
1-30 extent and type of services the representative performed, the complexity of the case, and the amount of time the representative spent on the case. Under the fee agreement process, the claimant and representative must file a written agreement with SSA before the date SSA makes a favorable determination or decision on the claim. SSA usually will approve the fee agreement if: (1) it is signed by both the claimant and representative; (2) the fee specified in the agreement does not exceed the lesser of 25 percent of the past-due benefits or $5,300 for fee agreements approved on or after February 1, 2002 (for fee agreements approved before that date, the maximum dollar limit was $4,000); (3) SSA's determination or decision in the claim is fully or partially favorable; and (4) the claim results in past-due benefits. If the claimant is represented by an attorney and the claim is for Social Security benefits, the SSA may withhold the authorized representation fee out of past-due benefits and pay it directly to the attorney. SSA assumes no responsibility for the payment of any fees if the representative is not an attorney or the claim is for SSI benefits. The Ticket to Work and Work Incentives Improvement Act of 1999 (Public Law 106-170, signed December 17, 1999) requires the Commissioner to impose an assessment on the attorney's fee to cover SSA's costs of determining and certifying these fees. Effective January 31, 2000, the assessment is set at 6.3 percent of the attorney's fee. For years after 2000, the percentage rate will be set at a level determined by the Commissioner to achieve full recovery of the costs of calculating, withholding, and paying fees from the claimant's past-due benefits, but not in excess of 6.3 percent. The attorney is prohibited from recovering this assessment from the claimant. Work incentives The law provides a 45-month period for disabled beneficiaries to test their ability to work without losing their entitlement to all benefits. The period consists of: (1) a “trial work period” (TWP), which allows disabled beneficiaries to work for up to 9 months (within any 60-month period5 with no effect on their disability or Medicare benefits; followed by (2) a 36-month “extended period of eligibility,” of which during the last 33 months cash disability benefits are suspended for any month in which the individual is engaged in SGA. Medicare coverage continues for 102 months once work activity begins (the duration of the trial work period and the extended period of eligibility, plus an additional 54 months) as long as the individual continues to remain medically disabled. When Medicare entitlement ends because of the individual's work activity, if he is still medically disabled, he may purchase Medicare protection. If beneficiaries medically recover to the extent that they no longer meet the definition of disability, both disability and Medicare benefits are terminated after 3 months, regardless of the status of the TWP or extended period of eligibility. However, a person who contests this determination may elect to continue to receive
5 Only one TWP is allowed in any one period of disability. By regulation, earnings of more than $580 a month in 2004 constitute “trial work.”
1-31 disability benefits (subject to repayment) and Medicare while the appeal is being reviewed. Return to work and rehabilitation Public Law 106-170 created a Ticket to Work and Self-Sufficiency Program to help disability beneficiaries access a broader pool of vocational rehabilitation providers to enable them to achieve self-sufficiency. Under this legislation, the Commissioner of Social Security provides tickets to work to disability beneficiaries that can be used as vouchers to obtain employment services, case management, vocational rehabilitation, and support services under an individual work plan from the provider of their choice, including the State vocational rehabilitation agencies. Payments to the providers entering agreements with SSA are based on employment outcomes and long-term results or on a combination of milestones and outcomes, and come from a portion of the benefits forgone by beneficiaries when they return to work. The program is being implemented in selected sites beginning 1 year after enactment, with services available in every State within 4 years of enactment. Until the Ticket to Work and Self-Sufficiency Program is fully implemented and for States that elect to not participate in this program, provisions remain in effect that allow for reimbursement from the DI Trust Funds to the State vocational rehabilitation agencies for rehabilitation services that result in the beneficiary's performance of SGA for a continuous period of at least 9 months. Such a 9-month period could begin while the individual is under a vocational rehabilitation program and may coincide with the TWP or the individual's waiting period for benefits. The services must be performed under a State plan for vocational rehabilitation services under title I of the Vocational Rehabilitation Act. In 1996, SSA established by regulations an Alternative Rehabilitation Provider Program which allows SSA to refer beneficiaries to private vocational rehabilitation providers and public non-State vocational rehabilitation providers if SSA does not receive notification within a specified period that the State agency has accepted a beneficiary for services or extended evaluation. In addition, beneficiaries participating in the Ticket to Work and Self-Sufficiency Program will not be subject to unscheduled CDRs triggered by their work activities. For certain former beneficiaries whose entitlement to benefits ended solely because of their earnings from work, the Ticket to Work law provides for swift reinstatement of benefits without requiring a new application. (For more information on the Ticket to Work and Self-Sufficiency Program, refer to Section 3: Supplemental Security Income.) Enrollment and applicant backlogs Over the past 20 years, the DI Program experienced a period of declining enrollment followed by a rebound in growth. The number of DI beneficiaries (disabled workers and their dependents) receiving benefits first peaked at 4.9 million in May 1978. The beneficiary population then declined sharply to 3.8 million by July 1984. Thereafter, the number of beneficiaries has risen steadily, reaching 7.2 million in December 2002 (Table 1-39).
1-32 Similarly, the number of new DI benefit awards declined from 592,000 in 1975 to approximately 297,000 in 1982. As shown in Table 1-42, awards then rose almost steadily, reaching 646,000 in 1995 before declining by 1997 to 588,000. In 2002 there were 750,000 new DI benefit awards. (The large 1992 increase is partially attributable to SSA's short-term measures for dealing with increased DI applications. Increasing the volume of applications processed resulted in increases in both awards and denials.) The incidence of disability (number of awards per 1,000 insured workers) fell from an all-time high of 7.1 in 1975 to an all-time low of 2.9 in 1982. In 2002, the rate was 5.3 percent (Table 1-42). Pending claims at DDS, hearings and appeals levels.--Until fiscal year 1991, disability claims (including initial claims, reconsiderations, hearings and appeals) remained relatively constant at about 2.5 million cases per year. In fiscal year 1991, claims began to increase significantly each year and reached 3.7 million in fiscal year 1996. In fiscal year 2001, there were over 3.4 million disability claims. During the period of fiscal years 1988-94, the number of cases pending at the State DDS also increased as the ability to hire and train DDS staff did not keep pace with the increases in claims. However, in fiscal year 1995 pending cases were significantly reduced to 590,000 due largely to increased productivity in the State DDSs and the additional budgetary resources directed to disability case processing which enabled an aggressive hiring effort in the States. In fiscal year 1996, pending cases again increased significantly. The major cause of this increase was that Congress increased SSA's workload by requiring additional drug addiction and alcoholism reviews. These reviews now have been completed, but pending cases have risen again due to workloads mandated by other welfare reform legislation (Table 1-45).
SOCIAL SECURITY'S TREATMENT IN THE FEDERAL BUDGET
SOCIAL SECURITY’S OFF-BUDGET STATUS Under an administrative action by President Johnson, Social Security and other Federal programs that operate through trust funds were counted officially in the budget beginning in fiscal year 1969. At the time, the Old-Age, Survivors, and Disability Insurance (OASDI) Trust Funds were running a surplus while the remainder of the Federal budget was running a deficit that reflected the increasing costs of the war in Vietnam. At the time, Congress did not have its own formal budget-making process with statutory rules, restrictions on taxes and spending, and its own budget estimating office. In 1974, with passage of the Congressional Budget and Impoundment Control Act (Public Law 93-344), Congress adopted procedures for setting budget goals through passage of annual budget resolutions. Like the budgets prepared by the President, these resolutions were to reflect a “unified” budget that included trust fund programs such as Social Security. Financial problems confronting Social Security and concern over its growing costs led to enactment of a number of benefit changes in 1977, 1980, 1981, and 1983. Measures were enacted in 1983, 1985, and 1987 making the program a more

1-33 distinct part of the budget and permitting floor objections (points of order) to be raised against budget bills containing Social Security changes. Later in the 1980s, when Social Security surpluses emerged, critics argued that the program was masking the size of Federal budget deficits. In response, Congress in 1990 excluded Social Security from calculations of the budget and largely exempted it from procedures for controlling spending (Omnibus Budget Reconciliation Act of 1990, Public Law 101-508). By these actions, however, Congress excluded Social Security from procedural constraints designed to discourage measures that would increase deficits. Concerned that this change would encourage Social Security spending increases and tax cuts that could weaken Social Security's financial condition, Congress also included provisions permitting floor objections to be raised against bills that would erode the balances of the Social Security Trust Funds.
BUDGETARY TREATMENT OF ADMINISTRATIVE EXPENSES The costs of administering the Social Security Retirement and Disability Programs are financed from the Social Security Trust Funds, subject to annual appropriations. Traditionally these costs are low, now comprising less than 1 percent of annual benefit payments. During fiscal year 2002, they amounted to $4.1 billion (Table 1-38). These trust-fund-financed administrative funds comprised about 46 percent of the Social Security Administration's fiscal year 2002 administrative budget. The agency received another 16 percent from the Medicare Trust Funds, as well as 37 percent from general revenues for administration of the Supplemental Security Income program. The SSA's total fiscal year 2002 administrative budget was $7.6 billion. Social Security's outlays and receipts were removed from the budget in three separate actions by Congress. However, the exemption from the discretionary caps was less clearly stated when the Budget Enforcement Act of 1990 was passed. Prior to discretionary caps, appropriations acts limited expenditures for administration through a “limitation on administrative expenses.” When confusion arose over the intended treatment of administrative costs and the discretionary caps, both OMB and CBO eventually agreed that those costs would be subject to the discretionary caps, even though the program was an entitlement with its administration paid from Social Security tax receipts. In both the President's budget and appropriations acts, the limitation on administrative expenses is used to prevent the Social Security Administration from an open ended administrative budget. In the Senior Citizens' Right to Work Act of 1996, a separate exception to the discretionary caps was made through FY 2002 for CDR funding. Concerned that such reviews were lagging, Congress provided for additional spending for CDRs above a base amount that would not be constrained by discretionary caps.

1-34 HOUSE AND SENATE BUDGET PROCEDURES TO PROTECT SOCIAL
SECURITY BALANCES Under the budget rules that existed before 1991, Social Security was included in calculations of the budget deficit. This rule had the effect of potentially thwarting attempts to expand Social Security benefits or cut taxes if such attempts were not accompanied by measures to offset the cost or revenue loss. Floor objections could be raised against such actions if they violated the budget totals or allocations. If measures that raised benefits or cut taxes were enacted, other programs were potentially threatened with sequestration because the deficit would be made larger. The old process imposed the same fiscal discipline on Social Security as applied to other programs. Because Social Security is now exempt from the budget limits (except its administrative expenses), these fiscal constraints no longer apply. In their place are rules intended to make it difficult to bring up measures for a vote that would weaken the program's financial condition. These procedural rules are sometimes referred to as the Social Security “firewall” provisions. In the House, a floor objection can be raised against a bill that proposes more than $250 million in Social Security spending increases or tax cuts over 5 years (counting the fiscal year it becomes effective and the following 4 years) unless the bill also contains offsetting changes to bring the net impact within the $250 million limit. Costs of prior legislation that fall within the 5-year period must be counted. An objection also can be raised against a measure that would increase long-range (75-year) average costs or reduce long-range revenues by at least 0.02 percent of taxable payroll. In the Senate, budget resolutions must include separate amounts for Social Security income and outgo for the first year and 5-year period covered by the resolution (i.e., separate from the budget totals). These amounts cannot cause the balances of the Social Security Trust Funds to be lower than projected under current law. Measures that would do so are subject to an objection, which can be overridden only by a vote of three-fifths of the Senate. Once the resolution is enacted, subsequent measures that on balance would cause Social Security outlay increases or revenue reductions are also subject to objection, which again can be overridden only by a three-fifths vote. The fiscal year 2000 budget cycle resulted in a new budget process, not formally written in the congressional or executive budget laws, but arising from the projections of budgetary surpluses at the time in both the OASDI off-budget account and the on-budget account. With both Congress and the President pledging not to spend any of the Social Security surplus by running an on-budget deficit, attempts were made to finance increased spending or tax reductions from the surplus in the on-budget or non Social Security surplus even if it resulted in spending over the discretionary caps or the PAY-GO rules. Commonly referred to as the Social Security lock box approach by legislators, it was designed to keep the Social Security surpluses from being spent; surpluses were instead to be used to reduce the public debt until long term Social Security (and Medicare) reforms are

1-35 enacted. In other words, the excess OASDI income was to no longer pay for other parts of government, but to be used to reduce the “publicly” held debt. While this would have strengthened the government's fiscal position by lowering its indebtedness in advance of the baby boom retirement wave, it would have not, on its own, provided the money needed to pay the rapidly rising Social Security benefit outlays starting 2018 when the current level of Social Security tax receipts falls short of benefit costs.
LEGISLATIVE HISTORY (For a description of legislative changes made in the 95th-102nd Congresses, refer to the 1996 Green Book; for changes in the 103rd Congress, see the 1998 Green Book.)
104th CONGRESS Senior Citizens' Right To Work Act of 1996 (incorporated into Public Law 104-121, the Contract With America Advancement Act of 1996): Authorizing additional CDR funds.--This legislation authorized additional administrative funding to enable the Social Security Administration to increase CDRs. Amounts spent for CDRs above the already assumed base funding levels are not subject to the discretionary spending caps through fiscal year 2002. SSA must report annually on CDR expenditures and savings to the Social Security, Supplemental Security Income, Medicaid and Medicare Programs. Alleviating the Social Security earnings limit.--The act gradually raised the earnings limit for those between FRA and 70 to $30,000 by the year 2002, phased in over 7 years as follows:
Year Prior Law Law as altered by P.L. 101-121
1996 $11,520 $12,500 1997 $11,880 $13,500 1998 $12,240 $14,500 1999 $12,720 $15,500 2000 $13,200 $17,000 2001 $13,800 $25,000 2002 $14,400 $30,000
Senior citizens between full retirement age (FRA) (age 65-67, depending on year of birth) and age 70 who earned over the given earnings limit would continue to lose $1 in benefits for every $3 earned over the new limit. After 2002, the annual exempt amounts were indexed to growth in average wages. The substantial gainful activity (SGA) amount applicable to individuals under FRA who are eligible for disability benefits on the basis of blindness was no longer linked to the earnings limit amount for those age FRA-69. As under prior law, this SGA amount

1-36 continued to be wage-indexed in the future, and was projected to rise to $14,400 by 2002. Entitling of stepchildren to child's benefits based on actual dependency on stepparent support.--Benefits were made payable to a stepchild only if it is established that the stepchild is dependent on the stepparent for at least one-half of his financial support. In addition, benefits to the stepchild are to be terminated if the stepchild's natural parent and stepparent are divorced. The dependency requirement was made effective for stepchildren who become entitled or reentitled to benefits beginning in July 1996. In cases of a subsequent divorce, benefits to stepchildren will terminate 1 month after the divorce becomes final. Stepparents are required to notify SSA of the divorce. In addition, SSA is required to notify annually those potentially affected by this provision. Removing drug addiction and alcoholism as disabling conditions.--An individual no longer is considered disabled for purposes of entitlement to cash Social Security and Supplemental Security Income disability benefits if drug addiction or alcoholism is the contributing factor material to her disability. Individuals with drug addiction or alcoholism who have another severe disabling condition (such as AIDS, cancer, cirrhosis) can qualify for benefits based on that disabling condition. If a person qualifying for benefits based on another disability also is determined to be an alcoholic or drug addict incapable of managing his benefits, a representative payee will be appointed to receive and manage the individual's checks. Recipients who are unable to manage their own benefits as a result of alcoholism or drug addiction will be referred to the appropriate State agency for substance abuse treatment services. In each of fiscal years 1997 and 1998, $50 million was authorized to fund additional drug (including alcohol) treatment programs and services. Individuals entitled to benefits before March 1996 remained eligible for benefits until January 1, 1997. Studying efficacy of providing benefit and contribution Statements to recipients.--The Commissioner of Social Security was required to conduct a 2-year pilot study, beginning in 1996, of the efficacy of providing individual benefit and contribution information to recipients of Old-Age and Survivors Insurance (OASI) benefits. Protecting the Social Security and Medicare Trust Funds.--This act codified Congress' understanding of present law that the Secretary of the Treasury and other Federal officials are not authorized to use Social Security and Medicare funds for debt management purposes. Personal Responsibility and Work Opportunity Reconciliation Act of 1996 Public Law 104-193): This act prohibited payment of Social Security benefits to any noncitizen in the United States who is not lawfully present in the United States. An exception was provided for any case in which nonpayment of a benefit would be contrary to a totalization agreement. Section 233 of the Social Security Act prohibits totalization agreements from including provisions that are contrary to current Social Security law. Section 202(y) of the Social Security Act (added by P.L. 104-208—the “Illegal
1-37 Immigration Reform and Immigrant Responsibility Act of 1996”) prohibits, without exception, payment of benefits to noncitizens in the United States if they have not been determined by the Attorney General to be lawfully present. Furthermore, it has been determined that none of the current totalization agreements include provisions that would require the payment of Social Security benefits to foreign nationals in the United States who are not lawfully present in the United States. Omnibus Consolidated Rescissions and Appropriations Act of 1996 (Public Law 104-134): Providing for mandatory electronic funds transfers.--Federal payments, including Social Security and Supplemental Security Income benefits payable beginning after July 1996 to persons with bank accounts, must be paid by electronic funds transfer (EFT). All recurring Federal payments made after January 1, 1999 will be made by EFT, except that the Secretary of the Treasury may waive the requirement under certain circumstances. Enhancing debt collection.--Provided SSA with permanent debt collection authorities, including administrative offset of other Federal benefit payments, offset of Federal salaries, reporting of delinquent debt to credit bureaus, use of private collection agencies, and assessment of late charges.
105th CONGRESS Revenue Reconciliation Act of 1997 (incorporated into Public Law 105-34): Expanding SSA records for tax collection.--This provision provides that, for an application for a Social Security number (SSN) for a person under age 18, SSA must collect the SSNs of each parent, in addition to currently required evidence of age, identity, and citizenship, and share this information with the Internal Revenue Service for administration of tax benefits based on support or residency of a child. Excluding termination payments made to insurance salesmen.--Payments made to a self-employed insurance salesman after his agreement to work for the insurance company has terminated are excluded from Social Security coverage if: he performed no additional work for the company in that taxable year; he entered into a covenant not to compete with the company; and the amount of the payment was based entirely on the policies the salesman sold during the last year of the agreement which remain in force and not on his length of service or overall earnings from the company.
106th CONGRESS Foster Care Independence Act of 1999 (Public Law 106-169): Enforcing benefit restrictions for prisoners.--The Commissioner is required to share (on a reimbursable basis) information obtained under agreements with institutions reporting prisoners with other Federal or Federally assisted cash, food, or medical assistance programs to ensure that other Federal, State or local benefits do not inappropriately flow to prisoners. Creating new administrative sanctions to deter abuse.--A new penalty is
1-38 added to previous penalties for nonpayment of OASDI and SSI benefits for individuals found to have lied or misrepresented facts in applying for benefits. The penalty is a period of nonpayment of 6 months for the first violation, 12 months for the second, and 24 months for the third such violation. A prior provision banning benefits for 10 years for individuals who misrepresent residence to claim benefits in two or more States is repealed. Protecting Social Security funds.--Representative payees are made liable for an OASDI or SSI overpayment caused by a payment made to a beneficiary who has died. SSA must establish an overpayment control record under the representative payee's SSN. The legislation also bars from the OASDI and SSI programs representatives and health care providers found to have helped commit fraud; the bar from participation would last for 5 years, 10 years, and permanently for the first, second and third such finding, respectively. Adding resources and legislative tools to combat fraud.--The Commissioner is required to consult with the Inspector General of SSA and the Attorney General regarding additional measures to combat fraud in Social Security's Disability programs, as well as methods for improving the processing of reported changes to beneficiaries' income. In addition, SSA must itemize funds needed to combat fraud in its annual budget. The legislation also provides for readier data exchanges with State and Federal agencies to ensure proper benefit payment. Ticket to Work and Work Incentives Improvement Act of 1999 (Public Law 106-170): Creating new avenues to work and self-sufficiency.--Creates a new “Ticket to Work” Program, to be implemented in all States within 4 years, under which the Social Security Administration would provide Social Security Disability Insurance (SSDI) and SSI disability beneficiaries with tickets they can use to purchase services to help them enter the work force. Services would be tailored to individual needs and choices, with providers paid for results when beneficiaries return to the work force or achieve certain milestones. To protect those who attempt to work but must return to benefits, certain rules are eased for requalifying for benefits for those in need due to failing health. Expanding availability of health care services for the disabled.--For SSDI beneficiaries who go to work, the legislation extends Medicare coverage for an additional 4.5 year period beyond current law (for a total of 8.5 years). This provision also expands State options to provide Medicaid to workers with disabilities, provide grants to States to support workers with disabilities, create State demonstration programs to provide medical aid to workers with potentially severe disabilities, and hold down insurance costs for certain disabled workers. Funding new studies and demonstration projects.--SSDI demonstration project authority is renewed for 5 years; SSA must conduct a project to study the incentives created by gradually reducing SSDI benefits $1 for every $2 in earnings over a set level. Several GAO and SSA reports are to be conducted on current work incentives for individuals with disabilities and on ways to improve such incentives. Ensuring changes are paid for.--The Ticket to Work law made a number of

1-39 technical changes to Social Security to ensure that any new benefits are fully paid for, including: awarding certain prisons reporting inmate lists up to $400 per inmate found to be collecting Social Security benefits (preventing fraud and benefit overpayments); restricting Social Security benefits for certain sex offenders and prisoners jailed for under 1 year; allowing clergy members a 2 year “open season” to opt into Social Security; assessing a charge to cover administrative costs created by attorneys who have SSA process their fees; and clarifying rules related to the removal of drug addiction and alcoholism as disabling conditions under the SSDI and SSI Programs. Senior Citizens Freedom To Work Act (Public Law 106-182): Eliminates the earnings limit as of the month the recipient attains the FRA, effective in 2000. In the year a recipient attains the FRA, the 1 for 3 reduction rate and the exempt amounts put in place by Public Law 104-121 will continue to apply.
107th CONGRESS
Department of Defense Appropriations Act for FY 2002 (Public Law 107-117): Eliminates “deemed” extra wages credited to military service personnel beginning in calendar year 2002.
STATISTICAL TABLES
TAX RATES AND COVERED EARNINGS
TABLE 1-1 -- FICA AND SELF-EMPLOYMENT CONTRIBUTIONS ACT (SECA) TAX RATES AND MAXIMUM TAXABLE EARNINGS,
SELECTED YEARS 1937-2004 [In percent]
Rate paid by employee and employer Calendar year OASI
Disability insurance (DI)
OASDIHospital
insurance (HI)Total
Self-employed
rate1
Maximum taxable
earnings2 1937 1.00 NA NA NA 1.00 NA $3,000 1950 1.50 NA NA NA 3.00 NA 3,000 1960 2.75 0.25 3.00 NA 3.00 4.50 4,800 1970 2.75 0.55 4.20 0.60 4.80 6.90 7,800 1980 4.52 0.56 5.08 1.05 6.13 8.10 25,900 1990 5.60 0.60 6.20 1.45 7.65 15.30 51,300 1995 5.26 0.94 6.20 1.45 7.65 15.30 61,200 2000 5.30 0.90 6.20 1.45 7.65 15.30 76,200 2003 5.30 0.90 6.20 1.45 7.65 15.30 87,000 2004 5.30 0.90 6.20 1.45 7.65 15.30 87,900 1 Tax credits for the self-employed equaled 2.7 percent in 1984, 2.3 percent in 1985, and 2.0 percent in 1986-1989. The tax rate is not reduced for these credits. See text for explanation of change in tax treatment of the self-employed. 2OASDI; no limit on HI. NA- Not applicable. Note—Until 1991, the maximum taxable earnings for HI were the same as for OASDI. In 1991, 1992, and 1993 maximum taxable earnings were $125,000, $130,200, and $135,000 respectively, with no limit after 1993. Only 92.35 percent net self-employment earnings are taxable and half of the SECA taxes so computed is deductible for income tax purposes. Source: Congressional Research Service.
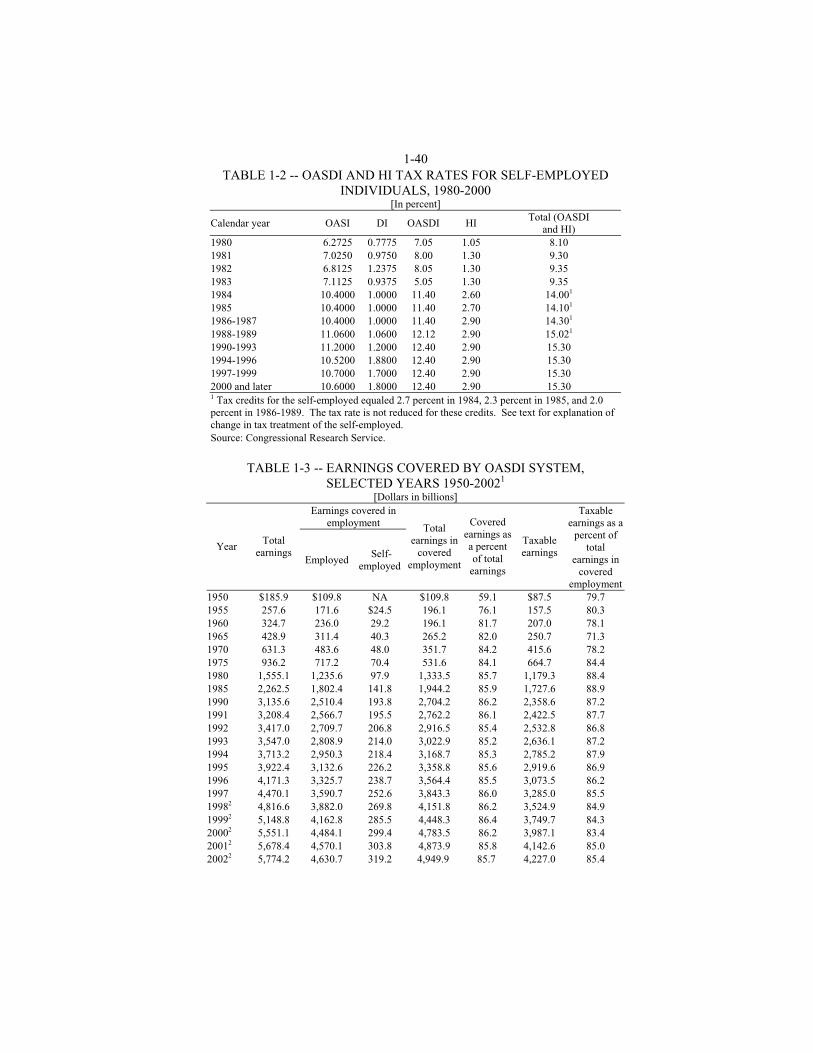
1-40 TABLE 1-2 -- OASDI AND HI TAX RATES FOR SELF-EMPLOYED
INDIVIDUALS, 1980-2000 [In percent]
Calendar year OASI DI OASDI HI Total (OASDI
and HI) 1980 6.2725 0.7775 7.05 1.05 8.10 1981 7.0250 0.9750 8.00 1.30 9.30 1982 6.8125 1.2375 8.05 1.30 9.35 1983 7.1125 0.9375 5.05 1.30 9.35 1984 10.4000 1.0000 11.40 2.60 14.001 1985 10.4000 1.0000 11.40 2.70 14.101 1986-1987 10.4000 1.0000 11.40 2.90 14.301 1988-1989 11.0600 1.0600 12.12 2.90 15.021 1990-1993 11.2000 1.2000 12.40 2.90 15.30 1994-1996 10.5200 1.8800 12.40 2.90 15.30 1997-1999 10.7000 1.7000 12.40 2.90 15.30 2000 and later 10.6000 1.8000 12.40 2.90 15.30 1 Tax credits for the self-employed equaled 2.7 percent in 1984, 2.3 percent in 1985, and 2.0 percent in 1986-1989. The tax rate is not reduced for these credits. See text for explanation of change in tax treatment of the self-employed. Source: Congressional Research Service.
TABLE 1-3 -- EARNINGS COVERED BY OASDI SYSTEM,
SELECTED YEARS 1950-20021 [Dollars in billions]
Earnings covered in employment
Year Total
earnings Employed
Self-employed
Total earnings in
covered employment
Covered earnings as a percent of total
earnings
Taxable earnings
Taxable earnings as a
percent of total
earnings in covered
employment 1950 $185.9 $109.8 NA $109.8 59.1 $87.5 79.7 1955 257.6 171.6 $24.5 196.1 76.1 157.5 80.3 1960 324.7 236.0 29.2 196.1 81.7 207.0 78.1 1965 428.9 311.4 40.3 265.2 82.0 250.7 71.3 1970 631.3 483.6 48.0 351.7 84.2 415.6 78.2 1975 936.2 717.2 70.4 531.6 84.1 664.7 84.4 1980 1,555.1 1,235.6 97.9 1,333.5 85.7 1,179.3 88.4 1985 2,262.5 1,802.4 141.8 1,944.2 85.9 1,727.6 88.9 1990 3,135.6 2,510.4 193.8 2,704.2 86.2 2,358.6 87.2 1991 3,208.4 2,566.7 195.5 2,762.2 86.1 2,422.5 87.7 1992 3,417.0 2,709.7 206.8 2,916.5 85.4 2,532.8 86.8 1993 3,547.0 2,808.9 214.0 3,022.9 85.2 2,636.1 87.2 1994 3,713.2 2,950.3 218.4 3,168.7 85.3 2,785.2 87.9 1995 3,922.4 3,132.6 226.2 3,358.8 85.6 2,919.6 86.9 1996 4,171.3 3,325.7 238.7 3,564.4 85.5 3,073.5 86.2 1997 4,470.1 3,590.7 252.6 3,843.3 86.0 3,285.0 85.5 19982 4,816.6 3,882.0 269.8 4,151.8 86.2 3,524.9 84.9 19992 5,148.8 4,162.8 285.5 4,448.3 86.4 3,749.7 84.3 20002 5,551.1 4,484.1 299.4 4,783.5 86.2 3,987.1 83.4 20012 5,678.4 4,570.1 303.8 4,873.9 85.8 4,142.6 85.0 20022 5,774.2 4,630.7 319.2 4,949.9 85.7 4,227.0 85.4
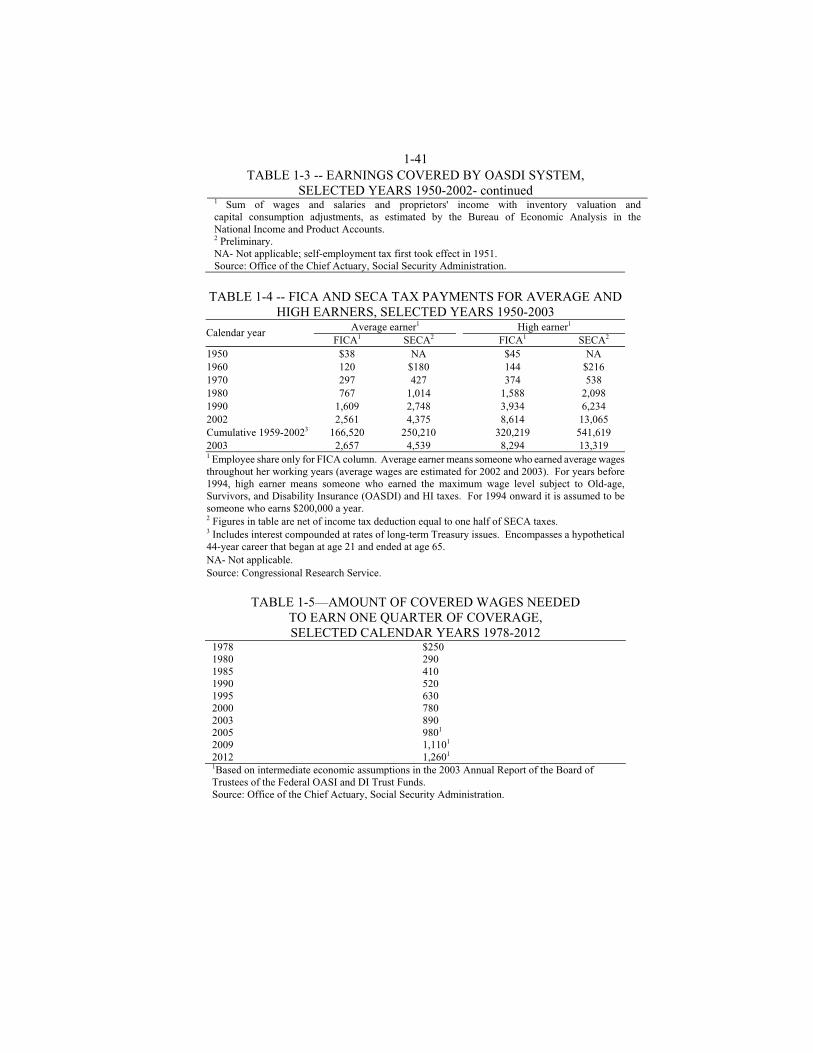
1-41 TABLE 1-3 -- EARNINGS COVERED BY OASDI SYSTEM,
SELECTED YEARS 1950-2002- continued 1 Sum of wages and salaries and proprietors' income with inventory valuation and capital consumption adjustments, as estimated by the Bureau of Economic Analysis in the National Income and Product Accounts. 2 Preliminary. NA- Not applicable; self-employment tax first took effect in 1951. Source: Office of the Chief Actuary, Social Security Administration.
TABLE 1-4 -- FICA AND SECA TAX PAYMENTS FOR AVERAGE AND
HIGH EARNERS, SELECTED YEARS 1950-2003 Average earner1 High earner1 Calendar year
FICA1 SECA2 FICA1 SECA2 1950 $38 NA $45 NA 1960 120 $180 144 $216 1970 297 427 374 538 1980 767 1,014 1,588 2,098 1990 1,609 2,748 3,934 6,234 2002 2,561 4,375 8,614 13,065 Cumulative 1959-20023 166,520 250,210 320,219 541,619 2003 2,657 4,539 8,294 13,319 1 Employee share only for FICA column. Average earner means someone who earned average wages throughout her working years (average wages are estimated for 2002 and 2003). For years before 1994, high earner means someone who earned the maximum wage level subject to Old-age, Survivors, and Disability Insurance (OASDI) and HI taxes. For 1994 onward it is assumed to be someone who earns $200,000 a year. 2 Figures in table are net of income tax deduction equal to one half of SECA taxes. 3 Includes interest compounded at rates of long-term Treasury issues. Encompasses a hypothetical 44-year career that began at age 21 and ended at age 65. NA- Not applicable. Source: Congressional Research Service.
TABLE 1-5—AMOUNT OF COVERED WAGES NEEDED
TO EARN ONE QUARTER OF COVERAGE, SELECTED CALENDAR YEARS 1978-2012
1978 $250 1980 290 1985 410 1990 520 1995 630 2000 780 2003 890 2005 9801 2009 1,1101 2012 1,2601 1Based on intermediate economic assumptions in the 2003 Annual Report of the Board of Trustees of the Federal OASI and DI Trust Funds. Source: Office of the Chief Actuary, Social Security Administration.
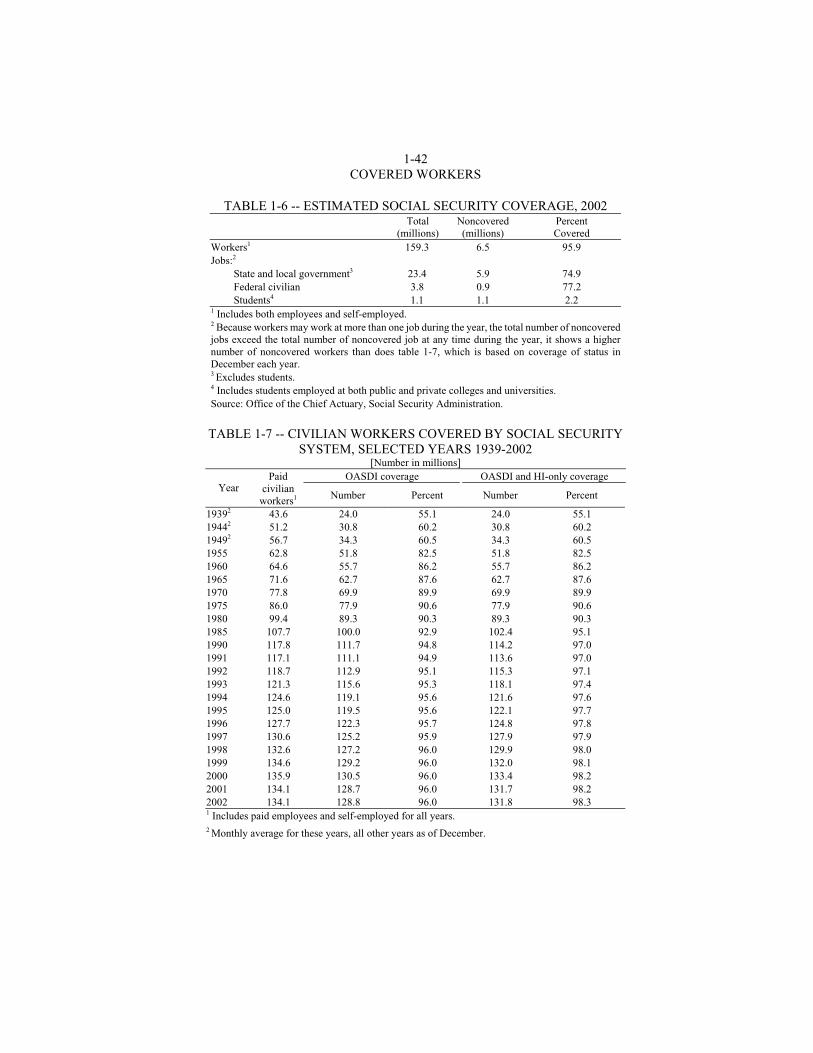
1-42 COVERED WORKERS
TABLE 1-6 -- ESTIMATED SOCIAL SECURITY COVERAGE, 2002
Total
(millions)Noncovered (millions)
Percent Covered
Workers1 159.3 6.5 95.9 Jobs:2
State and local government3 23.4 5.9 74.9 Federal civilian 3.8 0.9 77.2 Students4 1.1 1.1 2.2
1 Includes both employees and self-employed. 2 Because workers may work at more than one job during the year, the total number of noncovered jobs exceed the total number of noncovered job at any time during the year, it shows a higher number of noncovered workers than does table 1-7, which is based on coverage of status in December each year. 3 Excludes students. 4 Includes students employed at both public and private colleges and universities. Source: Office of the Chief Actuary, Social Security Administration.
TABLE 1-7 -- CIVILIAN WORKERS COVERED BY SOCIAL SECURITY
SYSTEM, SELECTED YEARS 1939-2002 [Number in millions]
OASDI coverage OASDI and HI-only coverage Year
Paid civilian
workers1 Number Percent Number Percent
19392 43.6 24.0 55.1 24.0 55.1 19442 51.2 30.8 60.2 30.8 60.2 19492 56.7 34.3 60.5 34.3 60.5 1955 62.8 51.8 82.5 51.8 82.5 1960 64.6 55.7 86.2 55.7 86.2 1965 71.6 62.7 87.6 62.7 87.6 1970 77.8 69.9 89.9 69.9 89.9 1975 86.0 77.9 90.6 77.9 90.6 1980 99.4 89.3 90.3 89.3 90.3 1985 107.7 100.0 92.9 102.4 95.1 1990 117.8 111.7 94.8 114.2 97.0 1991 117.1 111.1 94.9 113.6 97.0 1992 118.7 112.9 95.1 115.3 97.1 1993 121.3 115.6 95.3 118.1 97.4 1994 124.6 119.1 95.6 121.6 97.6 1995 125.0 119.5 95.6 122.1 97.7 1996 127.7 122.3 95.7 124.8 97.8 1997 130.6 125.2 95.9 127.9 97.9 1998 132.6 127.2 96.0 129.9 98.0 1999 134.6 129.2 96.0 132.0 98.1 2000 135.9 130.5 96.0 133.4 98.2 2001 134.1 128.7 96.0 131.7 98.2 2002 134.1 128.8 96.0 131.8 98.3 1 Includes paid employees and self-employed for all years. 2 Monthly average for these years, all other years as of December.
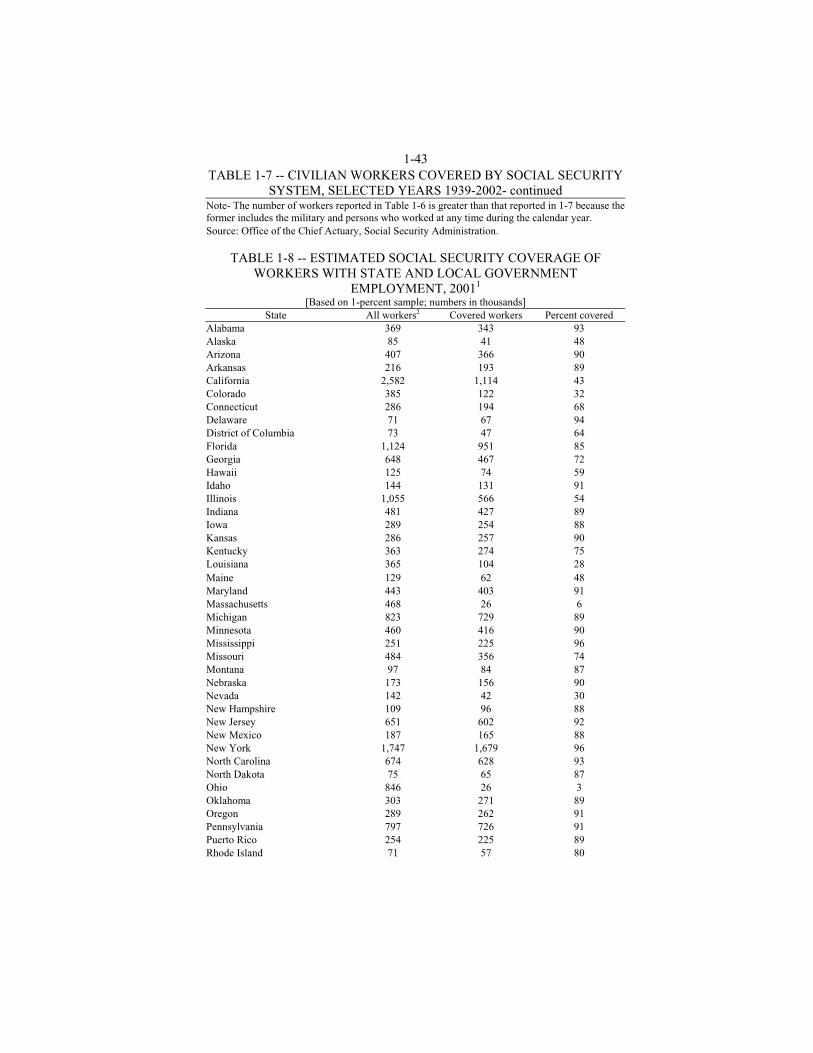
1-43 TABLE 1-7 -- CIVILIAN WORKERS COVERED BY SOCIAL SECURITY
SYSTEM, SELECTED YEARS 1939-2002- continued Note- The number of workers reported in Table 1-6 is greater than that reported in 1-7 because the former includes the military and persons who worked at any time during the calendar year. Source: Office of the Chief Actuary, Social Security Administration.
TABLE 1-8 -- ESTIMATED SOCIAL SECURITY COVERAGE OF WORKERS WITH STATE AND LOCAL GOVERNMENT
EMPLOYMENT, 20011 [Based on 1-percent sample; numbers in thousands]
State All workers2 Covered workers Percent covered Alabama 369 343 93 Alaska 85 41 48 Arizona 407 366 90 Arkansas 216 193 89 California 2,582 1,114 43 Colorado 385 122 32 Connecticut 286 194 68 Delaware 71 67 94 District of Columbia 73 47 64 Florida 1,124 951 85 Georgia 648 467 72 Hawaii 125 74 59 Idaho 144 131 91 Illinois 1,055 566 54 Indiana 481 427 89 Iowa 289 254 88 Kansas 286 257 90 Kentucky 363 274 75 Louisiana 365 104 28 Maine 129 62 48 Maryland 443 403 91 Massachusetts 468 26 6 Michigan 823 729 89 Minnesota 460 416 90 Mississippi 251 225 96 Missouri 484 356 74 Montana 97 84 87 Nebraska 173 156 90 Nevada 142 42 30 New Hampshire 109 96 88 New Jersey 651 602 92 New Mexico 187 165 88 New York 1,747 1,679 96 North Carolina 674 628 93 North Dakota 75 65 87 Ohio 846 26 3 Oklahoma 303 271 89 Oregon 289 262 91 Pennsylvania 797 726 91 Puerto Rico 254 225 89 Rhode Island 71 57 80

1-44 TABLE 1-8 -- ESTIMATED SOCIAL SECURITY COVERAGE OF
WORKERS WITH STATE AND LOCAL GOVERNMENT EMPLOYMENT, 2001- continued
[Based on 1-percent sample; numbers in thousands] State All workers1 Covered workers Percent covered
South Carolina 366 336 92 South Dakota 84 77 92 Tennessee 476 429 90 Texas 1,704 868 51 Utah 226 203 90 Vermont 60 58 97 Virginia 627 584 93 Washington 514 451 88 West Virginia 151 136 90 Wisconsin 506 444 88 Wyoming 73 63 86 Other3 7 1 14
Total 23,621 16,943 72 1 Workers with more than one State or local employer during the year are counted for each employer. 2 Includes seasonal and part-time workers for whom State and local government employment was not the major job. 3 Includes persons employed in American Samoa, Guam, and Virgin Islands, U.S. citizens employed abroad by American employers, and persons employed on ocean borne vessels. Source: Social Security Administration, Continuous Work History Sample, 1 percent sample.
TABLE 1-9 -- OASDI BENEFITS PAID, SELECTED YEARS 1940-2002
[In millions of dollars] Year OASDI OASI DI
1940 $35 $35 NA 1950 961 961 NA 1960 11,245 10,677 568 1970 31,863 28,786 3,067 1980 120,511 105,074 15,437 19851 186,196 167,360 18,836 19901 247,796 222,993 24,803 19951 332,580 291,682 40,898 19991 385,768 334,437 51,331 2000 407,644 352,706 54,938 2001 431,947 372,370 59,577 2002 453,815 388,170 56,645 1 Unnegotiated checks not deducted. NA- Not applicable. Source: Office of Research, Evaluation and Statistics, Social Security Administration.
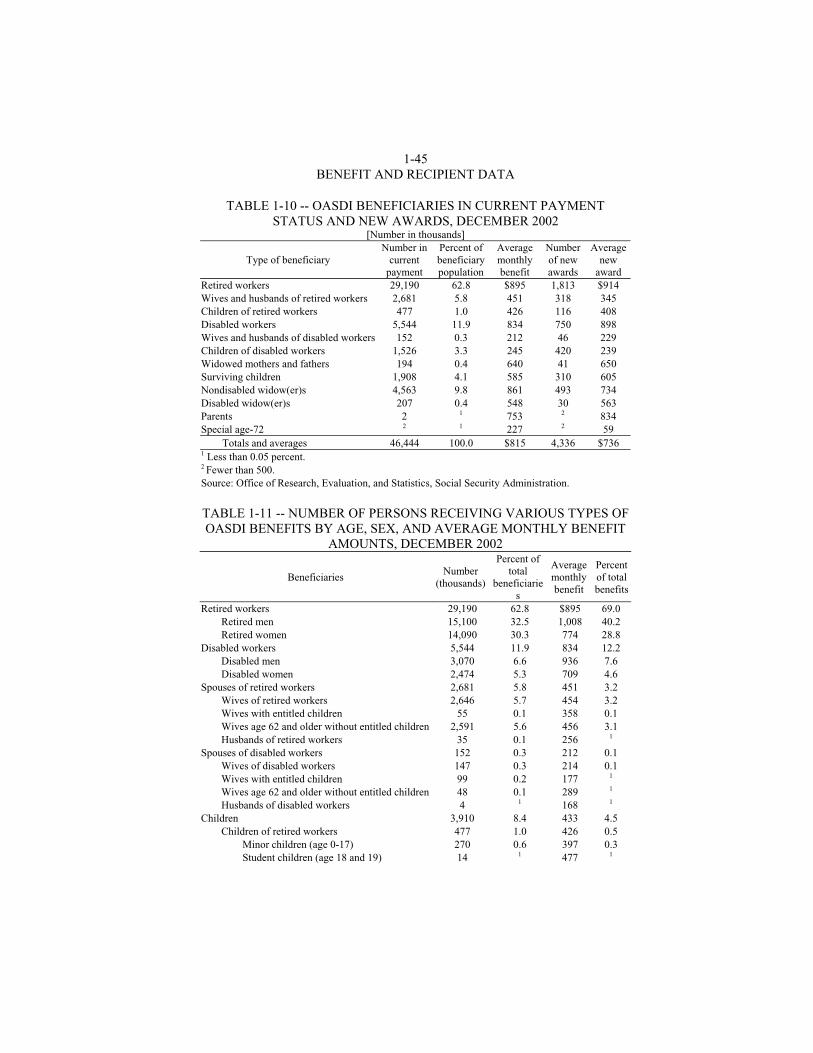
1-45 BENEFIT AND RECIPIENT DATA
TABLE 1-10 -- OASDI BENEFICIARIES IN CURRENT PAYMENT
STATUS AND NEW AWARDS, DECEMBER 2002 [Number in thousands]
Type of beneficiary Number in
current payment
Percent of beneficiary population
Average monthly benefit
Number of new awards
Average new
award Retired workers 29,190 62.8 $895 1,813 $914 Wives and husbands of retired workers 2,681 5.8 451 318 345 Children of retired workers 477 1.0 426 116 408 Disabled workers 5,544 11.9 834 750 898 Wives and husbands of disabled workers 152 0.3 212 46 229 Children of disabled workers 1,526 3.3 245 420 239 Widowed mothers and fathers 194 0.4 640 41 650 Surviving children 1,908 4.1 585 310 605 Nondisabled widow(er)s 4,563 9.8 861 493 734 Disabled widow(er)s 207 0.4 548 30 563 Parents 2 1 753 2 834 Special age-72 2 1 227 2 59
Totals and averages 46,444 100.0 $815 4,336 $736 1 Less than 0.05 percent. 2 Fewer than 500. Source: Office of Research, Evaluation, and Statistics, Social Security Administration.
TABLE 1-11 -- NUMBER OF PERSONS RECEIVING VARIOUS TYPES OF OASDI BENEFITS BY AGE, SEX, AND AVERAGE MONTHLY BENEFIT
AMOUNTS, DECEMBER 2002
Beneficiaries Number
(thousands)
Percent of total
beneficiaries
Average monthly benefit
Percent of total benefits
Retired workers 29,190 62.8 $895 69.0 Retired men 15,100 32.5 1,008 40.2 Retired women 14,090 30.3 774 28.8
Disabled workers 5,544 11.9 834 12.2 Disabled men 3,070 6.6 936 7.6 Disabled women 2,474 5.3 709 4.6
Spouses of retired workers 2,681 5.8 451 3.2 Wives of retired workers 2,646 5.7 454 3.2 Wives with entitled children 55 0.1 358 0.1 Wives age 62 and older without entitled children 2,591 5.6 456 3.1 Husbands of retired workers 35 0.1 256 1
Spouses of disabled workers 152 0.3 212 0.1 Wives of disabled workers 147 0.3 214 0.1 Wives with entitled children 99 0.2 177 1
Wives age 62 and older without entitled children 48 0.1 289 1 Husbands of disabled workers 4 1 168 1
Children 3,910 8.4 433 4.5 Children of retired workers 477 1.0 426 0.5
Minor children (age 0-17) 270 0.6 397 0.3 Student children (age 18 and 19) 14 1 477 1
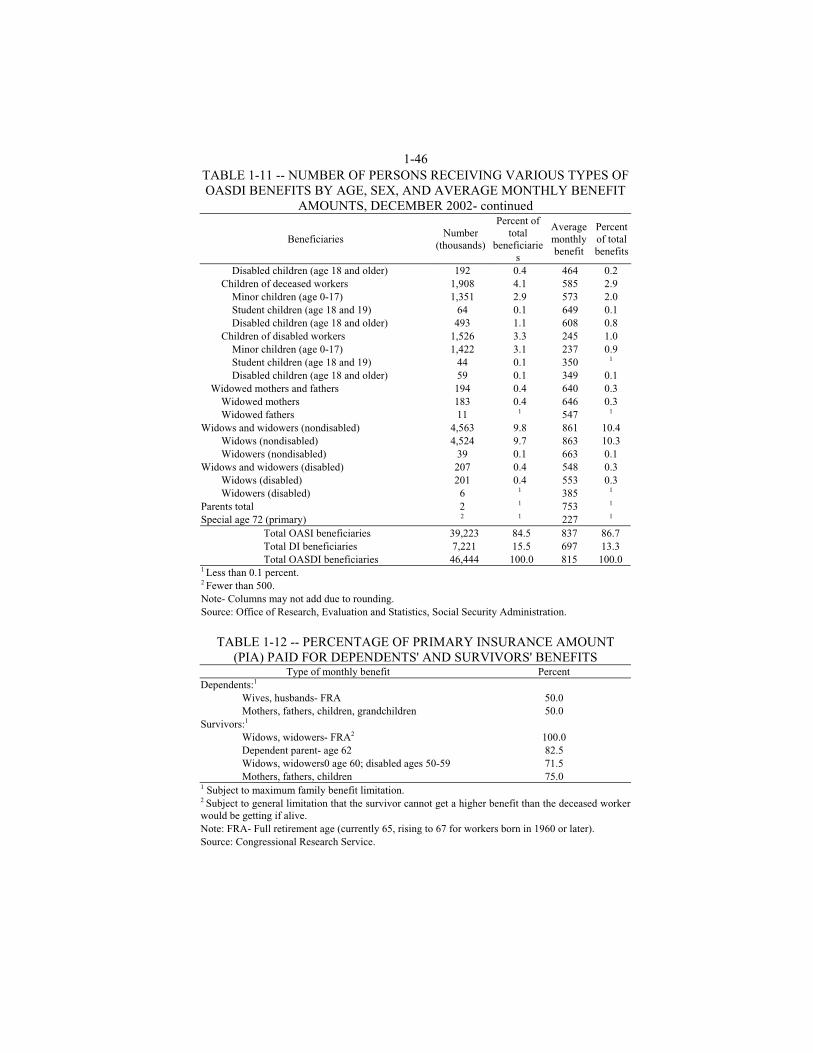
1-46 TABLE 1-11 -- NUMBER OF PERSONS RECEIVING VARIOUS TYPES OF OASDI BENEFITS BY AGE, SEX, AND AVERAGE MONTHLY BENEFIT
AMOUNTS, DECEMBER 2002- continued
Beneficiaries Number
(thousands)
Percent of total
beneficiaries
Average monthly benefit
Percent of total benefits
Disabled children (age 18 and older) 192 0.4 464 0.2 Children of deceased workers 1,908 4.1 585 2.9
Minor children (age 0-17) 1,351 2.9 573 2.0 Student children (age 18 and 19) 64 0.1 649 0.1 Disabled children (age 18 and older) 493 1.1 608 0.8
Children of disabled workers 1,526 3.3 245 1.0 Minor children (age 0-17) 1,422 3.1 237 0.9 Student children (age 18 and 19) 44 0.1 350 1 Disabled children (age 18 and older) 59 0.1 349 0.1
Widowed mothers and fathers 194 0.4 640 0.3 Widowed mothers 183 0.4 646 0.3 Widowed fathers 11 1 547 1
Widows and widowers (nondisabled) 4,563 9.8 861 10.4 Widows (nondisabled) 4,524 9.7 863 10.3 Widowers (nondisabled) 39 0.1 663 0.1
Widows and widowers (disabled) 207 0.4 548 0.3 Widows (disabled) 201 0.4 553 0.3 Widowers (disabled) 6 1 385 1
Parents total 2 1 753 1 Special age 72 (primary) 2 1 227 1
Total OASI beneficiaries 39,223 84.5 837 86.7 Total DI beneficiaries 7,221 15.5 697 13.3 Total OASDI beneficiaries 46,444 100.0 815 100.0
1 Less than 0.1 percent. 2 Fewer than 500. Note- Columns may not add due to rounding. Source: Office of Research, Evaluation and Statistics, Social Security Administration.
TABLE 1-12 -- PERCENTAGE OF PRIMARY INSURANCE AMOUNT
(PIA) PAID FOR DEPENDENTS' AND SURVIVORS' BENEFITS Type of monthly benefit Percent
Dependents:1 Wives, husbands- FRA 50.0 Mothers, fathers, children, grandchildren 50.0
Survivors:1 Widows, widowers- FRA2 100.0 Dependent parent- age 62 82.5 Widows, widowers0 age 60; disabled ages 50-59 71.5 Mothers, fathers, children 75.0
1 Subject to maximum family benefit limitation. 2 Subject to general limitation that the survivor cannot get a higher benefit than the deceased worker would be getting if alive. Note: FRA- Full retirement age (currently 65, rising to 67 for workers born in 1960 or later). Source: Congressional Research Service.

1-47
TABLE 1-13 -- NUMBER OF SOCIAL SECURITY RETIRED WORKER NEW BENEFIT AWARDS AND PERCENT RECEIVING REDUCED
BENEFITS BECAUSE OF ENTITLEMENT BEFORE FRA, SELECTED YEARS 1956-2002
[Number in millions] Total Men Women Year1
Number Percent Number Percent Number Percent 1956 0.9 12 0.6 NA 0.4 31 1960 1.0 21 0.6 NA 0.4 60 1965 1.2 49 0.7 43 0.4 60 1970 1.3 63 0.8 57 0.5 72 1975 1.5 73 0.9 69 0.6 79 1980 1.6 76 0.9 73 0.7 80 1985 1.7 74 1.0 70 0.7 79 1990 1.7 74 1.0 71 0.7 78 1995 1.6 72 0.9 69 0.7 75 2000 2.0 64 1.1 60 0.8 69 2001 1.8 69 1.0 86 0.8 72 2002 1.8 71 1.0 69 0.8 73
1 As of December of given year; data for 1985-1990 based on a 1-percent sample; data for other years based on 100 percent. Includes conversions at age FRA (age 65-67, depending on year of birth ) from disability to retirement rolls. NA- Not applicable. Source: Office of Research, Evaluation and Statistics, Social Security Administration.
TABLE 1-14 -- PERCENTAGE OF WORKERS ELECTING SOCIAL
SECURITY RETIREMENT BENEFITS AT VARIOUS AGES, SELECTED YEARS 1940-20021
Year Age 62 Ages 63-64 Age 65 Ages 66 and older
Average
1940 2 2 8.3 91.7 68.7 1945 2 2 17.9 82.1 70.0 1950 2 2 23.1 76.9 68.5 1955 2 2 41.2 58.8 68.2 1960 10.0 7.9 35.3 46.7 66.2 1965 23.0 17.7 23.4 35.9 65.9 1970 27.8 23.2 36.9 12.1 64.2 1975 35.7 24.5 31.1 8.7 63.9 1980 40.5 22.2 30.7 6.6 63.7 1985 57.2 21.1 17.7 4.0 63.6 1990 56.6 20.2 16.6 6.7 63.6 1995 58.3 19.5 16.3 6.0 63.6 2000 51.7 17.2 19.6 11.5 64.0 2001 55.4 21.2 17.8 17.8 63.7 2002 56.1 22.7 16.9 16.9 63.6 1 The age distribution excludes conversions at age 65 to retirement rolls. Disability conversions are included in the computation of the average age. Age in year of award for 1970-1980. Age in month of award for 1985-2002 2 Retirement before age 65 was not available. Source: Social Security Administration.
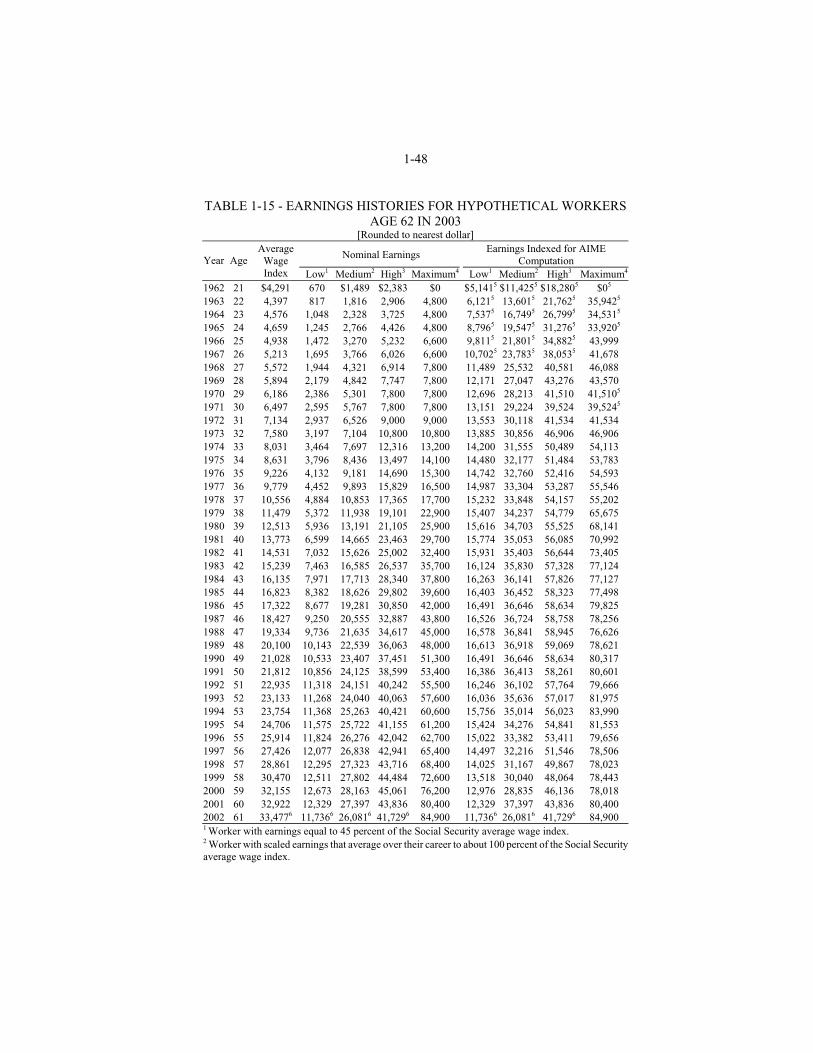
1-48 TABLE 1-15 - EARNINGS HISTORIES FOR HYPOTHETICAL WORKERS
AGE 62 IN 2003 [Rounded to nearest dollar]
Nominal Earnings Earnings Indexed for AIME
Computation Year Age
Average Wage Index Low1 Medium2 High3 Maximum4 Low1 Medium2 High3 Maximum4
1962 21 $4,291 670 $1,489 $2,383 $0 $5,1415 $11,4255 $18,2805 $05 1963 22 4,397 817 1,816 2,906 4,800 6,1215 13,6015 21,7625 35,9425 1964 23 4,576 1,048 2,328 3,725 4,800 7,5375 16,7495 26,7995 34,5315 1965 24 4,659 1,245 2,766 4,426 4,800 8,7965 19,5475 31,2765 33,9205 1966 25 4,938 1,472 3,270 5,232 6,600 9,8115 21,8015 34,8825 43,999 1967 26 5,213 1,695 3,766 6,026 6,600 10,7025 23,7835 38,0535 41,678 1968 27 5,572 1,944 4,321 6,914 7,800 11,489 25,532 40,581 46,088 1969 28 5,894 2,179 4,842 7,747 7,800 12,171 27,047 43,276 43,570 1970 29 6,186 2,386 5,301 7,800 7,800 12,696 28,213 41,510 41,5105 1971 30 6,497 2,595 5,767 7,800 7,800 13,151 29,224 39,524 39,5245 1972 31 7,134 2,937 6,526 9,000 9,000 13,553 30,118 41,534 41,534 1973 32 7,580 3,197 7,104 10,800 10,800 13,885 30,856 46,906 46,906 1974 33 8,031 3,464 7,697 12,316 13,200 14,200 31,555 50,489 54,113 1975 34 8,631 3,796 8,436 13,497 14,100 14,480 32,177 51,484 53,783 1976 35 9,226 4,132 9,181 14,690 15,300 14,742 32,760 52,416 54,593 1977 36 9,779 4,452 9,893 15,829 16,500 14,987 33,304 53,287 55,546 1978 37 10,556 4,884 10,853 17,365 17,700 15,232 33,848 54,157 55,202 1979 38 11,479 5,372 11,938 19,101 22,900 15,407 34,237 54,779 65,675 1980 39 12,513 5,936 13,191 21,105 25,900 15,616 34,703 55,525 68,141 1981 40 13,773 6,599 14,665 23,463 29,700 15,774 35,053 56,085 70,992 1982 41 14,531 7,032 15,626 25,002 32,400 15,931 35,403 56,644 73,405 1983 42 15,239 7,463 16,585 26,537 35,700 16,124 35,830 57,328 77,124 1984 43 16,135 7,971 17,713 28,340 37,800 16,263 36,141 57,826 77,127 1985 44 16,823 8,382 18,626 29,802 39,600 16,403 36,452 58,323 77,498 1986 45 17,322 8,677 19,281 30,850 42,000 16,491 36,646 58,634 79,825 1987 46 18,427 9,250 20,555 32,887 43,800 16,526 36,724 58,758 78,256 1988 47 19,334 9,736 21,635 34,617 45,000 16,578 36,841 58,945 76,626 1989 48 20,100 10,143 22,539 36,063 48,000 16,613 36,918 59,069 78,621 1990 49 21,028 10,533 23,407 37,451 51,300 16,491 36,646 58,634 80,317 1991 50 21,812 10,856 24,125 38,599 53,400 16,386 36,413 58,261 80,601 1992 51 22,935 11,318 24,151 40,242 55,500 16,246 36,102 57,764 79,666 1993 52 23,133 11,268 24,040 40,063 57,600 16,036 35,636 57,017 81,975 1994 53 23,754 11,368 25,263 40,421 60,600 15,756 35,014 56,023 83,990 1995 54 24,706 11,575 25,722 41,155 61,200 15,424 34,276 54,841 81,553 1996 55 25,914 11,824 26,276 42,042 62,700 15,022 33,382 53,411 79,656 1997 56 27,426 12,077 26,838 42,941 65,400 14,497 32,216 51,546 78,506 1998 57 28,861 12,295 27,323 43,716 68,400 14,025 31,167 49,867 78,023 1999 58 30,470 12,511 27,802 44,484 72,600 13,518 30,040 48,064 78,443 2000 59 32,155 12,673 28,163 45,061 76,200 12,976 28,835 46,136 78,018 2001 60 32,922 12,329 27,397 43,836 80,400 12,329 37,397 43,836 80,400 2002 61 33,4776 11,7366 26,0816 41,7296 84,900 11,7366 26,0816 41,7296 84,900 1 Worker with earnings equal to 45 percent of the Social Security average wage index. 2 Worker with scaled earnings that average over their career to about 100 percent of the Social Security average wage index.

1-49 TABLE 1-15 - EARNINGS HISTORIES FOR HYPOTHETICAL WORKERS
AGE 62 IN 2003- continued [Rounded to nearest dollar]
3 Worker with scaled earnings that average over their career to about 160 percent of the Social Security average wage index. 4 Worker with earnings each year equal to the Social Security maximum taxable earnings. 5 Dropout years. 6 Estimated years. Source: Office of the Chief Actuary, Social Security Administration.
TABLE 1-16 - MONTHLY BENEFIT AMOUNTS CREDITED FOR SELECTED BENEFICIARY FAMILIES WITH FIRST ELIGIBILITY IN
2003, FOR SELECTED WAGE LEVELS, DECEMBER 2003 Workers with
Beneficiary family
Federal minimum
wage1
Average wage2
Maximum taxable
earnings3
Retired-worker families:4 Average indexed monthly earnings $1,235.00 $2,744.00 $5,729.00 Primary insurance amount 763.70 1,257.70 1,873.90 Maximum family benefit 1,145.60 2,297.60 3,280.10 Monthly benefit credited:
Retired worker claiming benefits at age 62: Worker alone 585.00 964.00 1,436.00 Worker with spouse claiming benefits at full retirement age 967.00 1,593.00 2,373.00
With spouse claiming benefits at age 62 859.00 1,415.00 2,108.00 Survivor families:5
Average indexed monthly earnings 1,165.00 2,590.00 6,720.00 Primary insurance amount 740.80 1,207.30 2,025.90 Maximum family benefit 1,111.20 2,230.10 3,546.10 Monthly benefit credited: Survivors of worker deceased at age 40
One surviving child 555.00 905.00 1,519.00 Widowed mother or father an one child 1,110.00 1,810.00 3,038.00 Widowed mother or father and two children 1,110.00 2,229.00 3,546.00
Disabled worker families:6 Average indexed monthly earnings 1,250.00 2,778.00 6,535.00 Primary insurance amount 768.60 1,268.90 1,997.60 Maximum family benefit 1,086.90 1,903.30 2,996.30 Monthly benefit credited:
Disabled worker age 50: Worker alone 768.00 1,268.00 1,997.00 Worker, spouse, and one child 1,086.00 1,902.00 2,995.00
1 Worker assumed to begin work at age 21 with low scaled earnings. 2 Worker assumed to begin work at age 21 with medium scaled earnings. 3 Worker assumed to begin work at age 22 with maximum taxable earnings. 4 Worker assumed to retire at age 62 in 2003 with maximum reduction and no prior disability. 5 Assumes the deceased worker began to work at age 22, died in 1999 at age 40, had no earnings in that year, and had no prior period of disability. 6 Assumes the worker became disabled in 2003 at age 50 and had no prior period of disability. Source: Office of the Chief Actuary, Social Security Administration.

1-50
TABLE 1-17 -- SOCIAL SECURITY REPLACEMENT RATES FOR HYPOTHETICAL WORKERS RETIRING AT FULL RETIREMENT
AGE (FRA), SELECTED YEARS 1940-2080 [In percent]
Replacement rates1 Year Attains FRA
Age at retirement (FRA)2 Low
earnings3 Average earnings4
High earnings5
Maximum earnings6
1940 65 27.9 23.4 17.3 16.4 1950 65 31.7 18.6 14.1 9.7 1960 65 46.3 28.3 24.1 16.1 1970 65 46.0 31.7 28.0 20.3 1980 65 66.0 48.6 47.7 40.6 1990 65 58.4 43.5 39.9 35.7 2000 65 52.2 38.7 33.3 28.6 2001 65 52.5 39.0 33.3 28.5 2002 65 55.0 40.8 34.5 29.5 2003 65 and 2 months 56.1 41.6 35.1 29.8 2004 65 and 4 months 56.3 41.7 35.0 29.5 2005 65 and 6 months 56.8 42.1 35.2 29.4 2006 65 and 8 months 56.4 41.8 34.9 29.0 2007 65 and 10 months 55.3 41.0 34.2 28.2 20097 66 55.2 41.0 34.1 28.2 2010 66 55.4 41.1 34.1 28.1 2020 66 56.0 41.5 34.4 27.6 2030 67 55.3 41.0 34.0 27.3 2040 67 55.2 40.9 33.9 27.3 20508 67 55.2 41.0 33.9 27.3 20608 67 55.3 41.0 33.9 27.3 20708 67 55.2 41.0 33.9 27.3 20808 67 55.3 41.0 33.9 27.3 1 Total monthly benefits payable for year of entitlement at FRA expressed as percent of career average earnings for workers with scaled career earnings. 2 FRA will rise from 65 starting with workers attaining age 62 in 2000 and ultimately will reach 67 for workers attaining age 62 in 2022 and later. 3 Worker with scaled earnings that average over their career to about 45 percent of the Social Security average wage index. 4 Worker with scaled earnings that average over their career to about 100 percent of the Social Security average wage index. 5 Worker with scaled earnings that average over their career to about 160 percent of the Social Security average wage index. 6 Worker with earnings each year equal to the Social Security maximum taxable earnings. 7 Table assumes that workers are born on January 2. No worker born on January 2 attains FRA in 2008. A worker born on January 2, 1942 attains FRA of 65 and 10 months in November 2007. A worker born on January 2, 1943 attains FRA of 66 in January 2009. 8 Based on benefits scheduled in present law. Note- Projections are based on the intermediate assumption projection of the 2003 Trustees' Report. Source: Office of the Chief Actuary, Social Security Administration.

1-51 BENEFIT ADJUSTMENTS
TABLE 1-18 -- SOCIAL SECURITY BENEFIT INCREASES FROM THE
BEGINNING OF THE PROGRAM THROUGH JANUARY 2004 [In percent]
Date increase paid Amount of increase Date increase paid Amount of increase January 2004 2.1 January 1984 3.5 January 2003 1.4 July 1982 7.4 January 2002 2.6 July 1981 11.2 January 2001 3.5 July 1980 14.3 January 2000 2.4 July 1979 9.9 January 1999 1.3 July 1978 6.5 January 1998 2.1 July 1977 5.9 January 1997 2.9 July 1976 6.4 January 1996 2.6 July 19751 8.0 January 1995 2.8 April/July 19742 11.0 January 1994 2.6 October 1972 20.0 January 1993 3.0 February 1971 10.0 January 1992 3.7 February 1970 15.0 January 1991 5.4 March 1968 13.0 January 1990 4.7 February 1965 7.0 January 1989 4.0 February 1959 7.0 January 1988 4.2 October 1954 13.0 January 1987 1.3 October 1952 12.5 January 1986 3.1 October 19503 77.0 January 1985 3.5 1 Automatic cost-of-living adjustments (COLAs) began. 2 Increase came in two steps. 3 First increase paid in October 1950. Source: Social Security Administration.
TABLE 1-19 -- COMPARISON OF AVERAGE WAGE INCREASES TO
BENEFIT INCREASES AND CHANGES IN THE CPI, 1965-2002 [In percent]
Increase in wages1 Increase in CPI2 Increase in benefits3 Calendar
year Over prior year
Cumulative from each
year to 2002
Over prior year
Cumulative from each
year to 2002
Over prior year
Cumulative from each
year to 2002 1965 1.8 618.6 1.6 454.8 7.0 572.5 1970 5.0 441.1 5.7 351.0 15.0 417.5 1975 7.5 287.9 9.1 225.1 8.0 227.0 1980 9.0 167.5 13.4 112.2 14.3 116.9 1981 10.1 143.1 10.3 92.4 11.2 95.1 1982 5.5 130.4 6.0 81.5 7.4 81.7 1983 4.9 119.7 3.0 76.2 3.54 75.5 1984 5.9 107.5 3.5 70.3 3.5 69.6 1985 4.3 99.0 3.5 64.5 3.1 64.5 1986 3.0 93.3 1.6 61.9 1.3 62.4 1987 6.4 81.7 3.6 56.3 4.2 55.8 1988 4.9 73.1 4.0 50.3 4.0 49.8 1989 4.0 66.6 4.8 43.5 4.7 43.1

1-52
TABLE 1-19 -- COMPARISON OF AVERAGE WAGE INCREASES TO BENEFIT INCREASES AND CHANGES IN THE CPI, 1965-2002-
continued [In percent]
Increase in wages1 Increase in CPI2 Increase in benefits3 Calendar
year Over prior year
Cumulative from each
year to 2002
Over prior year
Cumulative from each year
to 2002
Over prior year
Cumulative from each
year to 2002 1990 4.6 59.2 5.2 36.3 5.4 35.8 1991 3.7 53.5 4.1 31.0 3.7 30.9 1992 5.2 46.0 2.9 27.3 3.0 27.1 1993 0.9 44.7 2.8 23.8 2.6 23.9 1994 2.7 40.9 2.5 20.8 2.8 20.5 1995 4.0 35.5 2.9 17.4 2.6 17.5 1996 4.9 29.2 2.9 14.1 2.9 14.2 1997 5.8 22.1 2.3 11.6 2.1 11.8 1998 5.2 16.0 1.3 10.2 1.3 10.4 1999 5.6 9.9 2.2 7.7 2.5 7.7 2000 5.5 4.1 3.5 4.1 3.5 4.0 2001 2.4 1.7 2.7 1.4 2.6 1.4 2002 1.75 -- 1.4 -- 1.46 -- 1 Average annual wage used to index earnings records. 2 Increase in annual average CPI-W. 3 Legislated benefit increases through 1975 and increases based on the CPI thereafter. After 1975, the CPI and benefit increases are different because they reflect the change in prices over different periods of time. 4 As a result of the Social Security Amendments of 1983, COLAs are provided on a calendar year basis, with the benefit increases payable in January rather than July. The July 1983 COLA was delayed to January 1984. This delay and a change in the computation period led to 6 months of 1983 (first quarter-third quarter) not being accounted for in any COLA increase--a period in which the CPI increased 2.4 percent. 5 Preliminary. 6 Effective December 2002 payable in January 2003.
NA- Not applicable.
Source: Office of the Chief Actuary, Social Security Administration.

TABLE 1-20 -- INCREASES IN FULL RETIREMENT AGE AND DELAYED RETIREMENT CREDITS WITH RESULTING BENEFIT, AS A PERCENT OF PRIMARY INSURANCE AMOUNT, PAYABLE AT
SELECTED AGES, FOR PERSONS BORN IN 1924 OR LATER Benefit, as a percent of PIA, beginning at age-
Year of Birth Age 62
attained in- Full retirement
age
Credit for each year of delayed retirement after full retirement
age 62 65 66 67 70
1924 1986 65 3 80 100 103 106 115 1925-26 1987-88 65 3 1/2 80 100 103 1/2 107 117 1/2 1927-28 1989-90 65 4 80 100 104 108 120 1929-30 1991-92 65 4 1/2 80 100 104 1/2 109 122 1/2 1931-32 1993-94 65 5 80 100 105 110 125 1933-34 1995-96 65 5 1/2 80 100 105 1/2 111 127 1/2 1935-36 1997-98 65 6 80 100 106 112 130 1937 1999 65 6 1/2 80 100 106 1/2 113 132 1/2 1938 2000 65 and 2 months 6 1/2 79 1/6 98 8/9 105 5/12 111 11/12 131 5/12 1939 2001 65 and 4 months 7 78 1/3 97 7/9 104 2/3 111 2/3 132 2/3 1940 2002 65 and 6 months 7 77 1/ 2 96 2/3 103 1/2 110 1/2 131 1/2 1941 2003 65 and 8 months 7 1/2 76 2/3 95 5/9 102 1/2 110 132 1/2 1942 2004 65 and 10 months 7 1/2 75 5/6 94 4/9 101 1/4 108 3/4 131 1/4 1943-54 2005-2016 66 8 75 93 1/3 100 108 132 1955 2017 66 and 2 months 8 74 1/6 92 2/9 98 8/9 106 2/3 130 2/3 1956 2018 66 and 4 months 8 73 1/3 91 1/9 97 7/9 105 1/3 129 1/3 1957 2019 66 and 6 months 8 72 1/2 90 96 2/3 104 128 1958 2020 66 and 8 months 8 71 2/3 88 8/9 95 5/9 102 2/3 126 2/3 1959 2021 66 and 10 months 8 70 5/6 87 7/9 94 4/9 101 1/3 125 1/3 1960 or later 2022 or later 67 8 70 86 2/3 93 1/3 100 124 Source: Ballantyne, H.C. (1984).
1-53
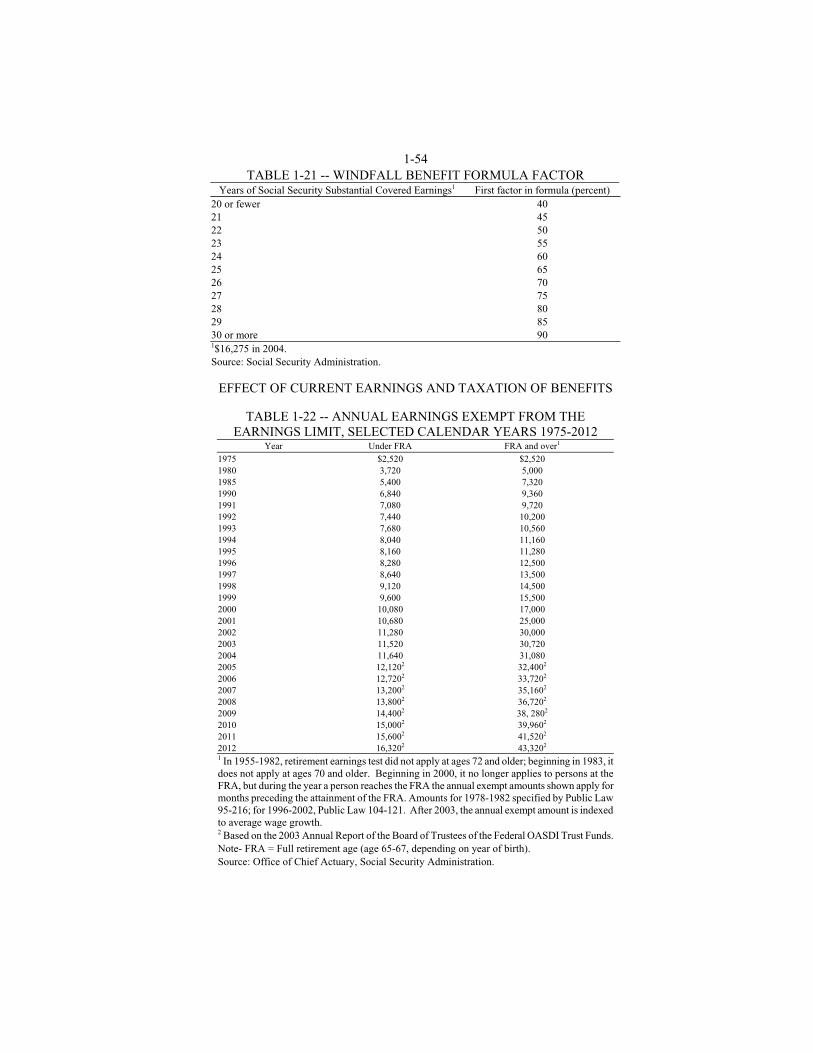
1-54 TABLE 1-21 -- WINDFALL BENEFIT FORMULA FACTOR
Years of Social Security Substantial Covered Earnings1 First factor in formula (percent) 20 or fewer 40 21 45 22 50 23 55 24 60 25 65 26 70 27 75 28 80 29 85 30 or more 90 1$16,275 in 2004. Source: Social Security Administration.
EFFECT OF CURRENT EARNINGS AND TAXATION OF BENEFITS
TABLE 1-22 -- ANNUAL EARNINGS EXEMPT FROM THE EARNINGS LIMIT, SELECTED CALENDAR YEARS 1975-2012
Year Under FRA FRA and over1 1975 $2,520 $2,520 1980 3,720 5,000 1985 5,400 7,320 1990 6,840 9,360 1991 7,080 9,720 1992 7,440 10,200 1993 7,680 10,560 1994 8,040 11,160 1995 8,160 11,280 1996 8,280 12,500 1997 8,640 13,500 1998 9,120 14,500 1999 9,600 15,500 2000 10,080 17,000 2001 10,680 25,000 2002 11,280 30,000 2003 11,520 30,720 2004 11,640 31,080 2005 12,1202 32,4002 2006 12,7202 33,7202 2007 13,2002 35,1602 2008 13,8002 36,7202 2009 14,4002 38, 2802 2010 15,0002 39,9602 2011 15,6002 41,5202 2012 16,3202 43,3202 1 In 1955-1982, retirement earnings test did not apply at ages 72 and older; beginning in 1983, it does not apply at ages 70 and older. Beginning in 2000, it no longer applies to persons at the FRA, but during the year a person reaches the FRA the annual exempt amounts shown apply for months preceding the attainment of the FRA. Amounts for 1978-1982 specified by Public Law 95-216; for 1996-2002, Public Law 104-121. After 2003, the annual exempt amount is indexed to average wage growth. 2 Based on the 2003 Annual Report of the Board of Trustees of the Federal OASDI Trust Funds. Note- FRA = Full retirement age (age 65-67, depending on year of birth). Source: Office of Chief Actuary, Social Security Administration.
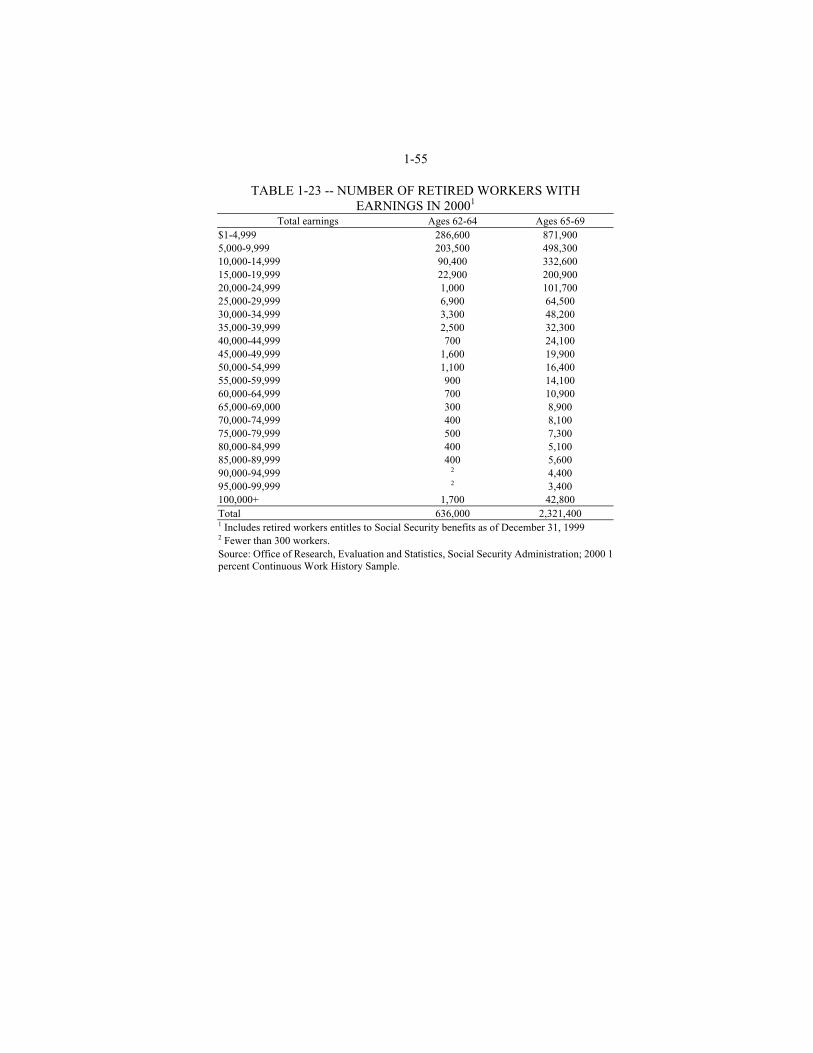
1-55
TABLE 1-23 -- NUMBER OF RETIRED WORKERS WITH EARNINGS IN 20001
Total earnings Ages 62-64 Ages 65-69 $1-4,999 286,600 871,900 5,000-9,999 203,500 498,300 10,000-14,999 90,400 332,600 15,000-19,999 22,900 200,900 20,000-24,999 1,000 101,700 25,000-29,999 6,900 64,500 30,000-34,999 3,300 48,200 35,000-39,999 2,500 32,300 40,000-44,999 700 24,100 45,000-49,999 1,600 19,900 50,000-54,999 1,100 16,400 55,000-59,999 900 14,100 60,000-64,999 700 10,900 65,000-69,000 300 8,900 70,000-74,999 400 8,100 75,000-79,999 500 7,300 80,000-84,999 400 5,100 85,000-89,999 400 5,600 90,000-94,999 2 4,400 95,000-99,999 2 3,400 100,000+ 1,700 42,800 Total 636,000 2,321,400 1 Includes retired workers entitles to Social Security benefits as of December 31, 1999 2 Fewer than 300 workers. Source: Office of Research, Evaluation and Statistics, Social Security Administration; 2000 1 percent Continuous Work History Sample.

1-56 TABLE 1-24 -- MONTHLY SUBSTANTIAL GAINFUL ACTIVITY (SGA)
AMOUNTS SINCE 1968
Year SGA amounts for nonblind
beneficiaries SGA amounts for blind
beneficiaries 1968-73 $140 $140 1974-75 200 200 1976 230 230 1977 240 240 1978 260 334 1979 280 375 1980 300 417 1981 300 459 1982 300 200 1983 300 550 1984 300 580 1985 300 610 1986 300 650 1987 300 680 1988 300 700 1989 300 740 1990 500 780 1991 500 810 1992 500 850 1993 500 880 1994 500 930 1995 500 940 1996 500 960 1997 500 1,000 1998 500 1,050 19991 5001 1,100 July 1999 7002 1,110 2000 700 1,170 2001 740 1,240 2002 780 1,300 2003 800 1,330 2004 810 1,350 1 Through June 30, 1999. 2 July 1, 1999 and later. Note- SGA amounts for nonblind and blind beneficiaries are indexed to increases in the average wage level. Before 1978, SGA levels for blind beneficiaries were the same as those for nonblind beneficiaries. Source: Office of Research, Evaluation and Statistics, Social Security Administration.

TABLE 1-25 -- EFFECT OF TAXING SOCIAL SECURITY BENFITS BY INCOME CLASS UNDER 2003 LAW (2000 POPULATION AND INCOMES)
[Number of persons in thousands; dollars in millions]
Persons age 65 and older
All recipients Level of individual or
couple income1 Number
Number affected by taxation2
Percent affected by taxation2
Number of Social Security beneficiaries3
Number affected by taxation3
Percent affected by taxation3
Aggregate amount of
Social Security benefits
Aggregate amount of taxes on benefits
Taxes as a percent of benefits
Less that $10,000 6,071 0 0 7,157 2 0 $44,745 $0 0 $10,000-$15,000 3,838 5 0 4,845 7 0 44,827 2 0 $15,000-$20,000 2,805 6 0 3,509 12 0 31,887 4 0 $20,000-$25,000 2,632 13 0 3,439 22 1 33,025 14 0 $25,000-$30,000 2,294 282 12 2,854 360 13 27,332 48 0 $30,000-$40,000 4,328 1,840 43 5,225 2,237 43 49,036 650 1 $40,000-$50,000 3,361 3,050 91 3,918 3,598 92 39,011 1,948 5 $50,000-$100,000 5,793 5,526 95 6,705 6,608 99 72,224 9,424 13 Over $100,000 2,569 2,479 96 2,737 2,723 100 35,351 7,386 23
All 33,692 13,200 39 40,390 15,569 39 374,438 19,476 5 1 Cash income (based on income of tax filing unit) plus capital gains realizations. 2 Some elderly individuals do not receive Social Security benefits and thus are not affected by taxation of benefits. 3 Includes beneficiaries under and over age 65. Note- Aggregate benefits and revenues are understated by about 10 percent because of benefits paid abroad, deaths of recipients before March interview, and exclusion of institutionalized beneficiaries. The number of beneficiaries is also understated. Source: Congressional Budget Office simulations based on data from the Current Population Survey.
1-57
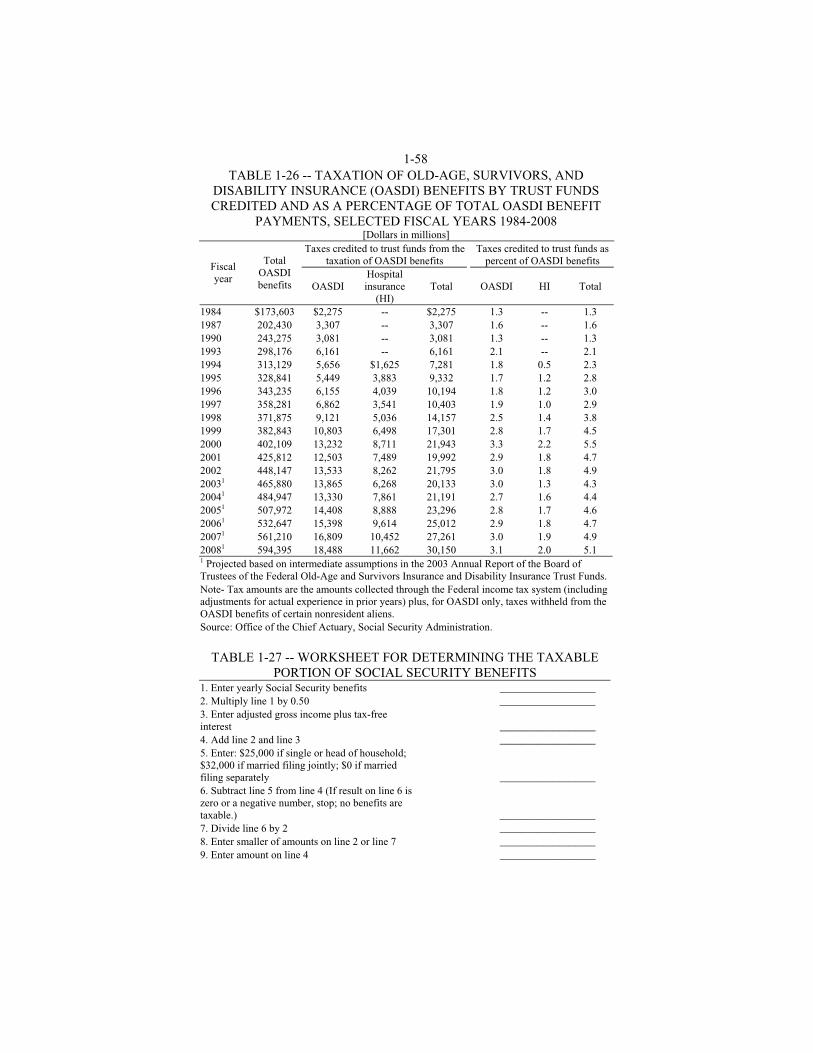
1-58 TABLE 1-26 -- TAXATION OF OLD-AGE, SURVIVORS, AND
DISABILITY INSURANCE (OASDI) BENEFITS BY TRUST FUNDS CREDITED AND AS A PERCENTAGE OF TOTAL OASDI BENEFIT
PAYMENTS, SELECTED FISCAL YEARS 1984-2008 [Dollars in millions]
Taxes credited to trust funds from the taxation of OASDI benefits
Taxes credited to trust funds as percent of OASDI benefits Fiscal
year
Total OASDI benefits OASDI
Hospital insurance
(HI) Total OASDI HI Total
1984 $173,603 $2,275 -- $2,275 1.3 -- 1.3 1987 202,430 3,307 -- 3,307 1.6 -- 1.6 1990 243,275 3,081 -- 3,081 1.3 -- 1.3 1993 298,176 6,161 -- 6,161 2.1 -- 2.1 1994 313,129 5,656 $1,625 7,281 1.8 0.5 2.3 1995 328,841 5,449 3,883 9,332 1.7 1.2 2.8 1996 343,235 6,155 4,039 10,194 1.8 1.2 3.0 1997 358,281 6,862 3,541 10,403 1.9 1.0 2.9 1998 371,875 9,121 5,036 14,157 2.5 1.4 3.8 1999 382,843 10,803 6,498 17,301 2.8 1.7 4.5 2000 402,109 13,232 8,711 21,943 3.3 2.2 5.5 2001 425,812 12,503 7,489 19,992 2.9 1.8 4.7 2002 448,147 13,533 8,262 21,795 3.0 1.8 4.9 20031 465,880 13,865 6,268 20,133 3.0 1.3 4.3 20041 484,947 13,330 7,861 21,191 2.7 1.6 4.4 20051 507,972 14,408 8,888 23,296 2.8 1.7 4.6 20061 532,647 15,398 9,614 25,012 2.9 1.8 4.7 20071 561,210 16,809 10,452 27,261 3.0 1.9 4.9 20081 594,395 18,488 11,662 30,150 3.1 2.0 5.1 1 Projected based on intermediate assumptions in the 2003 Annual Report of the Board of Trustees of the Federal Old-Age and Survivors Insurance and Disability Insurance Trust Funds. Note- Tax amounts are the amounts collected through the Federal income tax system (including adjustments for actual experience in prior years) plus, for OASDI only, taxes withheld from the OASDI benefits of certain nonresident aliens. Source: Office of the Chief Actuary, Social Security Administration.
TABLE 1-27 -- WORKSHEET FOR DETERMINING THE TAXABLE PORTION OF SOCIAL SECURITY BENEFITS
1. Enter yearly Social Security benefits __________________ 2. Multiply line 1 by 0.50 __________________ 3. Enter adjusted gross income plus tax-free interest __________________ 4. Add line 2 and line 3 __________________ 5. Enter: $25,000 if single or head of household; $32,000 if married filing jointly; $0 if married filing separately __________________ 6. Subtract line 5 from line 4 (If result on line 6 is zero or a negative number, stop; no benefits are taxable.) __________________ 7. Divide line 6 by 2 __________________ 8. Enter smaller of amounts on line 2 or line 7 __________________ 9. Enter amount on line 4 __________________
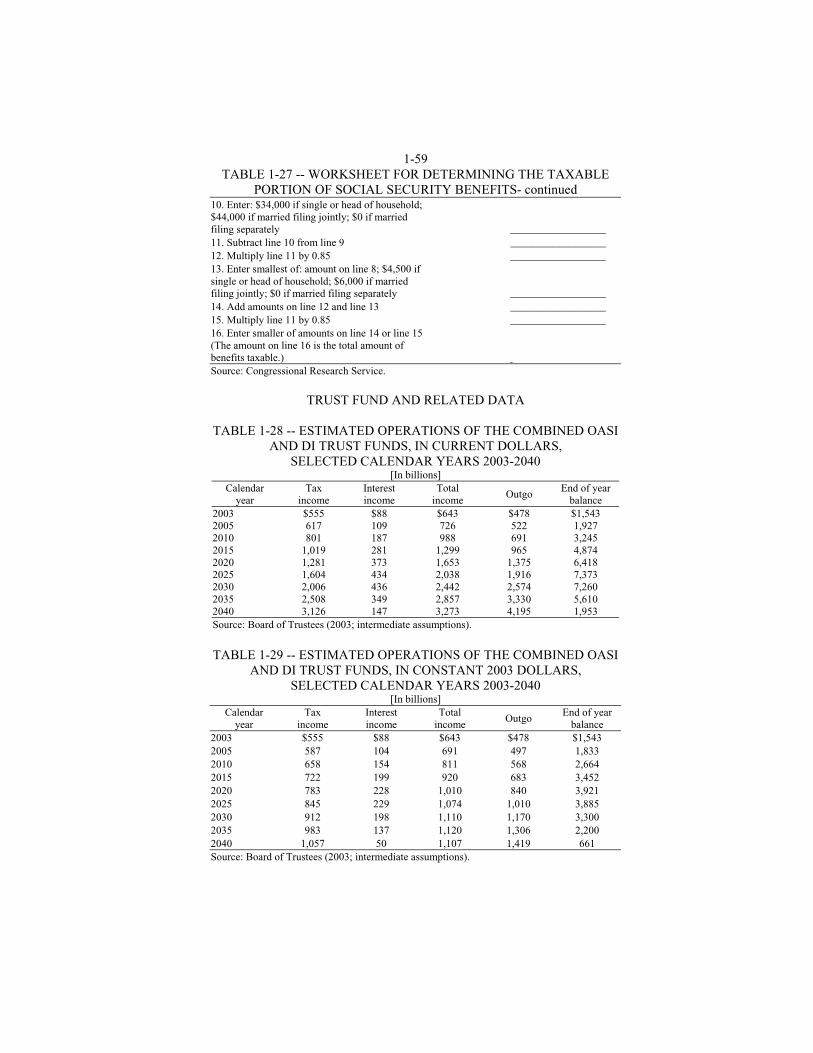
1-59 TABLE 1-27 -- WORKSHEET FOR DETERMINING THE TAXABLE
PORTION OF SOCIAL SECURITY BENEFITS- continued 10. Enter: $34,000 if single or head of household; $44,000 if married filing jointly; $0 if married filing separately __________________ 11. Subtract line 10 from line 9 __________________ 12. Multiply line 11 by 0.85 __________________ 13. Enter smallest of: amount on line 8; $4,500 if single or head of household; $6,000 if married filing jointly; $0 if married filing separately __________________ 14. Add amounts on line 12 and line 13 __________________ 15. Multiply line 11 by 0.85 __________________ 16. Enter smaller of amounts on line 14 or line 15 (The amount on line 16 is the total amount of benefits taxable.) Source: Congressional Research Service.
TRUST FUND AND RELATED DATA
TABLE 1-28 -- ESTIMATED OPERATIONS OF THE COMBINED OASI
AND DI TRUST FUNDS, IN CURRENT DOLLARS, SELECTED CALENDAR YEARS 2003-2040
[In billions] Calendar
year Tax
income Interest income
Total income
Outgo End of year
balance 2003 $555 $88 $643 $478 $1,543 2005 617 109 726 522 1,927 2010 801 187 988 691 3,245 2015 1,019 281 1,299 965 4,874 2020 1,281 373 1,653 1,375 6,418 2025 1,604 434 2,038 1,916 7,373 2030 2,006 436 2,442 2,574 7,260 2035 2,508 349 2,857 3,330 5,610 2040 3,126 147 3,273 4,195 1,953 Source: Board of Trustees (2003; intermediate assumptions).
TABLE 1-29 -- ESTIMATED OPERATIONS OF THE COMBINED OASI
AND DI TRUST FUNDS, IN CONSTANT 2003 DOLLARS, SELECTED CALENDAR YEARS 2003-2040
[In billions] Calendar
year Tax
income Interest income
Total income
Outgo End of year
balance 2003 $555 $88 $643 $478 $1,543 2005 587 104 691 497 1,833 2010 658 154 811 568 2,664 2015 722 199 920 683 3,452 2020 783 228 1,010 840 3,921 2025 845 229 1,074 1,010 3,885 2030 912 198 1,110 1,170 3,300 2035 983 137 1,120 1,306 2,200 2040 1,057 50 1,107 1,419 661 Source: Board of Trustees (2003; intermediate assumptions).
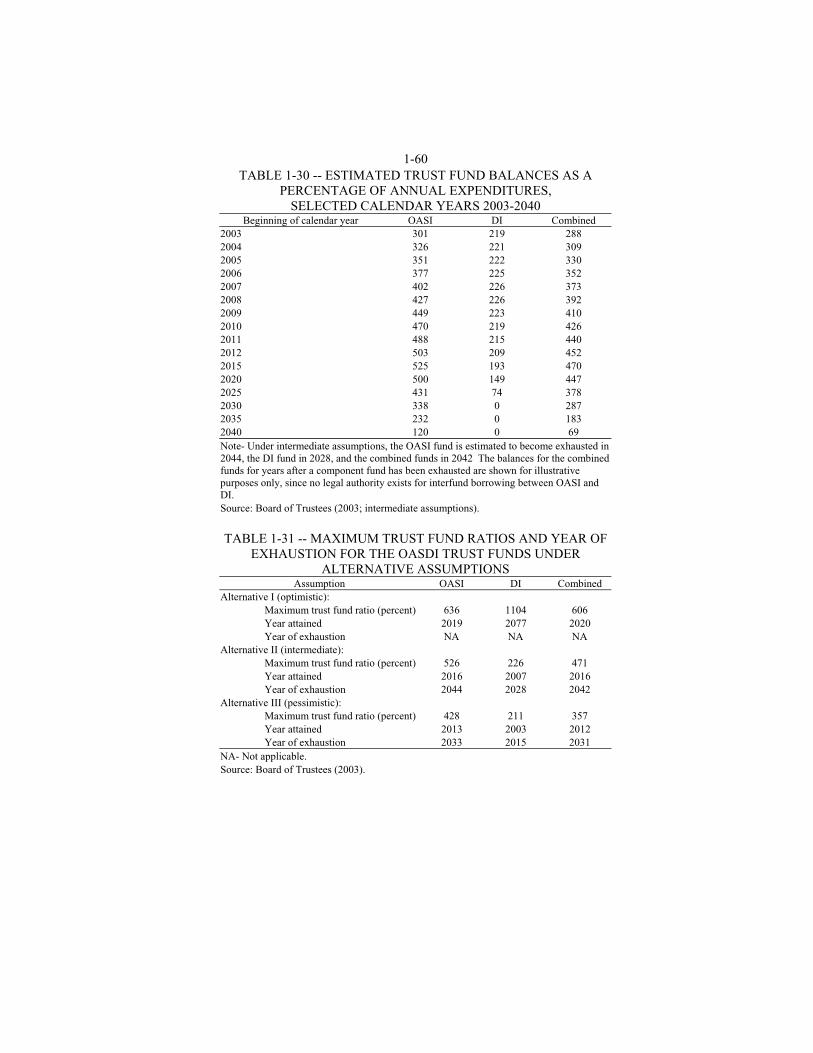
1-60 TABLE 1-30 -- ESTIMATED TRUST FUND BALANCES AS A
PERCENTAGE OF ANNUAL EXPENDITURES, SELECTED CALENDAR YEARS 2003-2040
Beginning of calendar year OASI DI Combined 2003 301 219 288 2004 326 221 309 2005 351 222 330 2006 377 225 352 2007 402 226 373 2008 427 226 392 2009 449 223 410 2010 470 219 426 2011 488 215 440 2012 503 209 452 2015 525 193 470 2020 500 149 447 2025 431 74 378 2030 338 0 287 2035 232 0 183 2040 120 0 69 Note- Under intermediate assumptions, the OASI fund is estimated to become exhausted in 2044, the DI fund in 2028, and the combined funds in 2042 The balances for the combined funds for years after a component fund has been exhausted are shown for illustrative purposes only, since no legal authority exists for interfund borrowing between OASI and DI. Source: Board of Trustees (2003; intermediate assumptions).
TABLE 1-31 -- MAXIMUM TRUST FUND RATIOS AND YEAR OF
EXHAUSTION FOR THE OASDI TRUST FUNDS UNDER ALTERNATIVE ASSUMPTIONS
Assumption OASI DI Combined Alternative I (optimistic):
Maximum trust fund ratio (percent) 636 1104 606 Year attained 2019 2077 2020 Year of exhaustion NA NA NA
Alternative II (intermediate): Maximum trust fund ratio (percent) 526 226 471 Year attained 2016 2007 2016 Year of exhaustion 2044 2028 2042
Alternative III (pessimistic): Maximum trust fund ratio (percent) 428 211 357 Year attained 2013 2003 2012 Year of exhaustion 2033 2015 2031
NA- Not applicable. Source: Board of Trustees (2003).

TABLE 1-32 -- ESTIMATED INCOME RATES AND COST RATES, AS A PERCENTAGE OF TAXABLE PAYROLL, SELECTED CALENDAR YEARS 2003-2080
OASI DI Combined Calendar year
Income rate Cost rate Balance Income Rate Cost rate Balance Income rate Cost rate Balance 2003 10.88 9.22 1.66 1.82 1.67 0.15 12.70 10.89 1.81 2004 10.87 9.08 1.79 1.82 1.74 0.09 12.69 10.82 1.88 2005 10.88 8.96 1.92 1.82 1.77 0.05 12.70 10.73 1.97 2006 10.88 8.88 2.00 1.82 1.77 0.05 12.70 10.65 2.05 2007 10.89 8.87 2.03 1.82 1.80 0.03 12.72 10.67 2.05 2008 10.91 8.90 2.00 1.83 1.83 0.00 12.73 10.73 2.00 2009 10.92 8.97 1.94 1.83 1.87 -0.04 12.74 10.84 1.90 2010 10.93 9.08 1.85 1.83 1.90 -0.07 12.76 10.99 1.78 2011 10.97 9.23 1.74 1.83 1.93 -0.10 12.80 11.16 1.64 2012 10.99 9.41 1.58 1.84 1.96 -0.13 12.82 11.37 1.45 2015 11.04 10.17 0.86 1.84 2.01 -0.16 12.88 12.18 0.70 2020 11.14 11.81 -0.67 1.85 2.11 -0.26 12.99 13.92 -0.93 2025 11.24 13.31 -2.08 1.85 2.30 -0.45 13.09 15.61 -2.52 2030 11.32 14.52 -3.20 1.86 2.36 -0.50 13.18 16.88 -3.70 2035 11.37 15.17 -3.80 1.86 2.37 -0.51 13.23 17.54 -4.31 2040 11.39 15.32 -3.93 1.86 2.43 -0.57 13.26 17.76 -4.50 2045 11.41 15.38 -3.97 1.87 2.52 -0.66 13.27 17.91 -4.63 2050 11.43 15.61 -4.18 1.87 2.58 -0.71 13.30 18.18 -4.89 2055 11.46 15.97 -4.52 1.87 2.59 -0.72 13.32 18.57 -5.24 2060 11.48 16.31 -4.83 1.87 2.57 -0.70 13.35 18.88 -5.53 2065 11.50 16.56 -5.06 1.87 2.59 -0.72 13.37 19.15 -5.79 2070 11.52 16.85 -5.33 1.87 2.62 -0.75 13.39 19.47 -6.08 2075 11.54 17.15 -5.62 1.87 2.64 -0.77 13.41 19.79 -6.38 2080 11.55 17.45 -5.89 1.87 2.65 -0.77 13.43 20.09 -6.67 Source: Board of Trustees (2003; intermediate assumptions).
1-61
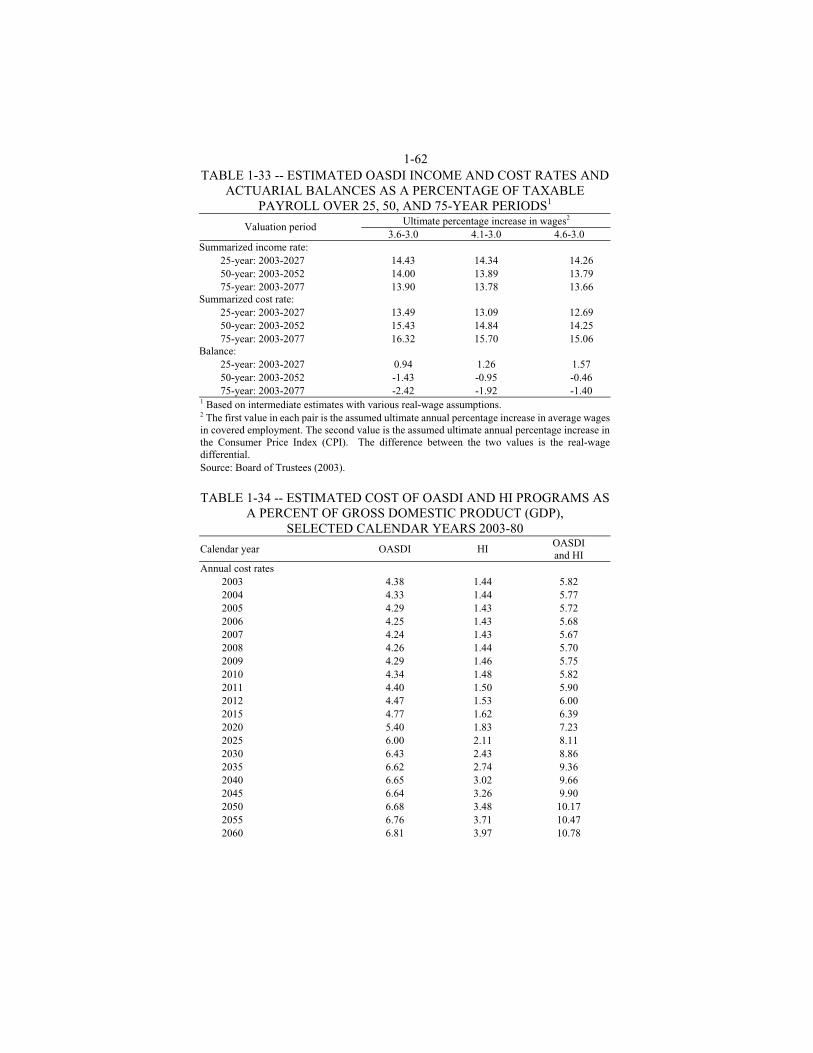
1-62 TABLE 1-33 -- ESTIMATED OASDI INCOME AND COST RATES AND
ACTUARIAL BALANCES AS A PERCENTAGE OF TAXABLE PAYROLL OVER 25, 50, AND 75-YEAR PERIODS1
Ultimate percentage increase in wages2 Valuation period 3.6-3.0 4.1-3.0 4.6-3.0
Summarized income rate: 25-year: 2003-2027 14.43 14.34 14.26 50-year: 2003-2052 14.00 13.89 13.79 75-year: 2003-2077 13.90 13.78 13.66
Summarized cost rate: 25-year: 2003-2027 13.49 13.09 12.69 50-year: 2003-2052 15.43 14.84 14.25 75-year: 2003-2077 16.32 15.70 15.06
Balance: 25-year: 2003-2027 0.94 1.26 1.57 50-year: 2003-2052 -1.43 -0.95 -0.46 75-year: 2003-2077 -2.42 -1.92 -1.40
1 Based on intermediate estimates with various real-wage assumptions. 2 The first value in each pair is the assumed ultimate annual percentage increase in average wages in covered employment. The second value is the assumed ultimate annual percentage increase in the Consumer Price Index (CPI). The difference between the two values is the real-wage differential. Source: Board of Trustees (2003). TABLE 1-34 -- ESTIMATED COST OF OASDI AND HI PROGRAMS AS
A PERCENT OF GROSS DOMESTIC PRODUCT (GDP), SELECTED CALENDAR YEARS 2003-80
Calendar year OASDI HI OASDI and HI
Annual cost rates 2003 4.38 1.44 5.82 2004 4.33 1.44 5.77 2005 4.29 1.43 5.72 2006 4.25 1.43 5.68 2007 4.24 1.43 5.67 2008 4.26 1.44 5.70 2009 4.29 1.46 5.75 2010 4.34 1.48 5.82 2011 4.40 1.50 5.90 2012 4.47 1.53 6.00 2015 4.77 1.62 6.39 2020 5.40 1.83 7.23 2025 6.00 2.11 8.11 2030 6.43 2.43 8.86 2035 6.62 2.74 9.36 2040 6.65 3.02 9.66 2045 6.64 3.26 9.90 2050 6.68 3.48 10.17 2055 6.76 3.71 10.47 2060 6.81 3.97 10.78

1-63
TABLE 1-34 -- ESTIMATED COST OF OASDI AND HI PROGRAMS AS A PERCENT OF GROSS DOMESTIC PRODUCT (GDP),
SELECTED YEARS 2003-2080- continued
Calendar year OASDI HI OASDI and HI
2065 6.85 4.26 11.10 2070 6.89 4.58 11.47 2075 6.94 4.91 11.85 2080 6.98 5.26 12.24
Summarized cost rates 2003-2027 5.13 1.76 6.89 2003-2052 5.71 2.26 7.97 2003-2077 5.95 2.70 8.65
Note- Summarized rates are calculated on the present value basis including the value of the trust funds in the first year and the cost of reaching and maintaining a target trust fund level of 1 year's expenditures by the last year. Source: Board of Trustees (2003; intermediate assumptions).
TABLE 1-35 -- POPULATION, WORK FORCE, AND OASDI
BENEFICIARY DATA AND DEPENDENCY RATIOS, SELECTED YEARS 1960-2040
Work force measure 1960 1980 2000 2020 2040 Total population (in millions) 190 235 291 343 378 Covered workers (in millions) 73 114 154 175 188 OASDI beneficiaries (in millions) 14 35 45 68 91 Worker/beneficiary ratio 5.1 3.2 3.4 2.6 2.1 Aged dependency ratio1 0.173 0.195 0.209 0.272 0.369 Total dependency ratio2 0.905 0.749 0.695 0.714 0.803 1 Ratio of the number of persons 65 and older to the number of persons 20-64. 2 Ratio of the number of persons 65 and older plus the number of persons under 20, to the number of persons 20-64. Source: Board of Trustees (2003; intermediate assumptions).
TABLE 1-36 -- FERTILITY, DEATH RATE, AND PERIOD1 LIFE EXPECTANCY ASSUMPTIONS, SELECTED YEARS 1940-2080
Period life expectancy at birth
Period life expectancy at age 65 Calendar
year
Total fertility rate (per woman)
Age-sex adjusted death
rate (per 100,000) Male Female Male Female
1940 2.23 1,672.6 61.4 65.7 11.9 13.4 1945 2.42 1,488.6 62.9 68.4 12.6 14.4 1950 3.03 1,339.9 65.6 71.1 12.8 15.1 1955 3.50 1,243.0 66.7 72.8 13.1 15.6 1960 3.61 1,237.9 66.7 73.2 12.9 15.9 1965 2.88 1,210.8 66.8 73.8 12.9 16.3 1970 2.43 1,138.4 67.2 74.9 13.1 17.1 1975 1.77 1,020.9 68.7 76.6 13.7 18.0 1980 1.82 961.1 69.9 77.5 14.0 18.4 1985 1.84 912.3 71.1 78.2 14.4 18.6
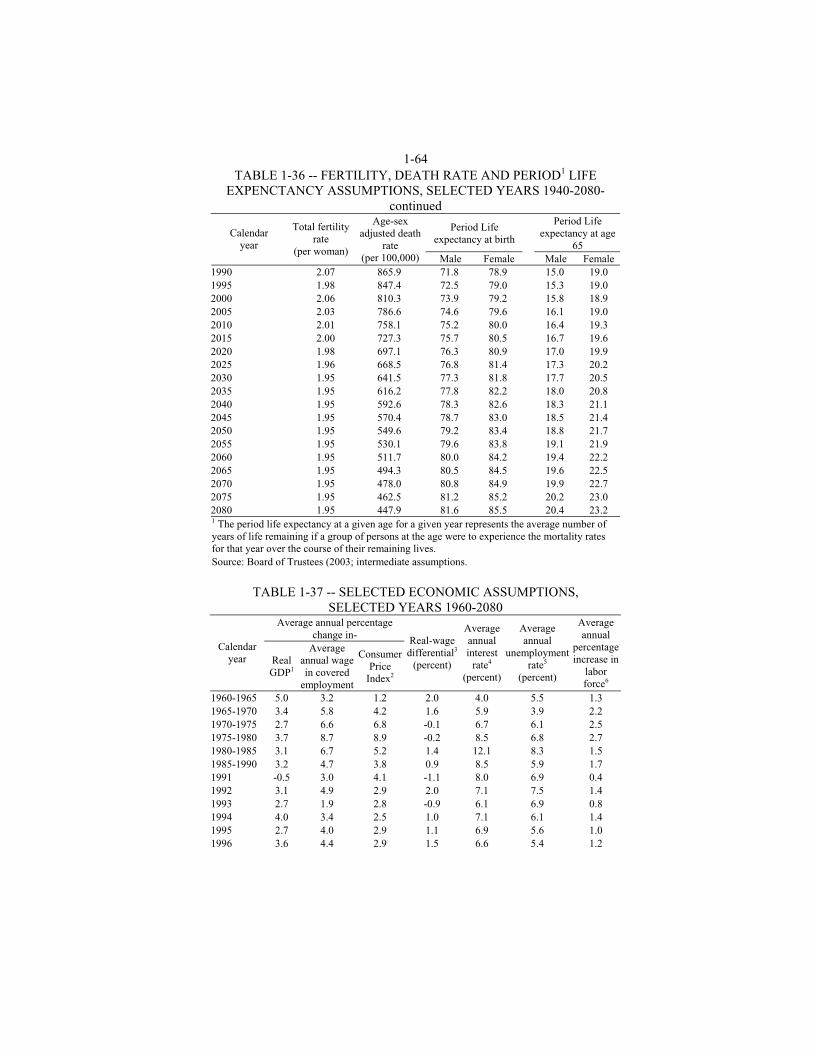
1-64 TABLE 1-36 -- FERTILITY, DEATH RATE AND PERIOD1 LIFE
EXPENCTANCY ASSUMPTIONS, SELECTED YEARS 1940-2080- continued
Period Life expectancy at birth
Period Life
expectancy at age 65
Calendar year
Total fertility rate
(per woman)
Age-sex adjusted death
rate (per 100,000) Male Female Male Female
1990 2.07 865.9 71.8 78.9 15.0 19.0 1995 1.98 847.4 72.5 79.0 15.3 19.0 2000 2.06 810.3 73.9 79.2 15.8 18.9 2005 2.03 786.6 74.6 79.6 16.1 19.0 2010 2.01 758.1 75.2 80.0 16.4 19.3 2015 2.00 727.3 75.7 80.5 16.7 19.6 2020 1.98 697.1 76.3 80.9 17.0 19.9 2025 1.96 668.5 76.8 81.4 17.3 20.2 2030 1.95 641.5 77.3 81.8 17.7 20.5 2035 1.95 616.2 77.8 82.2 18.0 20.8 2040 1.95 592.6 78.3 82.6 18.3 21.1 2045 1.95 570.4 78.7 83.0 18.5 21.4 2050 1.95 549.6 79.2 83.4 18.8 21.7 2055 1.95 530.1 79.6 83.8 19.1 21.9 2060 1.95 511.7 80.0 84.2 19.4 22.2 2065 1.95 494.3 80.5 84.5 19.6 22.5 2070 1.95 478.0 80.8 84.9 19.9 22.7 2075 1.95 462.5 81.2 85.2 20.2 23.0 2080 1.95 447.9 81.6 85.5 20.4 23.2 1 The period life expectancy at a given age for a given year represents the average number of years of life remaining if a group of persons at the age were to experience the mortality rates for that year over the course of their remaining lives. Source: Board of Trustees (2003; intermediate assumptions.
TABLE 1-37 -- SELECTED ECONOMIC ASSUMPTIONS,
SELECTED YEARS 1960-2080 Average annual percentage
change in- Calendar
year Real GDP1
Average annual wage in covered
employment
Consumer Price
Index2
Real-wage differential3
(percent)
Average annual interest
rate4
(percent)
Average annual
unemployment rate5
(percent)
Average annual
percentage increase in
labor force6
1960-1965 5.0 3.2 1.2 2.0 4.0 5.5 1.3 1965-1970 3.4 5.8 4.2 1.6 5.9 3.9 2.2 1970-1975 2.7 6.6 6.8 -0.1 6.7 6.1 2.5 1975-1980 3.7 8.7 8.9 -0.2 8.5 6.8 2.7 1980-1985 3.1 6.7 5.2 1.4 12.1 8.3 1.5 1985-1990 3.2 4.7 3.8 0.9 8.5 5.9 1.7 1991 -0.5 3.0 4.1 -1.1 8.0 6.9 0.4 1992 3.1 4.9 2.9 2.0 7.1 7.5 1.4 1993 2.7 1.9 2.8 -0.9 6.1 6.9 0.8 1994 4.0 3.4 2.5 1.0 7.1 6.1 1.4 1995 2.7 4.0 2.9 1.1 6.9 5.6 1.0 1996 3.6 4.4 2.9 1.5 6.6 5.4 1.2

1-65
TABLE 1-37 -- SELECTED ECONOMIC ASSUMPTIONS, SELECTED YEARS 1960-2080- continued
Average annual percentage change in-
Calendar year Real
GDP1
Average annual wage in covered
employment
Consumer Price
Index2
Real-wage differential3
(percent)
Average annual interest
rate4 (percent)
Average annual
unemployment rate5
(percent)
Average annual
percentage increase in labor force6
1997 4.4 5.9 2.3 3.6 6.6 4.9 1.8 1998 4.3 6.1 1.3 4.8 5.6 4.5 1.0 1999 4.1 5.5 2.2 3.3 5.9 4.2 1.2 2000 3.8 6.2 3.5 2.7 6.2 4.0 1.1 2001 0.3 1.8 2.7 -0.9 5.2 4.8 0.7 2002 2.4 1.9 1.4 0.5 4.9 5.8 0.5 2003 2.9 3.9 2.4 1.5 5.1 6.0 1.3 2004 3.6 4.4 2.4 2.0 6.2 5.9 1.2 2005 3.5 4.3 2.7 1.6 6.3 5.7 1.2 2006 3.2 4.3 2.9 1.4 6.4 5.6 1.1 2007 3.0 4.4 3.0 1.4 6.3 5.5 1.1 2008 2.8 4.3 3.0 1.3 6.2 5.5 1.0 2009 2.6 4.3 3.0 1.3 6.1 5.5 0.9 2010 2.5 4.2 3.0 1.2 6.0 5.5 0.8 2011 2.4 4.2 3.0 1.2 6.0 5.5 0.7 2012 2.2 4.1 3.0 1.1 6.0 5.5 0.6 2015 2.0 4.1 3.0 1.1 6.0 5.5 0.4 2020 1.9 4.1 3.0 1.1 6.0 5.5 0.3 2030 1.9 4.1 3.0 1.1 6.0 5.5 0.3 2040 1.9 4.1 3.0 1.1 6.0 5.5 0.3 2050 1.8 4.1 3.0 1.1 6.0 5.5 0.2 2060 1.8 4.1 3.0 1.1 6.0 5.5 0.2 2070 1.8 4.1 3.0 1.1 6.0 5.5 0.2 2080 1.8 4.1 3.0 1.1 6.0 5.5 0.2 1 The real gross domestic product (GDP) is the value of total output of goods and services, expressed in 1996 dollars. 2 The Consumer Price Index (CPI) is the annual average value for the calendar year of the Consumer Price Index for Urban Wage Earners and Clerical Workers (CPI-W). 3 The real-wage differential is the difference between the percentage increases, before rounding, in the average annual wage in covered employment, and the average annual Consumer Price Index (CPI). 4 The average annual interest rate is the average of the nominal interest rates, which, in practice, are compounded semiannually, for special public-debt obligations issuable to the trust funds in each of the 12 months of the year. 5 Unadjusted civilian unemployment rates are shown through 2012 Thereafter, the rates are adjusted to the age-sex distribution of the civilian labor force in 2001. 6 The U.S. civilian labor force concept is used here. Source: Board of Trustees (2003; intermediate assumptions).

1-66
TABLE 1-38 -- NET ADMINISTRATIVE EXPENSES AND ADMINISTRATIVE EXPENSES AS A PERCENTAGE OF BENEFIT
PAYMENTS, FISCAL YEARS 1998-2002 [Dollars in billions]
Administrative expenses as a percentage of benefit payments paid from: Fiscal
year
Total administrative
expenses OASI Trust fund
DI Trust fund
Combined Trust funds
1998 $3.60 0.6 3.3 1.0 1999 3.36 0.6 3.0 0.9 2000 3.60 0.6 3.0 0.9 2001 3.83 0.6 3.0 0.9 2002 4.12 0.6 3.1 0.9 Source: Office of the Chief Actuary, Social Security Administration.
DISABILITY PROGRAM DATA
TABLE 1-39 -- NUMBER OF DISABILITY INSURANCE (DI)
BENEFICIARIES, SELECTED YEARS 1960-2002 Year Disabled workers Spouses Children Total
1960 455,371 76,599 155,481 687,451 1965 988,074 193,362 557,615 1,739,051 1970 1,492,948 283,447 888,600 2,664,995 1975 2,488,774 452,922 1,410,504 4,352,200 1980 2,861,253 462,204 1,358,715 4,682,172 1985 2,656,500 305,528 945,141 3,907,169 1990 3,011,294 265,528 988,797 4,265,981 1995 4,185,263 263,539 1,408,854 5,857,656 1996 4,385,623 223,854 1,462,557 6,072,034 1997 4,508,134 206,959 1,437,946 6,153,039 1998 4,698,319 189,843 1,446,408 6,334,570 1999 4,879,455 176,299 1,467,976 6,523,730 2000 5,042,334 165,123 1,465,905 6,673,362 2001 5,274,183 156,899 1,482,161 6,913,243 2002 5,543,981 151,614 1,525,673 7,221,268 Source: Office of Research, Evaluation and Statistics, Social Security Administration.
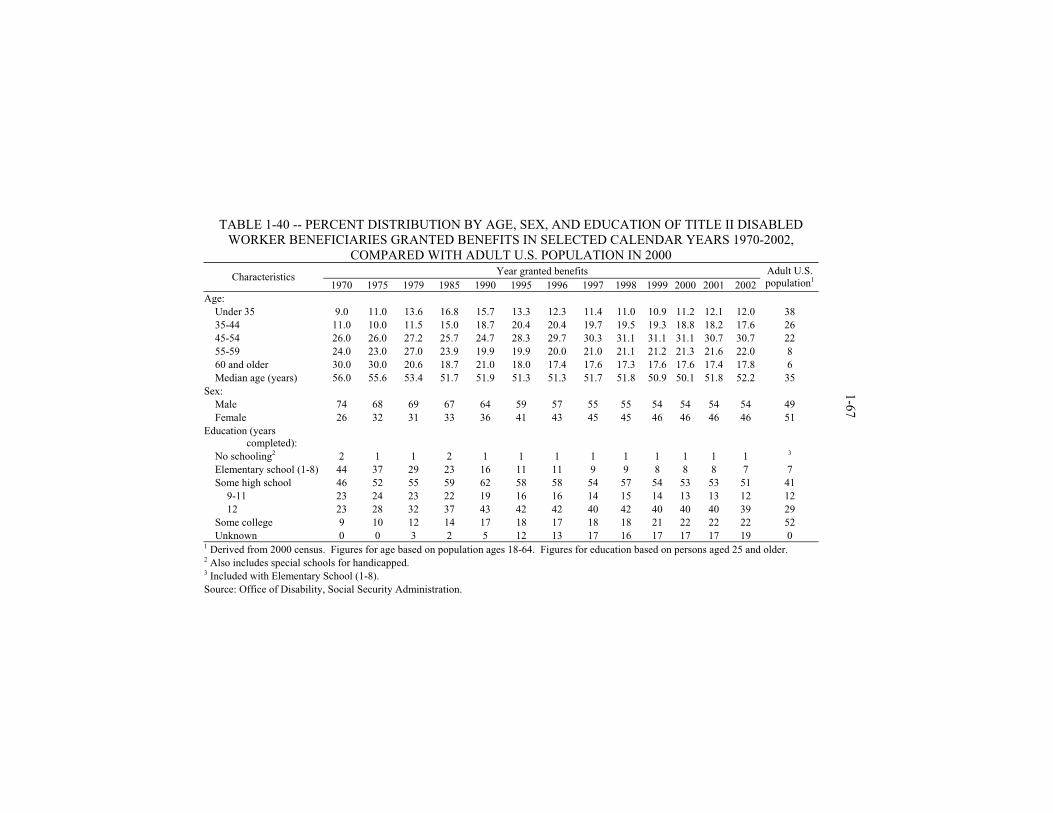
TABLE 1-40 -- PERCENT DISTRIBUTION BY AGE, SEX, AND EDUCATION OF TITLE II DISABLED
WORKER BENEFICIARIES GRANTED BENEFITS IN SELECTED CALENDAR YEARS 1970-2002, COMPARED WITH ADULT U.S. POPULATION IN 2000
Year granted benefits Characteristics 1970 1975 1979 1985 1990 1995 1996 1997 1998 1999 2000 2001 2002
Adult U.S. population1
Age: Under 35 9.0 11.0 13.6 16.8 15.7 13.3 12.3 11.4 11.0 10.9 11.2 12.1 12.0 38 35-44 11.0 10.0 11.5 15.0 18.7 20.4 20.4 19.7 19.5 19.3 18.8 18.2 17.6 26 45-54 26.0 26.0 27.2 25.7 24.7 28.3 29.7 30.3 31.1 31.1 31.1 30.7 30.7 22 55-59 24.0 23.0 27.0 23.9 19.9 19.9 20.0 21.0 21.1 21.2 21.3 21.6 22.0 8 60 and older 30.0 30.0 20.6 18.7 21.0 18.0 17.4 17.6 17.3 17.6 17.6 17.4 17.8 6 Median age (years) 56.0 55.6 53.4 51.7 51.9 51.3 51.3 51.7 51.8 50.9 50.1 51.8 52.2 35
Sex: Male 74 68 69 67 64 59 57 55 55 54 54 54 54 49 Female 26 32 31 33 36 41 43 45 45 46 46 46 46 51
Education (years completed):
No schooling2 2 1 1 2 1 1 1 1 1 1 1 1 1 3 Elementary school (1-8) 44 37 29 23 16 11 11 9 9 8 8 8 7 7 Some high school 46 52 55 59 62 58 58 54 57 54 53 53 51 41
9-11 23 24 23 22 19 16 16 14 15 14 13 13 12 12 12 23 28 32 37 43 42 42 40 42 40 40 40 39 29
Some college 9 10 12 14 17 18 17 18 18 21 22 22 22 52 Unknown 0 0 3 2 5 12 13 17 16 17 17 17 19 0
1 Derived from 2000 census. Figures for age based on population ages 18-64. Figures for education based on persons aged 25 and older. 2 Also includes special schools for handicapped. 3 Included with Elementary School (1-8). Source: Office of Disability, Social Security Administration.
1-67
TABLE 1-41 -- PERCENT DISTRIBUTION BY DISABLING CONDITION OF TITLE II DISABLED WORKER BENEFICIARIES GRANTED BENEFITS IN SELECTED CALENDAR YEARS 1970-2002
Year Granted Benefits Disabling condition
1970 1975 1979 1985 1990 1995 2000 2001 2002 Infective and parasitic diseases1 3 1 1 1 6 6 2 2 2 Neoplasms 10 10 14 15 17 16 16 15 14 Allergic, endocrine system, metabolic and nutritional diseases 4 3 3 5 3 5 2 2 2 Mental psychoneurotic and personality disorders 11 11 11 18 23 22 23 24 25 Diseases of the nervous system and sense organs 6 7 8 8 9 8 9 9 9 Circulatory system 31 32 28 19 16 14 13 13 12 Respiratory system 7 7 6 5 5 5 5 5 5 Digestive system 3 3 2 2 2 2 2 2 2 Musculoskeletal 15 17 17 13 12 12 18 20 20 Accidents, poisonings and violence 8 6 6 4 4 3 4 4 4 Other/unknown 2 3 3 11 5 6 6 5 5
Total percent2 100 100 100 100 100 100 100 100 100 1 Beginning in 1990, AIDS/HIV cases are included in this category. 2 May not add to 100 percent due to rounding. Source: Office of Disability, Social Security Administration.
1-68
1-69 TABLE 1-42 -- DISABLED WORKERS' APPLICATIONS, AWARDS,
AWARDS AS A PERCENT OF APPLICATIONS, AND AWARDS PER 1,000 INSURED WORKERS,
SELECTED CALENDAR YEARS 1965-2002 [Number of applications and total awards in thousands]
Calendar year Number of applications
Total awards Awards as a percent of
applications
Awards per 1,000 insured workers
1965 529.3 253.5 47.9 4.7 1970 869.8 350.4 40.3 4.8 1975 1,285.3 592.0 46.1 7.1 1980 1,262.3 396.6 31.4 4.0 1985 1,066.2 377.4 35.4 3.5 1990 1,067.7 468.0 43.8 4.0 1991 1,208.7 536.4 44.4 4.5 1992 1,335.1 636.6 47.7 5.2 1993 1,425.8 635.2 44.6 5.2 1994 1,443.8 631.9 43.8 5.1 1995 1,338.1 645.6 48.3 5.1 1996 1,279.2 624.3 48.8 4.9 1997 1,180.2 587.7 49.8 4.5 1998 1,169.3 608.4 52.0 4.6 1999 1,200.1 620.6 51.7 4.6 2000 1,330.6 621.3 46.7 4.5 2001 1,498.6 690.5 46.1 5.0 2002 1,682.5 750.0 44.6 5.3 Source: Office of the Chief Actuary, Social Security Administration.
TABLE 1-43 -- ADMINISTRATIVE LAW JUDGE DI DECISION
RATES, INITIAL DENIALS AND TERMINATIONS, SELECTED FISCAL YEARS 1980-2002
Fiscal year Dismissed Unfavorable Favorable Total Percent
favorable Initial denials:
1980 7,093 31,703 56,733 95,529 59.4 1985 14,806 61,161 92,118 168,085 54.8 1990 19,297 45,264 127,707 192,268 66.4 1991 19,880 44,594 144,945 209,419 69.2 1992 19,665 48,407 166,661 234,733 71.0 1993 20,190 47,579 171,508 239,277 71.7 1994 23,576 49,110 189,373 262,059 72.3 1995 44,234 65,415 220,558 330,207 66.8 1996 33,367 89,817 237,131 360,315 65.8 1997 53,205 89,689 199,040 341,934 58.2 1998 53,395 90,591 190,182 334,168 56.9 1999 43,228 78,553 181,938 303,719 59.9 2000 24,951 66,460 183,505 274,916 66.7 2001 20,124 58,571 168,675 247,370 68.2 2002 24,793 65,122 200,240 290,155 69.0
Terminations: 1980 1,431 4,197 9,909 15,537 63.8 1985 4,176 2,415 3,126 9,717 32.2 1990 1,166 2,940 4,695 8,801 53.3
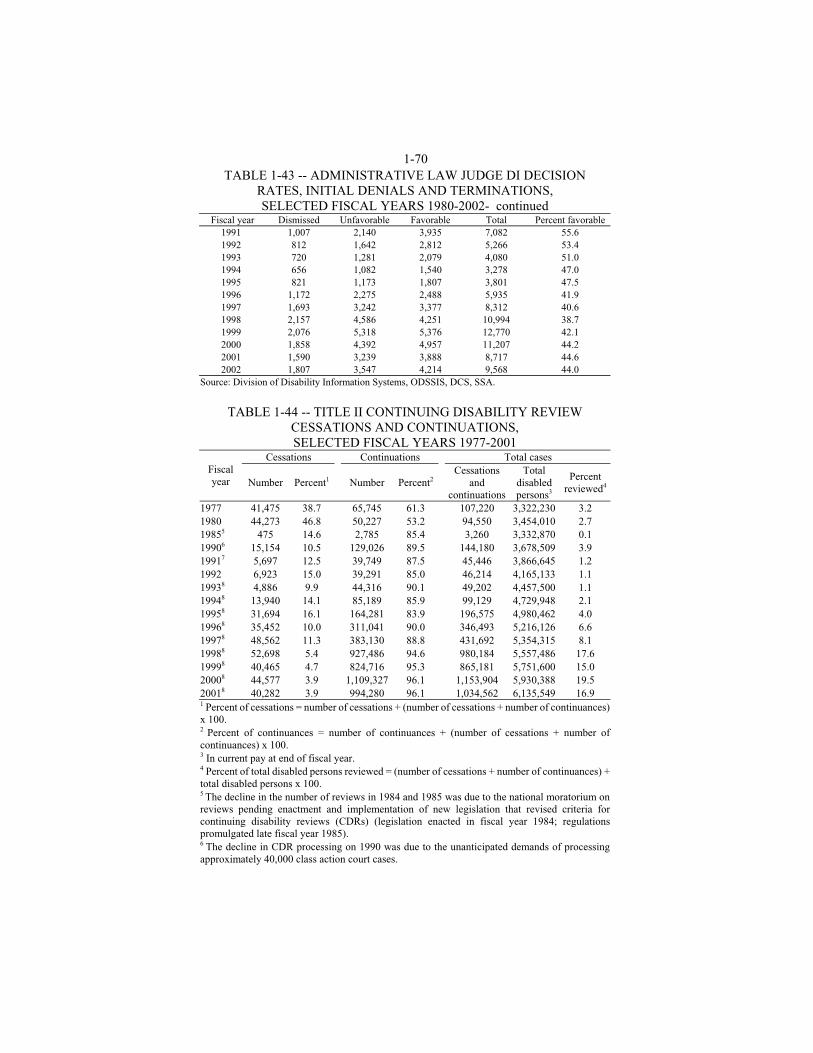
1-70 TABLE 1-43 -- ADMINISTRATIVE LAW JUDGE DI DECISION
RATES, INITIAL DENIALS AND TERMINATIONS, SELECTED FISCAL YEARS 1980-2002- continued
Fiscal year Dismissed Unfavorable Favorable Total Percent favorable 1991 1,007 2,140 3,935 7,082 55.6 1992 812 1,642 2,812 5,266 53.4 1993 720 1,281 2,079 4,080 51.0 1994 656 1,082 1,540 3,278 47.0 1995 821 1,173 1,807 3,801 47.5 1996 1,172 2,275 2,488 5,935 41.9 1997 1,693 3,242 3,377 8,312 40.6 1998 2,157 4,586 4,251 10,994 38.7 1999 2,076 5,318 5,376 12,770 42.1 2000 1,858 4,392 4,957 11,207 44.2 2001 1,590 3,239 3,888 8,717 44.6 2002 1,807 3,547 4,214 9,568 44.0
Source: Division of Disability Information Systems, ODSSIS, DCS, SSA.
TABLE 1-44 -- TITLE II CONTINUING DISABILITY REVIEW
CESSATIONS AND CONTINUATIONS, SELECTED FISCAL YEARS 1977-2001
Cessations Continuations Total cases Fiscal year Number Percent1 Number Percent2
Cessations and
continuations
Total disabled persons3
Percent reviewed4
1977 41,475 38.7 65,745 61.3 107,220 3,322,230 3.2 1980 44,273 46.8 50,227 53.2 94,550 3,454,010 2.7 19855 475 14.6 2,785 85.4 3,260 3,332,870 0.1 19906 15,154 10.5 129,026 89.5 144,180 3,678,509 3.9 19917 5,697 12.5 39,749 87.5 45,446 3,866,645 1.2 1992 6,923 15.0 39,291 85.0 46,214 4,165,133 1.1 19938 4,886 9.9 44,316 90.1 49,202 4,457,500 1.1 19948 13,940 14.1 85,189 85.9 99,129 4,729,948 2.1 19958 31,694 16.1 164,281 83.9 196,575 4,980,462 4.0 19968 35,452 10.0 311,041 90.0 346,493 5,216,126 6.6 19978 48,562 11.3 383,130 88.8 431,692 5,354,315 8.1 19988 52,698 5.4 927,486 94.6 980,184 5,557,486 17.6 19998 40,465 4.7 824,716 95.3 865,181 5,751,600 15.0 20008 44,577 3.9 1,109,327 96.1 1,153,904 5,930,388 19.5 20018 40,282 3.9 994,280 96.1 1,034,562 6,135,549 16.9 1 Percent of cessations = number of cessations + (number of cessations + number of continuances) x 100. 2 Percent of continuances = number of continuances + (number of cessations + number of continuances) x 100. 3 In current pay at end of fiscal year. 4 Percent of total disabled persons reviewed = (number of cessations + number of continuances) + total disabled persons x 100. 5 The decline in the number of reviews in 1984 and 1985 was due to the national moratorium on reviews pending enactment and implementation of new legislation that revised criteria for continuing disability reviews (CDRs) (legislation enacted in fiscal year 1984; regulations promulgated late fiscal year 1985). 6 The decline in CDR processing on 1990 was due to the unanticipated demands of processing approximately 40,000 class action court cases.

1-71 TABLE 1-44 -- TITLE II CONTINUING DISABILITY REVIEW
CESSATIONS AND CONTINUATIONS, SELECTED FISCAL YEARS 1977-2001- continued
7 The continued decline in CDR processing was due to the increase in the initial claims workloads. 8 Includes non-State CDR mailer continuations. Source: Office of Disability, Social Security Administration.
TABLE 1-45 -- DISABILITY CASES PENDING AND WAITING TIMES, FISCAL YEARS 1988-2002
[Cases pending and weeks of work on hand at State Disability Determination Services] Fiscal Year Total cases pending at end of year1 Weeks of work on hand2
1988 407,000 NA 1989 479,000 10.0 1990 538,000 11.7 1991 693,000 12.1 1992 725,000 10.7 1993 717,000 10.4 1994 721,000 10.3 1995 590,000 7.9 1996 702,000 9.8 1997 704,000 8.6 1998 760,000 10.4 1999 770,000 11.1 2000 901,000 12.4 2001 891,000 12.5 20023 934,000 12.3 1 Includes initial claims, reconsiderations, hearing office requests, CDRs and disability hearings. 2 Based on dispositions. 3 Prior to fiscal year (FY) 2002, weeks of work on hand was figured on a rolling 4-week basis; FY 2002 is figured on a 52-week basis. Source: Office of Disability Programs, Social Security Administration, March 2003.

1-72
APPENDIX RELATIONSHIP OF TAXES TO BENEFITS FOR SOCIAL SECURITY RETIREES--HOW LONG IT TAKES TO RECOVER THE VALUE OF
TAXES PAID PLUS INTEREST The issue of the relative value of Social Security benefits, compared to the value of the payroll taxes paid to earn those benefits, is often brought up in discussions of the nature of the program. This comparison is complex and involves many judgments, and is not easily answered with general aggregate numbers. In addition to all the technical factors that must be addressed, the nature of the Social Security law complicates such computations. Not only do analysts disagree on the proper techniques to use in making calculations, there are often fundamental disagreements involving subjective factors: what work patterns to use; what part of the Social Security tax to count; whether to include the employer's share of the tax; and what rate of interest to use. This analysis seeks to avoid judgmental conclusions by providing a range of illustrations that vary these subjective factors. It does not evaluate the “moneysworth” of Social Security (answering whether recipients get a good deal from their investment), nor does it provide an “actuarial analysis” of how whole age cohorts fare. Rather, it simply presents illustrations of the amount of time it takes, and is projected to take, to recover the value of taxes paid plus interest (Table 1-49). The illustrations represent a range of possible payback times, depending on variations in the assumptions used. In this way, no conclusions are made--but the illustrations allow readers to make their own judgments. Many things complicate any determination of the relationship of benefits to taxes for future retirees. For example, although Social Security tax rates and benefit formulas are set by law, they can be changed. Since Congress has modified taxes and benefits many times since the beginning of the program, it is clearly inconsistent with the program's history to calculate taxes and benefits into the future on the assumption that these key elements may not change. Since the program’s outgo is estimated to outstrip its tax revenue by 2018, and the trust fund balances are estimated to be exhausted 39 years from now, changes would become necessary at some point. These changes obviously would affect the relationship of taxes to benefits. However, the nature of future changes is unknown, whereas current law is a given. Therefore, in order to assess the relationship of future taxes and benefits, this analysis uses calculations that are useful in presenting possible outcomes of policies currently incorporated in the law. Calculations of the relationship of benefits to taxes for future retirees involve many key factors. The rate of Social Security taxation is set by law. The portion of the tax that provides cash benefits (Old-Age, Survivors, and Disability Insurance, or OASDI) to employees is 6.2 percent levied on both employees and employers. The old-age and survivors insurance portion of the tax from which retirement benefits are paid, is 5.3 percent, again, on both employees and employers. The tax rate applies to earnings up to a maximum amount. The “maximum taxable earnings” is
1-73 $87,000 in 2003 but will rise in the future at the same rate as average wages in the economy. Therefore, the amount of Social Security taxes an employee will pay under current law is a direct function of her earnings. If one knows the amounts of an individual employee's earnings, and what the maximum taxable earnings are each year, the amount of tax paid is easily calculated. Future initial benefit amounts are also in part a function of one's earnings. Benefits are computed at first eligibility (age 62 for retirement) by a method that indexes both earnings over the worker's career and the benefit formula to changes in average wages in the economy. After age 62, benefits rise in tandem with the cost of living. As these factors are unknown, future benefit amounts cannot be predicted with certainty. Further complicating the issue is the nature of the program. As a “social insurance” program, Social Security has both social and insurance goals. The social-goal features provide a design that deliberately gives a better return on taxes to some workers than to others. For example, the basic formula for calculating Social Security benefits is tilted to replace a higher proportion of earnings for low-paid workers. Also, a complex array of dependents' benefits is available at no additional cost for workers with families. As with insurance, the exact relationship of Social Security benefits received to total taxes paid cannot be predicted for each and every worker. Thus, workers who die before or shortly after retirement and leave no survivors may collect only a few dollars in benefits or perhaps none at all. Other workers may collect Social Security benefits for many years after retirement and receive benefits substantially greater than the value of their Social Security taxes. Workers who become disabled or die at an early age might have paid relatively little in Social Security taxes, but they or their families may receive benefits for many years, recovering the value of the worker's taxes many times. There really is no “typical” Social Security beneficiary with a “typical” work history. An “average” benefit can be the result of many different work histories and thus be based on different amounts of taxes paid. For example, because the benefit formula does not require that all earnings be used in the benefit computation, workers with gaps in their earnings history may receive the same benefits as other workers, but pay less in total taxes. Nevertheless, models can produce projections of future benefits, based on assumptions about wage and price growth, for workers with designated work histories and characteristics. This analysis makes such projections using several assumptions about illustrative workers. It assumes that each worker retires at age 65 in January of the designated year after having worked full time in employment covered by Social Security beginning at age 21. Similarly, all the illustrations reflect three lifetime earnings patterns--workers who always earned (1) the Federal minimum wage; (2) a wage equal to Social Security's “average wage series”; or (3) a wage equal to the maximum amount creditable under Social Security. These work histories and characteristics are necessarily arbitrary. Many variations could be constructed that would alter the payback times. However, by comparing similar examples of workers in what may be considered illustrative
1-74 situations one may make a number of observations without having to resolve all the judgmental questions concerning what constitutes a typical worker or having to provide a voluminous array of illustrations. Calculations are based on the intermediate assumptions of the 2003 Social Security Trustees' Report to forecast wage and price growth. Under these assumptions, wages grow for most of the projected period by 4.1 percent a year, prices by 3.0 percent. Although using common assumptions and focusing on certain examples allows comparisons across generations, there are other factors that can be varied depending on one's view of the Social Security system. Among these is whether to count the employer's share of the payroll tax. Most economists agree that employees pay for the employer's share of the tax in the form of forgone wages or fringe benefits. However, some maintain that employers are actually paying for income maintenance protection that they would have to pay for anyway in one form or another in the absence of the Social Security Program, and that they absorb part of it and pass the rest along to the general public in the form of higher prices. This analysis does not attempt to resolve this debate, but rather presents examples using both assumptions. Another variable subject to the reader's judgment is the proportion of the Social Security tax to apply to retirement benefits. The payroll tax consists of three elements--old-age and survivors insurance (OASI), disability insurance (DI), and hospital insurance (HI). Because the DI and HI Programs have earmarked taxes, their own trust funds, and designated tax rates specified in the law, they are clearly and easily excludable from computations of taxes that pay for retirement benefits. OASI taxes pay for survivor as well as retirement benefits, and it would be inconsistent to include taxes that pay for survivor benefits on the tax side, but not include the value of survivor benefits on the benefit side, in computing payback times. However, there is no separate allocation of taxes in the law for survivor or old-age benefits. It is possible to derive hypothetical year-by-year tax allocations for old-age benefits by assuming that such taxes would be in the same proportion to OASI tax rates as old-age benefits are to OASI benefits for each year. The Social Security Administration's actuaries have year-by-year projections of these benefits and this analysis uses them to compute taxes attributable solely to old-age benefits. A problem with this approach is that the survivor portion of the tax cannot so easily be assigned to a benefit. While the DI and HI taxes protect against risks that really do not involve an element of choice--every worker could become too disabled to work or suffer illness in old age--there is an element of choice in whether a worker has dependents. Nevertheless, the worker still must pay the full OASI tax. An unmarried childless worker can maintain that it is inaccurate to say that only the old-age portion of the OASI tax should be used to compute the payback times of his retirement benefit when the worker is forced to pay a tax (the survivor portion of the OASI tax) for which he currently can derive no benefit. Also, it can be asserted that this approach understates the value of the accumulated taxes because it does not take account of the subsidy provided by workers who die before reaching retirement. However, such a subsidy is theoretical, whereas the
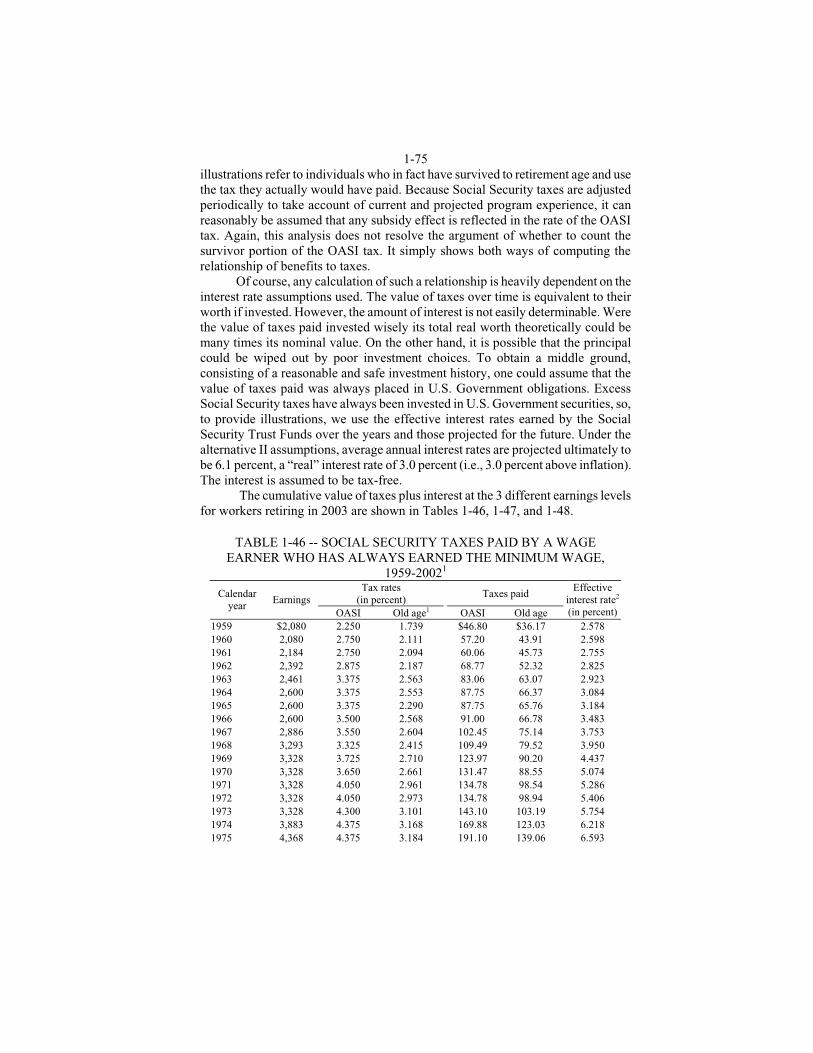
1-75 illustrations refer to individuals who in fact have survived to retirement age and use the tax they actually would have paid. Because Social Security taxes are adjusted periodically to take account of current and projected program experience, it can reasonably be assumed that any subsidy effect is reflected in the rate of the OASI tax. Again, this analysis does not resolve the argument of whether to count the survivor portion of the OASI tax. It simply shows both ways of computing the relationship of benefits to taxes. Of course, any calculation of such a relationship is heavily dependent on the interest rate assumptions used. The value of taxes over time is equivalent to their worth if invested. However, the amount of interest is not easily determinable. Were the value of taxes paid invested wisely its total real worth theoretically could be many times its nominal value. On the other hand, it is possible that the principal could be wiped out by poor investment choices. To obtain a middle ground, consisting of a reasonable and safe investment history, one could assume that the value of taxes paid was always placed in U.S. Government obligations. Excess Social Security taxes have always been invested in U.S. Government securities, so, to provide illustrations, we use the effective interest rates earned by the Social Security Trust Funds over the years and those projected for the future. Under the alternative II assumptions, average annual interest rates are projected ultimately to be 6.1 percent, a “real” interest rate of 3.0 percent (i.e., 3.0 percent above inflation). The interest is assumed to be tax-free. The cumulative value of taxes plus interest at the 3 different earnings levels for workers retiring in 2003 are shown in Tables 1-46, 1-47, and 1-48.
TABLE 1-46 -- SOCIAL SECURITY TAXES PAID BY A WAGE EARNER WHO HAS ALWAYS EARNED THE MINIMUM WAGE,
1959-20021 Tax rates
(in percent) Taxes paid Calendar
year Earnings
OASI Old age1 OASI Old age
Effective interest rate2 (in percent)
1959 $2,080 2.250 1.739 $46.80 $36.17 2.578 1960 2,080 2.750 2.111 57.20 43.91 2.598 1961 2,184 2.750 2.094 60.06 45.73 2.755 1962 2,392 2.875 2.187 68.77 52.32 2.825 1963 2,461 3.375 2.563 83.06 63.07 2.923 1964 2,600 3.375 2.553 87.75 66.37 3.084 1965 2,600 3.375 2.290 87.75 65.76 3.184 1966 2,600 3.500 2.568 91.00 66.78 3.483 1967 2,886 3.550 2.604 102.45 75.14 3.753 1968 3,293 3.325 2.415 109.49 79.52 3.950 1969 3,328 3.725 2.710 123.97 90.20 4.437 1970 3,328 3.650 2.661 131.47 88.55 5.074 1971 3,328 4.050 2.961 134.78 98.54 5.286 1972 3,328 4.050 2.973 134.78 98.94 5.406 1973 3,328 4.300 3.101 143.10 103.19 5.754 1974 3,883 4.375 3.168 169.88 123.03 6.218 1975 4,368 4.375 3.184 191.10 139.06 6.593
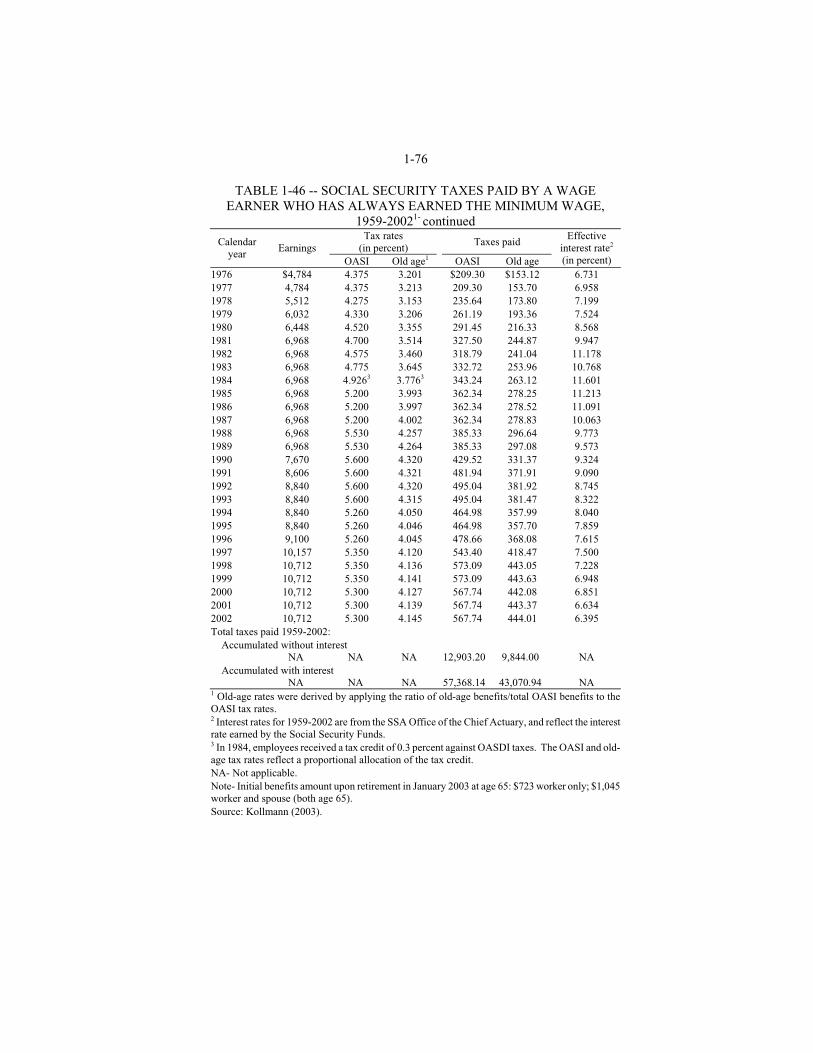
1-76
TABLE 1-46 -- SOCIAL SECURITY TAXES PAID BY A WAGE EARNER WHO HAS ALWAYS EARNED THE MINIMUM WAGE,
1959-20021- continued Tax rates
(in percent) Taxes paid Calendar
year Earnings
OASI Old age1 OASI Old age
Effective interest rate2 (in percent)
1976 $4,784 4.375 3.201 $209.30 $153.12 6.731 1977 4,784 4.375 3.213 209.30 153.70 6.958 1978 5,512 4.275 3.153 235.64 173.80 7.199 1979 6,032 4.330 3.206 261.19 193.36 7.524 1980 6,448 4.520 3.355 291.45 216.33 8.568 1981 6,968 4.700 3.514 327.50 244.87 9.947 1982 6,968 4.575 3.460 318.79 241.04 11.178 1983 6,968 4.775 3.645 332.72 253.96 10.768 1984 6,968 4.9263 3.7763 343.24 263.12 11.601 1985 6,968 5.200 3.993 362.34 278.25 11.213 1986 6,968 5.200 3.997 362.34 278.52 11.091 1987 6,968 5.200 4.002 362.34 278.83 10.063 1988 6,968 5.530 4.257 385.33 296.64 9.773 1989 6,968 5.530 4.264 385.33 297.08 9.573 1990 7,670 5.600 4.320 429.52 331.37 9.324 1991 8,606 5.600 4.321 481.94 371.91 9.090 1992 8,840 5.600 4.320 495.04 381.92 8.745 1993 8,840 5.600 4.315 495.04 381.47 8.322 1994 8,840 5.260 4.050 464.98 357.99 8.040 1995 8,840 5.260 4.046 464.98 357.70 7.859 1996 9,100 5.260 4.045 478.66 368.08 7.615 1997 10,157 5.350 4.120 543.40 418.47 7.500 1998 10,712 5.350 4.136 573.09 443.05 7.228 1999 10,712 5.350 4.141 573.09 443.63 6.948 2000 10,712 5.300 4.127 567.74 442.08 6.851 2001 10,712 5.300 4.139 567.74 443.37 6.634 2002 10,712 5.300 4.145 567.74 444.01 6.395 Total taxes paid 1959-2002: Accumulated without interest
NA NA NA 12,903.20 9,844.00 NA Accumulated with interest
NA NA NA 57,368.14 43,070.94 NA 1 Old-age rates were derived by applying the ratio of old-age benefits/total OASI benefits to the OASI tax rates. 2 Interest rates for 1959-2002 are from the SSA Office of the Chief Actuary, and reflect the interest rate earned by the Social Security Funds. 3 In 1984, employees received a tax credit of 0.3 percent against OASDI taxes. The OASI and old-age tax rates reflect a proportional allocation of the tax credit. NA- Not applicable. Note- Initial benefits amount upon retirement in January 2003 at age 65: $723 worker only; $1,045 worker and spouse (both age 65). Source: Kollmann (2003).
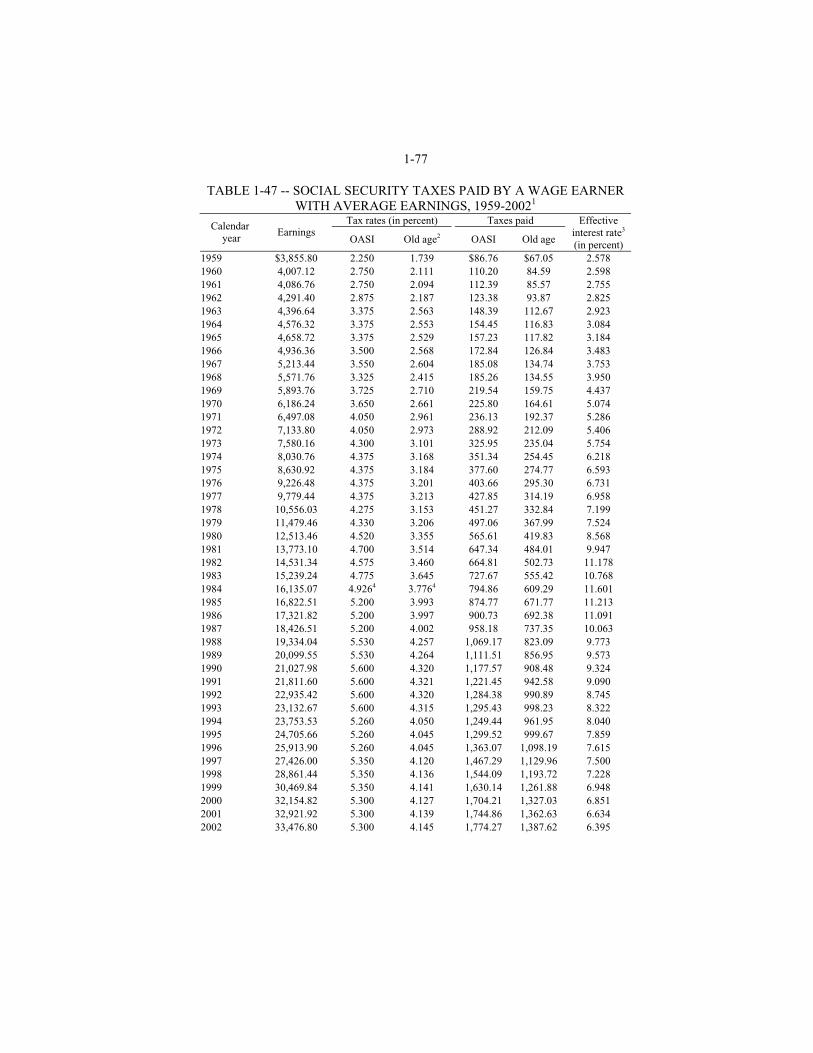
1-77
TABLE 1-47 -- SOCIAL SECURITY TAXES PAID BY A WAGE EARNER WITH AVERAGE EARNINGS, 1959-20021
Tax rates (in percent) Taxes paid Calendar year
Earnings OASI Old age2 OASI Old age
Effective interest rate3 (in percent)
1959 $3,855.80 2.250 1.739 $86.76 $67.05 2.578 1960 4,007.12 2.750 2.111 110.20 84.59 2.598 1961 4,086.76 2.750 2.094 112.39 85.57 2.755 1962 4,291.40 2.875 2.187 123.38 93.87 2.825 1963 4,396.64 3.375 2.563 148.39 112.67 2.923 1964 4,576.32 3.375 2.553 154.45 116.83 3.084 1965 4,658.72 3.375 2.529 157.23 117.82 3.184 1966 4,936.36 3.500 2.568 172.84 126.84 3.483 1967 5,213.44 3.550 2.604 185.08 134.74 3.753 1968 5,571.76 3.325 2.415 185.26 134.55 3.950 1969 5,893.76 3.725 2.710 219.54 159.75 4.437 1970 6,186.24 3.650 2.661 225.80 164.61 5.074 1971 6,497.08 4.050 2.961 236.13 192.37 5.286 1972 7,133.80 4.050 2.973 288.92 212.09 5.406 1973 7,580.16 4.300 3.101 325.95 235.04 5.754 1974 8,030.76 4.375 3.168 351.34 254.45 6.218 1975 8,630.92 4.375 3.184 377.60 274.77 6.593 1976 9,226.48 4.375 3.201 403.66 295.30 6.731 1977 9,779.44 4.375 3.213 427.85 314.19 6.958 1978 10,556.03 4.275 3.153 451.27 332.84 7.199 1979 11,479.46 4.330 3.206 497.06 367.99 7.524 1980 12,513.46 4.520 3.355 565.61 419.83 8.568 1981 13,773.10 4.700 3.514 647.34 484.01 9.947 1982 14,531.34 4.575 3.460 664.81 502.73 11.178 1983 15,239.24 4.775 3.645 727.67 555.42 10.768 1984 16,135.07 4.9264 3.7764 794.86 609.29 11.601 1985 16,822.51 5.200 3.993 874.77 671.77 11.213 1986 17,321.82 5.200 3.997 900.73 692.38 11.091 1987 18,426.51 5.200 4.002 958.18 737.35 10.063 1988 19,334.04 5.530 4.257 1,069.17 823.09 9.773 1989 20,099.55 5.530 4.264 1,111.51 856.95 9.573 1990 21,027.98 5.600 4.320 1,177.57 908.48 9.324 1991 21,811.60 5.600 4.321 1,221.45 942.58 9.090 1992 22,935.42 5.600 4.320 1,284.38 990.89 8.745 1993 23,132.67 5.600 4.315 1,295.43 998.23 8.322 1994 23,753.53 5.260 4.050 1,249.44 961.95 8.040 1995 24,705.66 5.260 4.045 1,299.52 999.67 7.859 1996 25,913.90 5.260 4.045 1,363.07 1,098.19 7.615 1997 27,426.00 5.350 4.120 1,467.29 1,129.96 7.500 1998 28,861.44 5.350 4.136 1,544.09 1,193.72 7.228 1999 30,469.84 5.350 4.141 1,630.14 1,261.88 6.948 2000 32,154.82 5.300 4.127 1,704.21 1,327.03 6.851 2001 32,921.92 5.300 4.139 1,744.86 1,362.63 6.634 2002 33,476.80 5.300 4.145 1,774.27 1,387.62 6.395
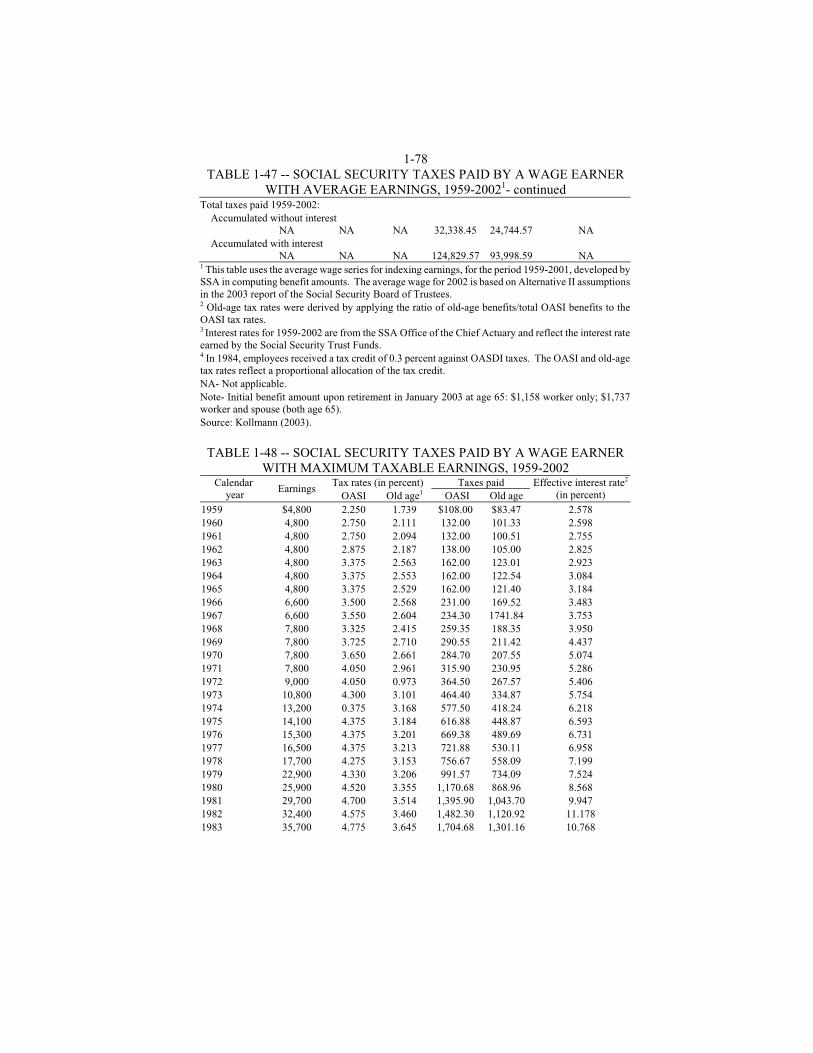
1-78 TABLE 1-47 -- SOCIAL SECURITY TAXES PAID BY A WAGE EARNER
WITH AVERAGE EARNINGS, 1959-20021- continued Total taxes paid 1959-2002: Accumulated without interest
NA NA NA 32,338.45 24,744.57 NA Accumulated with interest
NA NA NA 124,829.57 93,998.59 NA 1 This table uses the average wage series for indexing earnings, for the period 1959-2001, developed by SSA in computing benefit amounts. The average wage for 2002 is based on Alternative II assumptions in the 2003 report of the Social Security Board of Trustees. 2 Old-age tax rates were derived by applying the ratio of old-age benefits/total OASI benefits to the OASI tax rates. 3 Interest rates for 1959-2002 are from the SSA Office of the Chief Actuary and reflect the interest rate earned by the Social Security Trust Funds. 4 In 1984, employees received a tax credit of 0.3 percent against OASDI taxes. The OASI and old-age tax rates reflect a proportional allocation of the tax credit. NA- Not applicable. Note- Initial benefit amount upon retirement in January 2003 at age 65: $1,158 worker only; $1,737 worker and spouse (both age 65). Source: Kollmann (2003).
TABLE 1-48 -- SOCIAL SECURITY TAXES PAID BY A WAGE EARNER WITH MAXIMUM TAXABLE EARNINGS, 1959-2002
Tax rates (in percent) Taxes paid Calendar year
Earnings OASI Old age1 OASI Old age
Effective interest rate2
(in percent) 1959 $4,800 2.250 1.739 $108.00 $83.47 2.578 1960 4,800 2.750 2.111 132.00 101.33 2.598 1961 4,800 2.750 2.094 132.00 100.51 2.755 1962 4,800 2.875 2.187 138.00 105.00 2.825 1963 4,800 3.375 2.563 162.00 123.01 2.923 1964 4,800 3.375 2.553 162.00 122.54 3.084 1965 4,800 3.375 2.529 162.00 121.40 3.184 1966 6,600 3.500 2.568 231.00 169.52 3.483 1967 6,600 3.550 2.604 234.30 1741.84 3.753 1968 7,800 3.325 2.415 259.35 188.35 3.950 1969 7,800 3.725 2.710 290.55 211.42 4.437 1970 7,800 3.650 2.661 284.70 207.55 5.074 1971 7,800 4.050 2.961 315.90 230.95 5.286 1972 9,000 4.050 0.973 364.50 267.57 5.406 1973 10,800 4.300 3.101 464.40 334.87 5.754 1974 13,200 0.375 3.168 577.50 418.24 6.218 1975 14,100 4.375 3.184 616.88 448.87 6.593 1976 15,300 4.375 3.201 669.38 489.69 6.731 1977 16,500 4.375 3.213 721.88 530.11 6.958 1978 17,700 4.275 3.153 756.67 558.09 7.199 1979 22,900 4.330 3.206 991.57 734.09 7.524 1980 25,900 4.520 3.355 1,170.68 868.96 8.568 1981 29,700 4.700 3.514 1,395.90 1,043.70 9.947 1982 32,400 4.575 3.460 1,482.30 1,120.92 11.178 1983 35,700 4.775 3.645 1,704.68 1,301.16 10.768

1-79
TABLE 1-48 -- SOCIAL SECURITY TAXES PAID BY A WAGE EARNER WITH MAXIMUM TAXABLE EARNINGS, 1959-2002- continued
Tax rates (in percent) Taxes paid Calendar year
Earnings OASI Old age1 OASI Old age
Effective interest rate2 (in percent)
1984 37,800 4.9263 3.7763 1,862.03 1,427.40 11.601 1985 39,600 5.200 3.933 2,059.20 1,581.35 11.213 1986 42,000 5.200 3.997 2,184.00 1,678.81 11.091 1987 43,800 5.200 4.002 2,277.60 1,752.70 10.063 1988 45,000 5.530 4.257 2,488.50 1,915.74 9.773 1989 48,000 5.530 4.264 2,654.40 2,046.50 9.573 1990 51,300 5.600 4.320 2,872.80 2,216.34 9.324 1991 53,400 5.600 4.321 2,990.40 2,307.66 9.090 1992 55,500 5.600 4.320 3,108.00 2,397.79 8.745 1993 57,600 5.600 4.315 3,225.60 2,485.57 8.322 1994 60,600 5.260 4.050 3,187.56 2,454.12 8.040 1995 61,200 5.260 4.046 3,219.16 2,476.35 7.859 1996 62,700 5.260 4.045 3,298.02 2,536.14 7.615 1997 65,400 5.350 4.120 3,498.90 2,694.50 7.500 1998 68,400 5.350 4.136 3,659.40 2,829.05 7.228 1999 72,600 5.350 4.141 3,884.10 3,006.65 6.948 2000 76,200 5.300 4.127 4,038.60 3,114.78 6.851 2001 80,400 5.300 4.139 4,261.20 3,327.75 6.634 2002 84,900 5.300 4.145 4,499.70 3,519.12 6.395 Total taxes paid 1959-2002: Accumulated without interest
NA NA NA 72,689.37 55,767.96 NA Accumulated with interest
NA NA NA 235,643.00 178,217.25 NA 1 Old-age tax rates were derived by applying the ratio of old-age benefits/total OASI benefits to the OASI tax rates. 2 Interest rates for 1959-2002 are from the SSA Office of the Chief Actuary and reflect the interest rate earned by the Social Security Trust Funds. 3 In 1984, employees received a tax credit of 0.3 percent against OASDI taxes. The OASI and old-age tax rates reflect a proportional allocation of the tax credit. NA- Not applicable. Note- Initial benefit amount upon retirement in January 2003 at age 65: $1,721 worker only; $2,582 worker and spouse (both age 65). Source: Kollmann (2003).
Table 1-49 shows past and projected payback times for workers retiring in various years from 1940 to 2030. Benefits are for the worker alone. However, the value of the benefit could be higher if the worker had dependents who were eligible for benefits. For example, if these workers had spouses who also were the full retirement age (FRA) and were not entitled to a Social Security benefit on their own account, the value of the monthly benefit would increase by 50 percent. This would shorten the payback times considerably. While these illustrations do not address the “moneysworth” question, they do show the relationship of payback times of past, current, and future beneficiaries. It is apparent that past retirees quickly recovered the value of their taxes. Payback times have lengthened for workers retiring today, but they are still shorter than

1-80 those projected for future retirees. This decline in value is ameliorated somewhat (especially for low-income workers) by the projection that future retirees are expected to live longer, and thus collect benefits longer. Table 1-50 shows the life expectancies for people turning age 65 in the illustrated years. Defenders of Social Security tend to discount the phenomenon of lengthening payback times, arguing that the program serves social ends that transcend calculations of which individuals, or generations, obtain some sort of balance-sheet profit or loss. They point out that pay-as-you-go retirement systems such as Social Security by their nature often provide large returns on the contributions of the initial generations. In the early years of such programs, the ratio of workers to recipients is very high, allowing tax or contribution rates to be low. As the program matures, rates rise to reflect the increase in the number of beneficiaries. This feature is not unique to Social Security. Establishing benefit levels for early recipients in excess of what contributions would dictate also is found in private pension systems. Furthermore, proponents of Social Security note that providing “adequate” benefits to initial Social Security recipients that were essentially “unearned” in relation to their contributions to the system was deliberate social policy. Providing a minimum level of protection to the first workers to participate in the system was considered more important, in a period of economic depression, than concerns about excessive rates of return on taxes paid. Besides, the social benefits of giving a measure of economic independence for the elderly, and later for surviving spouses, and the disabled, are believed by many to be immense. Thus, some argue younger workers are in large part relieved from the financial burden of supporting their parents, and the elderly are afforded an opportunity to live independently and with dignity. Critics of Social Security point to these social welfare features as a basic flaw in the program. They argue that by combining the goals of social adequacy, which is welfare-related, with individual equity, which loosely ties benefits to taxes paid, the program has become a mishmash that accomplishes neither goal well and creates inequities. One inequity they cite is that future beneficiaries will receive retirement benefits inferior to those that the equivalence of their taxes could purchase in the private sector. They also say when interest is included, many workers (for example, those earning at least average wages; see Table 1-49) will not recoup what they and their employer paid in taxes. Often buttressing these arguments are calculations that show what individuals could receive if their Social Security taxes were invested privately. This latter argument is dependent on the interest rate assumed on private investment. Arriving at the “proper” interest rate is problematic. Those who project high investment returns often refer to the historical performance of the stock market, showing that a portfolio of broad-based stocks would have earned on average substantial rates of return over the years, and that this performance can be expected to recur in the future. On the other hand, private investments have an element of risk that critics believe should be unacceptable in providing a national system of retirement

1-81 income, and that if a safe-as-possible mix of investment vehicles were used instead, projected rates of return would be smaller. They also contend that recently real interest rates dropped dramatically and may not return to the high levels of the 1980s and 1990s. The key point for the reader is to be aware of the influence exerted by the projected rate of return in these sorts of calculations, and the large degree to which the argument about the value of Social Security hinges around it.
TABLE 1-49 -- NUMBER OF YEARS TO RECOVER TAXES PLUS INTEREST FOR VARIOUS WORKERS RETIRING AT AGE 65,1
SELECTED YEARS 1940-2030
Year of retirement Minimum
earner Average earner
Maximum earner
Illustration 1: Years to recover employee's OASI taxes 1940 2 0.1 0.2 1960 0.5 0.8 1.0 1980 1.5 2.0 2.1 2000 7.3 10.5 14.1 2010 9.0 13.2 18.8 2020 9.2 14.1 22.7 2030 8.2 13.8 23.9
Illustration 2: Years to recover combined employee-employer OASI taxes 1940 2 0.2 0.4 1960 1.0 1.6 2.0 1980 3.0 3.9 4.4 2000 17.0 26.3 39.8 2010 21.4 35.3 64.9 2020 22.0 38.7 129.9 2030 19.0 37.5 3
Illustration 3: Years to recover retirement portion of employee's OASI taxes 1940 2 0.1 0.2 1960 0.4 0.6 0.7 1980 1.1 1.4 1.6 2000 5.3 7.5 10.0 2010 6.5 9.5 13.2 2020 6.8 10.3 16.1 2030 6.3 10.4 17.4
Illustration 4: Years to recover retirement portion of combined employee-employer OASI taxes 1940 2 0.2 0.4 1960 0.7 1.1 1.4 1980 2.2 2.8 3.1 2000 11.8 17.5 24.9 2010 14.7 22.7 35.3 2020 15.5 25.2 47.7 2030 14.1 25.6 55.0 1 Under the Alternative II assumptions and taking into account benefit increases and continued accrual of interest after retirement but not the taxation of benefits. The retiree is assumed to attain age 65 and retire in January of the designated year. The current law increases in the retirement age is reflected. 2 Less than 0.1 years. 3 Infinite. Source: Kollmann (2003)