section 1 - ministry of internal affairs and communications · cdma format 3g mobile phone, and the...
TRANSCRIPT

Ch
ap
te
r1
6
1. Advances in NetworkInfrastructure
(1) Broadband at the World's Highest LevelsThe number of broadband subscribers (including
FTTH, DSL, cable Internet, and wireless (such asFWA)) reached 14.95 million at the end of fiscal 2003(Figure 1-1-1). The number of DSL subscribers, whouse special modems connected to telephone lines, was11.20 million at the end of fiscal 2003 and is a drivingforce being the expansion of broadband services. Thenumber of cable Internet subscribers, who use cable tele-vision networks to connect to the Internet, was 2.58 mil-lion at the end of fiscal 2003 and is increasing steadily.FTTH is a an ultra-high speed network that boasts com-munications speeds faster than DSL and cable Internet,and the number of subscribers at the end of fiscal 2003
was 1.14 million, a 3.7-fold increase from the 310,000subscribers at the end of the previous year.
The number of broadband users at the end of 2003 isestimated to have been 26.07 million (a 33.4% increaseover the previous year and a 20.4% penetration rate).Broadband users account for 33.7% of the total popula-tion of Internet users of 77.3 million. Thus, more thanone in three Internet users access the Internet by broad-band.
The percentage of households that use broadband toaccess the Internet from a home PC increased from29.6% at the end of 2002 to 47.8% at the end of 2003, anincrease of 18.2 points in just one year. A total of 61.7%of households use always-on Internet connectionsincluding broadband and always-on ISDN. In contrast,the percentage of households that use dial-up ISDN ortelephone connections decreased from 56.1% to 38.4%,down 17.7 points from the previous year (Figure 1-1-2).
Section 1Advances in Network Infrastructure
�
�
�
�
��
��
0.22
0.00020.22
������ ����� ���� � ��������� �����������
����
0.86
0.00020.0009
0.780.071
����
3.870.0080.0261.46
2.38
����
9.43
7.02
2.070.310.03
����
0.0314.95
11.20
2.58
1.14
����
����� ���
���� ��������
�������� ���������
� ����� � �!�
�
��
��
��
��
��
29.6
������ ���� ������� ��������� ������� ���� ���� � �
�����
47.8
16.8
������������
13.9 11.2
����������
8.2
44.9
��������� �����������
30.2
�� � ���� �� � �����!�
����"�# $�%%���"&���� '�(� ���� ���)��* +,-,�
. �����# ��"��� ��/* "��� �&����&* �������� ���"� � 012�* � ��&�"� ����3

Ch
ap
te
r1
The continuing fall in broadband fees is one factorbehind the rapid proliferation of broadband services. Aninternational comparison of DSL and cable Internet feesconverted to the cost per 100 kbps reveals that fees inJapan at the world's lowest levels (Figure 1-1-3).
An international comparison of broadband penetra-tion in 2002 shows that Japan is third in terms of thenumber of subscribers behind the United States (19.88million subscribers) and the Republic of Korea (10.13million subscribers). The Republic of Korea has thehighest broadband penetration rate at 21.3%. Japan is inninth place (Figure 1-1-4).
(2) Development of Mobile Internet(i) Increased use of the Internet from mobile phones
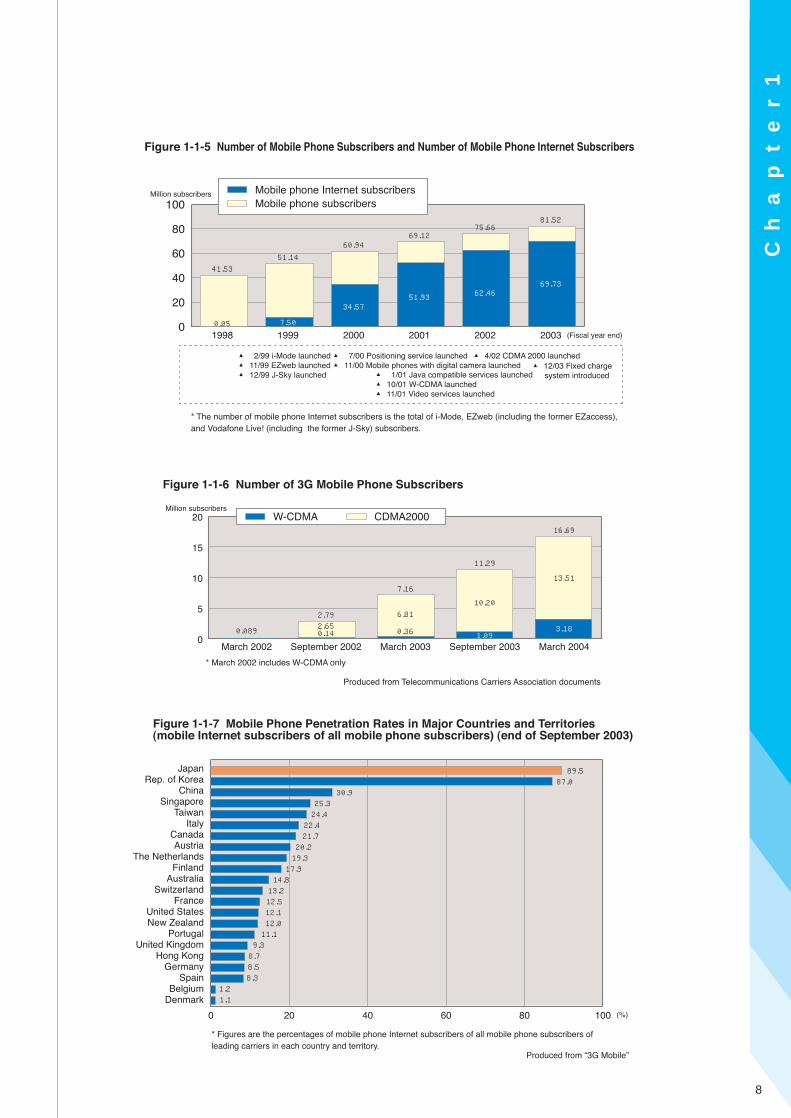
The number of mobile phone subscribers in Japanexceeded 80 million in January 2004, reaching 81.52million at the end of fiscal 2003. Of those, 69.73 millionwere mobile phone Internet subscribers (i.e., subscribersto Internet service that use mobile phones) (Figure 1-1-5).
(ii) Increase in 3G mobile phones and advanced func-tions
Standardization and development of systems for thepractical application of third-generation (3G) mobilephones is advancing rapidly in Japan. In October 2001the NTT DoCoMo Group introduced the world's first W-CDMA format 3G mobile phone, and the KDDI Groupbegan CDMA 2000 services in April 2002 while J-Phone (currently Vodafone) began W-CDMA servicesin December 2002. The number of 3G mobile phonesubscribers reached 16.69 million at the end of fiscal2003 and continues to increase steadily (Figure 1-1-6).
(iii) International Comparison of Mobile Internet UseAn international comparison of the percentage of
mobile phone Internet subscribers of all mobile phonesubscribers of leading carriers in various countries andterritories reveals that Japan's rate of 89.5% is theworld's highest followed by the Republic of Korea andChina. Thus, Asia is a driving force behind the increasein mobile Internet use (Figure 1-1-7).
7
������ ���� ����� ���� � ���� ����� �� ��� � ��� �� �� ����������� ������������� ��� ��� ��� ��� ��� ������
���
�������� �� ��� �
Canada
Japan
Rep.of Korea
United StatesTaiwan
GermanyUnited Kingdom
France
� ����� �� ��� ����� ���� �� �� �� �� � �������� ���
� � �� �� ���
�
��
��
��
��
Belguim
IcelandDenmark
SwedenThe Netherlands
Hong Kong
�
�
�
�
�
�
0.09
������ ���� ����� ���� � ���� ����� �� ��� �� �� ���� ����� ��� ��� ����� ���� ���
����
0.25
��� � � ���
1.15
�������
1.27
� �� �
2.21
����� ��
2.71
���������
3.07
����
3.25
�����
3.36
����!������"
3.53
#�!���!�!�"
4.42
$����%
&' ����"(
)� ��*�� �� � ���!� � �� ��+��, - #
. � �����" � ���" ��� ��� /+�" +�"�� !�� "��0�*� "����"
�� "��0�*� ���" � '�1 �� *�+�� -!���! � ��*� * �!�%�
Ch
ap
te
r1
8
������� �� ��
������ ���� ����� � � ���� �� �� ����������� ��� ����� � � ���� �� �� �������� �����������
������� ��������
�
��
��
��
��
���
0.05
41.53
� �� ���� �� ����� ���� ����� �������� �� �� ����� �� � ���! "#$� ���������% �� ��� "#����� !
��� &������ '�() ���������% �� ��� * +,� ��������-
�..�
7.50
51.14
�...
34.57
60.94
����
51.93
69.12
����
62.46
75.66
����
69.73
81.52
���/
����� ���� ����� ��������
����� ���� ��������
▲ �0.. � ��� �������
▲ ��0.. "#$� ������� ▲ ��0.. * +,� �������
▲ 10�� 2���������% �(�� ������� ▲ ��0�� ����� ����� $��� ��%���� ���� �������
▲ �0�� 34�5 ���� �������
▲ ��0�/ ��6� ���%
����� ��������▲ �0�� *�(� ��������� �(��� ������� ▲ ��0�� 7 34�5 ������� ▲ ��0�� &��� �(��� �������
�
�
��
��
��
0.089
������ ���� ����� � �� � ���� �� �� �����������
����� ����
0.142.652.79
�� ����� ����
0.36
6.81
7.16
����� ����
1.09
10.20
11.29
�� ����� ����
16.69
13.51
3.18
����� ����
������� �����������
�������� ���� ������������� ���� �������� ������� ��� ������� �
� ����� ���� �������� � �!�� ���"
� �!�� �!������
89.587.0
30.925.324.422.421.720.219.317.9
13.212.512.112.011.19.38.78.58.3
1.21.1
������ ���� ��� � ����� ����������� ����� �� ���� ��������� ��� ���������������� � �������� ����������� �� � ���� � ����� ������������ ���� �� �������� !""#�
��������� � ����
� ������������
�����������
�������������
� � ��� �����������������������
�����������������
������ ��������� ������
!������������� �����"
#��� ���$��"���
�����%�����"&��"��'
()*
!������� ��" +,$ -�.���/
0 ������� ��� � � ����������� � "�.��� � ��� �������� ��.����.��� � ��� "�.��� � ��� ��.����.��� �
������� �������� �� ��� ������� ��� ����������
1 21 31 41 51 611
14.8
Ch
ap
te
r1
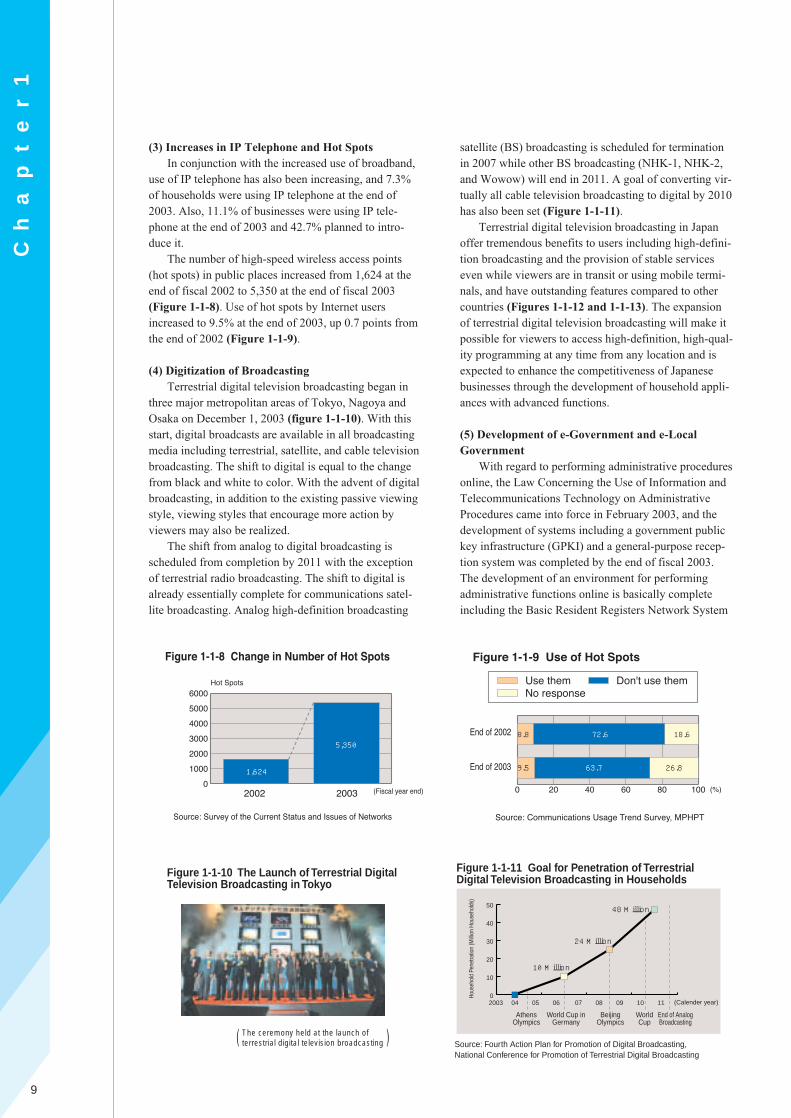
(3) Increases in IP Telephone and Hot SpotsIn conjunction with the increased use of broadband,
use of IP telephone has also been increasing, and 7.3%of households were using IP telephone at the end of2003. Also, 11.1% of businesses were using IP tele-phone at the end of 2003 and 42.7% planned to intro-duce it.
The number of high-speed wireless access points(hot spots) in public places increased from 1,624 at theend of fiscal 2002 to 5,350 at the end of fiscal 2003(Figure 1-1-8). Use of hot spots by Internet usersincreased to 9.5% at the end of 2003, up 0.7 points fromthe end of 2002 (Figure 1-1-9).
(4) Digitization of BroadcastingTerrestrial digital television broadcasting began in
three major metropolitan areas of Tokyo, Nagoya andOsaka on December 1, 2003 (figure 1-1-10). With thisstart, digital broadcasts are available in all broadcastingmedia including terrestrial, satellite, and cable televisionbroadcasting. The shift to digital is equal to the changefrom black and white to color. With the advent of digitalbroadcasting, in addition to the existing passive viewingstyle, viewing styles that encourage more action byviewers may also be realized.
The shift from analog to digital broadcasting isscheduled from completion by 2011 with the exceptionof terrestrial radio broadcasting. The shift to digital isalready essentially complete for communications satel-lite broadcasting. Analog high-definition broadcasting
satellite (BS) broadcasting is scheduled for terminationin 2007 while other BS broadcasting (NHK-1, NHK-2,and Wowow) will end in 2011. A goal of converting vir-tually all cable television broadcasting to digital by 2010has also been set (Figure 1-1-11).
Terrestrial digital television broadcasting in Japanoffer tremendous benefits to users including high-defini-tion broadcasting and the provision of stable serviceseven while viewers are in transit or using mobile termi-nals, and have outstanding features compared to othercountries (Figures 1-1-12 and 1-1-13). The expansionof terrestrial digital television broadcasting will make itpossible for viewers to access high-definition, high-qual-ity programming at any time from any location and isexpected to enhance the competitiveness of Japanesebusinesses through the development of household appli-ances with advanced functions.
(5) Development of e-Government and e-LocalGovernment
With regard to performing administrative proceduresonline, the Law Concerning the Use of Information andTelecommunications Technology on AdministrativeProcedures came into force in February 2003, and thedevelopment of systems including a government publickey infrastructure (GPKI) and a general-purpose recep-tion system was completed by the end of fiscal 2003.The development of an environment for performingadministrative functions online is basically completeincluding the Basic Resident Registers Network System
9
Figure 1-1-10 The Launch of Terrestrial Digital Television Broadcasting in Tokyo
The ceremony held at the launch ofterrestrial digital television broadcasting
������ ���� �� �� � ������ �� ��� �����
��� �����
����� ��� ����
������ ����� �� ��� ������� ������ ��� ������ �� ��������
�
����
����
���
!���
"���
#���
���� ���
1,624
5,3508.8
9.5 63.7 26.8
72.6 18.6
������ ���� �� � ��� �����
������� ������ ��� ����� ���� ������� �����
�� �� ����
�� �� ����
� �� �� �� � !��
��� "�#� ���$���
%�& ��� "�
8.8 72.6 18.6
9.5 63.7 26.8
'()
10 Million
24 Million
48 Million
Figure 1-1-11 Goal for Penetration of Terrestrial Digital Television Broadcasting in Households
Source: Fourth Action Plan for Promotion of Digital Broadcasting, National Conference for Promotion of Terrestrial Digital Broadcasting
0
10
20
30
40
50
2003
AthensOlympics
World Cup inGermany
BeijingOlympics
WorldCup
End of AnalogBroadcasting
04 05 06 07 08 09 10 11 (Calender year)
Hous
ehol
d Pe
netra
tion
(Milli
on H
ouse
hold
s)

becoming fully operational in August of 2003 and thestart of a public personal certification system that oper-ates online, as well as electronic payment services forpayment of taxes and various administrative fees inJanuary 2004. In addition, during fiscal 2003, all localgovernment bodies began participating in the LocalGovernment Wide Area Network (LGWAN).
Using this environment, the online filing of mostapplications and notifications handled by central govern-ment agencies became possible by the end of fiscal 2003including the start of electronic filing of tax returns tothe Nagoya Regional Taxation Bureau (covering Gifu,Shizuoka, Aichi, and Mie Prefectures).
In addition, the MPHPT revised the “Policy Concerningthe Promotion of Computerization Measures by LocalGovernmental Bodies in Response to the IT Revolution”(adopted August 2000) and the “e-Government and e-LocalGovernment Promotion Program” (adopted October 2001)and announced the “e-Local Government PromotionGuideline” in August 2003 as a reference for independentand positive actions supporting the realization of e-localgovernment, taking into careful consideration conditions inlocal governmental bodies as well as differences in their
scale and abilities.
2. Technology Development andStandardization for EnhancingInternational Competitiveness
For users to access diverse services on safe andsecure networks, activities are expected to promoteresearch and development and testing that will con-tribute to the construction of ubiquitous networks suchas the development of terminals that even general usersnot familiar with PC operation can use easily by makinguse of Japan's experience in home appliance operabilityand reliability, areas in which Japan excels.
In order to distribute broadly the results of R&D,enhance international competitiveness, and improve peo-ple's lifestyles, it is essential that measures be taken topromote the integration of R&D and standardization andthe distribution around the world of technologies devel-oped in Japan including standardization activities thatprotect intellectual property rights from the earlieststages of R&D.
Ch
ap
te
r1
10
Figure 1-1-12 Benefits to Viewers of Terrestrial Digital Television Broadcasting
Produced based on the Fourth Action Plan for Promotion of Digital Broadcasting, National Conference for Promotion of Terrestrial Digital Broadcasting
① Viewers can enjoy clear pictures in detailed, high-definition and CD-quality sound that provides an on-the-scene experience.
② Users can acquire a wide range of information not previously available and access diverse and highly convenient services such as interactive functions linked to the Internet.
③ Users can view broadcasts on mobile phones and PDAs and use services stably even while in transit.
④ Digitalization will substantially increase the volume of information that can be broadcast, mak-ing enhanced credit and explanatory services possible as well as viewer-friendly services such as the function to adjust the pace of speech when it is too fast for easy comprehension.
⑤ Users will be able to select programs using services with electronic programming guides (EPG) and watch programs whenever they want using server-type broadcast services.
Figure 1-1-13 International Comparison of Terrestrial Digital Television Broadcasting
Can be received while in transit
High-Definition Broadcasts
Interactive Func-tions
Europe(DVB-T Format)
△Under development.
×Not provided.
○Interactive functions
are available in some countries.
Japan (ISDB-T Format)
◎Suitable. Services to begin in
2005.
◎The policy is for at least 50% of programming to be broad-cast in high- definition (NHK's policy is 80%).
◎Interactive functions with dial-up and broadband are standard features.
United States(ATSC Format)
×Not suitable.
◎There is little high-definition program-
ming available.
△Under considera-tion.
Ch
ap
te
r1
3. Evolving Towards UbiquitousNetworks
Japan has the world's lowest-cost and fastest broad-band networks, and the number of broadband users isincreasing steadily. The use of advanced services fromInternet-compatible terminals and camera-equippeddevices including mobile phones is increasing, and thecreation of hot spots is leading the to development of anenvironment in which users can connect to the Internetat any time from anywhere. In this way, networks areshifting to broadband and mobile access.
With respect to terminals, with the start of terrestrialdigital television broadcasts, it is expected that high-quality television image will spread throughout house-holds and that televisions will become a means ofaccessing the Internet in forms such as broadcast pro-gram that is linked to the Internet and Internet accessfrom a television screen. In addition, mobile terminalsthat can receive terrestrial digital television broadcastsare expected, and an environment under which suchbroadcasts can be received anywhere is being developed.
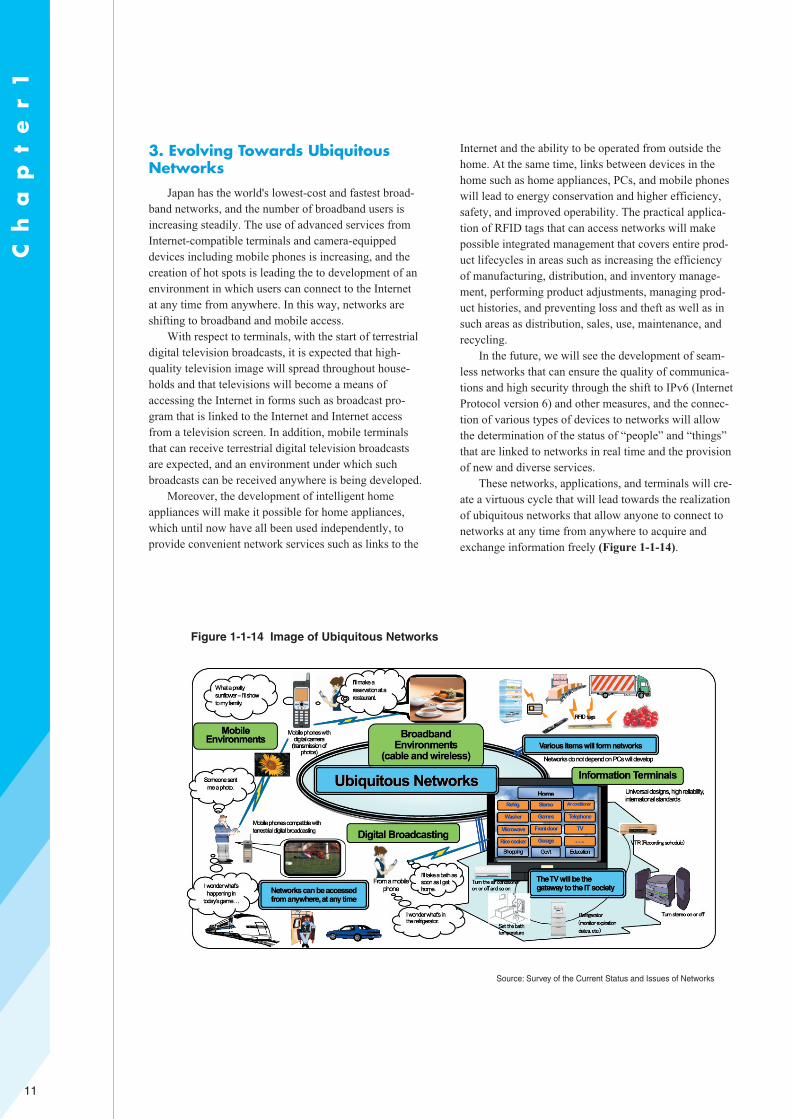
Moreover, the development of intelligent homeappliances will make it possible for home appliances,which until now have all been used independently, toprovide convenient network services such as links to the
Internet and the ability to be operated from outside thehome. At the same time, links between devices in thehome such as home appliances, PCs, and mobile phoneswill lead to energy conservation and higher efficiency,safety, and improved operability. The practical applica-tion of RFID tags that can access networks will makepossible integrated management that covers entire prod-uct lifecycles in areas such as increasing the efficiencyof manufacturing, distribution, and inventory manage-ment, performing product adjustments, managing prod-uct histories, and preventing loss and theft as well as insuch areas as distribution, sales, use, maintenance, andrecycling.
In the future, we will see the development of seam-less networks that can ensure the quality of communica-tions and high security through the shift to IPv6 (InternetProtocol version 6) and other measures, and the connec-tion of various types of devices to networks will allowthe determination of the status of “people” and “things”that are linked to networks in real time and the provisionof new and diverse services.
These networks, applications, and terminals will cre-ate a virtuous cycle that will lead towards the realizationof ubiquitous networks that allow anyone to connect tonetworks at any time from anywhere to acquire andexchange information freely (Figure 1-1-14).
11
Figure 1-1-14 Image of Ubiquitous Networks
Source: Survey of the Current Status and Issues of Networks
Figure 1-1-14 Image of Ubiquitous Networks