second year report milwaukee parental ... 7 a ed . 2 : m 6 i 2 / 1992 second year report milwaukee...
TRANSCRIPT

W 7
A
ED .
2 :
M 6 I
2 /1992
SECOND YEAR REPOR TMILWAUKEE PARENTAL CHOICE PROGRA M
John F. WitteAndrea B. Bailey
Christopher A. Thorn
Department of Political Scienceand
The Robert La Follette Institute of Public Affair s
University of Wisconsin-Madison
©December 1992

TABLE OF CONTENTS
Executive Summary
Acknowledgments
iii
vi i
I . Introduction 1
II. The Milwaukee Parental Choice Program 1
III . Choice Families and Students 3
W. Choice Schools 9
V. Preliminary Outcomes 12
VI. Conclusions 22
VII . Recommendations 23
Figure and Tables
APPENDIX A
APPENDIX B
APPENDIX C

EXECUTIVE SUMMARY -
This report consists of four parts : (1) a description of the Milwaukee Parental Choic e
Program and the data being collected; (2) a description of the choice families and
students; (3) an update on the choice schools; and (4) a two year report on outcomes .I end with a reiteration of last year's recommendations and a discussion of several o fthose recommendations and other potential changes that could be made in the program .
The Program
The Choice Program is a targeted private school subsidy program with the followin gcharacteristics :
Family Qualifications:
* Students must come from households with income 1 .75 times the poverty lineor less.
* Students may not have been in private schools or in school districts other thanthe Milwaukee Public School District in the prior year .
School Qualifications:
* Eligible schools must be private, nonsectarian schools with no religiou saffiliation or training .
* Schools cannot discriminate in selection based on race, religion, gender, prio rachievement, or prior behavioral records. Schools were exempted by courtruling from the Education for All Handicapped Act .
* If classes are oversubscribed, selection is on a random basis .
* Choice students can only be 49% of the students in the school .
* Schools must meet at least one standard established for attendance, parenta linvolvement, student achievement on standardized tests, or grade progress .
Program Specifications:
* Private schools receive the Milwaukee Public School per member state ai d(approximately $2,745 in 1992-93) in lieu of tuition.
iii

The total number of students in the Choice Program in any year is limited t o1% of the membership in the Milwaukee Public Schools (950 in 1992-93) .
Choice Families and Students
Enrollment in the Choice Program has increased–from 341 in 1990 to 521 in 199 1to 613 in 1992 . The number of applicants exceeded the number of students enrolled b y236, 168, and 357 in the respective years . Seven schools participated in 1990-91, six in1991-92, and eleven in 1992-93 .
In both of the first two years parents learned of the program primarily from friendsand relatives. In general, choice parents reported high and increasing levels o fsatisfaction over the two years with the amount and accuracy of the information, andthe assistance they received from the choice schools and the State Department of Publi cInstruction.
The overall portrait of choice students and families is complex. The data clearlyindicate that choice can be targeted toward poor families attempting to find analternative to what they view as a poor educational environment for their children . Thechoice students come from poor, often single-parent households . Similar to MilwaukeePublic School (MPS) parents, approximately 60% are receiving AFDC or publicassistance. The parents express dissatisfaction with prior public schools and there i sstrong evidence that their children were not doing well in those schools (both in relativeand absolute terms) .
Despite being poor, however, the choice families are smaller than the compariso ngroups, thus providing an opportunity for parents to focus more on any single child .In addition, the parents (especially mothers) are more educated, appear to hav esomewhat higher educational expectations for their children, and are more likely to wor kat home with their children on education problems . Finally, the choice parentsparticipated in their children's prior public schools at higher rates than the averag eparent.
This portrait presents something of a paradox. The Choice Program was specificall ydesigned to provide an opportunity for poor parents to send their children to alternativeschools they could not otherwise afford . Two years of very consistent data indicate tha tin this it succeeds. There are numerous indicators that these parents were frustrated an ddissatisfied with the public schools their children had been attending. Thus one couldargue these are exactly the types of families that should have access to an alternativ esource of education . One could also reasonably argue, however, that if these studentsand families remained in their previous schools, they could exercise influence i nattempting to improve those schools .
The Choice School s
The most serious institutional problems noted in 1990-91 were high staff turnove r
iv

and dealing with recent changes in location and affiliation for several of the schools .These problems continued in the second year, but appear to be less serious in the third
year of the program. There is also evidence in the second and third years of th eprogram that the teaching staffs are more diverse in terms of gender and race than theywere in the first year . In three of the five choice schools in the second year, the studen tbodies consist of choice students, tuition paying students, and students attending unde r
contract arrangements with MPS.
Preliminary Outcomes
Preliminary outcomes after the first two years of the Choice Program were mixed.In terms of achievement change scores, in the first year of the program, choice student sgained more than low-income MPS students in reading, but were behind in mathematics .The reading gain for the choice students was not statistically significant, but the MP Sgain in mathematics was. In the second year, choice student scores droppedconsiderably in reading, and remained approximately the same in mathematics . For thesame year, the random sample of MPS students did not change appreciably on eitherreading or mathematics scores . All of these results were verified through regressionanalyses which controlled for gender, race, income, and student grade level .
This fluctuation in achievement tests for choice students was in part affected byattrition from the program. Students who left the program after the 1990-91 year werehigh achievers, with test scores significantly higher than for those who remained behind .These students, combined with an incoming group of students with very low prior tes tscores made up the 1991-92 choice cohort, a group considerably behind the 1990-9 2students. That appears to be reflected in change scores for 1991-92 . Also of interest isthat following the 1991-92 year, those who returned to the choice schools in 1992-93 werestudents who did considerably better than those who left . The overall achievement ofthose returning students in 1992-93, however, is lower than those who either continuedor left in 1991-92 . All these results were based on a small number of students and, wecontinue to interpret these short-term changes in very small numbers of students wit hgreat caution .
Parental attitudes toward choice schools, opinions of the Choice Program, an dparental involvement were very positive in the first two years . Parental attitudestowards their schools and education of their children were much more positive thantheir evaluations of their prior public schools . This shift occurred in every categor y(teachers, principals, instruction, discipline, etc.) . Similarly, parental involvement, whichwas more frequent than for the average MPS parent in prior schools, was even greate rfor most activities in the private schools . In both years, parents expressed approval o fthe program. On open-ended questions concerning what they liked and disliked aboutthe program, there were many more favorable comments than negative ones . Also theyoverwhelmingly believed the program should continue .
Attrition appears to be high . During the first year, attrition was affected b ystudents leaving Juanita Virgil Academy. It may also have been affected by th e
v

uncertainty caused by the continuing legal challenges to the program. The attrition ratein the second year, following legal clarification, was still substantial (35%) . Preliminaryanalysis of MPS mobility indicates that this attrition rate may be similar to that occurringin the public schools. Regardless, if students do not remain in schools, whether privat eor public, it becomes very difficult to address their needs and to enhance learning .
Recommendations
With the exception of fluctuating test scores, the vast majority of evidence in thi sreport is consistent with and confirms the evidence presented in the first year report .Therefore, the recommendations of that report, none of which have been acted upon, arethe same for this report. Additional information does suggest that two of thoserecommendations be emphasized . The first is the need for more adequate disseminatio nof information concerning the program and the second is attention to the transportatio nproblems facing choice parents . One additional recommendation is that the legislatureconsider the problem of student mobility for both public and private school students .
In the conclusion, we reiterate the preliminary aspects of this report and cautionagainst using evidence from the Milwaukee Choice Program to reach conclusion sconcerning much more inclusive choice options being discussed and proposed in othe rstates.
vi

ACKNOWLEDGMENT S
This report is being submitted to the Department of Public Instruction . TheDepartment of Public Instruction appointed the lead author as an independen tevaluator of the Milwaukee Parental Choice Program in September, 1990 . Wegratefully acknowledges the opportunity to evaluate this new program .
The research was funded by a startup grant from the Robert La Follett eInstitute of Public Affairs and by a substantial and continuing grant from the Spence rFoundation in Chicago. The funding covered all expenses, including student wages ,project assistantships and partial release time for the author . No consulting fees havebeen paid. Without the support of the Spencer Foundation, this research woul dnever have been possible .
Numerous people aided in the research . Most important are the members o fthe research team. With one exception, all are or were students, both graduates and
undergraduates at the University of Wisconsin-Madison . Some worked for brie fperiods, others have been with the project for most of the time . Only Mark Rigdonhas been with this project from the beginning and his contributions as leader of theresearch team have been too numerous to mention. Other past or present members o fthe team include : Nadine Goff, Chris Kennedy, Zina Lawerence, Steve Little, Tamar aLouzecky, Lori Mauer, Larissa Ripley, and Julie White . Stephanie Fassnacht provide dcomputer programming support, and Alice Honeywell much-needed editing .
We would also like to thank Superintendent Herbert Grover, Lyle Martens,Bambi Statz, Gus Knitt, Sue Freeze, Steve Dold, and Bob Paul of the Department o fPublic Instruction . Their involvement was very beneficial and completely supportiv eof the research.
We also received considerable help from employees of the Milwaukee Publi cSchool system. They include Gary Peterson, Stan Pauli, George Rennicke, Georg eKrieger, John Berg, Acquine Jackson, and India Gray .
Finally, and most important, we would like to thank all the individual sconnected with the choice schools : students, parents, teachers, and administrators .Those bearing the most burden and responsibility for cooperatively opening up theirschools were Dennis Alexander, Vincente Castellanos, Zakyia Courtney, Rob Rauh ,Walter Sava, and Susan Wing .
vii

I. INTRODUCTIO N
The first year report on the Milwaukee Parental Choice Program began with adisclaimer that the report was preliminary. Although we understand the impatienceof policymakers on this important issue, we once again begin by suggesting that inmany regards this report is also preliminary . A portion of the data presented arequite consistent across the first two years . Other data, including test score changes ,are not. Since the program remains relatively small, sample sizes are also small onsome of the crucial indicators . As in last year's report, we recommend continuatio nof the program–with certain changes .
This report consists of four parts: (1) a description of the Milwaukee Parenta lChoice Program and the data being collected ; (2) a description of the choice familiesand students; (3) an update on the choice schools ; and (4) a two-year report onoutcomes . We end with a reiteration of last year's recommendations and a discussio nof several of those recommendations and other potential changes that could be mad ein the program.
II. THE MILWAUKEE PARENTAL CHOICE PROGRAM
The Program. The Milwaukee Parental Choice Program, enacted in spring1990, provides an opportunity for students meeting specific criteria to attend private ,nonsectarian schools in Milwaukee. The specific parameters of the program are -contained in Figure I . A payment from public funds equivalent to the Milwauke ePublic School (MPS) per-member state-aid ($2,446 in 1990-91 ; $2,643 in 1991-92; est .$2,745 in 1992-93) is paid to the private schools in lieu of tuition and fees for th estudent. Students must come from families with incomes not exceeding 1 .75 timesthe national poverty line . Choice students must not have been in private schools i nthe prior year or in public schools in districts other than MPS . The total number o fchoice students in any year was limited to one percent of the MPS membership (93 1in 1990-91, 946 in 1991-92, and est . 950 in 1992-93) .
Schools must limit choice students to 49 percent of their total enrollment.They must also admit choice students without discrimination (as specified in s .118.13, Wisconsin Stats .). Both the statute and administrative rules specify that pupil smust be "accepted on a random basis ." This has been interpreted to mean that if aschool was oversubscribed in a grade, random selection is required in that grade . Inaddition, in situations in which one child from a family was admitted to the program,a sibling is exempt from random selection even if random selection is required in thechild's grade .
The program was designed to prevent payment of public monies to subsidize :existing private school students, non-poor families, and students attending religiou sschools. Schools were also required to accept students based on random selection .The Milwaukee program, and the resulting research, cannot be generalized to mor eunconstrained "voucher" programs - those that would subsidize private schooleducation in much broader circumstances . The spirit and the letter of the MilwaukeeParental Choice Program lie in stark contrast to public subsidy of elite or exclusiv eprivate education . Rather, the intent is to provide alternative educational

opportunities for families that cannot easily exercise choice by residential selection or
by purchasing private education . The program was challenged immediately uponenactment as violating the Wisconsin Constitution . The circuit court denied thos echallenges in August 1990, and also exempted the private schools from complyin gwith the Wisconsin All Handicapped Children Act . This means that the privateschools need not admit learning disabled or emotionally disabled students. Thecircuit court ruling was overturned by the appeals court in November 1991, but on a4 to 3 decision, the Wisconsin Supreme Court upheld the constitutionality of th estatute in March 1992. This report does not discuss the legal issues .
Research and Data. The study on which this report is based employs anumber of methodological approaches. Surveys were mailed in the fall of 1990, 1991 ,and 1992 to all parents who applied for enrollment in one of the choice schools .Similar surveys were sent in May and June 1991 to a random sample of 5,474 parent sof students in the Milwaukee Public Schools (MPS) . Among other purposes, th esurveys were intended to assess parent knowledge of and evaluation of the Choic eProgram, educational experiences in prior public schools, and the extent of parenta linvolvement in MPS schools. A follow-up survey of choice parents assessingattitudes relating to their year in private schools was mailed in June 1991 and 1992 .'
In addition, detailed case studies were completed in April 1991 in the fourprivate schools that enrolled the majority of the choice students . These case studiesinvolved approximately 30 person-days in the schools, including 56 hours o fclassroom observation and interviews with nearly all of the teachers an dadministrators in the schools . Researchers also attended and observed parent andcommunity group meetings, and Board of Director meetings for several schools .Case studies of five new schools are planned for next March and April . Finally, the
1 Although the response rates (given in Appendix A) on some of our surveys are low relative to face -to-face interviews with national samples, they are higher than the approximately 20 percent response rate sthat MPS reports for its usual surveys . We have independent measures of race and qualification for freelunch from the Milwaukee Student Record Data Base for both the random sample and the choice students .Thus we were able to assess sampling bias and construct weights to offset that bias. For MPS the onlystatistically significant sampling bias was for race, where we had a less than expected response for Africa nAmericans and oversampling of Asians and Whites, and a slight undersample of low-income families .Appendix B provides race and income data on survey respondents . For choice students, there was adisproportionately high response from African Americans and a low response from Hispanics . The result spresented in this report are for unweighted samples.
We have also analyzed scales and demographic variables using three weights : a weight based onexpected race; a weight based on expected low/non-low-income ; and a weight combining both race an dincome. The combined race and income weight is the most accurate . Because for the MPS respondents ,the sampling bias for race was considerably larger than income, the income-weighted analysis produce dno significant differences except on the income variable itself. The race/income analysis produced onlyone marginally significant difference on attitude scale means . It also produced significantly differenteffects for household income, percent of female parents on AFDC, and for the percentage of single paren tfamilies . These differences are noted in footnotes in the text . Analysis of the weighted choice sampleproduced no differences that approached significance at the .05 level .
-2-

research includes analysis of first- and second-year outcome measures including dat aon achievement test scores, attendance, parental attitudes, parental involvement, an dattrition from the program.
In accordance with normal research protocol and with agreement of the privateschools, to maintain student confidentiality, reported results are aggregated an dschools are not individually identified. Thus these findings should not be construe das an audit or an assessment of the effectiveness of the educational environment i nany specific school .
III. CHOICE FAMILIES AND STUDENTS
Questions of who will participate in, benefit from, or be harmed by choiceprograms are at the head of a long list of research issues on educational choice . Atthe most abstract level, the issues involve both the rights of families to choose an dthe rights of children to an adequate education. For proponents of choice, the righ tto choose is crucial both as a fundamental right and as an instrument for improvin gall schools, an idea that proponents believe will emerge from competition andaccountability demanded by parents . Opponents of choice stress the necessity o fproviding adequate education for all students and fear that unrestrained parenta lchoice of schools would produce greater inequality than currently exists .
Research on Milwaukee provides evidence on some of these issues, but it willnot be able to provide answers to others . We do have a quite consistent set offindings from the first two years on the demographic characteristics of parents, thei rattitudes toward education and their experiences in their prior public schools. Thepicture that emerges is not simple to interpret in a policy sense.
For economy, and because two years of data provide a better picture than asingle year, some statistics are presented as combined 1990 and 1991 data .Comparison to statistics reported in the first year report on the program confirm th econsistency of results in each year. Relevant differences are noted in the text an dfootnotes .
The most appropriate comparison group to the choice families on mos tmeasures is the low-income MPS sample . That group, which includes about two-thirds of Milwaukee students, is defined as qualifying for free or reduced lunch . Theincome level for reduced lunch is 1 .85 times the poverty line, free lunch is 1 .35 timesthe poverty line. Most low-income students qualify for free lunch .
Enrollment in the Choice Program. Enrollment statistics for the ChoiceProgram are provided in Table 1 . As is apparent, the number of student sparticipating has increased each year and the number of schools participating jumpe din 1992-93 from 6 to 11 .2 The number of applications has also increased, with again
2 The five new schools had 96 seats available, and enrolled 48 students in September, 1992.
-3-

a large increase in 1992-93 . The increase in applications, combined with a smalle rproportionate increase in the number of available seats, resulted in more student sbeing turned down from the program in 1992-93 . Enrollment in the Choice Progra mhas increased from 341 in 1990-91, to 521 in 1991-92, to 613 in 1992-93 . The numberof applicants exceeded the number of students enrolled by 236, 168 and 357 in th erespective years . Seven schools participated in 1990-91, six in 1991-92, and eleven i n1992-93 ., The number of available seats in the participating choice schools does no tyet match the current cap, which is 950 for 1992-93 .
Learning About Choice and the Adequacy of Information on Choice . Table 2indicates how survey respondents learned about the Choice Program . The results arefairly similar for the first two years, and indicate an ongoing problem. The mostprevalent source of information on choice remains friends and relatives, whichbasically means word-of-mouth information . The first-year report to the legislatur eindicated this as a problem and suggested remedies including advertising theprogram within the context of school choices in MPS .
More positive is the reported adequacy of the information choice parentsreceived. Parental satisfaction with the amount and accuracy of that information, an dwith the assistance they received, is presented in Table 3 . Although satisfaction withthe amount of information on the program in general is slightly down from the firs tyear, all other measures improve and the overall satisfaction appears very high .Most impressive, and perhaps most important, is judgment of the accuracy o finformation on the private schools . Assistance from both the schools and theDepartment of Public Instruction was also judged to be very satisfactory andimproved considerably over the first year of the program . This improvement ininformation is consistent with earlier research reported some years ago for the AlumRock experiment with public school choice .'
We do not have up-to-date data on the amount of information on the Choic eProgram that exists in the community at large . In our random sample survey in Ma y1991, we asked MPS non-choice parents if they had heard of the Choice Program .Only 51% responded that they had - one year and numerous media stories after i twas enacted . We will not have current data on information availability and accurac yuntil we resurvey the random sample in 1994 .
Why Choice Parents Participated in the Choice Program . Table 4 provide sthe responses to survey questions rating the importance of various factors in parents 'decisions to participate in the Choice Program . Because this is a critical issue, wepresent both years of data even though the results are very similar . The two leading
3 See Frank Capell, A Study of Alternatives in American Education, Vol . VI: Student Outcomes at AlumRock, I974-76 (Santa Monica, CA : The Rand Corporation), 1981; and David Cohen and Eleanor Farrar,"Power to the Parents? The Story of Educational Vouchers," The Public Interest, No. 48, 72-97, 1981 .
-4-

reasons for participating in the Choice Program are the quality of the choice school sand the disciplinary environment parents associate with those schools . As notedabove, this is a mirror image of what parents said they were most dissatisfied with i ntheir child's prior school. At the bottom of the list, although still judged quiteimportant, are siblings in the school and the location of the school .
Demographic Characteristics of Choice Families and Students . By almost al lmeasures, the Choice Program succeeded in offering alternatives for poor familie swho were dissatisfied with their prior public schools . Relevant demographi cstatistics are presented in Table 5, which, unless otherwise noted, are based on ou rsurveys. In terms of reported family income (Table 5a), the average income wa s$10,700 in the first two years. This compares to a program cap of approximately$22,000 for the modal family of 3, which is also the average in our MPS contro lgroup . 4 Low-income MPS parents reported a somewhat higher family income ,which averaged $12,100 .
Consistent with the income statistics, 57% of the choice mothers reported bein gon AFDC or general assistance, compared with 39% of the MPS parents and 59% ofthe low-income parents .5 Employment rates for both full- and part-time employmen twere similar between choice and MPS parents . For the combined two years, 36% o fchoice mothers and 67% of the choice fathers were employed full time. Thiscompared to 44% of the MPS mothers and 74% of the fathers . The low-income MPSfigures were 33% for mothers and 59% for fathers .
Racially, the program has had the greatest impact on African-Americanstudents who comprise 73 .5% of the choice students (Table 5b) . Hispanics,accounting for 20.3% of the choice students, are also disproportionately represente din comparison to the MPS sample .
In terms of marital status (Table 5c), choice families were much more likely t obe headed by a single parent (76%) than the average MPS family (49%), andsomewhat more likely than the low-income MPS parent (64%) .' One importantdifference to note, however, is in family size (Table 5d) . For the combined years ,only 49% of the choice families report having more than two children. This compareswith 56% of the MPS parents and 65% of the low-income MPS parents . This mayindicate that choice families are attempting to concentrate the few resources they
4 When we analyzed these data using a race/income sampling weight, the MPS average incom edropped to $19,900 .
5 The race/income weighted sample produced an MPS estimate of 42 .5% of female respondents onAFDC or general assistance in contrasted to the 39% actually reported .
6 The race/income weighted sample estimate of single parent families was 55% which is significantl yhigher that the non-weighted MPS sample . By either measure, however, the difference in proportions arestatistically significant between MPS and the choice families .
-5-

have on a smaller number of children, indicating a higher education "investment" pe rchild .
A unique characteristic of the choice parents is that despite economic status ,choice parents report higher education levels than either low-income or average MP Sparents (Table 5e) . Over half of the choice mothers reported some college education(52%), compared with 40% for the entire MPS sample and 30% of the low-incom eMPS respondents. Although fathers more closely match the MPS control groups ,they are also somewhat more educated. This was a very consistent finding over tw oyears, with only slightly lower education reported by the second-year choice families .
The Importance of Education and Educational Expectations . Based on ourmeasures, choice and MPS parents are similar in terms of the importance they plac eon education. We measured the importance of education relative to other importan tfamily values (Table 6) . As confirmed in Table 13, which indicates the significancelevels of differences of means tests conducted on scale scores, there are no significan tdifferences between the importance of education for choice and MPS samples . Oneof the items, however - the importance of ethnic tradition - is more important fo rchoice than MPS parents . This is consistent with the character of the choice schoolsand the racial composition of those enrolling in the program . Three of the five mainschools emphasize ethnic cultures (two African-American ; one Hispanic/bilingual) .That emphasis may appeal to parents who place considerable value on maintainin gethnic traditions .
Educational expectations are high for all groups, with choice parents somewhathigher than MPS and low-income MPS parents . Eighty-seven percent of choiceparents indicated that they expected their child to go to college or do post-graduat ework. This compared with 76% of the MPS parents and 72% of the low-income MPSparents. Because sample sizes are large, these proportions are significantly different .
Experience of Choice Parents in Prior Public Schools. A more completepicture of choice parents includes the level of parental involvement, attitudes toward ,and student success in their child's prior public school . Our surveys measured th edegree of parental involvement in the school, the amount of parental help fo rchildren at home, and parent satisfaction with prior schools . The results are given inTables 7 through 12. Prior achievement test results are given in Table 14 . Thecolumn headed by an r in Tables 7 through 11 is the item correlation with th eunweighted, additive scale score minus the item . The bottom panel in these tablesare from the follow-up surveys measuring parent attitudes and experiences in theprivate choice schools . Those results will be discussed below .
Based on the first two years, the overwhelming conclusion is that choic eparents are significantly more involved than MPS parents in a variety of ways . Foreach measure in Tables 7 to 10, the differences in the means of the scales wer e
-6-
significant at greater than the .001 level.' The greatest differences are for parentscontacting their schools about their child's academic performance, classes, behavior ,
etc. (Table 8). There is less difference in parent's organizational membership an dactivity (Table 9), but the difference is nevertheless statistically significant . Choiceparents also indicate significantly more involvement in their child's education a t
home (Table 10) . One finding that may not be positive is that their child's behavioris the most frequently cited reason for schools to contact parents (Table 7) . This i sconsistent with parents expressing dissatisfaction with discipline in their prio rschools, and with the reasons for why parents applied to choice schools .
Parental satisfaction with prior schools is also very different between MPS an d
choice parents. In every dimension, choice parents were less satisfied than the
average MPS parent. The items in Table 11 go from most satisfied to the leas tsatisfied (note that a high score indicates dissatisfaction) . What is distinctive is thatthe factors with which parents are most satisfied have little to do with the operationor outcomes of the school (textbooks, school location) . On the other hand, thegreatest dissatisfaction is with the amount the child learned and the discipline in th e
school. Further, in comparing the magnitude of differences between choice and MP Sparents, the differences between the groups are greatest for those items on whichchoice parents are most dissatisfied . As with parental involvement, the hypothesi sthat satisfaction with prior schools is the same for MPS and choice parents is rejecte d
with a probability exceeding .001 .Another indication of parental dissatisfaction with their prior MPS school wa s
measured by a simple question that asked parents what grade they would give thei rprior school (on an A to F scale) . The results are given in the upper panel of Tabl e
12, broken down by year. As is apparent and consistent with other expressions ofsatisfaction, choice parents grade their prior schools considerably lower than MP S
parents. That was especially true for the first year choice parents, who on averag erated their prior schools as a C. The second year average was 2 .5, compared with thelow-income and total control group, which rated their schools at a 2 .8 average .
The attitudes of parents toward their children's prior public school within MP Smay be a reflection of the fact that their children were not doing well in those
schools . Prior test scores for choice applicants, accepted choice students, the MPScontrol group, and the low-income MPS students, are given in Table 14 . 8 The test
I do not report differences with low-income parents on Tables 7-11 because they did not diffe r
substantially from the control group as a whole . Those data were reported in the First Year Report . The
only scale affected by using weighted observations was for Table 10, Parents Participation in Educationa l
Activities . When the sample was weighted to offset race and income bias, the mean increased to 7 .12,
which was significant at the .05 level. The remaining scale means were almost identical to the unweighted
means .
Test scores are not available for all students in either group because tests are not given every yea r
in MPS. Therefore, there will be no tests for 4 and 5 year old kindergarten, and few for first grad e
students. Lateral entry at higher grades might also miss some students because primary testing is in
grades 2, 5, 7 and 10 . For the few high school students in the Choice Program, the 10th grade test was
-7-

scores in Table 14 are for the last test taken in MPS . The reason for this is that weare trying to get as complete a picture as possible for a small number of choic estudents. The majority of those tests are taken in the spring of the year of application(56% in 1990, 58% in 1991) .
We present the results for each year independently because choice students i nthe second year of the program have even lower prior scores than in the first year .In both of the first two years, Iowa Test of Basic Skill scores taken in prior publi cschools by students both applying to and accepted in the program were significantl ybelow the average MPS student taking the same test . The scores were also below thelow-income MPS cohort in both years . Based on difference of means in Norma lCurve Equivalents (NCEs), however, the difference between choice and low-incomeMPS students was not significant at the .05 level in 1990, whereas it was in 1991 9
The absolute level of the scores indicates the difficulty these students wer ehaving prior to entering the program. The median national percentile for choic estudents ranges from 26 to 33, compared with the national median of 50. TheNormal Curve Equivalent, which is standardized to a national mean of 50, range sfrom 37 to 41, which is about two-thirds of a standard deviation below the nationa laverage . In short, the choice students in this program enter very near the bottom in term sof academic achievement .
Summary. Enrollment in the Choice Program has increased—from 341 in 199 0to 521 in 1991 to 613 in 1992. The number of applicants exceeded the number ofstudents enrolled by 236, 168 and 357 in the respective years . Seven schoolsparticipated in 1990-91, six in 1991-92, and eleven in 1992-93 .
In both of the first two years, parents learned of the program primarily fromfriends and relatives. In general, choice parents reported high and, over the twoyears, increasing levels of satisfaction with the amount and accuracy of th einformation, and the assistance they received from the choice schools and the Stat eDepartment of Public Instruction .
The overall portrait of choice students and families is complex . The datadearly indicate that choice can be targeted toward poor families attempting to find a nalternative to what they view as a poor educational environment for their children .The choice students come from poor, often single-parent households . Similar to MPSparents, approximately 60% are receiving AFDC or public assistance . The parentsalso express considerable dissatisfaction with prior public schools and, based on prior
excluded because very few of these students were tested and because the students entering this choiceschool did so rather than dropping out of school .
' Difference of means tests indicate that all choice student scores were significantly lower (at the .00 1level of significance) than those in the MPS sample . In comparison to-the low-income MPS students, the1990 test differences were not significant; the 1991 reading comparisons with both applied and accepte dchoice students were significant at the .05 level, while math differences were significant at p< .001 .
-8-

test scores, there is clear evidence that their children were not doing well in thos eschools (both in relative and absolute terms) .
Despite being poor, however, the choice families are smaller than thecomparison groups, thus providing an opportunity for parents to focus more on anysingle child . In addition, the parents (especially mothers) are more educated, appea rto have somewhat higher educational expectations for their children, and are mor elikely to work at home with their children on education problems . Finally, thechoice parents participated in their children's prior schools at higher rates than th eaverage parent .
This portrait presents something of a paradox. The Choice Program wasspecifically designed to provide an opportunity for poor parents to send thei rchildren to alternative schools they could not otherwise afford . Two years of ver yconsistent data indicate that in this it succeeds . In addition, there are numerousindicators that these parents were frustrated and dissatisfied with the public school stheir children had been attending . Thus one could argue these are exactly the type sof families that should have access to an alternative source of education . One couldalso reasonably argue, however, that if these students and families remained in thei rprior schools, they could exercise influence in attempting to improve those schools .
IV. THE CHOICE SCHOOLS
Because no new schools participated in the program in the 1991-92 schoolyear, this section only updates several issues raised in the First-Year Report. Forthose new to the Milwaukee Parental Choice Program, we reiterate some of theinformation provided in the First Year Report . In the summer of 1990, 10 privateschools expressed interest in and notified the Department of Public Instruction o ftheir intent to participate. Seven schools enrolled students . The majority of student s(317 of 341) were in five prekindergarten-to-eighth grade schools . The other twoschools (Lakeshore Montessori and SER jobs For Progress) had fewer students an dserved different educational purposes . Because SER Jobs was unique in providing analternative educational environment for high school students on the verge o fdropping out, we approached its evaluation in a different manner . For example, thesame achievement tests used in other schools were not a useful indicator for thesestudents. Because of the age and number of students in Lakeshore Montessori (tw o4-year-olds), it was also impossible to do a rigorous evaluation of these students .
In the first year of the program, one school, Juanita Virgil Academy, wen tbankrupt and disbanded. It had enrolled 71 choice students, most of whom endedup in MPS. The problems with that school were documented at length in the Firs tYear Report.
In the second year of the Choice Program, no additional schools admittedstudents. Beginning in the fall of 1992, however, five additional schools admitted atotal of 47 students. Three of those schools are Montessori schools and one school isa Waldorf school. All of the schools serve elementary students, with several school s
-9-

going through grade eight and one school, Learning Enterprises, going from first t o
twelfth grade. Another school, Messmer High School, applied to participate, but wa sdenied by the Department of Public Instruction based on the qualification of th eschool as nonsectarian. That certification is in appeal and has not been resolved as o fthe release of this report .
Because there were no significant changes in number of schools in the secondyear of the Choice Program, only minor updates to the First-Year Report are in order .The staffing of the schools was examined in the First-Year Report and one of th eissues that was raised was turnover - of both teachers and administrators . Asindicated in Table 15a, staff turnover in 1991-1992 continued to be a problem, and thenumber of new personnel increased . A third of the new personnel, however, wer efilling expansion positions . Both turnover and new personnel rates for 1992-93 aredown substantially indicating some personnel stability in these five schools .
As depicted in Table 15b, in the first year, the staff in these schools wa spredominantly white (75%) and female (89%) . In the subsequent two years, theteaching faculties have become more diverse . In 1991-92, 71 % were women and 38 %were minority teachers (27% African-American, 11% Hispanic) . In 1992-93, 73% werewomen and 40% were minorities (32% African-American, 8% Hispanic) .
Turnover of administrators was also high. In 1990-91, in two of the schools ,the principals or executive directors had been in their positions for only two years .In one school, the principal had been with the school for 16 years and had beenprincipal for 13 . In one school, there was a new principal in 1990, who resigne dpartway through the year . For 1991-92, for the six participating schools, there werenew principals or directors in three of the schools (one of the appointed principalshad been a teacher in the previous year) . In the continuing schools in 1992-93, thereare two new directors or principals, although one of the previous principals remainedwith the school as executive director .
With a few exceptions, staff dissatisfaction is not with the school environmen tor teaching, but with the pay . During our case studies in 1991, teachers andadministrators went out of their way to describe how they enjoyed the small classsizes they taught (averaging 16.5 students), the autonomy they had in the classroom ,the usually congenial atmosphere in the schools, and the support they received i ndisciplinary matters . Other than pay, the most general complaints were lack o f
• materials and teaching aids ."In 1990-91, several of the schools were suffering from recent changes i n
affiliation and location. One had moved into its existing building in September, 199 0(as had Juanita Virgil Academy) . Another had moved two years earlier, but many o fthe parents were not happy with the location of the building . An unsuccessful effortto acquire adequate funds to build a new building was abandoned during the 1990-9 1
10This was an extreme problem in one of the schools that did not have adequate textbooks in som eclasses until well into the second semester . It was also a serious problem in other schools in areas suchas science where it was hard for the teachers to innovate and compensate for the dearth of equipment an dmaterials .
-10-

year. Both of these schools were historically affiliated with religious organizations .Being on their own created financial hardships . Moving meant a loss of students ,teachers, and administrators, as well as the normal difficulties associated wit hchanging facilities .
These problems stabilized in 1991-92 . One school was able to open up a newfacility in addition to its existing school. One school remains in cramped quarters ,but has plans for, and considerable funding to build a new school by 1993-94 . Theother schools remain in their same locations . Physical improvements have been madeto several of the buildings, including a major renovation effort at one of the schools .Public monies from the Choice Program, which exceed tuition in most schools, hav ebeen a factor in making these efforts possible .
One interesting feature concerning these schools, and other schools whichmight qualify for the Choice Program, is their relationship with the Milwaukee Publi cSchool System. The degree of cooperation and coordination that exists betweenpublic and private schools is often overlooked in the heated controversy over choice .MPS has for many years contracted with private, non-sectarian private schools toprovide services for specific student populations . These include contracts withalternative high schools, school specializing in teaching pregnant students or othe rstudents who require specialized programming, and "last-chance" schools for studentswho face expulsion.
In 1991-92, three of the choice schools had contract arrangements with MPS .These yearly contracts seem to be beneficial to both parties . Although MPS offers aswide a range of choices of different forms of schools as any district in the country,and is constantly touted as an example of public school choice, specific students i nindividual schools may need programs and attention that are not available in tha tschool. Contract arrangements provide an added alternative to serve the needs o fthese students .
The effect of contract arrangements on the Choice Program may be relevant toour understanding of the program. The contract with MPS is based on a per studentcharge and is contingent on curricular approval and performance criteria . It alsoprovides private schools with approximately $2,000 more revenue per student thanthe current choice payment . When we visited all but one of the non-participatingprivate schools in the last year, several cited contract arrangements as a reason the ywere not applying to the Choice Program .
The importance of this has to do with the potential effect of the program interms of the numbers of students served . There are few nonsectarian private schoolsin Milwaukee and some of these serve families who would not qualify for the Choic eProgram (based on income). For the schools in the Choice Program in 1991-92, th estate payment is substantially higher than tuition and fees in all schools except one(and in that school the payment is above tuition, but slightly below tuition plus fund -raising requirements) . It is substantially lower than MPS contract prices, however,and that alternative is therefore attractive .
-11-

Summary . The most serious institutional problems noted in 1990-91 were hig hstaff turnover and dealing with recent changes in location and affiliation for severalof the schools . These problems continued in the second year, but appear to be les sserious in the third year of the program. There is also evidence in the second andthird years of the program that the teaching staffs are more diverse in terms o fgender and race than they were in the first year . In three of the five choice schools i nthe second year, the student body is composed of choice students, tuition payin gstudents, and students attending under contract arrangements with MPS.
V. PRELIMINARY OUTCOME S
We discuss five types of outcome measures in this section : (1) achievementtest results ; (2) attendance data; (3) parent attitudes; (4) parental involvement; and 5)attrition from the program . The legislation specified that suspension, expulsion, anddropping out also be monitored. Those measures, however, would be meaningfulonly at the high school level ." The only high-school-level program in the choiceschools during 1990-91 and 1991-92 was in SER Jobs for Progress and it is unclear,given its alternative nature, what the relevant measures or MPS comparisons woul d
be.12 Thus we report only on the five areas indicated above.
Achievement Test Results
Cohort Test Results . Tables 16a and 16b provide the aggregate test results for
11There is almost no dropping out at the elementary level . Drop-out rates are also extremely low inmiddle schools . In MPS suspensions are also rare in these grades and the policies and reporting varyconsiderably from school to school . For example, student fighting, which leads to a suspension for upto three days in most of the private schools, may end up with a student being sent home in MPS .Whether that becomes an official suspension or not may depend on the principal and the reactions of th echild or parents. The numbers of official expulsions are even smaller than dropouts or suspensions . SeeJohn F. Witte, "Metropolitan Milwaukee Dropout Report," Report of the Commission on the Quality andEquity of the Milwaukee Metropolitan Public Schools, 1985 .
12The noncompletion rate for choice students in Ser Jobs for Progress was 52% (14 of 27) for the 1990-91 year . Of those, four dropped out voluntarily, five were dropped due to excessive truancy, thre etransferred to other schools, and two moved out . Of those who completed two semesters, the moda lnumber of credits they received was four for the year . The completion rate for 1991-92 was 62% (23 of38) . Of those who did not, ten dropped out, three were terminated and one transferred schools . Of the23 students, four received no credits in either semester . The average number of credits earned pe rsemester was 2.63, with a 2 .13 grade point average . What is difficult to determine, given that most ofthese students were on the verge of dropping out, is what these numbers mean in terms of prospectivesuccess.
-12-
1991 and 1992 for choice students in the four private schools and for students takingtests in MPS in 1991 . Tests were administered in late-April in two schools and i nMay in the other two. MPS tests were given in May . The results may be compare donly crudely with those in Table 14, which indicated prior test scores for thosestudents who applied and were accepted into the choice program . The prior test datain Table 14 was mostly data from 1990 tests, but was based on the last prior test i nthe student's file . As stated above, those data indicated the choice applicants weredearly behind the average MPS student, and also behind a large random sample oflow-income MPS students . Table 16a indicates that on reading the choice studentstested in 1991 did better than the MPS low-income group, but they did somewhatworse on mathematics. Because these are cohort scores, they tell us nothing abou tachievement gains .
Tests taken in the choice schools in the second year—spring 1992 (Table 16b)- -show considerably lower scores . They are lower for students completing both oneand two years in the Choice Program. They are lower than the scores in both the fullMPS sample and among the low-income MPS students . Comparing the low-incomeMPS and choice students, the choice students mean math NCE is more than fiv epoints lower; the reading score, which was higher in 1991, is two points lower .Median national percentile ranks closely parallel these differences . The volatility o fthese numbers between years is important, especially given the small sample sizes .In addition, cohort scores indicate only where a given group of students is at aspecific point in time . Thus they are very much affected by attrition from, and entr yinto the program (discussed below) . Because the cohort scores do not report on thesame students from year to year, the only accurate measure of achievement gains an dlosses are change scores.13
Change Scores . When we analyze those few choice students for whom wehave both 1990 and 1991 test scores, the results differ somewhat . Descriptive changescores are depicted in Tables 17a and 17b . We caution the reader, as we did in theFirst-Year report, that it is probably impossible to draw any firm conclusions fromthis small number of choice students . The results in the table are based o ndifferences in Normal Curve Equivalents, subtracting the first year score from the
13 A widely circulated pamphlet released by the Wisconsin Policy Research Institute contains a clai mthat cohort statistics in the First Year Report indicate significant gains for the choice students . This claimignores repeated warnings in the First Year Report that the number of students on which we have score sis fewer than 100. It also implied that changes between prior scores (current Table 14) and cohort score s(current Table 16) can be used to evaluate achievement changes - even though it was repeatedly pointe dout that the students in these groups differ and it is impossible to infer changes between cohorts (as i strue above). The pamphlet also ignores a footnote in the first report (number 15) that reported chang escore values, indicated the changes are not statistically significant, and stressed that regardless o fsignificance the number of cases is too small to draw any policy conclusions . Because of those smallsample sizes, in the first year I did not analyze the change data using more sophisticated techniques . Withtwo years of data available, we have analyzed the data using more sophisticated techniques in this report .
. -13-
second 1 4 For the first year, the positive result is that the averages for all groups ,except choice math, improved . For the choice students, the gain was considerable ,although not significant in reading . Math scores stayed essentially the same . TheMPS numbers indicate considerable and statistically significant improvement inaverage math scores, with smaller gains in reading . Both low-income an
d non-low-income MPS students gained in math . Three of these gains are statistically significan tdue in part to larger sample sizes than for the choice students .
There are quite different effects in the second year (Table 17b) . Change scoresfor choice students in math, and for MPS students in both reading and math, do not
change appreciably. None of these differences approach standard levels of statistica lsignificance. In contrast to the first year, however, reading scores drop for choic estudents. The decline is 3.9 NCE points for all students between 1991 and 1992 .Because NCE scores are based on a national norm, this means that choice studentsscored considerably below where they were relative to the national sample in th eprior year . The decline was statistically significant at the .001 level . Further, butbased on an even smaller sample, second year choice students fell behind eve nfurther (-4.8) than first year choice students (-2 .6). A possible explanation for this i sdiscussed below when we consider differences in achievement for those leaving an dstaying in the program .
Regression Analysis. Because these differences could be based on a number o ffactors, and the factors could be distributed differentially between choice and MP Sstudents, to provide an accurate and confirming picture . of test achievement, it isnecessary to control statistically for factors other than if students were in MPS o rchoice schools . Those controls are provided by multivariate regression analysis of thecombined MPS and choice samples for students having test scores in both 1991 an d1992, and 1992 and 1993, respectively. There are a number of ways of modelin gachievement gains . The most straightforward is to estimate the second year tes tscore, controlling for prior achievement and background characteristics and thenincluding a (dichotomous) variable to measure the effect of being in a choice or MP Sschool. Tables 18 and 19 give the results for 1991 and 1992 estimates, respectively .Appendix D contains a technical discussion and results of other models an destimation equations.
The results fit well with the data presented for change scores in Tables 17a an d17b . The b columns in Tables 18 and 19 contain the coefficients that determine th e
14 Normal Curve Equivalents are used because National Percentile Rankings are not interval level data .One of the problems with the transformation from NPRs to NCEs is that the very lowest and highest end sof the distribution are compressed. This tends to inflate very low-end scores and deflate very high-endscores. The lower end inflation may affect this population, which has quite a few test scores below th e10th National Percentile . For later analysis, if sample sizes get large enough, we will also analyze score sby grade using the Iowa Test Standard Scores, which are interval level, but do not have this compressio neffect. NCEs are, however, the national standard for reporting results across populations and grades fo rChapter 1 and other programs.
-14-

effects of the variables on predicting the dependent variable (the relevant test) . Inboth tables, a critical coefficient will be the choice (dichotomous) variable . -Dichotomous variables have a value of 1 if the student has the characteristic, and 0 i fthey do not. The effects of the coefficient can be read as a straight difference in NC Escore on the 1991 or 1992 test. Thus, for example, in Table 18, being a low-incomestudent has an estimated negative effect of 2.96 NCE points on the 1991 readin gscore. This predicted effect occurs after simultaneously controlling, or in essenc ekeeping constant, all other variables in the model .
The only variables in the models that are not dichotomous variables are th eprior year test and the grade level of the student . The effects of these variables ar ealso easy to interpret. They can be read as the effect that a one point difference in th evariable has on the predicted test. Thus, for reading in Table 18, if one student is on epoint better on the prior (1990) test than another student, we would predict he or sh ewould do .59 points better on the 1991 test . For test grade for each higher grad estudents are in, we would estimate a .59 lower test score. The probabilities indicatedin the tables are a statistical measure of how likely the coefficients differ from O .Traditionally, those coefficients that have a probability of .05 or less are considered"significant." That is an arbitrary convention, however, and we therefore provid eexact probabilities.
The 1991 results in Table 18 follow the pattern of results in Table 17a. Forreading, the Choice variable is positive, meaning that on average, choice students 'gained 1.69 more points than MPS students after controlling for prior achievement ,grade level, gender, income, and race . The result is not significant by conventionalstandards. The effect is also not as large as the negative effects of being from a low-income family, or being African American or Hispanic. As expected, prio rachievement as measured by the 1990 reading test is highly significant and explains 'much of the variance in the 1991 scores . Thus students who start behind are likely t ohave lower relative scores .
The test grade variable is also significant in this and most other tables. Thenegative sign means that for each higher grade, we can expect students to have lowe rscores. For 1991 reading, this would amount to an average difference from grade on eto grade eight of -4.13 NCEs (- .59 x 7) .
The results for math, however, are just the opposite. On 1991 math tests ,because of the superior gains of MPS students, the scores for the choice students ar eworse relative to the MPS students . 15 The result is close to conventional levels o fsignificance. Being African American or Hispanic predicts a lower test score, and th eeffects are larger than for the choice-MPS difference . For math, the prior achievementeffect (b = .60) is almost exactly the same as for the reading prior test in the toppanel.
15 The absolute level of changes are given in Table 17a . Choice students declined by on .1 NCEs, butMPS students gained 2 .6 NCEs, thus accounting for the relative difference .
-15-

The results for 1992 are very different from 1991 . As expected, they again
follow closely the descriptive change scores in Table 17b . Because choice student
reading scores declined, while MPS scores improved slightly, the effect of being in achoice school is negative on reading, with an- average decline after controlling fo r
other variables of -3.65 NCEs. This decline is significant at greater than a .001 level
of probability . There are also significant effects for gender (girls average 1 .60 pointsmore than boys), being from a low-income family and being African American .
Math outcomes are very different from reading and from first-year math
results. In the first year, MPS students improved significantly in math, while choic e
students remained the same. In the second year, there were no significant difference s
in absolute change scores (Table 17b), and the difference between choice and MP Sstudents is inconsequential in the regression analysis (CHOICE variable in Table 19 ,
bottom panel) .What is important, in summary, is that the regression analyses confirm the descriptive
change score results in Tables 17a and 17b . Thus, controlling for relevant variables does no tchange the basic pattern of choice and MPS results in Tables 17a and 17b .
This variation and fluctuation in scores demonstrated in Tables 17 to 19 maywell be a function of small sample sizes, but also may be affected by who leaves an d
remains in the program. Although sample sizes become even smaller when weanalyze the scores of students who leave and who return to the choice schools, th e
pattern is revealing.
Achievement Scores of Students Who Leave and Students Who Return to th eChoice Schools . Tables 20 and 21 provide a breakdown of choice student test scoresfor non-graduating students who leave and return to the choice schools in the first
two years. Tables 20a and 20b provide cohort scores for leavers and returners i n1991 and 1992 respectively . Tables 21a and 21b provide parallel change scores .These tables are breakdowns of Tables 16 and 17 respectively, but without graduatingstudents who could not return to the choice schools .
The patterns in the two years are diametrically opposed, but may explain par tof the changes in scores for choice students. In the first year, the leaving students(who withdrew in the summer of 1991), are considerably better students than thos ewho return to the choice schools . On reading, the leaving students score 3.7 NCEpoints higher than those who return in the fall of 1991 (Table 20a) . The median NPRgap is nine points . On math, they average 2.5 points higher, and three NationalPercentile Ranks .
In terms of change scores, however, the leaving students did much worse tha nthose who returned. Although the numbers of students are very small (24), leavingstudents did about as well as in the previous year on reading, but dropped almost sixpoints in math (Table 21a) . Prior 1990 score averages in the same table confirm tha tthe leaving students started way ahead of the those who returned . On the contrary,returning students began way behind, but their test scores improved considerably i nthe first year. The increases were 2.5 and 2.3 points in reading and mathrespectively .
-16-

What could explain this pattern? One obvious explanation is that parentsresponded to the performance of their children . Leaving student scores declined,returning student scores increased. This result could have been compounded b yparents of higher achieving children (going in) having higher expectations an dreacting to the uncertainty of the program due to court challenges .
What is quite clear is that those students who returned, and formed the secondyear choice student body were not achieving as well in September, 1991 as thestudents entering in 1990 . In addition, the new students in 1991 were also quite poo rbased on prior test results (Table 14) . This combination could easily contribute to therelative decline of these students in the second year.16
As captured in Tables 20b and 21b, the story changes in the second year .Based on somewhat larger samples, in terms of the scores of leaving and returningstudents, the opposite pattern emerges . As indicated in Table 20b, those who returnhave higher scores than those who leave. The differences are 3 .0 and 2.0 NCEs forreading and math . Reflecting the much lower overall performance of choice student sin the second year, a comparison with Table 20a indicates that both of these group sdo much worse than the first-year students .
Change scores for 1992 (Table 21b) are more consistent with the first-yea rresults (Table 21a) . Although all scores are negative in 1992, leaving students declinemore than returning students on both reading and math. Thus it would appear thatsome sort of selection out of the program is occurring for students with wors echanges in achievement:
What is troubling in analyzing these test data are the fluctuations in results,combined with small sample sizes, and uncertainty of the program in the first year.Although those samples are larger in the second year, and the program was morecertain going into the third year, there is simply a great deal we do not know abou tthese patterns at this point in time . Although it is not possible to use these data tosupport a picture of miraculous outcomes occurring in the private schools, therelative comparison to the public schools is not yet clear.
Attendance
Attendance is not a very discriminating measure of educational performance a tthis level because there is little school-to-school variation . For example, in the last threeyears, average attendance in MPS elementary schools has been 92% in each year . Middleschool attendance for the same years averaged 89, 88 and 89 percent . Attendance ofchoice students in the private schools (excluding SER-jobs) averaged 94 percent in 1990 -91 and 92% in 1991-92, which put them slightly above MPS, but the differences were
16 Statistically, the opposite could also occur . If a test has a lower bound equivalent to randomguessing, and if students approach that bound, the probability is that on a repeated trial they will "regres stoward the mean." Both continuing and returning choice students are quite low in the second year an dthis type of regression could have occurred to some degree. However, the NCE transformation, whichcompresses scores and truncates the lower scores (see footnote 14), somewhat mitigates this possibility .
-17-

obviously slight . It can be concluded that overall attendance was satisfactory and no ta problem in any of these schools .
Parental Involvement17"
Parental involvement is stressed in all of the choice schools and, in fact, isrequired in the contracts signed by parents in two of the schools . Involvement takesseveral forms: 1) organized activities that range from working on committees an dboards to helping with teas and fundraising events ; 2) involvement in educationalactivities such as chaperoning field trips, and helping out in the classroom or withspecial events.
The bottom panels of Tables 7 to 10 provide two-year data on parentalinvolvement levels by choice parents in the choice schools . In all cases, except foreducational activities at home (Table 10), parental involvement increased beyond th ealready very high levels . School contact of choice parents was higher than the averag eMPS parent in their prior schools (top portions of Tables 7 and 8) . As indicated in thebottom panels of these tables and by the means of the scale scores, these contact sincreased when the children were enrolled in the choice schools . The major increasesin schools contacting parents was for doing volunteer work and fundraising activities .Thus a positive result of private schools being often strapped financially is that it force sparents to be involved in the schools. As indicated in Table 9, which reports organizedparent activity, every category of parental involvement was higher in the choice school sthan in prior public schools .
As indicated in Table 13, when scale scores are analyzed, the drop in hom eactivities was not significant, while the other increases were significant at least at the . 1level of probability. Again, as with prior parental involvement, the findings on parentalchoice are consistent across two years - they have high parental involvement coming int othe schools and even higher involvement once there .
Parental Attitudes
Parental Satisfaction With the Choice Schools . Again, in both years, parenta lsatisfaction with choice schools (Table 11) increased significantly over satisfaction wit hprior public schools. Satisfaction with their prior schools was significantly less tha nsatisfaction of the average or low-income MPS parent (top panels Table 11) . Reportedsatisfaction with the choice schools surpasses the MPS level, and is considerably highe rthan with their prior schools. The largest shifts were in the amount they felt their
17 Parental involvement and parental attitude measures are based on the responses to the second waveof surveys conducted in June of each year . Those surveys were sent to all enrollees in the choice program .However, it is impossible to estimate the measurement error based on the attendant respondent bias . Itis also difficult to predict, a priori, how it might affect results . Are well-satisfied or unhappy respondentsmore likely to respond?
-18-

children learned and their impression of discipline in the school. Thus the parents wh oresponded to our surveys believe they found in the choice schools what they professe dthey were looking for when they entered the program - increased learning and disci-pline .
Another indication of parent satisfaction is the grade parents give for thei rchildren's school . On the follow-up survey in June of each year, we asked parents t ograde the private school their children attended . The grades, which indicate substantialdifferences with the grades they gave their prior MPS schools, are given in Table 12b .In 1990 the grade rises from an average C to an average of B; in 1991 the difference i sless, from an average of 25 to a 3 .0. The grading for private schools is approximatelythe same as the MPS control group's assessment of their public schools in 1991 .
Attitudes Toward the Choice Program. Followup surveys in June of 1991 an d1992 asked parents of choice students if they wanted the Choice Program to continue,and what they liked and disliked about the program . Respondents almost unanimousl yagreed the program should continue (99% in 1991 ; 98% in 1992)1 8 Consistent withother attitude measures, the percent of positive (likes) comments was 71% .in 1991 and76% in 1992 (Table 22) . What parents say they like and dislike about the program is alsointeresting. What they like about the program is very consistent between the first tw oyears. Approximately 70% of the open-ended responses mentioned qualities of th eschool, with most referring to the educational qualities provided in the choice schools .A consistent number also referred to a personal desire for a private education and-theirinability to afford it without the Choice Program.
The negative comments shifted understandably between the first two years . Inthe first year, the majority of references were to a catch-all category includin guncertainty over the program, a bad experience with the program (Juanita Virgil) an dother factors . The second-year concerns were spread over school problems, fears abou tnot qualifying for the program, but wanting a private education, and transportation andlogistical problems. The latter highlights an ongoing problem addressed in th econcluding section .
Attrition From the Program
Attrition Rates . Perhaps the most troubling result of the first year of the ChoiceProgram was the rate of attrition from the program . Enrollment in the Choice Programis depicted in Table 1 . The attrition from September 1990 to June 1991 was accounte dfor mostly by the bankruptcy and closing of one of the original schools - Juanita VirgilAcademy. That school began the year with 63 choice students . Excluding thosestudents, 29 left the schools in 1990-91. Of those, a disproportionate number were in
18 These numbers are obviously subject to response bias in favor of the program . It is impossible tomeasure the magnitude of that bias . The approval rate is very high even with a reasonable estimate ofbias .
-19-

SER-Jobs For Progress, which is the alternative high school program for extremely at-risk
students. Including SER-Jobs, but excluding Juanita Virgil, the attrition within the firs t
year was 10.4 percent (29/278) . For the second year, because students entered the choic e
schools in the middle of the year (accounting for the increase in the September to
January counts), within-year attrition was difficult to measure . Based on the peak of 526 ,
within-year attrition was 9.3% . Both of these rates compare favorably with mobilit y
rates from September to June in MPS schools . The average mobility rate for comparabl e
schools in MPS was 33 percent . That figure, however, includes both "in" and "out "
transfers from schools between September and June. Because the Choice Programincluded few "in" transfers, if we assume there were equal numbers of in and ou ttransfers in MPS, the comparable rate would be 16.5 percent. Thus not counting Juanit aVirgil, attrition within the year was less than MPS for both years and is reasonable give nthe residential mobility of inner-city families 19
What was not anticipated was the sharp drop in the number of students over th e
summer. Excluding graduates, there was an attrition rate from the choice schools of 3 5
percent over the summer of 1991 . That means that of the original 341 students ,
excluding eight graduates, only 53 .5 percent (178/333) returned the second year.20 I fwe exclude Juanita Virgil from the computations, 65 .9 percent (178/270) returned for an
attrition rate of 34%.In the first year of the program, this attrition rate might have been explained by
the uncertainty of the program due to the pending Wisconsin Supreme Court ruling .That, however, would not explain a similarly high attrition rate for the second year . The35% rate in the second year is lower than in the first year, but one relevant question i show it compares to mobility in MPS .
Unfortunately, MPS does not compute statistics on school transfers over th esummer, although data are available in their Student Record Data Base. Using that data,we are near completion of a study that attempts to separate "natural" transfers betwee nschools (promotions, limited-grade schools) from other transfers . Preliminary resultsindicate that there is very high mobility in the public schools, especially for low-incom e
students . For grades two through five in the year 1990-91, the rate of movingbetween schools during the school year ranged from 15 to 16% for non-low-incomestudents; the summer mobility rate was 10 to 12%, for a total mobility of 25 to 28% . For
" Including Juanita Virgil, the within-year rate was 27 percent for 1990-91, which is higher than the16.5 percent rate estimated for transfers out of MPS .
201t was erroneously reported in the first year that only 155 students had returned in the fall of 1991 .The actual figure was 178. The discrepancy occurred because attrition figures were based on applications.Some choice families did not realize that had to complete applications each year . Because it was the firs t
time they had reapplied, they were allowed to continue after filling out late applications .
21 Mobility is higher in grades one and six . Because there are more "natural" moves into grade onethat are hard to detect in the data, and because "promotion" data are hard to interpret for grade six, w esettled on grades two through five as the most naturally stable .
-20-
low-income MPS students, however, the ranges are 19 to 20% during the year and 15 to17% over the summer . Thus for low-income MPS students, the combined within yea rand summer mobility rates are between 34 and 37%, and thus very close to the secon dyear choice attrition rate 21
Assuming these numbers are close, and the within-year numbers closely matchthe within-year elementary school mobility MPS reports23 what they indicate is : 1) thatmobility out of the choice schools may be very close to the norm for MPS; and, 2) forboth systems, the data suggest considerable problems . If education is a long-termprocess that is most successful in a continuous school environment, this level of mobilit ywill make that process difficult . 24
This problem obviously goes beyond the schools, involving the consequences o fpoverty, unemployment, and poor housing conditions . At the end of our report, w esuggest that the legislature may wish to consider this problem independently of th eChoice Program.
Summary
Preliminary outcomes after the first two years of the Choice Program were mixed .In terms of achievement change scores, in the first year of the program, choice student sgained more than low-income MPS students in reading, but were behind in mathematics .The reading gain for the choice students was not statistically significant, but the MP Sgain in mathematics was . In the second year, choice student scores droppedconsiderably and statistically significantly in reading, and remained approximately th e
22 These figures are preliminary and probably a slightly high bound because we remain uncertain o fthe status of a very few students, and we are still trying to eliminate some "natural moves" betwee nschools that do not have grade two to five classes . We expect final figures to be within one percent o fthose provided .
Another interesting difference between low and non-low-income students is where they move to . Themovement for low-income students is usually within MPS in contrast with non-low income students .Between 50 and 55% of the within year moves of low-income students are to another MPS school . Thisis in contrast to an average of 16% of the same moves for non-low income students . Summer moves varyconsiderably by grade for this single year, but the ratio is again about three to one in favor of within-MP Smoves for low-income students .
23 As indicated in earlier passages, the MPS mobility rate for elementary schools is 33%. This i scomputed on a combined "in" and "out " transfer measure. The relevant comparative statistic would be16.5%. Our average for grades 2 to 5 is 17 .9% .
24 Another important aspect of the attrition study will be to try to determine why choice students ar eleaving the schools . Surveys were sent in October to parents of students not returning to choice school sin September 1992. We will also attempt to survey nonrespondents by telephone. The choice schools arealso helping by providing information on those parents who notified the schools of their intentions .
-21-

same in mathematics . For the same year, the random sample of MPS students did no tchange appreciably on either reading or mathematics scores . All ofthese results were verified through regression analyses which controlled for gender, race ,income, and grade level .
This fluctuation in achievement tests for choice students was in part affected byattrition from the program . Students who left the program after the 1990-91 year wer ehigh achievers, with test scores significantly higher than for those who remained behind .Those students, combined with an incoming group of students with very low prior tes tscores, made up the 1991-92 choice cohort, a group considerably behind the 1990-9 1students. That appears to be reflected in change scores for 1991-92 . Also of interest isthat following the 1991-92 year, those who returned to the choice schools were student swho did considerably better than those who left. Unfortunately, the overall achievementof those students returning in 1992-93 is lower than those who either continued or lef tin 1991-92. All these results were based on a small number of students . We continueto interpret these short-term changes in very small numbers of students with grea tcaution .
Parental attitudes toward choice schools, opinions of the Choice Program, an dparental involvement were very positive in the first two years . Parental attitude stowards their schools and education of their children were much more positive tha ntheir evaluations of their prior public schools . This shift occurred in every category(teachers, principals, instruction, discipline, etc .) . Similarly, parental involvement, whic hwas more frequent than for the average MPS parent in prior schools, was even greaterfor most activities. in the choice schools . In both years, parents expressed approval ofthe program. On open-ended questions concerning what the y liked and disliked aboutthe program, there were many more favorable comments than negative ones .Overwhelmingly, they believed the program should continue.
Attrition appears to be high. During the first year, attrition was affected bystudents leaving Juanita Virgil Academy. It was also affected by the uncertainty causedby the continuing legal challenges to the program . The attrition rate in the second yea rwas also substantial (35%) . Preliminary analysis of MPS attrition indicates, however ,that this attrition rate may be similar to that occurring in the public schools . Regardless ,if students do not remain in choice schools, it is uncertain what effect the program mayhave.
VI. CONCLUSIONS
Perhaps the most obvious conclusion is that the issues surrounding choice ar ecomplex and that the emerging evidence points in several directions. Anotherconclusion is that in its present form, the Milwaukee Choice Program will never answersome of the most pressing questions concerning educational choice . One of the moststriking and consistent conclusions from the first two years is that the program i soffering opportunities for a private-school alternative to poor families whose childrenwere not succeeding in school . That is a positive outcome of the program .
-22-

Because some commentators on the Milwaukee Choice Program appear to b elooking to this program for more than it is, we believe it prudent to point out that thi sprogram should not be used as evidence, either pro or con, for evaluating more inclusiv echoice programs. Programs proposed in other states, such as the tuition voucherprogram in Pennsylvania, or the Colorado or California choice initiatives, did not havethe same conditions for eligibility or school selection procedures as this program .Furthermore, families taking advantage of choice opportunities in these relativel yunconstrained programs could well be very different from those in the targete dMilwaukee program .
VII. RECOMMENDATION S
With the exception of fluctuating test scores, the vast majority of evidence in thisreport is consistent with and confirms the evidence presented in the First-Year Report .Therefore, the recommendations of that report, which have not been acted upon, remai nthe same. Additional information does suggest that two of those recommendations b eemphasized. The first is the need for more adequate dissemination of informationconcerning the program. In the second year, most parents continued to learn of theprogram from friends and relatives . There is no indication that this is the fault of th eDepartment of Public Instruction . Parents responded with very high satisfactionconcerning DPI's role . The program is still not integrated, however, with the mainmechanism of choosing schools in Milwaukee. If the program were included in the MP Sschool choice process and information was available at MPS, more parents might b eaware of the alternative . The second is the problem of transportation. Conversationswith school officials, responses of parents about negative aspects of the program (Tabl e20), and early returns in our study of attrition from the schools indicate tha ttransportation continues to create a problem for some parents .
One recommendation has been added this year . The recommendation is that thelegislature might wish to consider independently the problem of student mobilit ybetween schools--whether public or private . One result of this two-year study is tohighlight that problem, which has consequences for several important areas of educatio npolicy.
The following recommendations are premised on the general recommendatio nthat the Milwaukee Parental Choice Program should be continued in a form similar t othe current one for enough years to complete a comprehensive evaluation . Although allof the suggestions offered for consideration are subject to legislative change, some of th echanges fit within the current legislation and are merely formalizing administrativ e
The Department advertises the program in a number of media sources as notified by schools of thei rintent to participate, listing individual schools with relevant information. One problem has been thesequence of events prescribed in the law. Schools are permitted to file their intent-to-participate formsas late as June 30, the same date by which student applications are due . If an early enrollment periodwere allowed, as recommended under "Selection Procedures" in this report, schools might apply earlier .
-23-

practices developed during the first two years, or could be added as new administrativ e
rules . We first discuss those changes that would require some redrafting of the origina l
statute .
Legislative Changes
A basic issue in this program is the idea of accountability . Put simply, there aretwo approaches to educational accountability . One is state and district regulate daccountability in which legally responsible authorities require schools and/or district sto adhere to specified practices, standards, and reporting of outcome measures. Theother is that parents can best exercise accountability and determine the adequacy ofeducational outcomes by making free choices among schools . The Milwaukee ParentalChoice Program was premised on the latter theory. Although we recommend forconsideration modest additional regulation, this should not be interpreted as asuggestion that the legislature abandon parental accountability as the main principle o fthis program.
The operation and closing of Juanita Virgil Academy was the most troublesom easpect of the first year of the Milwaukee Parental Choice Program . There are those whowould argue that the failure of that school is to be expected in a market system o feducation. Whether one believes that that expectation outweighs the fact tha tapproximately 150 children essentially lost a year's education is a value issue that wecannot resolve. Whatever one's values are, the price was high for those familie sinvolved .
-. We believe that very simple regulations requiring a formal governance structure ,
financial reporting, and further accountability in terms of outcomes would greatly reduc ethe likelihood that schools would close mid-year . These regulations are premised on th etheory that parental choice remains the mechanism of accountability. The additionalregulations are meant to provide enhanced information with which parents can mak echoices and exercise that accountability .
We recommend three sets of provisions for certifying new private schools in th eChoice Program. The ideas for these regulations came from our case studies of th ecurrent choice schools. All of the six choice schools currently in the program mee talmost all of these suggested requirements ; Juanita Virgil did not meet any of them.
Governance . All schools participating in the Parental Choice Program shoul dhave a formal governance structure including a board of directors (school board) . Theboard can be structured by the schools as they see fit, but must include a specified an dformal process for selection and terms of members . It should also include at least som emembers who have no proprietary interest in the school . It should also include parents .We also recommend that the school have formal bylaws . The board should have theauthority to promulgate and amend the bylaws and establish whatever additiona lgoverning structure is seen as appropriate . Board meetings should be held inaccordance with state open meeting laws .
-24-

Financial Reporting. All schools participating in the Parental Choice Programmust conduct an annual financial audit which meets the accounting standards forprivate, nonprofit organizations . The report should be a matter of public record and befiled annually with the Department of Public Instruction .
Added Accountability. Schools should be required to meet all current and futurestate outcome requirements, including statewide tests, dropout reporting, and a schoo lreport card when it is required .
Review Accountability Standards . We recommend that the legislature review th ecurrent standards of accountability as specified in the statute . At present, schools maymeet any one of four standards (attendance, achievement, grade advancement, o rparental involvement) . We suggest that the schools meet more than one of thesestandards. We also suggest flexibility in the standards based on the level of the school .For example, 90 percent attendance is adequate for elementary schools, but would bevery high for high schools, especially alternative high schools (MPS high schools ,including specialty high schools average 82 percent attendance.)
Program Information . To facilitate parent knowledge of the program and th echoice schools, we suggest that the legislature consider making information on th eChoice Program available through the extensive school selection process in MPS .Specifically, information on the Choice Program and schools should be displayed alongwith other MPS specialty school and program options, and the Chapter 220 program .If this is not acceptable, at a minimum, the schools should be allowed to displaybrochures in the pupil assignment and school information rooms at MPS headquarters .MPS should not bear any costs or be held accountable in any way for the privat eschools .
Selection Procedures . Currently the statutes require schools to collect application sthrough June 30, and then apply random selection if there are more applications tha nslots. This means that schools are not able to guarantee parents a position for a ne wstudent until after June 30 . In contrast, assignments are made in MPS in the earlyspring. To avoid this problem, it may be advisable to have an "early enrollment" perio d(ending, for example, on March 30) that avoids random assignment for a portion of th eseats anticipated in a school .
Explicit language could be added to the statute forbidding schools from usingachievement or behavioral records or information in making their enrollment decision .The remaining seats would follow the existing timetable, but the restrictions o nadmission criteria would continue to apply. Schools would, however, be allowed toenroll students up to one week prior to the first class day if positions remained open an dtotal choice enrollment did not exceed the 49 percent limit . In addition to the currentmonitoring of this process by the Department of Public Instruction, the school board fo reach school should be required to verify that the procedures were followed .
-25-

Administrative Change s
Selection. A series of administrative decisions concerning selection that wer emade during the first year should be added to the formal administrative rules . Forexample, oversubscription was defined by grade, not by a school as a whole . Inaddition, siblings of already admitted choice students are not required to be subject t othe random selection process. Finally, students admitted in one year were automaticall yreadmitted, with the only condition being that their household income had not goneabove the required limit . Finally, waiting lists were established in oversubscribe dschools based on the random selection process .
Transportation . Currently, schools must choose either to provide busing, forwhich the school is reimbursed, or parents must provide transportation, for which theparents are reimbursed at the end of the year. There are numerous problems with thesearrangements. First, forcing all students into one or the other of these patterns does no tmeet varying family needs . Some families can provide private (or public) transportation ,some cannot. Reimbursement for private transportation also causes financial hardship sbecause it comes in one payment at the end of the year. Semester payments woul dimprove this situation . Finally, the paucity and expense of yellow buses makes for verylong bus rides for some, and a short instructional day . This is a more difficult problemto solve, but alternative arrangements should be analyzed .
Summer School . One of the schools was partially reimbursed for choice studentsattending summer school. That practice should be added to the rules, along with. asimplified method of computing reimbursement .
Reporting. Schools should be explicitly required to submit the names, grade ,gender, and race of choice students following the third-Friday counts in September an dJanuary. For administrative and evaluation purposes, they should also be required tosubmit a similar list following the end of the school year . It would also be very helpfulfor administrative and evaluation purposes if the schools would provide the reasons astudent left the school year. If the information is available, a similar list would be usefu lof students who completed the year, did not graduate, but did not return to the school sthe next year.
Other Issue s
Learning Disabled and Emotionally Disturbed Students . Several schools currentlyput in their school literature that they are not equipped to teach learning disabled (LD)or emotionally disturbed (ED) students . Because it is not always easy to detect theseconditions in students, the schools end up working with more LD and ED students thantheir literature indicates . Non of the current choice schools, as presently configured,however, can adequately teach ED students and they would not be able to teach larg enumbers of LD students effectively . The legislature may wish to consider a higher pe r
-26-

member payment if schools are willing to accept LD students and applicable stat estandards. Differential reimbursement could be computed based on the costs o fproviding public school education for LD students .
Second-Semester Admission . The legislature may also wish to consider whetherstudents should be allowed to enter the program during the year, or at the beginnin gof the second semester . All other rules would apply . If the school was filled, bu tstudents have left, providing new openings, new positions would have to be offered firs tto those on school waiting lists .
Administrative Costs. The choice schools report considerable adde dadministrative costs for the program. The legislature may wish to study this problemover the current school year for future consideration in adjusting payments to cove rthese costs .
The Mobility Problem in Public and Private Schools . It is clear from our studythat student mobility is high in Milwaukee schools, especially among low-incom estudents, and presents a major problem in providing educational services. That problempotentially affects student learning and other aspects of education (belonging, self-esteem, friendships, etc.) . It also has important ramifications for how districts structurecurriculum and how the state and district school-level assessment might be designed.The legislature may wish to consider this problem independently of the Choice Program,especially as it affects larger-city school districts .

FIGURE 1 .
THE MILWAUKEE PARENTAL CHOICE PROGRA M
Family Qualifications :
* Students must come from households with income 1 .75 times
the poverty line or less .
* Students may not have been in private schools or in school district sother than the Milwaukee Public School District in the prior year .
School Qualifications :
* Eligible schools must be private, nonsectarian schools with no .religious affiliation or training .
* Schools cannot discriminate in selection based on race, religion ,gender, prior achievement, or prior behavioral records . Schools wereexempted by court ruling from the Education for All Handicapped Act .
* If classes are oversubscribed, selection is on a random basis .
* Choice students can only be 49% of the students in the school .
* Schools must meet at least one standard established for attendance ,parental involvement, student achievement on standardized tests, o rgrade progress .
Program Specifications :
* Private schools receive the Milwaukee Public School per-member ,state-aid (est . $2,745 in 1992-93) in lieu of tuition .
* The total number of students in the Choice Program in any year i slimited to 1% of the membership in the Milwaukee Public Schools (est .950 in 1992-93) .

Table 1 .Participation and Attrition From the Choice Program, 1990-199 2
Number of Students Allowe din the Choice Progra m
Number of Private Non-SectarianSchools in Milwaukee
93 1
22
1990-91
946
22
1991-92
950
2 3
1992-93
Number of Schools Participating 7 6 1 1
Number of Available Seats 406 546 69 1
Number of Applications 577 689 103 4
Number of Students Participating :
September Count 341 ' 521 61 3
January Count 259 526
June Count 249 477
Graduating Students 8 28
Number of Returnin g ChoiceStudents 178 323
Attrition Rate .4652 .35
1 The Attrition Rate for year t is defined as : 1 .0 - [The Number ofReturning Students in Year t+1 / (The September Count Year t-Graduating Student sYear t)] .
2 If the 71 students who began in Juanita Virgil Academy are excluded, the
attrition rate is .34 .

Table 2 .
How Choice Parents Learned About the Program, 1990 and 199 1
(Percent indicating source used )
1990 199 1
Friends or Relatives 52 47
Television or Radio 37 2 2
Newspapers 33 30
Private Schools 18 1 8
Churches 5 5
Community Centers 3 3
(N= 140)
(N= 171 )
Question : "How did you learn about the Private School Choice Program? "
Table 3 .Satisfaction With Information and
Assistance on the Choice Program, 1990 and 199 1(Percent satisfied or very satisfied )
1990 199 1
Amount of Information on the ChoiceProgram 85 82
Accuracy of Information on th eChoice Program 69 8 2
Amount of Information on thePrivate Schools 80 84
Accuracy of Information on th ePrivate Schools 73 86
Assistance From School Yo uApplied To 82 9 2
Assistance from Dept . of Publi cInstruction in Madison 58 82
(N= 140) (N= 171 )
Question : "How satisfied were you with the following?" (Please circle one numberor not applicable)

Table 4 .
Factors Affecting Decisions To Participat eIn Choice Program, 1990 and 199 1
(Percentages )
1990 199 1
Very
Import Import
Some
Not
Very
Some
NotImport Jmport Import
Import Import Import
Educational 89 8 2 1 87 13
0 0Quality in Chose n
School
Discipline in 81 17 3 0 77 21
2 0Chosen School
General Atmosphere 75 22 1 1 76 22
2 0in Chosen School
Financial 68 26 3 2 76 18
6 0Considerations
Frustration 66 17 11 7 64 21
11 4with Publi c
School s
Special Programs 62 27 4 6 70 25
3 2in Chosen Schoo l
Location of 59 21 17 3 61 19
14 6Chosen School
Other Children in 36 30 15 19 47 28
8 1 7Chosen School
(N= 146)
(N= 171 )
Question : "Please rate all of the following issues and their importance in you rdecision to participate in the Choice program . "

Table 5 .Demographics
Table 5a. Household Income(Percentages )
Choice 1990 and 1991 Combined
Choice Parents MPS ParentsMPS Low Income
Parent s
$0-
$4999 18 13 1 9
$5000-$9999 42 23 34
$10000-$19999 27 21 29
$20000-$34999 13 24 14
$35000-$49999 0 13 3
$50000 and over 0 8 0
(N) (359) (1513) (880)
Mean income $10,700 $22,000 $12,130
Question : "What is your family/household income range for one year? "

Table 5b . Race '(Percentages )
Applied
Acceptedto Choice
in ChoiceMPS
Control Grou p1990 & 1991 1990 & 1991 199 1
African American 73 .5 76 .3 55 . 3
Asian American 2 .0 0 .0 3 . 8
Hispanic 20 .3 17 .9 9 . 7
Native American 0 .8 0 .6 0 . 9
White 3 .8 4 .3 29 . 3
Other 1 .3 - 0 .8 1 . 0
(N) (979) (625) (5365 )
Table 5c. Parent Marital - Status(Percentages )
Choice MPSControl Group
Low-Income MPSControl Grou p1990 & 1991
Married 24 51 3 5
Single 39 22 32
Separated 13 8 1 1
Divorced 16 13 1 4
Widowed 4 2 2
living Together 6 4 6
(N) (360) (1637) (924)
1 Based on MPS, Student Record Data Base .

Table 5d . Family Size(Percentages)
Children .per family
ChoiceMPS MPS Low Income1990 & 199 1
1 19 13 9
2 32 33 26
3 23 26 27
4 16 15 1 8
5 or more 10 15 20
(N) (294) (1611) (908)
Table 5e . Parent Education(Percentages)
Choice Parents 1990 and 1991 Data Combine d
CHOICE PARENTS
8thGrade
SomeH .S . G .E .D . H .S .
SomeSome
College Pos tCollege
Grad
Grad(N)
Mother/Femal eGuardian 3 12 11 22 45 5 2 (369)
Father/Mal eGuardian 9 16 8 28 30 6 3 (229 )
MPS PARENTS
Mother/Femal eGuardian 8 18 7 28 29 6 5 (1525 )
Father/Mal eGuardian 9 16 8 26 27 9 6 (1127 )
MPS LOW INCOMEPARENTS ONLY
Mother/Femal eGuardian 12 25 9 25 26 3 1 (881 )
Father/Mal eGuardian 15 22 9 25 21 6 2 (535 )

Table 6 .Importance of Education Compared
to Other Goal s(Percentages )
Choice Families 1990 and 1991 Data Combined
EducationMore
ImportantEducation AsImportant
EducationLess Importan t
CHOICE FAMILIES1990 AND 1991 ,
Having a Good Job 56 43 1
Having Enough Money 44 54 2in the Famil y
Maintaing 29 58 13Religion/Faith
Maintaining Family 35 60 5Ethnic Tradition
Having A Good Place 36 60 4To Live
Range=5-15 ; High=More ; Mean=11 .75 ; Std .Dev .=1 .90 ; Cronbach A= .72 ; N=361
MPS FAMILIES .
1991
EducationMore
ImportantEducation AsImportant
Educatio nLess Important (N) r
Having a Good Job 47 49 2 (1582) .44
Having Enough Money 41 54 5 (1560) .53in the Famil y
Maintaining 33 54 12 (1553) .40Religion/Faith
Maintaining Family 42 51 7 (1549) .43Ethnic Traditions
Having a Good Place 34 60 6 (1566) .53Live
Range= 5-15 ; High= More ; Mean= 11 .67 ; Std . Dev .= 1 .98 ; Cronbach A= .71 ; n= 1554
Question : "How would you rate education in your family compared to other goals? "
(366)
.40
(363)
.46
(363)
.4 1
(364)
.53
(364)
.60
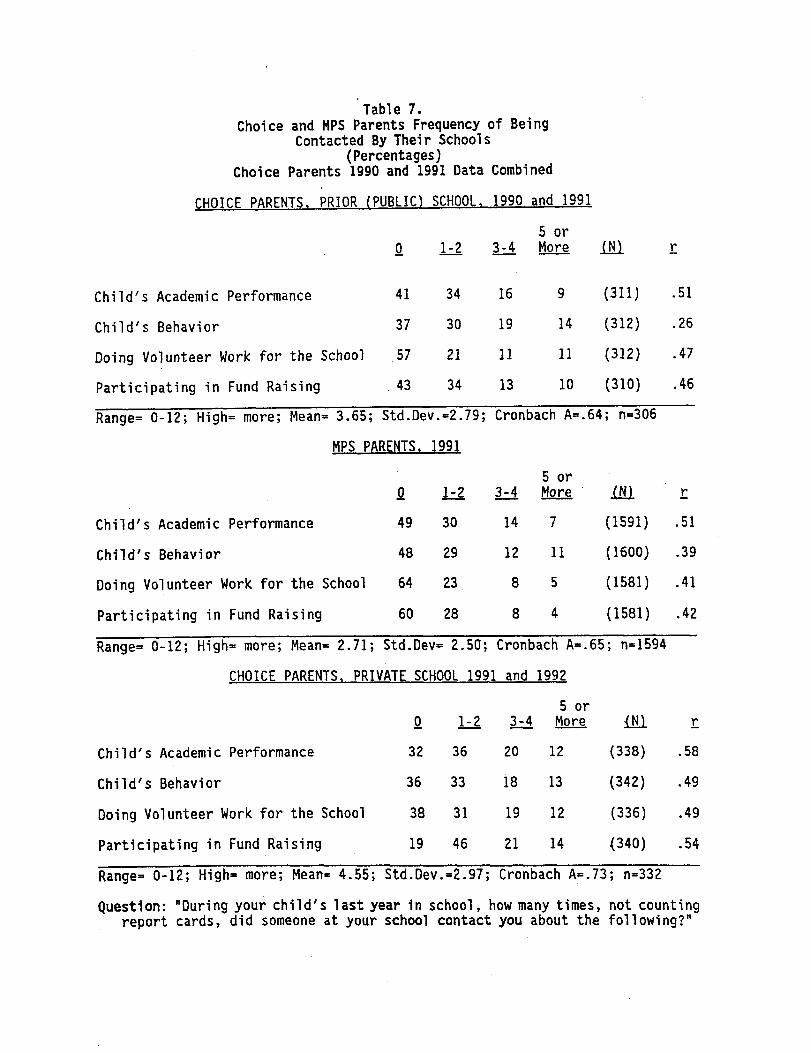
Table 7 .Choice and MPS Parents Frequency of Bein g
Contacted By Their School s(Percentages )
Choice Parents 1990 and 1991 Data Combined
CHOICE PARENTS, PRIOR (PUBLIC) SCHOOL, 1990 and 199 1
5 or0
1-2 3-4 More
r
Child's Academic Performance
41
34
16
9
(311)
.5 1
Child's Behavior
37
30
19
14
(312)
.26
Doing Volunteer Work for the School
57
21
11
11
(312)
.47
Participating in Fund Raising
43
34
13
10
(310)
.46
Range= 0-12 ; High= more ; Mean= 3 .65 ; Std .Dev .=2 .79 ; Cronbach A= .64 ; n=306
MPS PARENTS, 1991 ,
5 or0
1-2
3-4
More
Child's Academic Performance
49
30
14
7
Child's Behavior
48
29
12
1 1
Doing Volunteer Work for the School
64
23
8
5
Participating in Fund Raising
60
28
8
4
Range= 0-12 ; High= more ; Mean= 2 .71 ; Std .Dev= 2 .50 ; Cronbach A= .65 ; n=1594
CHOICE PARENTS, PRIVATE SCHOOL 1991 and 1992
5 or
0
1-2
3-4
More
Child's Academic Performance
32
36
20
1 2
Child's Behavior
36
33
18
1 3
Doing Volunteer Work for the School
38
31
19
1 2
Participating in Fund Raising
19
46
21
1 4
Range= 0-12 ; High= more ; Mean= 4 .55 ; Std .Dev .=2 .97 ; Cronbach A= .73 ; n=332
Question : "During your child's last year in school, how many times, not countin greport cards, did someone at your school contact you about the following? "
(N)
(1591)
.5 1
(1600)
.39
(1581)
.4 1
(1581)
.4 2
IN)
r
(338)
.58
(342)
.49
(336)
.49
(340)
.54

Table 8 .Choice and MPS Parents Frequency of Contactin g
Their School s(Percentages )
Choice Parents 1990 and 1991 Data Combine d
CHOICE PARENTS, PRIOR(PUBLIC) SCHOOL, 1990 and 1991 ,
0
1-2 3-45 o rMore (N) r
Child's Academic Performanc e
Class Your Child Took
Doing Volunteer Work for the Schoo l
Participating in Fund Raising
Providing Information fo rSchool Record s
Child's Behavio r
Helping in the Classroom
13
26
34
26
42
28
26
42
22
46
26
26
50
25
.
3 0
2 4
13
20
1 9
1 9
15
3 1
1 6
1 7
1 2
1 3
30
10
(313 )
(311 )
(311 )
(311 )
(305 )
(308 )
(312)
.57
.5 2
.59
.5 3
.50
.36
.58
Range= 0-21 ; High= more ; Mean=8 .75 ; Std .Dev= 4 .84 ; Cronbach A= .79 ; n=291
r
MPS PARENTS,
1991 ,
3-45 orMore In0 1-2 3-4
Child's Academic Performanc e
Class Your Child Took
45
36
2 5
11
1 9
7
(1596 )
(1568)
.59
.5 5
Doing Volunteer Work for the School
63
21 7 9 (1579) .5 2
Participating in Fund Raising
54
32 9 4 (1577) .4 5
Providing Information forSchool Records
32
45 16 7 (1568) .46
Child's Behavior
36
32 17 16 (1588) .47
Helping in the Classroom
68
20 5 7 (1584) .49
Range= 0-21 ; High= more ; Mean= 5 .95 ; Std .Dev .= 4 .27 ; Cronbach A= .78 ; n=1529

(Table 8 . cont . )
Child's Academic Performanc e
Class Your Child Took
Doing Volunteer Work for the Schoo l
Participating in Fund Raisin g
Providing Information fo rSchool Records
21
47
21
11
(335)
.53
Child's Behavior
28
33
17
22
(337)
.4 1
Helping in the Classroom
42
33
15
10
(340)
.53
Range= 0-21 ; High= more ; Mean= 9 .45 ; Std .Dev .= 4 .92 ; Cronbach A= .82 ; n=319
Question : 'During your child's last year in school, how many times, did you (o rsomeone in your household) contact the school about the following? '
CHOICE PARENTS, PRIVATE SCHOOL, 1991 and 199 2
5 o r0 1-2 3-4 More
(N)
r
15
24
32
29
(344)
.70
27
33
22
18
(340)
.62
26
31
21
22
(339)
.60
15
41
27
17
(338)
.51

Table 9 .Parental Involvement, Choice and MPS Parent s
(Percentages )
CHOICE PARENTS, PRIOR(PUBLIC) SCHOOL, 1990 and 199 1
Yes No r
Attend Parent/Teacher Conference 92 8 (307) .22
Belong to a Parent/Teacher Organization 22 78 (304) .52
Attend Meetings of Parent/Teacher Organization 56 44 (304) .50
Take Part in Activities of Parent/TeacherOrganization
50 50 CO) .58
Belong to Other Organizations Dealing Wit hSchool Matters
26 74 (3(4) .52
Range= 0-5 ; High= more involv . ; Mean=245 ; . Std . Dev .=1 .47 ; Cronbach A= .70 ; n=303
MPS PARENTS, 199 1
Yes No (N) rAttend Parent/Teacher Conference 84 16 (1593) .27
Belong to a Parent/Teacher Organization 21 79 (1579) .52
Attend Meetings of Parent/Teacher Organization 64 36 (1587) .48
Take Part in Activities of Parent/TeacherOrganization
35 65 (1585) .51
Belong to Other Organizations Dealing Wit hSchool Matters
16 84 (1573) .38
Range= 0-5 ; High= more involv . ; Mean= 1 .91 ; Std .Dev .=1 .39 Cronbach A= .67 n=1586
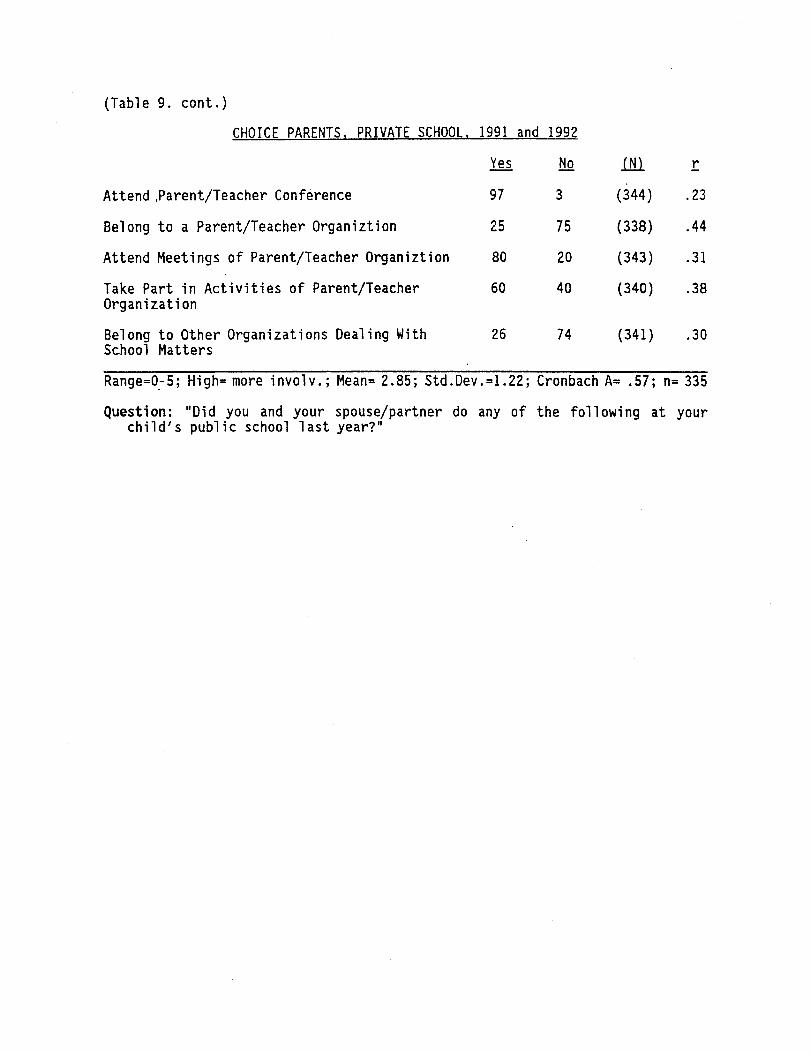
(Table 9 . cont .)
CHOICE PARENTS, PRIVATE SCHOOL, 1991 and 199 2
Yes
No (N) r
Attend ,Parent/Teacher Conference 97 3 (344) .2 3
Belong to a Parent/Teacher Organization 25 75 (338) .44
Attend Meetings of Parent/Teacher Organization 80 20 (343) .3 1
Take Part in Activities of Parent/Teache r
Organization
60 40 (340) .38
Belong to Other Organizations Dealing Wit hSchool Matters
26 74 (341) .30
Range=0-5 ; High= more involv . ; Mean= 2 .85 ; Std .Dev .=1 .22 ; Cronbach A= .57 ; n= 33 5
Question : 'Did you and your spouse/partner do any of the following at you rchild's public school last year? '

Table 10 .Parents Participation In Educationa l
Activities at Home(Percentages )
CHOICE PARENTS, PRIOR (PUBLIC) SCHOOL, 1990 and 1991
Times/Wee k
0 1-2 3-45 or
More (N )
Help With Child's Homework N/A N/A N/A N/A N/A
Read With or To Your Child 4 19 38 39 (362 )
Work on Arithmetic or Math 6 23 36 34 (360 )
Work on Penmanship or Writing 9 29 30 32 (359 )
Watch Educational Program on T .V .With your Child 12 42 26 20 (361 )
Participate Together i nSports Activities 22 39 23 16 (360 )
Range= 0-15 ; High= more ; Mean= 8 .84 ; Std .dev .= 3 .44; Cronbach A=.79 ; N=35 5
MPS PARENTS, 199 1
0 1-2
3-4
Times/Week5 orMore
(N )
Help With Child's Homework 13 26 24 37 (1562 )
Read With or To Your Child 20 26 25 29 (1596 )
Work on Arithmetic or Math 20 30 23 27 (1587 )
Work on Penmanship or Writing 33 29 19 20 (1575 )
Watch Educational
Program on T .V .With Your Child 23 39 20 18 (1603 )
Participate Together i nSports Activities 30 36 17 18 (1577)
Range= 0-15 ; High= More ; Mean= 6 .88 ; Std .Dev= 4 .21 ; Cronbach A= .83 ; N=1575
r
.7 0
.66
.73
.5 9
.50
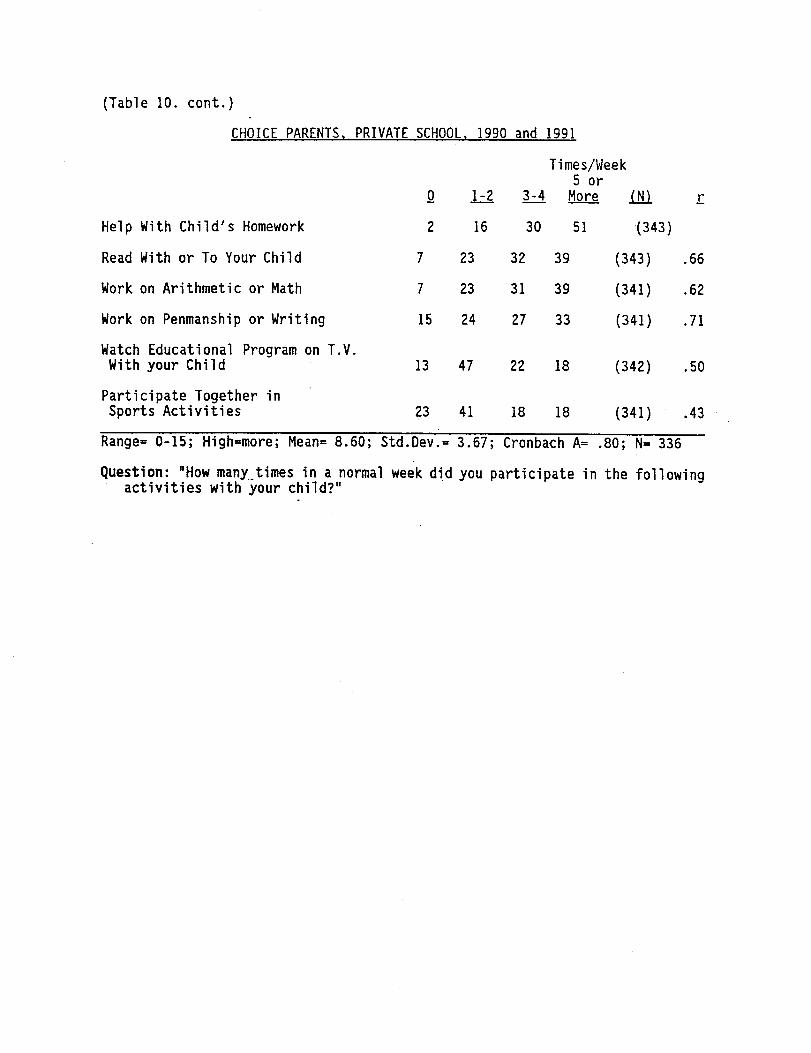
(Table 10 . cont .)
CHOICE PARENTS, PRIVATE SCHOOL, 1990 and 1991
Times/Wee k5 or
3-4 More(N)0
1-2 r
Help With Child's Homework
2
16
30
51
(343 )
Read With or To Your Child
7
23
32
39
(343)
.66
Work on Arithmetic or Math
7
23
31
39
(341)
.62
Work on Penmanship or Writing
15
24
27
33
(341)
.7 1
Watch Educational Program on T .V .With your Child
13
47
22
18
(342)
.50
Participate Together i nSports Activities
23
41
18
18
(341)
.43
Range= 0-15 ; High=more ; Mean= 8 .60 ; Std .Dev .= 3 .67 ; Cronbach A= .80 ; N= 33 6
Question : 'How many times in a normal week did you participate in the followin gactivities with your child?'

Table 11 .
Choice and MPS Parent Satisfaction WithPrior (Public) Schoo l
(Percentages )
CHOICE PARENTS,
1990 and 1991 Data Combined
Textbooks
Location of Schoo l
Opportunities for Paren t
Involvement
Teacher's Performance
Program of Instructio n
Principal Performance
Amount Child Learned
Discipline in the School
Very
Satisfied
Somewhat
Satisfied
Somewhat
DissatisfiedVery
Dissatisfied
(N)
(287 )
(316 )
(302 )
(315 )
(306 )
(302 )
(315 )
(308)
r
.63
.44
.7 2
.69
.7 5
.66
.75
.76
26
3 5
3 2
35
29
30
3 1
25
59
44
4 7
38
44
38
30
34
1 2
1 0
1 3
1 7
22
1 8
23
28
4
1 1
8
1 0
6
1 4
16
13
Range= 8-32 ; High= More Dis . ; Mean= 16 .81 ; Std . Dev .= 5 .68 ; Cronbach A= .89 N=26 2
MPS PARENTS, 199 1
VerySatisfied
SomewhatSatisfied
Somewhat
Dissatisfied
Very
Dissatisfied (N) r
Textbooks 29 63 6 1 (1441) .6 2
Location of School 41 44 10 5 (1585) .3 0
Opportunities for Parent 36 54 8 3 (1527) .6 2
Involvemen t
Teacher's Performance 40 48 9 3 (1588) .62
Program of Instruction 33 56 9 5 (1536) .70
Principal's Performance 37 48 9 5 (1519) .58
Amount Child Learned 36 47 13 4 (1576) .68
Discipline in the School 27 48 17 8 (1542) .62
Range= 8-32 ; High= More Dis . ; Mean= 14 .54 ; Std .Dev .= 4 .20 ; Cronbach A= .85 ; N=1224

Table 12a .
Choice and MPS Parent Grades ForPrior Public Schools, 1990-199 1
Choice Parent s
Grade For Prio r(Public)
School
Choice ParentsGrade For Prior
(Public)
School
MPS Parent sGrade For
Public School
MPS Low-Income
Parents Grad eFor Public Schoo l
1990 1991 1991 1991
A 14% 23% 27% 26%
B 18% 31% 39% 39%
C 32% 26% 22% 24%
D 24% 14% 8% 8%
F 12% 6% 3% 3%
Avg .Grade 2 .0 2 .5 2 .8 2 . 8
(N) (149) (169) (1591) (932 )
Table 12b .Choice Parent Grade
ForPrivate Schools, 1990 and 199 1
Choice Parent sGrade For Private
School
Choice Parent sGrade For Private
Schoo l1990 199 1
A 39% 33%
B 30% 39%
C 19% 23%
D 2% 2%
F 10% 3%
Avg .Grade 2 .9 3 . 0
(N) (120) (218)
Question : 'What overall grade would you give to your child's school (last/thi spast) year? '

Table 13 .Significance Levels of Differences in Scale Mean s
From MPS-Choice 90/91Choice 90/91 -
Choice 91/9 2
Scale Difference Differenc e
Table :
Importance of Education NS NA2
3 School Contact Parents .001 .005
4 Parents Contact School .001 .1 0
5 Parent-School Organizations .001 .00 1
6 Parent Involvement at Home .001 N S
7 Dissatisfaction with School .001 .001
Table 14 .
Prior Test Scores
Applied
Accepted
Low Incometo Choice
in Choice
MPS Control
MPS
R M R M R M R M
1990
% At or Above
50% of NPR 23 .3 31 .1 26 .8 36 .6 34 .8 42 .8 27 .2 36 . 2
Median NPR 29 31 30 33 37 42 32 37
Mean NCE 39 .1 39 .7 39 .9 41 .3 43 .6 45 .8 40 .1 4 2
Stand .
Dev .
of 15 .9 18 .9 16 .4 19 .4 18 .5 20 .2 17 .0 19 . 2
NCE
N (262) (257) (179) {175) (3157) (3130) (2136) (2117 )
1991
% At or Above 27 .1 22 .6 27 .2 22 .7 36 .1 43 .4 28 .2 36 . 2
50% of NPR
Median NPR 26 30 26 28 38 43 32 38
Mean NCE 37 .5 37 .9 37 .8 37 .5 43 .7 46 .3 40 .2 42 . 9
Stand . Dev .
of 16 .8 17 .7 16 .7 17 .4 18 .6 20 .2 17 .0 19 . 0
NCE
(N) (199) (204) (147) (150) (3668) (3643) (2470) (2447 )
R= Reading Scores
NPR= National Percentile Rankin g
M= Math Scores
NCE= Normal Curve Equivalen t
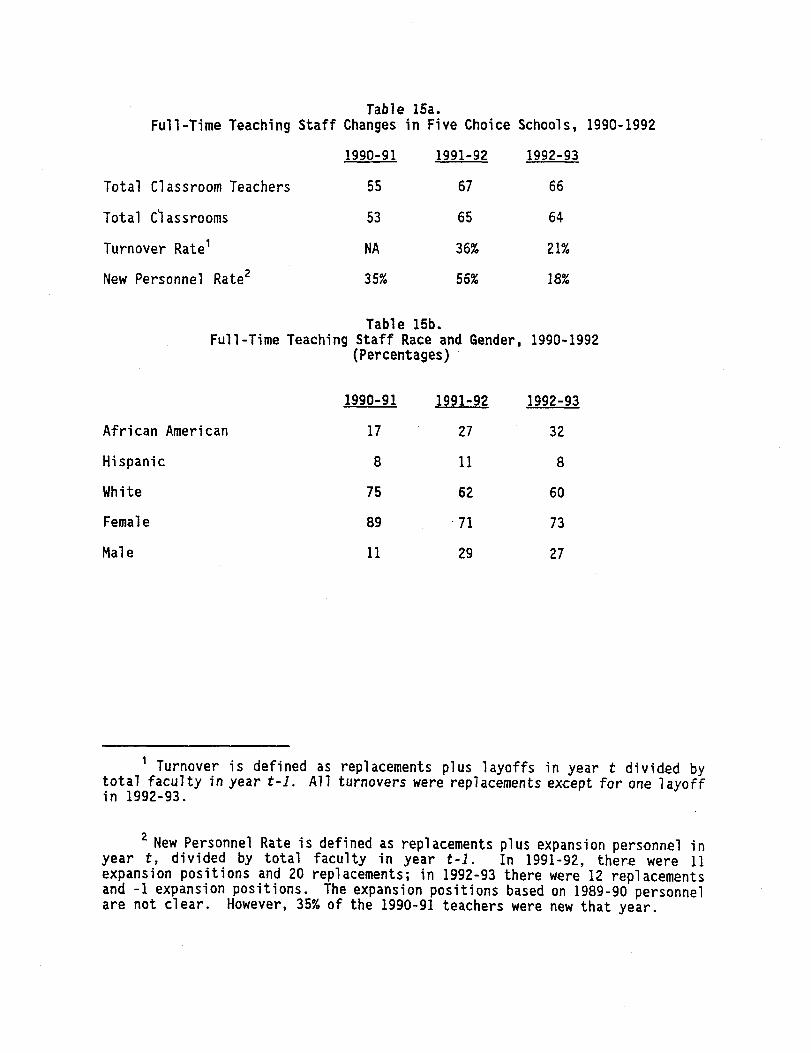
Table 15a .Full-Time Teaching Staff Changes in Five Choice Schools, 1990-1992
1990-91 1991-92 1992-93
Total Classroom Teachers 55 67 66
Total Classrooms 53 65 64
Turnover Rate NA 36% 21%
New Personnel Rate2 35% 56% 18%
Table 15b .Full-Time Teaching Staff Race and Gender, 1990-199 2
(Percentages )
1990-91 1991-92 1992-93
African American 17 27 3 2
Hispanic 8 11 8
White 75 62 60
Female 89 71 73
Male 11 29 27
1 Turnover is defined as replacements plus layoffs in year t divided b ytotal faculty in year t-1 . All turnovers were replacements except for one layof fin 1992-93 .
2 New Personnel Rate is defined as replacements plus expansion personnel i nyear t, divided by total faculty in year t-1 . In 1991-92, there were 1 1expansion positions and 20 replacements ; in 1992-93 there were 12 replacement sand -1 expansion positions . The expansion positions based on 1989-90 personne lare not clear . However, 35% of the 1990-91 teachers were new that year .

Table 16a .Achievement Test Scores, 1991 1
All
ChoiceStudents
All MPSStudents
Low-IncomeMPS
Students
% At or Above50% of NPR
R
29 .3%
M
29 .2%
R
32 .2%
M
40 .0%
R
24 .9%
M
33 .4%
Median NPR 34 32 35 40 31 3 5
Mean NCE 42 .6 40 .2 42 .2 45 .2 39 .1 42 . 0
St .
Dev .of NCE 16 .4 19 .9 17 .9 20 .0 16 .1 18 . 2
(N) (177) (185) (1967) (1957) (1433) (1419)
Table 16b .Achievement Test Scores, 199 2
2 Year .
1 Year
Low-IncomeAll Choice
Choice
Choice
All MPS
MPSStudents
Students,
Students
Students
Student s
R
M
R
M
R
M
R
M
R
M% At or Above50% of NPR 21 .2% 22 .8% 18 .3% 24 .5% 23 .6% 20 .8%32 .4% 39 .5% 25 .2% 33 .5%
Median NPR 27 28 31 28 24 28
34 40 29 35
Mean NCE 37 .3 36 .7 38 .4 37 .6 36 .3 36 .0
42 .3 44 .6 39 .3 41 . 8
St .
Dev .of NCE 16 .2 18 .0 15 .2 17 .9 17 .0 18 .1
18 .8 20 .5 17 .2 19 . 1
(N) (349) (369) (158) (158) (191) (211)
(1919) (1896) (1397) (1383 )
' The Choice scores are slightly different than those reported in 199 1because in matching this year's tests we discovered that 2 students had ba drecords, 2 had duplicates, and 7 students were tested at a lower test level than 'indicated by grade level .

Table 17a.Achievement Test Change Scores (NCEs )
Choice and MPS Students Students, 1990 to 1991 1
All
Choice MPS Low-Income MP SR MR
M R M
1990 Mean NCE 40 .0 39 .2 39 .5 41 .6 37 .5 39 . 5
St .
Dev . 13 .9 19 .6 16 .6 18 .7 15 .2 17 . 8
1991 Mean NCE 41 .8 39 .1 40 .5 44 .2 38 .2 42 . 2
St .
Dev . 14 .4 15 .3 16 .6 18 .6 15 .3 17 . 7
Mean Difference +1 .8 -0 .1 +1 .0 +2 .6 +0 .7 +2 . 7St .
Dev . 13 .1 16 .0 14 .3 14 .4 14 .7 14 . 7
Probability MeanDifference = 0 . .193 .935 .022 .000 .144 .000
(N) (84) (88) (1048) (1029) (812) (792)
Table 17b .Achievement Test Change Scores (NCEs )
Choice and MPS Students Students, 1991 to 19922
2 Year
1 YearAll Choice
Choice
ChoiceStudents
Students
StudentsAll MPSStudents
Low-IncomeMPS
Student sR M R M R M R M R M
1991 Mean NCE 39 .8 39 .0 41 .2 40 .3 36 .3 37 .1 40 .0 43 .4 38 .0 41 . 5St . Dev .
17 .0 18 .6 16 .9 19 .6 16 .7 17 .0 16 .6 18 .4 15 .1 17 . 3
1992 Mean NCE 35 .9 38 .4 37 .3 39 .0 33 .7 37 .5 40 .5 43 .1 38 .4 41 . 2St .
Dev .
13 .8 17 .0 13 .6 18 .0 14 .0 15 .4 17 .5 19 .4 16 .3 18 . 5
Mean Diff .
-3 .9 -0 .6 -4 .8 -1 .3 -2 .6 +0 .4 +0 .5 -0 .3 +0 .4 -0 . 3St .
Dev .
16 .0 16 .3 15 .4 15 .9 16 .8 17 .0 14 .2 14 .8 14 .6 15 . 3
ProbabilityMean Diff .=0 .
.001 .586 .001 .374 .183 .842 .286 .574 .484 .60 5
(N) (192) (198) (116) (120) (76) (78) (1173) (1148) (911) (895 )
1 Only students who were tested in the Spring of 1990 and the Spring of 199 1
are included . For Choice students only those who completed a full year in th eChoice schools are included . Sample sizes are small relative to the tota lstudents in the Choice Program .
2Only students who were tested in the Spring of 1991 and the Spring of 1992
are included . Sample sizes are small relative to the total students in th eChoice Program .

Table 18 .Estimated Iowa Basic Test Scores, 1991 .
Dependent Variable = Reading 1991 NCE, (Mean=40 .63, St. Dev .=16 .48 )
Independent Variable b St . Error b t Prob .
b=0 .Var .Mean
Var .St . Dev .
READING NCE 1990 .59 .02 25 .00 .000 39 .53 16 .4 4TEST GRADE 1990 - .51 .20 2 .48 .013 3 .47 1 .87GENDER (1=FEMALE) .50 .76 .66 .507 .51 .5 0LOW INC . (1=YES) -3 .22 1 .01 3 .20 .001 .77 .42AF .
AM . (1=YES) -3 .30 1 .04 3 .16 .002 .67 .4 7HISPANIC (1=YES) -2 .29 1 .53 1 .50 .135 .10 .3 0OTHERMIN . (1=YES) .37 3 .02 .12 .903 .02 .1 3CHOICE (1=YES) 1 .69 1 .43 1 .19 .236 . .08 .2 7
CONSTANT 23 .49 1 .67 14 .05 .000
St . Error of the Regression = 12 .67 ; R-sq .= .41 ; F=98 .91 (p< .000) ; df = 1124,8 .
Dependent Variable = Math 1991 NCE, (Mean=43 .91, St . Dev .=18 .43 )
Independent Variable b St . Error b t Prob . b=0 .Var .
Var .Mean
St . Dev .
MATH NCE 1990 .64 .02 29 .38 .000 41 .47 18 .76TEST GRADE 1990 -1 .01 .21 4 .84 .000 3 .49 1 .88GENDER (1=FEMALE) - .42 .79 .53 .597 .51 .50LOW INC . (1=YES) -1 .71 1 .03 1 .66 .097 .77 .4 2AF . AM . (1=YES) -3 .97 1 .08 3 .67 .000 .67 .4 7HISPANIC (1=YES) -4 .27 1 .57 2 .71 .007 .10 .3 0OTHERMIN . (1=YES) -1 .26 3 .18 .40 .693 .02 .13CHOICE (1=YES) -2 .49 1 .49 1 .67 .096 .08 .2 7
CONSTANT 25 .69 1 .77 14 .51 .000
St . Error of the Regression = 12 .98 ; R-sq .= .50 ; F=141 .586(p< .000) ; df = 1101,8 .

Table 19 .Estimated Iowa Basic Test Scores, 1992 .
Dependent Variable = Reading 1992 NCE, (Mean=39 .84, St . Dev .=17 .15 )
Independent Variable b St . Error b t Prob .
b=0 .Var .Mean
Var .St . Dev .
READING NCE 1991 .60 .02 27 .47 .000 40 .01 16 .64TEST GRADE 1991 - .56 .17 3 .29 .001 3 .69 2 .06GENDER (1=FEMALE) 1 .62 .70 2 .30 .022 .50 .50LOW INC . (1=YES) -1 .95 .90 2 .16 .031 .76 .43AF . AM . (1=YES) -6 .34 .98 6 .51 .000 .69 .46HISPANIC (1=YES) -1 .19 1 .45 .82 .413 .09 .2 9OTHERMIN . (1=YES) -1 .24 2 .70 .46 .646 .02 .1 3CHOICE (1=YES) -3 .91 1 .05 3 .73 .000 .14 .35
CONSTANT 23 .64 1 .61 14 .70 .000
St . Error of the Regression = 12 .90 ; R-sq .= .43 ; F=131 .46 (p< .000) ; df = 1351,8 .
Dependent Variable = Math 1992 NCE, (Mean=42 .42, St . Dev .=19 .15 )
Independent Variable b St . Error b t Prob . b=0 .Var .Mean
Var .St . Dev .
MATH NCE 1991 .66 .02 30 .87 .000 42 .74 18 .48TEST GRADE 1991 - .98 .18 5 .33 .000 3 .68 2 .08GENDER (1=FEMALE) .20 .75 .27 .790 .51 .50LOW INC . (1=YES) - .45 .97 .46 .643 .76 .43AF .
All . (1=YES) -5 .50 1 .06 5 .20 .000 .69 .46HISPANIC (1=YES) -1 .22 1 .56 .78 .434 .09 .29OTHERMIN . (1=YES) 1 .60 2 .98 .55 .585 .02 .13CHOICE (1=YES) -1 .49 1 .11 1 .34 .181 .14 .35
CONSTANT 22 .29 1 .75 12 .72 .000
St . Error of the Regression = 13 .72 ; R-sq .= .49 ; F=160 .03 (p< .000) ; df = 1333,8 .

Table 20a . 1Achievement Test Scores, 1991 for
Choice students who enrolled in the 1990/91 school yea rand either enrolled again in September 1991 or left the Program .
LeavingStudents
ReturningStudents
% At or AboveR M R M
50% of NPR 31 .7% 38 .7% 28 .7% 26 .9%
Median NPR 43 35 .5 34 32 . 5
Mean NCE 45 .3 42 .2 41 .6 39 . 7
St .
Dev .of NCE 15 .0 18 .6 16 .6 19 . 5
(N) (41) (44) (129) (134 )
Table 20b .Achievement Test Scores, 1992 fo r
Choice students who-enrolled in the 1991/92 school yearand either enrolled again in September-1992 or left the Program .
LeavingStudents
ReturningStudent s
% At or AboveR M R M
50% of NPR 20 .7% 21 .4% 23 .1% 24 .6%
Median NPR 21 27 .5 29 29
Mean NCE 35 .4 35 .2 38 .4 37 . 2
St .
Dev .of NCE 17 .3 17 .1 15 .7 18 . 8
(N) (87) (98) (238) (248)
1 Tables 20a and 20b do not include graduating eighth grade students .

Table 21a . 1Achievement Test Change Scores (NCEs) 1990 to 1991 .
Choice students who enrolled in the 1990/91 school yearand either enrolled again in September 1991 or left the Program .
LeavingStudents
ReturningStudents
R M R M1990 Mean NCE 44 .8 47 .5 37 .5 36 . 2
St .
Dev . 13 .3 16 .5 12 .3 20 . 5
1991 Mean NCE 44 .9 41 .6 40 .0 38 . 5St .
Dev . 13 .7 18 .0 13 .6 14 . 4
Mean Difference -0 .1 -5 .9 +2 .5 +2 . 3St .
Dev . 13 .3 18 .2 13 .4 15 . 3
Probability MeanDifference = 0 . .964 .142 .156 .267
(N) (24) (22) (58) (56)
Table 21b .Achievement Test Change. Scores (NCEs) 1991 to 1992 .
Choice students who enrolled in the 1991/92 school yea rand either enrolled again in September 1992 or left the Program .
Leaving
ReturningStudents
Student s
R M R M1991 Mean NCE 38 .4 38 .3 40 .3 39 . 3
St .
Dev . 19 .8 21 .1 16 .4 18 . 3
1992 Mean NCE 32 .9 35 .9 37 .2 39 . 2St .
Dev . 15 .7 16 .3 13 .2 17 . 8
Mean Difference -5 .5 -2 .4 -3 .2 -0 . 1St .
Dev . 16 .9 17 .0 16 .2 16 . 4
Probability MeanDifference = O . .029 .321 .032 .924
(N) (47) (49) (128) (133 )
1 Tables 21a and 21b do not include graduating eighth grade students .

Table 22 .Frequent Open-End Responses of Choice Parents Concerning the Choice Progra m
and Choice Schools, 1991 and 199 2(Percentages )
Why Continuein the Choice
Program?
Like Aboutthe ChoiceProgram?
Dislike Abou tthe ChoiceProgram?
1991 1992 1991 1992 1991 199 2Educational Quality o fthe Program 40 36 43 48 7 1 3
Other Qualities of th eSchools 15 24 24 26 26 3 1
Child Specific Qualitiesof Choice Schools 20 17 9 8 4
Want Private Education ,But Cannot Afford It 3 12 19 13 3 1 8
Transportation/Logistics 0 2 4 2 6 2 1
Tuition, Fund Raising ,Bad Experience ,Program-Not Continuing ,Selection Process 22 9 1 3 57 1 3
(N-Total Responses) (94) (144) (168) (254) (69) (78)
Questions : 'Why (or why not) do you plan to continue in the private schoo lchoice program? "
'What did you like (dislike) about the choice program ?
Key :Educational Qualities include references to 'better educational quality, "programs, class size, individual attention, etc .
Other Qualities include references to values, parental involvement ,discipline, teachers, etc .
Child Specific Qualities include references to better child performance ,better opportunities, need for special attention, etc .

Appendix A. Survey Sample Sizes and Response Rate s
SurveysMailed
SurveysNot
DeliveredSurveysReturned
Respons eRat e
MPS Parents 5474 220 1623 30 .9%5/9 1
Choice Parents 349 31 149 46 .9%Wave 1,
10/90
Choice Parents 349 33 143 45 .3%Wave 2, 6/9 1
Choice Parents 453 29 203 44 .8%Wave 1,
10/91
Choice Parents 535 38 221 44 .5%Wave2, 6/92

Appendix B . Race and Income Response Rates (Percentages )
Actual Choice Actual MPS MPSAccepted in Responded to Control Responded
Choice Survey, Oct . Group to Survey ,1990 & 1991 1990 & 1991 1991 May 199 1
Rac e
AfricanAmerican 76 .3 84 .3 55 .3 42 . 4
Asian American 0 .0 0 .0 3 .8 6 . 0
Hispanic . 17 .9 10 .6 4 .7 10 . 1
Native American .6 1 .0 .9 . 5
White 4 .3 3 .5 29 .3 40 .3

APPENDIX C: TECHNICAL NOTES AND ANALYSI S
In addition to the results reported in the main body of the report, a number ofother analyses were performed and will be performed in the future as sample size sincrease. Analyses which produced statistically significant, yet only marginallydifferent results from those reported in Tables 18 and 19, are presented in Table s C1and C2. Those models include both reading and math scores as measures of prio ryear achievement. As expected, the second test does have a significant effect o nachievement, although in each case, the "off' test has a much lower coefficent thanthe directly relevant test. Thus in the top panel of Table CI, which estimated 1991Reading, the inclusion of Math NCE 1990 has an impact on the estimation (b= .18,t=6.95) and increases the explained variance from 41% to 44%. This inclusion of asecond test also lowers the effects of the other significant variables in Table 18,including the primary test, which is correlated with the second test . The impact onthe Choice variable is modest, dropping it from +1 .69 to +1 .54. Neither estimatecomes close to being significant .
The effects of this more inclusive measure of achievement on the Choic evariable in the other estimates vary, but the conclusions described in the report d onot. On 1991 Math, two prior tests slightly increase the estimated negative effect o fbeing in a choice school from -2 .49 to -2.66. For 1992 Reading, the negative effect ofbeing in the choice program drops somewhat with both tests in the equation <from -3.91 to -3.24, Table 19, top & Table C2, top) . The probability of these coefficientsbeing non-zero is still very high. For 1992 Math, the negative effect of being in achoice school increases from a -1 .49 (Table 19, bottom) to -1 .71 (Table C2, bottom) .In both cases the probability is suspect.
We also tested for the effects of other variables, but they proved to beinsignificant. One interesting comparison is with students who applied to the Choic eProgram, but were not selected in the lotteries . Some of these students returned toMPS, and some of them were tested in the relevant year . When we include them i nregressions predicting 1991 and 1992 NCE scores, the dichotomous variablemeasuring the difference between these students and their MPS classmates neve rapproached reliable levels of statistical significance . The only time the t score wa sabove 1.0 was for 1991 Math. In that case, the students looked almost identical to th echoice students (b = -2 .88, compared to -2.66), but the standard error was much large r(2.70) reflecting the small number of rejected students .
A number of other analyses are planned for the future. The variables includedin the regressions reported in Tables 18, 19, C1, and C2 are all based on either th eMPS Student Record Data Base or indicators from the test files . These measures donot contain potentially relevant data concerning some family demographics (e .g .parent education, family size), parental involvement or parental attitudes . Oursurveys provide that data for those who responded . As sample sizes increase, it wil lbecome feasible to incorporate those data, properly weighted for response bias . Alsoas sample sizes increase-over the years, we will be able to test for differences between

those who leave and those who remain in the program . Accepted procedures tocontrol statistically for any relevant differences exist and will be used .
A more difficult econometric problem is dealing with measurement error i nthe Iowa Tests . Although the reliabilities of these tests are high ( .7 to .9), making i tunlikely that results will change, it is possible that measurement error could have anon-random impact on test scores . There are two ways to control for this error . Thefirst is a two-stage-least squares model in which the prior test(s) are estimated, wit hthe predicted values then becoming independent variables in second-year tes testimation models. Our attempt at this using existing variables produced very poorestimates of prior tests (R-squareds of .09 to .11). The subsequent estimates ofsecond-year results were also not robust. Success with this method in the past hasbeen at the high school level where variables such as courses taken and trackingproduced better estimated scores .
A second method is to correct for the errors in the test scores by truncating th evariance in proportion to the measurement error of the test . The problem is thatmeasurement errors of Iowa Tests are computed for raw scores and we are forced t ouse NCEs for this analysis . An effort will be made to simulate measurement error i nNCEs based on raw score estimates .
8907148500 7
3111111111111 DATE DUE
Demco, inc . x c~

Table C1 . Estimated Iowa Basic Test Scores, 1991 ,With Two Prior Test Scores .
Dependent Variable = Reading 1991 NCE, (Mean=40 .73, St . Dev .=16 .44 )Var .
Var .Independent Variabl eREADING NCE 1990MATH NCE 199 0TEST GRADE 1990GENDER
(1=FEMALE)LOW INC . (1=YES )AF . AM . (1=YES )HISPANIC (1=YES )OTHERMIN . (1=YES )CHOICE
(1=YES )
CONSTANT
b St . Error b t Prob . b=0 . Mean St .Dev ..48 .03 16 .89 .000 39 .66 16 .49.18 .03 6 .95 .000 41 .56 18 .73
- .36 .20 1 .76 .079 3 .46 1 .851 .05 .75 1 .41 .159 .51 .50
-2 .79 -.99 2 .82 .005 .78 .42-2 .38 1 .03 2 .31 .021 .67 .47-2 .22 1 .49 1 .49 .137 .10 .3 0
.59 2 .94 .20 .842 .02 .1 31 .54 1 .41 1 .09 .276 .08 .27
18 .86 1 .77 10 .64 .000
St . Error of the Regression = 12 .31 ; R-sq .= .44 ; F=91 .57 (p< .000) ; df = 1102,9 .
Dependent Variable = Math 1991 NCE, (Mean=43 .91, St . Dev .=18 .44 )Var . Var .
Independent Variable b St . Error b t Prob . b=0 . Mean St .Dev .
MATH NCE 1990 .58 .03 21 .87 .000 41 .53 18 .7 7READING NCE 1990 .13 .03 4 .30 .000 39 .76 16 .5 2TEST GRADE 1990 -1 .04 .21 4 .93 .000 3 .49 1 .8 7GENDER
(1=FEMALE) - .73 .79 .93 .352 .51 .50LOW INC .
(1=YES) -1 .11 1 .03 1 .08 .282 .77 .4 2AF . AM .
(1=YES) -3 .85 1 .08 3 .57 .000 .67 .4 7HISPANIC
(1=YES) -3 .89 1 .57 2 .48 .013 .10 .30OTHERMIN .
(1=YES) -1 .11 3 .15 .35 .726 .02 .13CHOICE
(1=YES) -2 .66 1 .48 1 .80 .072 .08 .2 7
CONSTANT 22 .81 1 .85 12 .32 .000
St . Error of the Regression = 12 .87 ; R-sq .= .51 ; F=130 .19 (p< .000) ; df - 1094,9 .

Table C2 . Estimated Iowa Basic Test Scores, 1992, With Two Prior Test Scores .
Dependent Variable = Reading 1992 NCE, (Mean=39 .94, St . Dev .=17 .16)
Var . Var .b St . Error b t Prob .
b=0 . Mean St .Dev .
.49 .03 18 .27 .000 40 .15 16 .60
.17 .02 7 .04 .000 42 .73 18 .5 7- .41 .17 2 .74 .006 3 .69 2 .061 .80 .70 2 .56 .011 .50 .5 0
-1 .88 .90 2 .09 .037 .76 .43-5 .32 .98 5 .43 .000 .69 .46
- .90 1 .44 .62 .533 .09 .2 9.15 2 .71 .06 .956 .02 .1 3
-3 .24 1 .04 3 .11 .002 .14 .3 5
19 .48 1 .71 11 .38 .000
St . Error of the Regression = 12 .70 ; R-sq .= .45 ; F=123 .53 (p< .000) ; df = 1324,9 .
Dependent Variable - Math 1992 NCE,
(Mean=42 .42, St . Dev .=19 .20)Var . Var .
Independent Variable b St . Error b t Prob . b=0 Mean St .Dev .
MATH NCE 1991 .59 .03 22 .49 .000 42 .73 18 .5 1READING NCE 1991 .14 .03 4 .83 .000 40 .07 16 .57TEST GRADE 1991 -1 .00 .19 5 .36 .000 3 .69 2 .06GENDER
(1=FEMALE) - .01 .76 .02 .987 .50 .50LOW INC .
(1=YES) .36 .98 .37 .712 .76 .43AF . AM .
(1=YES) -5 .53 1 .06 5 .23 .000 .69 .4 6HISPANIC
(1=YES) -1 .19 1 .56 .76 .446 .09 .2 9OTHERMIN .
(1=YES) 1 .60 2 .96 .54 .590 .02 .1 3CHOICE
(1=YES) -1 .71 1 .13 1 .52 .129 .14 .35
CONSTANT
19 .14
1 .85
10 .32
.000
St . Error of the Regression = 13 .61 ; R-sq .= .50 ; F=145 .85 (p< .000) ; df = 1307,9 .
8907148500 7
Independent Variabl e
READING NCE 199 1
MATH NCE 199 1TEST GRADE 199 1
GENDER
(1=FEMALE )LOW INC . (1=YES )
AF . AM . (1=YES )HISPANIC (1=YES )
OTHERMIN . (1=YES )CHOICE
(1=YES )
CONSTANT