second social action fund - world bankdocuments.worldbank.org/curated/en/... · second social...
TRANSCRIPT

Report No. 106388
JUNE 28, 2016
TANZANIA
Second Social Action Fund
Pub
lic D
iscl
osur
e A
utho
rized
Pub
lic D
iscl
osur
e A
utho
rized
Pub
lic D
iscl
osur
e A
utho
rized
Pub
lic D
iscl
osur
e A
utho
rized

© 2016 International Bank for Reconstruction
and Development / The World Bank
1818 H Street NW
Washington DC 20433
Telephone: 202-473-1000
Internet: www.worldbank.org
This work is a product of the staff of The World
Bank with external contributions. The findings,
interpretations, and conclusions expressed in
this work do not necessarily reflect the views of
The World Bank, its Board of Executive
Directors, or the governments they represent.
The World Bank does not guarantee the
accuracy of the data included in this work. The
boundaries, colors, denominations, and other
information shown on any map in this work do
not imply any judgment on the part of The
World Bank concerning the legal status of any
territory or the endorsement or acceptance of
such boundaries.
RIGHTS AND PERMISSIONS
The material in this work is subject to copyright.
Because The World Bank encourages
dissemination of its knowledge, this work may be
reproduced, in whole or in part, for
noncommercial purposes as long as full
attribution to this work is given.
Any queries on rights and licenses, including
subsidiary rights, should be addressed to
World Bank Publications, The World Bank
Group, 1818 H Street NW, Washington, DC
20433, USA; fax: 202-522-2625; e-mail:

Report No.: 106388
PROJECT PERFORMANCE ASSESSMENT REPORT
TANZANIA SECOND SOCIAL ACTION FUND (IDA-4002, IDA-4636)
June 28, 2016
IEG Human Development and Economic Management Department Independent Evaluation Group
This document has a restricted distribution and may be used by recipients only in the performance of their official duties. Its contents may not otherwise be disclosed without authorization.

ii
Currency Equivalents (Annual Averages)
Currency Unit = Tanzania Shilling (T Sh)
2004 US$1.00 T Sh 1.10 2005 US$1.00 T Sh 1.12 2006 US$1.00 T Sh 1.25 2007 US$1.00 T Sh 1.24 2008 US$1.00 T Sh 1.19 2009 US$1.00 T Sh 1.32 2010 US$1.00 T Sh 1.40 2011 US$1.00 T Sh 1.57 2012 US$1.00 T Sh 1.58 2013 US$1.00 T Sh 1.61 Abbreviations and Acronyms
APL Adaptable Program Loan CAS country assistance strategy CB-CCT community-based conditional cash transfer CCT conditional cash transfer CDD community-driven development CMC community management committee COMSIP Community Savings and Investment Promotion DFA Development Financing Agreement ICR Implementation Completion and Results Report IDA International Development Association IEG Independent Evaluation Group LGA local government administration LGRP Local Government Reform Program LGSP Local Government Support Project MASAF Malawi Social Action Fund MDG Millennium Development Goals NGO nongovernmental organization NSC National Steering Committee NVF National Village Fund PAD project appraisal document PDO project development objective PPAR Project Performance Assessment Report TASAF Tanzania Social Action Fund WDR World Development Report Fiscal Year
Government: July 1 – June 30
Director-General, Independent Evaluation : Ms. Caroline Heider Director, Human Development and Economic Management, IEGHE : Mr. Nick York Manager, Human Development and Corporate Evaluations, IEGHC : Ms. Marie Gaarder Task Manager : Ms. Elena Bardasi

iii
Contents
Contents ............................................................................................................................. iii
Principal Ratings ................................................................................................................. v
Key Staff Responsible ......................................................................................................... v
Preface ............................................................................................................................... vii
Summary ............................................................................................................................ ix
1. Background and Context................................................................................................. 1
Socioeconomic Context .................................................................................................. 1
The TASAF Program ...................................................................................................... 2
2. Objectives and Design and Their Relevance .................................................................. 7
Project Development Objectives..................................................................................... 7
Relevance of Objectives ................................................................................................. 8
Project Design ................................................................................................................. 8
Component 1: The National Village Fund (NVF) ...................................................... 8
Component 2: Capacity Enhancement ........................................................................ 9
Significant Changes ...................................................................................................... 10
Relevance of Design ..................................................................................................... 10
3. Implementation ............................................................................................................. 12
Implementation Arrangements...................................................................................... 12
Implementation Experience .......................................................................................... 14
Subproject Selection ................................................................................................. 14
Project Costs ............................................................................................................. 15
Project Design ........................................................................................................... 15
LGA Capacity ........................................................................................................... 16
Innovative Initiatives ................................................................................................ 16
Targeting ................................................................................................................... 17
Gender ....................................................................................................................... 18
4. Achievement of the Objectives ..................................................................................... 18
Original Project Development Objective ...................................................................... 18
Revised Project Development Objective ...................................................................... 19
Project Development Objective to Assess Efficacy...................................................... 19
Objective 1: empowerment of Local Communities to Request, Implement, And Monitor Subprojects.................................................................................................. 19
This report was prepared by Elena Bardasi and Hjalte Sederlof, who assessed the project in November 2015. The report was peer reviewed by Pia Schneider and panel reviewed by Christopher D. Nelson. Carla Fabiola Chacaltana provided administrative support.

iv
Objective 2: Improved Access of Beneficiary Households to Enhanced Socioeconomic Services ........................................................................................... 20
Objective 3: Improved Access of Beneficiary Households to Improved Livelihoods................................................................................................................................... 23
5. Efficiency ...................................................................................................................... 25
6. Ratings .......................................................................................................................... 27
Outcome ........................................................................................................................ 27
Risk to Development Outcome ..................................................................................... 28
Bank Performance ......................................................................................................... 29
Quality at Entry ......................................................................................................... 29
Quality of Supervision .............................................................................................. 30
Borrower Performance .................................................................................................. 30
Government Performance ......................................................................................... 30
Implementing Agency Performance ......................................................................... 31
Monitoring and Evaluation ........................................................................................... 31
Safeguard Compliance .................................................................................................. 32
Fiduciary Compliance ................................................................................................... 32
7. Lessons .......................................................................................................................... 33
References ......................................................................................................................... 35
Appendix A. Basic Data Sheet .......................................................................................... 37
Appendix B. List of Persons Met ...................................................................................... 40
Boxes
Box 1.1. Decentralization in Tanzania ................................................................................ 3 Box 1.2. Minimum Standards for Good Governance ......................................................... 5 Box 7.1. Giving Incentives for Pro-Poor Investments in Local Planning Processes ........ 34
Tables
Table 1.1. TASAF I–III. Main Features ............................................................................. 6 Table 2.1. Key Dates ......................................................................................................... 10 Table 3.1. Tasks in Project Implementation ..................................................................... 13 Table 5.1. Technical Audit Findings on Costs .................................................................. 28

v
Principal Ratings
ICR* ICR Review* PPAR
Outcome Satisfactory Satisfactory Moderately
Unsatisfactory
Risk to Development Outcome
Moderate Moderate Substantial
World Bank Performance
Satisfactory Satisfactory Moderately
Unsatisfactory
Borrower Performance
Satisfactory Satisfactory Satisfactory
* The Implementation Completion and Results Report (ICR) is a self-evaluation by the responsible World Bank department. The ICR Review is an intermediate Independent Evaluation Group (IEG) product that seeks to independently verify the findings of the ICR.
Key Staff Responsible
Project Task Manager/Leader Division Chief/ Sector Director
Country Director
Appraisal Nginya Mungai
Lenneiye Dzingai B. Mutumbuka Judy O’Connor
Completion Ida Manjolo Lynne D. Sherburne-
Benz Philippe Dongier

vi
Independent Evaluation Group Mission: Improving World Bank Group development results through excellence in evaluation.
About this Report
The Independent Evaluation Group (IEG) assesses the programs and activities of the World Bank for two purposes: first, to ensure the integrity of the World Bank’s self-evaluation process and to verify that the World Bank’s work is producing the expected results, and second, to help develop improved directions, policies, and procedures through the dissemination of lessons drawn from experience. As part of this work, IEG annually assesses 20-25 percent of the World Bank’s lending operations through fieldwork. In selecting operations for assessment, preference is given to those that are innovative, large, or complex; those that are relevant to upcoming studies or country evaluations; those for which Executive Directors or World Bank management have requested assessments; and those that are likely to generate important lessons.
To prepare a Project Performance Assessment Report (PPAR), IEG staff examine project files and other documents, visit the borrowing country to discuss the operation with the government, and other in-country stakeholders, and interview World Bank staff and other donor agency staff both at headquarters and in local offices as appropriate.
Each PPAR is subject to internal IEG peer review, panel review, and management approval. Once cleared internally, the PPAR is commented on by the responsible World Bank department. The PPAR is also sent to the borrower for review. IEG incorporates both World Bank and borrower comments as appropriate, and the borrowers’ comments are attached to the document that is sent to the World Bank’s Board of Executive Directors. After an assessment report has been sent to the Board, it is disclosed to the public.
About the IEG Rating System for Public Sector Evaluations
IEG’s use of multiple evaluation methods offers both rigor and a necessary level of flexibility to adapt to lending instrument, project design, or sectoral approach. IEG evaluators all apply the same basic method to arrive at their project ratings. Following is the definition and rating scale used for each evaluation criterion (additional information is available on the IEG website: http://ieg.worldbankgroup.org/).
Outcome: The extent to which the operation’s major relevant objectives were achieved, or are expected to be achieved, efficiently. The rating has three dimensions: relevance, efficacy, and efficiency. Relevance includes relevance of objectives and relevance of design. Relevance of objectives is the extent to which the project’s objectives are consistent with the country’s current development priorities and with current World Bank country and sectoral assistance strategies and corporate goals (expressed in Poverty Reduction Strategy Papers, Country Assistance Strategies, Sector Strategy Papers, and Operational Policies). Relevance of design is the extent to which the project’s design is consistent with the stated objectives. Efficacy is the extent to which the project’s objectives were achieved, or are expected to be achieved, taking into account their relative importance. Efficiency is the extent to which the project achieved, or is expected to achieve, a return higher than the opportunity cost of capital and benefits at least cost compared with alternatives. The efficiency dimension generally is not applied to adjustment operations. Possible ratings for Outcome: Highly Satisfactory, Satisfactory, Moderately Satisfactory, Moderately Unsatisfactory, Unsatisfactory, Highly Unsatisfactory.
Risk to Development Outcome: The risk, at the time of evaluation, that development outcomes (or expected outcomes) will not be maintained (or realized). Possible ratings for Risk to Development Outcome: High, Significant, Moderate, Negligible to Low, Not Evaluable.
World Bank Performance: The extent to which services provided by the World Bank ensured quality at entry of the operation and supported effective implementation through appropriate supervision (including ensuring adequate transition arrangements for regular operation of supported activities after loan/credit closing, toward the achievement of development outcomes). The rating has two dimensions: quality at entry and quality of supervision. Possible ratings for World Bank Performance: Highly Satisfactory, Satisfactory, Moderately Satisfactory, Moderately Unsatisfactory, Unsatisfactory, Highly Unsatisfactory.
Borrower Performance: The extent to which the borrower (including the government and implementing agency or agencies) ensured quality of preparation and implementation, and complied with covenants and agreements, toward the achievement of development outcomes. The rating has two dimensions: government performance and implementing agency(ies) performance. Possible ratings for Borrower Performance: Highly Satisfactory, Satisfactory, Moderately Satisfactory, Moderately Unsatisfactory, Unsatisfactory, Highly Unsatisfactory.

vii
Preface
This Project Performance Assessment Report (PPAR) assesses the performance of the second Tanzania Social Action Fund (TASAF II) project, implemented over the period FY2005–FY2012. It was approved by the Board of Executive Directors on November 30, 2004, declared effective on May 11, 2005, and closed on June 30, 2013.
The report presents findings based on a review of the project appraisal document, the Implementation Completion and Results Report, Implementation Status and Results Reports, and other relevant materials. In addition, information for this assessment was obtained from interviews conducted during an Independent Evaluation Group (IEG) mission to Tanzania in November 2015 with government officials, the TASAF project management team, local government authorities, village and community representatives, project beneficiaries, members of the donor community, and World Bank staff. A list of people met is included in appendix B.
This report was prepared by Hjalte Sederlof, IEG consultant. The cooperation of all stakeholders, in particular the TASAF management team and the World Bank country office in Dar es Salaam are gratefully acknowledged.
Following standard IEG procedures, the report has been be sent to the government officials and agencies in Tanzania for review and comments. No comments were received.


ix
Summary
This PPAR evaluates the performance of the second Tanzania Social Action Fund project (TASAF II, P085786), a community-development fund project, approved by the Board of Executive Directors of the International Development Association (IDA) on November 30, 2004. The size of the credit was originally US$150 million. During implementation, a Japanese Social Development Fund grant of US$1.88 million was added to pilot a community-based conditional cash transfer (CB-CCT) program; and two additional financings of US$30 million and US$35 million, respectively, were added to the credit in 2009 and 2012 to mitigate the effects of external economic and weather shocks on beneficiaries. With the additional financings, the closing date of the project was extended from June 30, 2010, to June 30, 2012, and then to June 30, 2013.
At the time of TASAF I approval in July 2000, Tanzania was one of the poorest countries in the world, with a per capita gross domestic product (GDP) of some US$240. About 50 percent of the population of 34.6 million was considered poor and 36 percent extremely poor. Human development indicators and access to services were well below average for Sub-Saharan Africa and were especially severe among the poor. Tanzania had experienced strong economic growth during the latter part of the 1990s, averaging about 4 percent per year, and could point to steady progress on poverty reduction; however, with half the population still in poverty, it was increasingly recognized that growth was only slowly translating into benefits for the poor. Faced with the challenge, the government set its policies to explicitly address income poverty and human capital deficiencies among the poor and to reduce extreme vulnerability. Community mobilization, and empowerment, accountability, and improved governance became key policy themes, and decentralization the preferred means of pursuing them. A community-driven development (CDD) approach was seen as an effective means to support these policy themes.
The TASAF program was launched against this background. TASAF offered an approach to poverty alleviation that also supported the decentralization agenda by ensuring that citizens at the grassroots level would have a voice in the planning and implementation of local development initiatives. The first TASAF project, approved in 2000, was a pilot project that introduced participatory processes, with communities taking part in selecting and implementing subprojects, which included household-level earnings opportunities. TASAF II scaled up the program to the national level. It continued financing service infrastructure (subprojects) and public works, while at the same time mainstreaming financial and administrative processes for decentralized governance into the local government administration. It also introduced elements of a productive safety net that targeted the poorest in the community, including a voluntary group savings/investment mechanism, and grants for income earning opportunities. TASAF II’s development objective was broad: “to empower communities to access opportunities so that they can request, implement and monitor the delivery of services through subprojects that contributed to improved livelihoods and the attainment of the associated Millennium Development Goals (MDGs) indicators specified in the Borrower’s Poverty Reduction Strategy” (World Bank 2004a, p. 5). In 2009, to make the results framework more operational and easier to monitor, the project development

x
objective (PDO) was reformulated and key indicators were revised with the introduction of the first additional financing. The new objective was “to improve access of beneficiary households to enhanced socioeconomic services and income-generating opportunities” (World Bank 2009, p. 18). The two objectives are different. The original PDO included three goals: community empowerment, access to improved socioeconomic services, and improved livelihoods. However, the MDGs cannot be adopted as a goal for the project; they provide an overarching objective, and attribution is difficult to assess. The revised PDO includes two of those goals: access to improved socioeconomic services and improved livelihoods. Empowerment is no longer an objective.
The PPAR assessed the achievement of project outcomes against the following three objectives:
Empowerment of local communities to request, implement, and monitor subprojects Improved access of beneficiary households to enhanced socioeconomic services Improved access of beneficiary households to improved livelihoods
The assessment applied a split rating: the original PDO was assessed against all three objectives, whereas the revised PDO was assessed against the latter two objectives.
The project had two components for achieving the objectives: (i) a National Village Fund (NVF) to finance subprojects to improve community access to basic services and increase incomes of poor and vulnerable households, and (ii) a capacity enhancement component to finance information campaigns, technical assistance, and capacity building for local authorities and communities to facilitate participatory planning and implementation of subprojects (i.e., empowerment).
The project outcome is rated moderately unsatisfactory. The ratings are based on the following assessments:
The outcome for the original PDO is rated moderately unsatisfactory. The relevance of the original PDO is rated substantial, reflecting the continued relevance of project objectives to the country situation, government policy, and World Bank strategy, but also recognizing the change in emphasis of government and World Bank interventions toward safety net policies. The relevance of design is rated modest for the original objective, due to issues with the formulation of the objective and indicators. Achievement of objectives is rated modest for the empowerment objective in the absence of defined outputs and outcomes, modest for the enhanced socioeconomic services objective with only limited information on results of increased access to services, and substantial for the improved livelihood objective, with strong livelihood-enhancing results. Efficiency is rated modest.
The outcome for the revised project objective is rated moderately satisfactory. The relevance of the revised PDO is rated substantial, reflecting continued relevance to the country situation, and government and World Bank strategies. Relevance of design is rated substantial, with a straightforward PDO and clear links between outputs, outcomes, and the PDO. Achievement of objectives is rated modest for the enhanced socioeconomic services objective, reflecting only limited information of results of increased access to services; and substantial for the improved livelihood

xi
objective, which displayed strong livelihood-enhancing results. Efficiency is rated modest.
Based on a split rating, the weighted value of the outcome under the original objective and the revised objective, with 60 percent of the grant disbursed prior to the revision, is 3.4, or 3 when rounded to the nearest whole number, for an overall outcome rating of moderately unsatisfactory.
Other ratings were as follows:
The risk to development outcome is rated significant. There is not strong evidence of a robust decentralization process to pursue participatory priority setting at LA and community levels. There appears to be some confusion at community levels as to the ownership and consequently the operational responsibility for investments. Indicators of empowerment (participation rates and ownership) appear moderate. Finally, no further World Bank CDD operations are currently envisaged. The World Bank’s performance is rated moderately unsatisfactory, with quality at entry rated moderately unsatisfactory and supervision rated moderately satisfactory. The former rating reflects significant shortcomings in the results framework and in monitoring and evaluation design and delays in finalizing the project’s operating manual. Although the supervision team was proactive and able to work well with the TASAF team and government in addressing issues as they arose, a belated revision of the project and uncertain data tracking influenced the rating. Overall government performance is rated satisfactory, as is the performance of the government and implementing agency TASAF. Government support for the project and for TASAF was consistent and facilitated the work of the TASAF management unit. TASAF, despite staffing changes, was able to maintain solid oversight of the project.
The main lessons to draw from the project are as follows:
Mainstreaming of the social fund subproject process at the local government level can strengthen outcomes of decentralized planning. A central feature of TASAF II was the introduction of a participatory planning process between communities and local authorities in shaping district-level investment programs. Although the weight of decision making—final subproject selection and design features—was with the local authorities and sector ministries to ensure standards and adequate operating arrangements, community preferences came to be voiced and recognized in the process of setting priorities and shaping plans.
Community participation in the local planning process does not ensure that community priorities are realized. The institutions for implementing the subproject cycle in social funds may provide reasonable assurances that community priorities are implemented. This is not necessarily the case when social fund practice is integrated into the local development planning process. Then project selection may then more likely be driven by national and local government investment priorities that may or may not coincide with community preferences. The capabilities of the local authorities then become particularly important, especially the ability of their field-level agents to advise communities, remain neutral in their advice, and mediate between the interests of targeted

xii
beneficiaries and vested interests. When there is high turnover of staff, continuous training of field agents becomes an important auxiliary function.
When poverty alleviation is the underlying goal, as in TASAF, a combination of interventions can be effective. TASAF evolved from a straightforward social fund that financed socioeconomic infrastructure projects to extend access to basic economic and social services to a project that combined that activity with productive safety nets for improved livelihoods. Although they initially seemed to be disparate components, they in fact came to form the elements of an integrated strategy for improving people’s basic economic security.
Setting realistic guidelines can improve subproject outcomes. To promote better subproject outcomes, project design should include mechanisms to ensure that subprojects are affordable and suited to community management and maintenance and to ensure that national construction standards are met in the implementation of service delivery and public works subprojects. Implementation of TASAF I identified that while sector norms and standards exist, they may be poorly enforced at the local level for a variety of reasons that range from capacity constraints to vested interest to subproject financing. To address this issue, TASAF II adopted sectoral standards for facility design, developed by the sectoral ministries. To address the lax enforcement of sectoral norms and standards at the local level, TASAF II established a Sectoral Expert Team, which comprises higher-level representatives from sectoral ministries who review and authorize all subprojects for conformity with sector norms and standards and ensure any necessary staffing positions or additional equipment are integrated into sector planning.
1
1. Background and Context
1.1 This Project Performance Assessment Report (PPAR) reviews the performance of the second Tanzania Social Action Fund project (TASAF II, P085786), approved by the World Bank’s Board of Executive Directors on November 30, 2004. Although this review focuses on TASAF II, it does so in the context of a series of TASAF projects starting in the year 2000, when TASAF I was introduced, to 2017, when TASAF III, a Productive Social Safety Net Project (P124045) is expected to close.
Socioeconomic Context
1.2 At the time of TASAF I approval in July 2000, Tanzania was one of the poorest countries in the world, with a per capita gross domestic product (GDP) of some US$240. The population was estimated at 34.6 million and was growing at an annual rate of 2.9 percent (National Bureau of Statistics 2002). The mainstay of the economy was and continues to be agriculture, which constitutes about 45 percent of GDP and is a source of livelihood for over 70 percent of the population. Some 50 percent of Tanzanians lived in households that were classified as poor in 2000, with 36 percent considered extremely poor.1, 2 Poverty was especially high in rural areas, where 61 percent of the population was poor, compared with 39 percent in urban areas. Human development indicators and access to basic services rated well below averages for Sub-Saharan Africa. Life expectancy was 43 years at birth; maternal mortality was 529 per 100,000 live births; and infant mortality was 104 per 1,000 live births. Some 29 percent of children under age 5 years were malnourished. Among factors contributing to ill health were limited access to safe water and inadequate sanitation: only 49 percent of the population had access to clean water, and more than 90 percent of households were still using traditional pit latrines. Net primary school enrollment rates were below 60 percent, and illiteracy was 28 percent. Stark differences existed between the poor and better-off households in their access to basic services.
1.3 With strong economic growth during the latter part of the 1990s, averaging about 4 percent per year, steady progress had been made in poverty reduction. But with half the population still mired in poverty, it was increasingly recognized that growth was only slowly translating into benefits for the poor. The ability of the poor to benefit from growth was being impaired by inequities in resource endowments: low human development and lack of access to productive assets and credit. It was aggravated by a high total fertility rate depressing per capita incomes and high inequality, where a Gini coefficient of 0.35 emphasized sharp urban–rural imbalances. It was recognized that to be effective in the face of rapid population growth, growth strategy would need to be more inclusive—creating better opportunities for the poor to contribute and participate in economic growth. The emphasis needed to be placed on ensuring equitable access to education, nutrition, and health services and on raising their quality; on measures that facilitate household savings and investment; and on safety nets to mitigate the impact of shocks that create poverty traps for the poor. Faced with such policy challenges, the
1 Household budget survey, 2001. 2 Based on an income equivalent of US$1 and $0.75 per day, respectively.

2
government adjusted its poverty reduction strategy in 1997 to explicitly address income poverty, improve human capital, and reduce extreme vulnerability. The strategy envisaged a reduction in poverty of 50 percent by 2010 and eradication by 2025, mainly through economic growth and policies that would more directly benefit the poor.
1.4 Decentralization was identified as the best approach to tackle poverty reduction. In 1998, it introduced a Local Government Reform Program (LGRP), including devolving substantial political, administrative, and financial powers to local government administrations (LGAs).3 The first TASAF project was introduced two years later, in August 2000. Both initiatives were underpinned by the belief that LGAs were in a better position to identify people’s needs and that poverty reduction was likely to be achieved faster and be more sustainable if the poor were given a voice in the design and implementation of poverty-alleviation measures. Empowerment, accountability, and improved governance became key policy themes, and Tanzania’s decentralization program the preferred mechanism for pursuing them. It introduced a top-down, bottom-up process (see box 1.1) that encouraged citizen participation in planning and implementing local development. At the same time, it was thought that a more engaged citizenry cooperating with LGAs would make the latter more responsible and accountable for results.4
1.5 TASAF II was introduced in 2004 against a background of continued economic growth that had averaged 5.8 percent since 2000 and reached 6.8 percent in 2005. The 2007 household budget survey indicated that there had been some reduction in poverty between 2000 and 2007, and there had been progress in non-income aspects of well-being. Net primary school enrollments had increased from 57 percent in 2000 to 95 percent in 2005. Life expectancy had increased, and infant and child mortality rates had dropped by some 30 percent and 20 percent, respectively. Literacy remained low, and more than one-third of all children under age five were still malnourished. The proportion of the rural population with safe water remained low. The high rate of population growth continued to dilute the impact of GDP growth on household well-being, maintaining tensions between resource requirements for private consumption and those available for building assets.
The TASAF Program
1.6 The TASAF program offered an approach to poverty alleviation in rural and peri-urban areas that also promoted the government’s decentralization agenda by ensuring that citizens at the grassroots level would be involved in the planning and implementation of development programs in their local area. Through participatory planning and budgeting, development programs would be relevant to local needs and likely to address critical
3 Government structures in Tanzania include the central government, regional governments, and local government authorities. The latter include district, ward, and village councils. 4 Decentralization refers to efforts to strengthen village and municipal governments on both the demand and supply sides. On the demand side, decentralization is expected to strengthen citizens’ participation in local government by, for example, instituting regular elections, improving access to information, and fostering mechanisms for deliberative decision making. On the supply side, decentralization aims at enhancing the ability of local governments to provide services by increasing their financial resources, strengthening the capacity of local officials, and streamlining and rationalizing their administrative functions.

3
bottlenecks to well-being in the community, especially among the poor. At that time, there was already internationally significant experience with social fund–type operations as a means of reducing poverty and supporting decentralization, and social action funds were being promoted in Africa by the World Bank and other donors as a means of addressing priority needs of poor communities.5 A number of studies had been able to determine that social funds could be efficient and cost-effective in building infrastructure and targeting investments to poor communities (Baird et al. 2013).
1.7 The first project, TASAF I, approved in 2000, introduced activities that were likely to improve community members’ access to basic services. Activities included construction of socioeconomic infrastructure and public works schemes to smooth household consumption during the lean season. Beneficiary communities participated in the subproject selection and implementation processes. The project also included capacity building for decentralized governance processes. TASAF I was rolled out in 42 districts on the mainland and in Zanzibar.
1.8 TASAF II, approved in 2004, scaled up the program to the national level. It continued financing service infrastructure and public works while mainstreaming TASAF financial and administrative processes into the LGA, supporting the government’s decentralization strategy. It also introduced elements of a productive safety net targeting the poorest in the community, including a voluntary savings and investment function (Community Savings and Investment Promotion [COMSIP]), and a grant to finance income earning opportunities for interested vulnerable individuals and groups.6 These two new features reflect increasing concern that TASAF was not producing desired poverty-reducing results. A major institutional difference between the two TASAFs was the changing role of local government in the subproject investment process. Under TASAF I, TASAF was responsible for the full subproject cycle, training communities, facilitating subproject development, approving subprojects, supervising implementation, and disbursing funds. Its activities largely bypassed the LGAs. Under TASAF II, these tasked were mainstreamed into the LGA planning process, decentralizing the project cycle. Investment plans became matters for local government and the citizenry rather than TASAF. Although the program still maintained the concept of a positive list of projects that accorded with national priorities, it now also recognized local-level planning. Applications from communities were to fit into district and ward-level development plans and, ultimately, national planning. The approach was similar to that applied by the government in other local development programs and projects, as described in box 1.1.
Box 1.1. Decentralization in Tanzania
Although Tanzania has a long history of sporadic efforts at decentralization and local governance, an LGRP, introduced in 1998 and renewed a decade later, forms the basis for the
5 The World Bank’s Strategic Framework for Assistance to Africa had identified CDD as a cornerstone in efforts to more effectively reach the poor and vulnerable and improve governance and accountability in the use of donor and local funds. 6 Vulnerable groups included orphans, widows and widowers, people affected and infected by HIV/AIDS, unemployed youth, and the elderly.

4
current drive toward fiscal decentralization and local planning, including a heightened role for village- and community-level participation in shaping local-level development.
At the local level, government uses both top-down and bottom-up approaches to planning. In the conventional top-down planning approach, the district planning officer compiles an annual district plan based on development priorities identified by the various heads of departments of the local authority. In contrast, the participatory bottom-up planning approach encourages the identification, prioritization, and implementation of development activities by local communities, facilitated by district and other government staff.
In practice, the Independent Evaluation Group (IEG) mission observed that development activities implemented at the district and village levels are strongly influenced by national sector policies and programs and by the presence of governmental and nongovernment organizations’ development projects in their area. Although using this mixed approach can result in competing demands for resources, in reality this does take into account factors outside of the local government’s area of control, such as government policy and resource constraints.
Sources: World Bank 2006a; World Bank 2016.
1.9 TASAF II was launched at the same time as the World Bank’s Local Government Support Project (LGSP; P070736), which was the first World Bank operation that directly supported the LGRP. The LGSP focused on the fiscal decentralization aspects of the program, essentially on putting in place a federal-fiscal transfer system. The two projects complemented each other. While TASAF II focused on strengthening communities’ role in the local development process, the LGSP aimed at improving local governance by building up capacity for transparent and participatory planning and budgeting processes and other indexes of good governance and sound management. When LGAs had good governance systems as defined by LGSP criteria, TASAF was to channel resources through the LGA system. Whenever this was not the case, TASAF was to provide the supplementary technical resources to ensure transparency and accountability so that resources could be channeled through LGAs (box 1.2).

5
Box 1.2. Minimum Standards for Good Governance
To access grants (from TASAF or other sources), LGAs are required to meet a set of minimum conditions to provide sufficient safeguards for the use of funds and ensure that LGAs comply with the government’s statutory and administrative requirements. The minimum conditions cover six functional areas with indicators associated with each: (i) financial management (indicators include timely submission of final accounts, functional internal audit arrangements, and no adverse audit report or confirmed financial management priorities); (ii) fiscal capacity/ cofunding obligations met; (iii) planning and budgeting (including timely approval of development plans and budgets); (iv) procurement (including functional tender board); (v) council’s functional processes, including regular council meetings; and (vi) project implementation, monitoring, and evaluation capacity (annual and quarterly work plans, progress reports). In addition to the minimum conditions, a set of performance indicators are added to provide incentives for performance improvement by adjusting the yearly size of the grant as a reward for good performance and sanction for poor performance. The performance indicators are qualitative and sought to evaluate performance in key functional areas and compliance with statutory and administrative requirements.
In LGAs with well-functioning local governance systems as defined by the LGSP minimum conditions, TASAF was to channel resources through the LGA systems. In those LGAs which did not qualify, TASAF was to provide implementation capacity as needed. For an LGA to access TASAF resources, the district was to have appointed a village fund coordinator and a village fund justification assistant to manage financial flows at the LGA level, in addition to meeting the minimum conditions. Although TASAF was not about building the LGA systems and capacities, it was part of the local governance-strengthening process because it made the LGAs more accountable and responsive to the demands of communities.
Sources: World Bank 2004a; IEG 2016.
1.10 With TASAF III, approved in 2012 and currently under way, the emphasis shifted fully to productive safety nets. Poverty was still high, with 34 percent of the population living beneath the basic needs poverty line in 2007, and 17 percent below the food poverty line. In particular, the poorest 10 percent of the population was worse off than they had been at the beginning of the decade, in part due to the aftereffects of the international food crisis and the global economic crisis, but also, it appears, from programs, including TASAF, failing to reach the extremely poor. Their situation was characterized by food insecurity; malnutrition remained stubbornly high, and though uptake of primary education had improved significantly and net enrollment rates now stood at 95 percent aided by the introduction of free primary schooling, completion rates and pass-through into secondary education remained stubbornly low. To maximize the impact of targeted programs on poor and food-insecure groups, a new poverty strategy placed increased focus on social protection mechanisms that would provide a safety net for the most vulnerable, address systemic risks, and continue to help create opportunities for the economically active poor populations. This led to the change in emphasis for TASAF that is reflected in the ongoing TASAF III project. Although decentralization and local capacity building for stronger bottom-up decision making remain prominent government strategies, TASAF II had helped introduce institutions that were likely to make service delivery at local and community levels more efficient (the subproject cycle). Increased attention was now also being paid to providing support to the poor and food insecure in a more immediate way. Cash transfers were already introduced under TASAF I (public works) and TASAF II (a pilot conditional education and health-related

6
cash transfer scheme in addition to the voluntary investment and income-generating schemes), but now there is an emphasis on introducing cash transfers on a broader scale than was previously envisaged, including both unconditional and CCTs. TASAF III is the first in a planned series of Adaptable Program Loans (APLs) to build a productive safety net, drawing on the example of other similar ventures, notably in Africa. Still, the formal institutions for continued community participation in local development decisions remain in place, as do capacity-building mechanisms; governance arrangements are in the process of being further strengthened, and community engagement in local planning remains a feature of the country’s development strategy, together with the new emphasis on productive safety nets.
1.11 Table 1.1 provides a comparison of the three TASAF projects.
Table 1.1. TASAF I–III. Main Features
Project Objective Components
TASAF I 2000–2005
Increase and enhance the capacities of communities and other stakeholders to prioritize, implement, and manage sustainable development initiatives and in the process improve socioeconomic services and opportunities
1. Community-development initiatives (building and equipping socioeconomic infrastructure) 2. Labor-intensive public works 3. Institutional development:
a. Capacity building to sensitize and train stakeholders about the project b. Developing and implementing an monitoring and evaluation (M&E) system c. Strengthening national capacity to monitor poverty-alleviation policies
TASAF II 2004–2010
Original: Empower communities to access opportunities so that they can request, implement, and monitor the delivery of services through subprojects that contribute to improved livelihoods and are linked to the attainment of the associated MDG indicators specified in the Tanzania National Strategy for Growth and Poverty Reduction Revised: Improve access of beneficiary households to enhanced socioeconomic services and income-generating opportunities
1. NVF to finance the following: a. Subprojects for basic services and infrastructure b. (i) Labor-intensive public works
(ii) Community savings and investment program
c. Income-generating activities for vulnerable groups
2. Capacity enhancement for local authorities; communities to implement component 1 3. Pilot conditional cash transfer (CCT) for education, health, and nutrition
TASAF III (Productive Social Safety Net Project [APL 1]) 2012–2017
Overall APL series: Increase income and consumption and improve the ability to cope with shocks among targeted vulnerable population groups, while enhancing and protecting the human capital of their children APL 1: Create a comprehensive, efficient, well-targeted productive social safety net system for the poor and vulnerable section of the Tanzanian population
1. Consolidation of safety net interventions for extremely poor and food-insecure households:
a. CCT for education, health, nutrition b. (i) Labor-intensive public works
(ii) Community savings and investment program
2. Institutional strengthening: a. Strengthening TASAF for implementation of TASAF III b. Development of safety net systems (registry, management information system, and so on) c. Development and implementation of the project M&E function
Sources: IEG.

7
2. Objectives and Design and Their Relevance
Project Development Objectives
2.1 According to the Development Financing Agreement (DFA), the PDO was “to empower communities to access opportunities so that they can request, implement, and monitor the delivery of services through subprojects that contribute to improved livelihoods and the attainment of the associated Millennium Development Goals (MDGs) indicators specified in the Borrower’s Poverty Reduction Strategy” (DFA, p. 22).
2.2 The project appraisal document (PAD) had a similar PDO, substantively the same as the one in the DFA. The original PDO was formally revised in July 2009, with the introduction of a first additional financing (see para. 2.9 on additional financings). According to the DFA (p. 5) for the first additional financing, the revised PDO was “to improve access of beneficiary households to enhanced socioeconomic services and income generation.”
2.3 According to the Implementation Completion and Results Report (ICR), the reformulation was agreed on between the government and the World Bank during project midterm review in 2008. This was done to better align the PDO with specific outcomes of project components. At the same time, key performance indicators also were realigned to better measure outcomes.
2.4 The two objectives are different. The original PDO included three objectives: community empowerment7, access to improved socioeconomic services, and improved livelihoods. However, the MDGs cannot be adopted as a goal for the project: they provide an overarching objective, and attribution is difficult to assess. The revised PDO includes two of the three objectives in the original PDO: access to improved socioeconomic services and improved livelihoods. Empowerment is no longer an objective.
2.5 The PPAR assesses the achievement of project outcomes against the following three objectives:
Empowerment of local communities to request, implement, and monitor subprojects
Improved access of beneficiary households to enhanced socioeconomic services Improved access of beneficiary households to improved livelihoods
2.6 The assessment will apply a split rating, with the original PDO being assessed against all three objectives and the revised PDO against the latter two objectives.
7 Empowerment is not defined in the project documentation (PAD, ICR). The World Bank’s Empowerment and Poverty Reduction Sourcebook (p. 11) defines empowerment as the expansion of assets and capabilities of poor people to participate in, negotiate with, influence, control, and hold accountable institutions that affect their lives.

8
Relevance of Objectives
Relevance of the original and revised PDO are rated substantial.
2.7 Both the original and the revised objective were relevant to country circumstances, government policy, and the World Bank’s country assistance strategy (CAS) for Tanzania at the time of appraisal, and they continue to be so today.
2.8 With regard to the country situation, poverty levels were high at project appraisal, and they remain so. The focus of the original and revised PDO was on increasing the well-being and livelihoods of the project’s beneficiaries through seeking better access to services and income earning opportunities. The original PDO specified the role of empowerment in achieving the objectives. The focus of both projects also coincided with the main directions in public policy set out in the government’s National Strategy for Growth and Reduction of Poverty, introduced in 2000 and renewed in 2010 and in The Tanzania Development Vision: 2025 (Government of Tanzania 1999). Specifically, the PDOs supported three central themes in the strategy: decentralization to better align the growth process with local development needs, community development to empower communities to engage in and benefit from the local development process, and securing livelihoods through income-generating opportunities.
2.9 The objectives are substantially relevant to the World Bank’s CAS as it has evolved over the TASAF period, although the related (intermediate) objectives of community mobilization and decentralization are no longer raised in the FY2012–2015 CAS. This is likely to reflect the increased emphasis placed on safety nets with a particular concern for the poorest of the poor, who were least likely to be able to take advantage of “springboard”-type opportunities to alleviate or rise out of poverty. Still, the overarching objective of TASAF remains poverty alleviation, and the TASAF program—both the two previous projects and the ongoing one—addresses challenges that relate to all four main objectives in the CAS: it promotes inclusive growth, builds infrastructure and delivers services, strengthens human capital and social safety nets, and promotes accountability and governance at central and local levels. In particular, the CAS supports operations that target poor and vulnerable households and communities and have immediate impact on their livelihoods, for example, through safety nets and/or other operations that address their income and asset vulnerabilities.
Project Design
2.10 The project had two components summarized here on the basis of the description in the PAD.
COMPONENT 1: THE NATIONAL VILLAGE FUND (NVF)
2.11 The estimated cost at appraisal was US$144 million; the actual cost was US$207.80 million, which came from a combination of funds from the International Development Association (IDA), the government, and communities. Financing: The original financing from the IDA was US$120 million. The first additional financing was US$25.5 million; the second additional financing was US$31 million. The government estimated and actual was US$12 million, and communities’ estimated and actual was US$12 million. The total of these contributions was US$200.50 million. However, the

9
actual IDA financing US$183.80 million, bringing the actual cost to US$207.80. The NVF was to finance subprojects to improve community access to basic services and enable poor households to increase their incomes. There were three types of beneficiary categories:
a) The service poor. NVF resources were to finance subprojects suitable for implementation by communities that lacked access to basic socioeconomic services such as health, education, water and sanitation, roads, and markets. Subprojects were to be cofinanced by beneficiary communities at a level of 20 percent of the subproject cost.8
b) The food insecure. NVF resources were to finance labor-intensive subprojects (public works) for communities selected by LGAs based on seasonal food insecurity and lack of service access. Maintenance of completed subprojects was to be financed by LGAs, with TASAF contributing on a sliding scale.
c) The vulnerable. NVF resources were to finance income-generating activities (subprojects) for vulnerable groups: orphans, widows and widowers, people affected by human immunodeficiency virus / acquired immune deficiency syndrome, unemployed youth, and the elderly. Participants would be supported by LGAs and community-based groups to implement a subproject. A community contribution of at least 5 percent was required for each subproject.
2.12 The vulnerable component also supported a pilot community-based conditional cash transfer program (CB-CCT), which was introduced in 2006 and financed under a US$1.97 million Japan Social Development Fund grant as a potential component of a subsequent national safety net. The CB-CCT was conditioned on co-responsibilities in education, health, and nutrition.
2.13 The NVF covered all districts on the mainland and in Zanzibar. Resources were allocated to districts on a formula basis, taking into account population, poverty level, and geography. Implementation was the responsibility of LGAs, with elected village-level community management committees (CMCs) managing implementation in the community.
COMPONENT 2: CAPACITY ENHANCEMENT
2.14 The estimated cost at appraisal was US$34.50 million; the actual cost was US$54 million, which came from a combination of funds from the IDA, the government, and communities. Financing: The original financing from IDA was US$30 million. The first additional financing was US$4.50 million; the second additional financing was US$4 million. The government estimated and actual was US$3 million, and communities’ estimated and actual was US$1.5 million. The total of these contributions was US$38.50 million. However, the actual IDA financing was US$49.50 million, bringing the actual cost to US$54 million.
2.15 This component was to provide resources for capacity enhancement of communities, district and national level stakeholders in the implementation of NVF activities. Activities included community mobilization, capacity building of LGAs and
8 Initially, this was in cash, but when communities started having difficulties in meeting the cash requirement, in-kind contributions were also accepted.
10
communities in participatory planning and subproject implementation, support for savings-investment groups, training to vulnerable individuals for the implementation of income-generating activities, and financing of the TASAF management unit.
Significant Changes
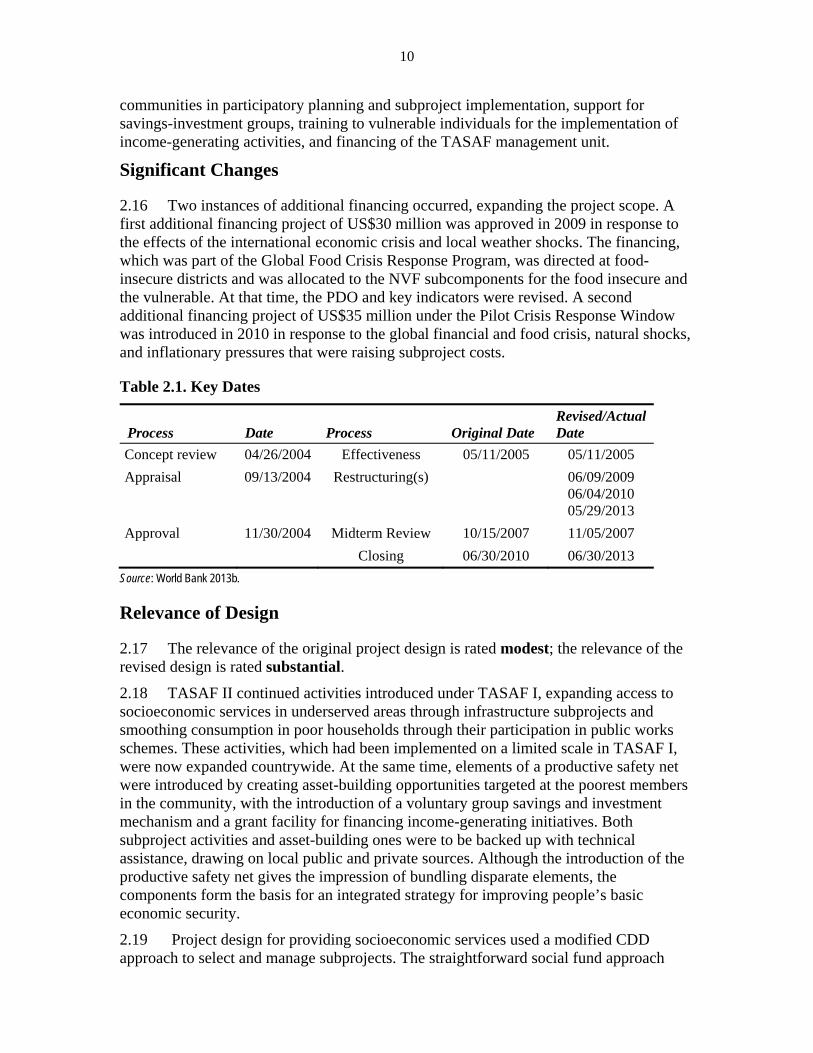
2.16 Two instances of additional financing occurred, expanding the project scope. A first additional financing project of US$30 million was approved in 2009 in response to the effects of the international economic crisis and local weather shocks. The financing, which was part of the Global Food Crisis Response Program, was directed at food-insecure districts and was allocated to the NVF subcomponents for the food insecure and the vulnerable. At that time, the PDO and key indicators were revised. A second additional financing project of US$35 million under the Pilot Crisis Response Window was introduced in 2010 in response to the global financial and food crisis, natural shocks, and inflationary pressures that were raising subproject costs.
Table 2.1. Key Dates
Process Date Process Original Date Revised/Actual Date
Concept review 04/26/2004 Effectiveness 05/11/2005 05/11/2005
Appraisal 09/13/2004 Restructuring(s) 06/09/2009 06/04/2010 05/29/2013
Approval 11/30/2004 Midterm Review 10/15/2007 11/05/2007
Closing 06/30/2010 06/30/2013
Source: World Bank 2013b.
Relevance of Design
2.17 The relevance of the original project design is rated modest; the relevance of the revised design is rated substantial.
2.18 TASAF II continued activities introduced under TASAF I, expanding access to socioeconomic services in underserved areas through infrastructure subprojects and smoothing consumption in poor households through their participation in public works schemes. These activities, which had been implemented on a limited scale in TASAF I, were now expanded countrywide. At the same time, elements of a productive safety net were introduced by creating asset-building opportunities targeted at the poorest members in the community, with the introduction of a voluntary group savings and investment mechanism and a grant facility for financing income-generating initiatives. Both subproject activities and asset-building ones were to be backed up with technical assistance, drawing on local public and private sources. Although the introduction of the productive safety net gives the impression of bundling disparate elements, the components form the basis for an integrated strategy for improving people’s basic economic security.
2.19 Project design for providing socioeconomic services used a modified CDD approach to select and manage subprojects. The straightforward social fund approach
11
introduced under TASAF I, in which direct financing of community-implemented subprojects largely bypassed local authorities and risked creating a parallel structure that competed with local governments, was replaced. TASAF II integrated LGAs into the subproject cycle, institutionalizing community participation into local development in a system that emphasized interaction between LGAs and communities in the district planning process. A capacity enhancement component was designed to provide necessary support in order to make interactions between LGAs and communities work (box 1.2). This modified design removed the concern over parallel structures, and it supported the government’s ongoing decentralization strategy, creating more balance between community preferences and district and central government choices. In practice, it seems primarily to have strengthened strategic top-down decision making in the investment process (see also the Implementation Experience section).
2.20 To further promote better subproject outcomes, project design included mechanisms to ensure that subprojects would be affordable and suited to community management and maintenance and to ensure that national construction standards were maintained in the implementation of service delivery and public works subprojects. Experience under TASAF I indicated that, although sector norms and standards exist, they tend to be poorly enforced. To address this issue, sectoral standards were introduced into facility design, and lax enforcement was addressed with a sector expert team, composed of representatives from sectoral ministries to review and authorize all subprojects for conformity with sector norms and standards and ensure any necessary staffing positions or additional equipment were integrated into sector planning.
2.21 On other points, the design would prove less successful. Targeting would be an issue throughout the project: although targeting of districts was mildly progressive, this would no longer be the case at district levels, for which poorer areas were more likely to experience weaknesses in capacity building at the community level and deficiencies in TASAF’s communications arrangements, although they were geared toward poor communities and households. Likewise, the ceiling for subprojects, at US$30,000, would in some instances turn out to be too low for the kinds of priority projects that communities sometimes identified and consequently had to be adjusted upward.
2.22 The results framework for the original PDO could have been clearer. The objective statement included a mix of elements, some of them interrelated: empowerment, basic service provision, livelihoods, and MDGs. Although the project components were consistent with the objectives, the causal chain between funding and outcomes, especially with regard to empowerment and MDGs, was incomplete. A precise definition of empowerment was absent.
2.23 Although the results framework for the revised PDO was clear, it removed the empowerment objective, placing the emphasis of design on measures to strengthen asset building and income generation. Early on during implementation, TASAF and World Bank staff had recognized the awkward formulation of the original PDO. The results framework was belatedly revised, and the revised design was more to the point: it was clearly articulated and straightforward and had a measurable PDO that explicitly linked outputs to outcomes that underpinned the PDO. This facilitated effective monitoring, allowing ready measurement of progress against objectives.

12
3. Implementation
Implementation Arrangements
3.1 Implementation arrangements were influenced by the reforms for increased decentralization that were being pursued under the government’s LGRP. These reforms included a mainstreaming of TASAF support with local government structures, in contrast to the situation that had prevailed under TASAF I, in which TASAF operated as a parallel entity to regular government processes.
3.2 At the local level, LGA (district and ward level) extension staff were to conduct general sensitization about TASAF and requirements for drawing on the NVF resources for subproject financing. The vetting and approval of subprojects was the responsibility of LGAs. For them to be able to fulfill this function, LGAs had to have the necessary staff skills to do so and to mobilize, train, and support communities throughout the subproject cycle, possibly also drawing on nongovernment organizations (NGOs). Where LGAs were missing such skills, they could be built up by drawing on the capacity enhancement component. At the village level, priority subprojects were selected through village assemblies;9 village councils then delegated the management of the subproject development and implementation process to CMCs, with members appointed by the village assembly.
3.3 Drawing on lessons from TASAF I, the TASAF management unit included a sector expert team to ensure that community subprojects conformed to national sector norms. Likewise, the introduction of the village council into the subproject process drew on the experience under TASAF I—as a means of avoiding potential conflicts between the council and the CMC, and as a means of facilitating the mainstreaming of TASAF support into government structures.
3.4 At the national level, the project remained under the President’s Office, with oversight vested in a National Steering Committee (NSC) whose members were drawn from the public and private sectors. The NSC was supported by the TASAF management unit, exercising oversight of day-to-day operations to ensure that the Operating Manual for the project was being applied (TASAF 2007a). TASAF also provided fiduciary oversight and monitored project progress. The government provided financial resources (grants) to districts through the formula-based allocation mechanism described in the Targeting section, with further allocation to village-level funds through the NVF, again using the allocation formula, but now applied intradistrict. Actual use of funds was conditioned on subproject proposals being generated by communities through a participatory process involving LGAs and communities. Subprojects had to be affordable and suited to community-level management and maintenance and had to reflect sector norms and standards. Their financing plan had to include a community contribution. Depending on the size of subprojects, they were approved either at the ward or district
9 Village assemblies consisted of villagers called together to agree on decisions that affect the village, for instance, the appointment of project management committees.

13
level and then certified at district or central level, after which funds were available for disbursement.
3.5 Targeting. Because TASAF is supposed to improve living conditions of the poor, the project uses a targeting framework that consists of a centrally determined geographic component and a district level, demand-driven one. The government applies a similar approach for calibrating fiscal transfers under its local government reform. Resources are allocated to districts based on population, geographic size, and poverty indicators related to access and availability of health, education, and water and sanitation services, and vulnerability and food insecurity. The districts then allocate resources to needier or more service-poor areas within their jurisdictions. For income-generating initiatives, eligibility criteria that favor poor households are defined by the central government, whereas participation in public works schemes is determined on the basis of poverty status as assessed by village councils and is also influenced by self-selection.10 At that level, the process is designed to be demand driven, as community or household participation is largely voluntary within the guidelines and eligibility criteria set by TASAF.
3.6 Because community or household participation is largely voluntary, the information and communication strategy that is part of the TASAF is crucial to stimulate demand. It is aimed at raising awareness as widely as possible about the opportunities offered by the project, especially in outlying areas of a district, where the poorest community members are likely to be found.
3.7 Gender. Project design explicitly included women in the community-development process. Women’s participation was mandated in the CMCs that are largely responsible for implementing subprojects for basic services (but not public works schemes). Initially, women’s membership was set at 40 percent of the CMC membership in TASAF I and was then raised to 50 percent in TASAF II.
3.8 The implementation process is summarized in table 3.1.
Table 3.1. Tasks in Project Implementation
Level Tasks
National Defines decentralization strategy and local responsibilities Produces policies, norms and guidelines Allocates resources to districts based on predetermined criteria Confirms all subprojects Receives feedback and monitoring reports from districts
Regional Consultative committee advises on progress on accountability at LGA level Supports LGAs to implement the NVF
LGA District Has structures at district, ward, and village level Undertakes priority setting in allocating resources Prepares and approves district plans Receives requests for services from CMCs through the village council
10 The process of identifying marginal individuals and households for income generation (and to some extent for public works) drew on records maintained by village councils and elders: “We know exactly who the poor are in our community. We keep records of people like widows, landless . . . disabled, orphans.” (Village Council Chairman for Majengo Street in Shindanga municipality).

14
Level Tasks
Carries out desk and field appraisals Channels resources to village councils and CMCs Provides technical support
Ward Supports village-level facilitation Provides technical appraisal with recommendations to district Ensures technical oversight
Village Works through elected CMCs Works through NGOs to provide support to vulnerable groups Identifies needy households and communities
Sources: IEG based on ICR and PAD of TASAF I, II and III.
Implementation Experience
SUBPROJECT SELECTION
3.9 The TASAF process was to result in subprojects being implemented that were of priority to the community. In practice, discussions with district authorities including community facilitators and village leaders during IEG field visits indicated that first priorities were not always put forward or approved for implementation. With a positive list of acceptable project types and with predefined service packages (size, standards, and so on) options were already limited. Subproject cost ceilings provided an additional limiting factor, as did affordability of counterpart financing requirements. During discussions at the village level, it appeared that subproject selection is also influenced by the amount villagers are required to contribute to individual subprojects—the lower the contribution, the more likely it is that the project will be prioritized.11 Ward and district-level development plans, as well as national guidelines, also placed implicit and explicit limitations when it came to selecting, approving, and certifying subprojects. Analysis by REPOA (2010) points to the tendency of communities to produce priorities that coincided with central government priorities. The analysis cites a TASAF coordinator: “Education has been the main priority because villagers have been pressured by the government to build more classrooms, and thus villagers feel that they can unload the burden of their required contributions onto TASAF.” Village councils and district community facilitators could (and anecdotally did) influence priority setting, as could national and local politicians. Field studies by REPOA (2010) also point to a tenuous link between submitted community priorities and implemented subprojects: once a proposal is submitted, the participatory process ends and “the real budgeting and planning [starts].” According to council planning officers, “the national government knows best what the communities need.”
11 During discussions, it was sometimes difficult to distinguish whether such factors related to the participatory process in general, or specifically to the TASAF program. The government, as well as donors, channel some of their sub-national investments through the NVF. Although this is one of the intentions of the NVF structure, it does appear to create some confusion in the minds of beneficiaries, who don’t necessarily see (or even need to see) the distinction.

15
3.10 That said, beneficiary assessments indicated that citizens were still generally pleased with subprojects, with 87 percent of beneficiaries expressing satisfaction with subprojects in their community.
PROJECT COSTS
3.11 Project cost ceilings, counterpart funding requirements, and cost escalation affected project implementation.
3.12 Service delivery subprojects had a ceiling of US$30,000, which in some instances would turn out to be too low to meet the kinds of priority projects that communities sometimes would identify. This risked resulting in incomplete or redesigned subprojects, split subprojects, or the community choosing another subproject. There is not information available on how frequently such situations arose, or how they actually affected community prioritization. In any case, the ceiling was raised to US$45,000 during midterm review. While this should have had an effect on average subproject size, there is no information available to determine the effect it really had on average subproject size.
3.13 Counterpart contributions in cash for service subprojects sometimes were said to be too high, especially where subprojects were targeted at the poorest communities. This was alleviated by allowing in-kind contributions and by reducing the value of counterpart funding requirements at midterm from 20 percent to 15 percent. Again, the effects of these adjustments are not known. Income-generating projects also faced a counterpart funding issue, but from a different angle: the 5 percent community contribution that was to cover advisory services proved to be too small to cover the logistical costs of such services (higher than anticipated technical support needs, frequency of visits, and difficult access).
3.14 Frequent increases in the cost of construction materials, and in transport, had been an issue under TASAF I and continued to be so under TASAF II. In part, this may have reflected cost escalation arising from a slow subproject approval and certification process, as decision making passed from village to district to central levels, and aggravated by staff constraints at the district level (see the LGA Capacity section). The presence of only one or two bidders competing for contracts may also have contributed to raising costs above initial budget estimates.
PROJECT DESIGN
3.15 The inappropriate formulation of the original PDO for monitoring project progress had been realized by TASAF and World Bank staff early on during implementation and was subsequently reformulated. Likewise, some of the original key performance indicators were inappropriate as a means of ascertaining project progress, especially those referring to the MDGs. These were development outcome indicators that (i) could only be meaningfully collected in nationally representative surveys and that (ii) could not be linked to project activities and ascertain attribution.
3.16 Empowerment, for example, as the process of community participation in setting investment priorities and households and individuals seeking income generating and asset-building opportunities, was a central feature of project design. The revision of the
16
PDO removed it as an explicit project feature, placing more emphasis on opportunities for asset building and income generation.
LGA CAPACITY
3.17 Due to budget and human resource constraints, LGAs claimed that they were unable to spend sufficient time in communities to provide CMCs with the necessary training and guidance to keep the subproject process on track. A REPOA study (World Bank 2006a) noted that “LGAs are understaffed, many staff are unqualified and lacking incentives, many work part-time . . . Transport generally used by very senior officials . . . lack of data, and existing data often unreliable.” The study points to the weak resource base at the district level as a key factor limiting the capacity of LGAs to set and finance priority investments.
3.18 Although TASAF appears to have been less affected by the constraints on LGAs, the beneficiary assessment does flag similar concerns. Key subproject inputs were contributions from the LGA sector experts and from NVF coordinators at the village level. Under TASAF I, the coordinators had been LGA staff dedicated to TASAF activities, but under TASAF II, this was no longer the case because they were now also providing support to other local and donor-financed programs and projects. Echoing the REPOA study, the beneficiary assessment notes that nearly all coordinators felt that they were overloaded with work but had no motivational rewards. The situation was further aggravated by a relatively high turnover rate of such staff because other programs offered more attractive job opportunities and by the time it took to bring new staff up to speed. Consequently, LGAs had fewer resources to devote to training CMCs—a few hours rather than the initially envisaged few days. While CMC members considered that any training they received was useful, they considered this level insufficient. In other instances, to address staff shortages, some stages in the process, such as desk appraisals or participatory field appraisals, were either combined or skipped altogether. This also contributed to delays in upstream reporting, subproject certification, and release of funds, all in turn affecting the costs and rhythm of subproject implementation.
3.19 Such delays are reflected in the difference between completed subprojects and subprojects certified after approval. The impact assessment notes that this has resulted in a significant number of subprojects being incomplete, limiting community access to basic social services: teachers’ houses, school dormitories, school laboratories, roads and bridges, dispensaries without staff quarters or schools without latrines, or boreholes without distribution networks. Some 37 percent of completed basic service subprojects and 32 percent of public works subprojects were uncertified at the completion of the project.
INNOVATIVE INITIATIVES
3.20 During implementation, two new initiatives were introduced:
A CB-CCT was initiated on a pilot basis in 2008 in three districts covering 80 villages. It provided transfers to 2,500 households, increasing to 11,600 by project
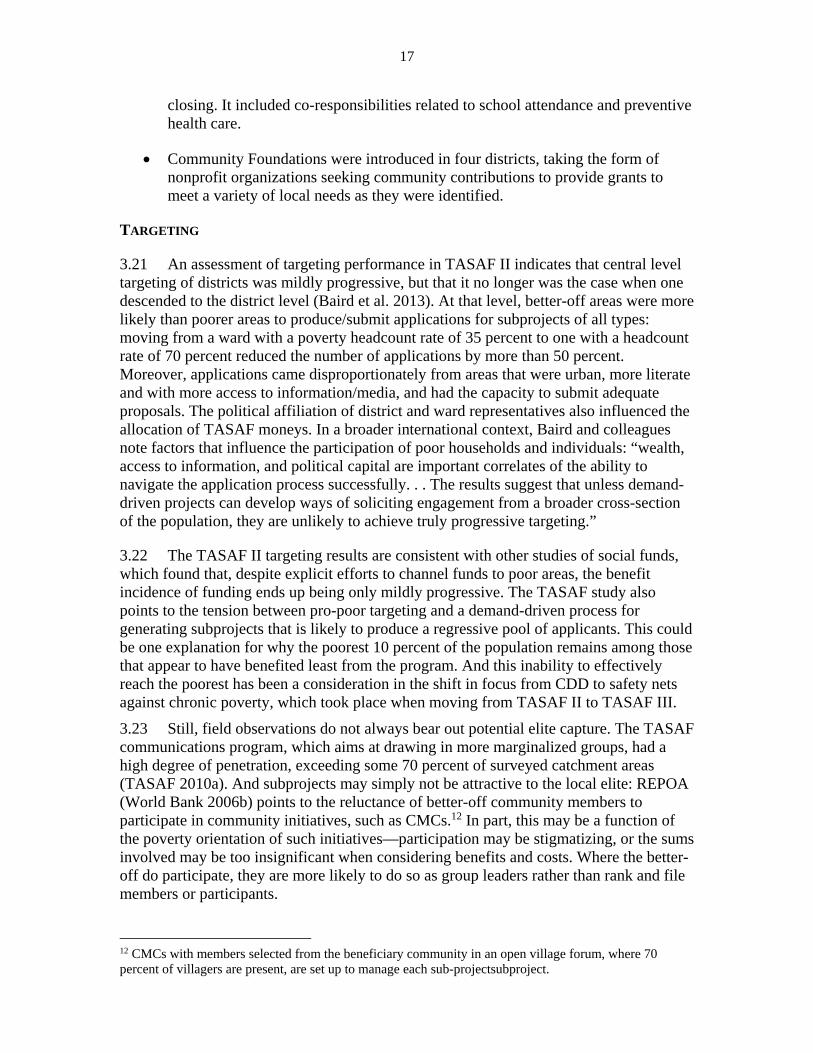
17
closing. It included co-responsibilities related to school attendance and preventive health care.
Community Foundations were introduced in four districts, taking the form of nonprofit organizations seeking community contributions to provide grants to meet a variety of local needs as they were identified.
TARGETING
3.21 An assessment of targeting performance in TASAF II indicates that central level targeting of districts was mildly progressive, but that it no longer was the case when one descended to the district level (Baird et al. 2013). At that level, better-off areas were more likely than poorer areas to produce/submit applications for subprojects of all types: moving from a ward with a poverty headcount rate of 35 percent to one with a headcount rate of 70 percent reduced the number of applications by more than 50 percent. Moreover, applications came disproportionately from areas that were urban, more literate and with more access to information/media, and had the capacity to submit adequate proposals. The political affiliation of district and ward representatives also influenced the allocation of TASAF moneys. In a broader international context, Baird and colleagues note factors that influence the participation of poor households and individuals: “wealth, access to information, and political capital are important correlates of the ability to navigate the application process successfully. . . The results suggest that unless demand-driven projects can develop ways of soliciting engagement from a broader cross-section of the population, they are unlikely to achieve truly progressive targeting.”
3.22 The TASAF II targeting results are consistent with other studies of social funds, which found that, despite explicit efforts to channel funds to poor areas, the benefit incidence of funding ends up being only mildly progressive. The TASAF study also points to the tension between pro-poor targeting and a demand-driven process for generating subprojects that is likely to produce a regressive pool of applicants. This could be one explanation for why the poorest 10 percent of the population remains among those that appear to have benefited least from the program. And this inability to effectively reach the poorest has been a consideration in the shift in focus from CDD to safety nets against chronic poverty, which took place when moving from TASAF II to TASAF III.
3.23 Still, field observations do not always bear out potential elite capture. The TASAF communications program, which aims at drawing in more marginalized groups, had a high degree of penetration, exceeding some 70 percent of surveyed catchment areas (TASAF 2010a). And subprojects may simply not be attractive to the local elite: REPOA (World Bank 2006b) points to the reluctance of better-off community members to participate in community initiatives, such as CMCs.12 In part, this may be a function of the poverty orientation of such initiatives—participation may be stigmatizing, or the sums involved may be too insignificant when considering benefits and costs. Where the better-off do participate, they are more likely to do so as group leaders rather than rank and file members or participants.
12 CMCs with members selected from the beneficiary community in an open village forum, where 70 percent of villagers are present, are set up to manage each sub-projectsubproject.

18
3.24 One area in which TASAF appears strongly pro-poor is in the support to vulnerable households. Vulnerable households as defined by TASAF13 are on average poorer than nonvulnerable households—some 51 percent of vulnerable households are poor, compared with 41 percent among nonvulnerable households. However, as with other categorical definitions of poverty, the targeting mechanism for vulnerability also includes many errors of inclusion and exclusion: on average, vulnerable beneficiaries (vulnerable individuals needing assistance, for example, program beneficiaries) were found not to be poorer than the pool of vulnerable individuals as a whole. The poverty headcount ratio among program beneficiaries is 3 percentage points higher than for eligible nonbeneficiaries.
GENDER
3.25 TASAF sought actively to include women in community decision making, notably through their participation in CMCs. In field interviews with stakeholders, it was pointed out that women often were appointed to positions of responsibility in the CMC—secretary or treasurer (“women have greater discipline than men”). In interviews with eight CMCs, the team was able to observe that women not only “attended” meetings, but also were quite active in offering their views. In fact, women were perceived as effective leaders, and it was pointed out that their increased participation in community affairs through the subproject process often served them as a springboard into political life at the district and national level. The same observation was made in the project’s beneficiary assessment. There is, however, no quantitative data to substantiate this or for comparing the effectiveness of male- versus female-headed community-development committees.
3.26 Beyond women’s participation in the CMCs, the operation included public works schemes to which both men and women had access, and an estimated 47 percent of participants were women. Likewise, the voluntary COMSIP that was loosely linked to the public works was seen as an opportunity for women to generate savings and build wealth; some 58 percent of participants were women. Likewise, the targeted vulnerable groups’ program included widows as an explicitly targeted beneficiary group. A modest pilot CCT included pregnant women as beneficiaries.
4. Achievement of the Objectives
Original Project Development Objective
“To empower communities to access opportunities so that they can request, implement, and monitor the delivery of services through subprojects that contribute to improved livelihoods and to the attainment of the associated Millennium Development Goals indicators specified in the Borrower’s Poverty Reduction Strategy.”
13Vulnerable groups are orphans, widows and widowers, people affected by HIV/AIDS, unemployed youth, elderly.
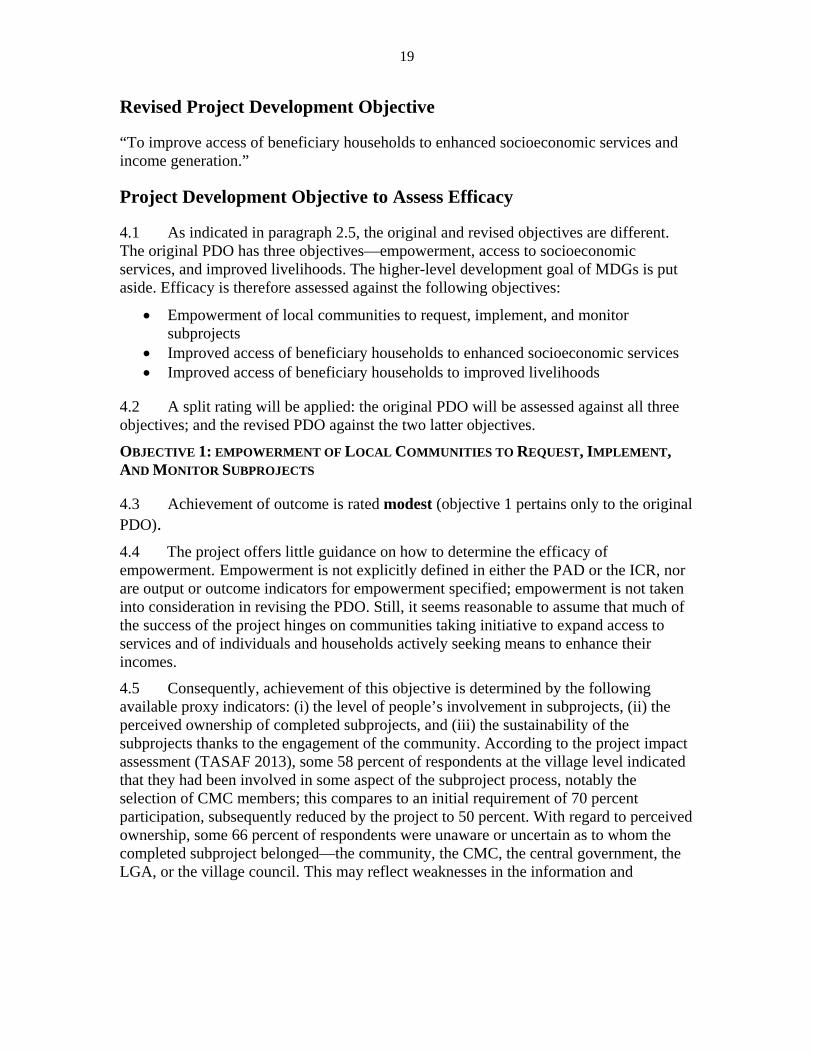
19
Revised Project Development Objective
“To improve access of beneficiary households to enhanced socioeconomic services and income generation.”
Project Development Objective to Assess Efficacy
4.1 As indicated in paragraph 2.5, the original and revised objectives are different. The original PDO has three objectives—empowerment, access to socioeconomic services, and improved livelihoods. The higher-level development goal of MDGs is put aside. Efficacy is therefore assessed against the following objectives:
Empowerment of local communities to request, implement, and monitor subprojects
Improved access of beneficiary households to enhanced socioeconomic services Improved access of beneficiary households to improved livelihoods
4.2 A split rating will be applied: the original PDO will be assessed against all three objectives; and the revised PDO against the two latter objectives.
OBJECTIVE 1: EMPOWERMENT OF LOCAL COMMUNITIES TO REQUEST, IMPLEMENT, AND MONITOR SUBPROJECTS
4.3 Achievement of outcome is rated modest (objective 1 pertains only to the original PDO).
4.4 The project offers little guidance on how to determine the efficacy of empowerment. Empowerment is not explicitly defined in either the PAD or the ICR, nor are output or outcome indicators for empowerment specified; empowerment is not taken into consideration in revising the PDO. Still, it seems reasonable to assume that much of the success of the project hinges on communities taking initiative to expand access to services and of individuals and households actively seeking means to enhance their incomes.
4.5 Consequently, achievement of this objective is determined by the following available proxy indicators: (i) the level of people’s involvement in subprojects, (ii) the perceived ownership of completed subprojects, and (iii) the sustainability of the subprojects thanks to the engagement of the community. According to the project impact assessment (TASAF 2013), some 58 percent of respondents at the village level indicated that they had been involved in some aspect of the subproject process, notably the selection of CMC members; this compares to an initial requirement of 70 percent participation, subsequently reduced by the project to 50 percent. With regard to perceived ownership, some 66 percent of respondents were unaware or uncertain as to whom the completed subproject belonged—the community, the CMC, the central government, the LGA, or the village council. This may reflect weaknesses in the information and

20
communications program; and/or lower-than-expected engagement in the subproject cycle through the village assemblies.14
4.6 With regard to sustainability, the impact assessment notes the following: “Project capacity enhancement activities not only resulted in building skills of LGAs, but also of project beneficiaries. This was notably so in enhancing the ability to identify strengths, obstacles and opportunities for community development, and the ability to use available resources within their own environment to address immediate needs and problems. The processes stressed the importance of group and teamwork while building intra-community social capital.” The impact assessment points to the resilience of the project committee arrangements in building management and supervisory capacity that benefit communities and, more broadly, LGAs beyond the immediate tasks of subproject management. They also saw the subproject cycle as a means of strengthening community social capital and creating a sense of “satisfaction and legitimacy” in being part of a broader decision-making process on district development.
OBJECTIVE 2: IMPROVED ACCESS OF BENEFICIARY HOUSEHOLDS TO ENHANCED
SOCIOECONOMIC SERVICES
4.7 Achievement of the original and revised objective are both rated modest.
Outputs15
4.8 Capacity Building
A total of 4,478 LGAs’ technical and ward-level extension staff were trained to address issues of participatory planning, subproject appraisals, approvals, and M&E.
A total of 7,487 CMCs had been set up to monitor implementation at the community level of subprojects targeting Service Poor and Food Insecure beneficiaries (that is, basic infrastructure subprojects and public works schemes). This exceeded the original and revised targets of 6,500 and 6,700 CMCs, respectively. There were 167,515 CMC members trained in bookkeeping, subproject management and procurement, and subproject administration and supervision. At least 50 percent of members in the CMCs were women, often in roles of responsibility as committee secretaries or treasurers.
A total of 88,340 operations and management committee members were trained in subproject operations and maintenance.
14 A quorum for village assemblies was achieved when 70 percent of adult villagers participated; however, anecdotally, this was not always the case, especially when it came to poorer villagers who lived far from the center of the village. 15 Baselines have not been included for outputs that would be based on activities initiated under TASAF I, a pilot project of limited scope.

21
4.9 Subprojects: Infrastructure16
Education. There were 7,779 classroom subprojects built, exceeding the original target of 4,511, but not reaching the revised target of 10,306. Complementary buildings were built (1,250 teacher houses with solar power, 179 student dorms, 626 staff offices, 222 administrative blocks, 166 laboratories, and 12 libraries); in all such cases, original and revised targets were exceeded. Over 90 percent of education subprojects (of 7,779 classrooms and complementary educational facilities financed) were operating at project closure.
Health. There were 1,777 health center subprojects built, renovated, or equipped, surpassing the original and revised targets of 428 and 843, respectively. At project closing, 96 percent were operating.
Roads. There was improvement of 7,382 kilometers of feeder roads, exceeding the original and revised targets of 3,024 kilometers and 5,325 kilometers, respectively, and benefiting 3.6 million individuals.
Economic infrastructure. Building of infrastructure included 90 markets, 248 irrigation systems, 3,029 improved water sources; a total of 5,289 hectares of land were conserved. More than 1 million people benefited from irrigation and market subprojects. In all cases, except for water sources for which no target originally was set, original and revised targets were exceeded.
Outcomes
4.10 The outcomes below are influenced by the following: (i) subproject selection by communities is demand driven and cannot be accurately predicted in advance, (ii) subproject selection depends on available resources for operating and maintaining facilities, and (iii) subproject selection by communities may not always coincide with national or district investment priorities. These factors are likely to determine what subprojects are selected, compared with what community priorities may be. That should be weighed against community situations where even second- or third-best options are likely to have a positive impact on well-being.
4.11 By project completion in 2013, some 9,900 communities had benefited from TASAF subproject grants channeled through the village level funds in a participatory process, exceeding the revised target of 7,400 communities. Some 95 percent of subprojects had a permanent maintenance mechanism in place at the closing of the project. Citizens satisfied with the delivery of basic services had increased from 78 percent at the end of TASAF I in 2005 to 87 percent at the closing of TASAF II in 2013, exceeding the target of 85 percent, which had been set for both the original PDO and the revised one.
4.12 The following outcomes were recorded in terms of improved access to services:
16 While targets are difficult to set when activities are demand driven, the project introduced notional targets based on the experience under TASAF I and the original TASAF II prior to the introduction of Additional Financing 1 and Additional Financing 2.

22
Education. The student/classroom ratio in communities benefiting from TASAF funding decreased from 70/1 in 2005 to 45/1 in 2013, meeting the project target. The project also showed progress on two indicators where monitoring was discontinued in 2009 as not being sufficiently project specific: primary school net enrollment rates; and annual dropout rates of students in primary school.
4.13 The only indicators of improved access to enhanced education services are the increased numbers of classrooms and ancillary facilities and in response to more classrooms, a consequent improvement in student/classroom ratios. Further implications can only be hypothetical. Better facilities and teacher housing may lead to better access to teachers in rural areas, and teacher morale is said to improve (Evans et al. 2014). Still, the IEG was informed in the field that absenteeism among teachers remains high. Beyond better physical learning environment and better access to teachers, there are no clear indicators of improved quality of teaching or of learning outcomes directly related to the project.
Health. Monitoring of health indicators was discontinued in 2009 due to weak project attribution.
4.14 The project made significant investments in building and/or rehabilitating basic health infrastructure, while taking into account staffing and supply constraints. As a result, the vast majority of facilities built under TASAF were operational at project closing (TASAF 2013). Basic health indicators improved over the period, but that cannot be attributed solely to the project.
4.15 Basic health infrastructure rehabilitation was done in a district planning context that took into account potential operational constraints (availability of health providers, medical supply chains, and so on), and did result in 96 percent of facilities being operational (staffed and equipped) at the end of the project. Drawing on limited IEG observations in the field about facility staffing, consultant satisfaction, and catchment areas, building, equipping, and staffing can have an important impact on care, especially when the counterfactual is no services. With improved access, lower transportation costs, and providers housed in the community, more people sought out timely preventive care, emergencies could be better addressed, and messages on healthy behaviors could be more easily provided. Providers anecdotally pointed to considerably reduced morbidity and mortality among pregnant women and children under-five in their catchment areas.
Water and sanitation. Access to water improved for 1.66 million individuals, and access to improved sanitation for 907,224 individuals (exceeding both original and revised targets), resulting in shorter distances to fetch water and reduced expenses.
Economic infrastructure: markets. While 270,000 people had achieved improved access to markets over the period 2005-2013, this fell short of the revised target of 348,182.
4.16 Opening access to markets essentially consisted of constructing storage facilities and market places where none had existed before. While a relatively large number of

23
people potentially benefited, more important, market services enabled communities to sell their produce beyond farm-gate prices, and receive market information such as prices. Still, access to markets was considered a low priority in most communities (TASAF 2013).
OBJECTIVE 3: IMPROVED ACCESS OF BENEFICIARY HOUSEHOLDS TO IMPROVED
LIVELIHOODS
Achievement of the original and revised objective are both rated substantial
Outputs
Public works schemes. There were 1,577 public works subprojects implemented by 2013, reaching 265,872 beneficiaries, among them 47 percent females. The number of person-days in public works programs reached 21.34 million in 2013, surpassing the original target of 14.3 million and the revised target of 17.83 million.
COMSIP. Training in COMSIP was provided to 1,778 savings groups created under the project, with 22,712 members. The number for participants exceeded original and revised targets for membership. Participants are active borrowers—some 80 percent of savings amounts are borrowed by members, and the same levels are repaid. Borrowings are spent on basic household needs and on income-generating activities. (TASAF 2013). However, there is no information on asset building by members
Vulnerable individuals. Support was provided for 313,331 vulnerable individuals for income-generating activities over the project period, compared with a target of 484,000.
4.17 CCTs
The number of households who received CCTs at the start of the program in 2008, covering 40 villages (in three districts with higher poverty rates), which initially included 2,500 households, was expanded to 11,576 households (28,480 beneficiaries) in 2013. An original target of 8,920 households had been set at the start of the program, but had been revised to 22,580 during PDO revision. Both of these targets were exceeded.
Outcomes
Savings-investment schemes. By 2013, 22,712 individuals forming some 630 savings-investment groups were participating in community saving schemes, surpassing the original target of 20,000 participants but not meeting the revised target of 33,600.
Women dominated participation in savings-investment schemes, forming about 70 percent of the membership. Most were married, with little control over household resources, and forming groups of this kind was said to be a way to
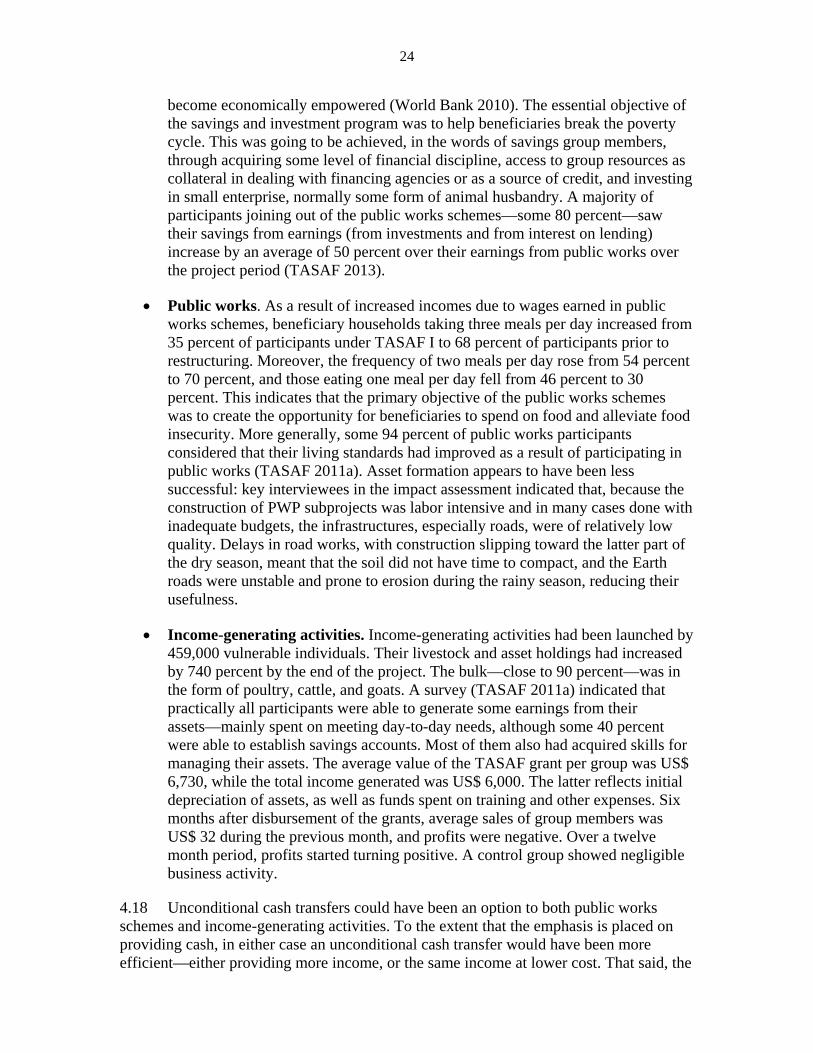
24
become economically empowered (World Bank 2010). The essential objective of the savings and investment program was to help beneficiaries break the poverty cycle. This was going to be achieved, in the words of savings group members, through acquiring some level of financial discipline, access to group resources as collateral in dealing with financing agencies or as a source of credit, and investing in small enterprise, normally some form of animal husbandry. A majority of participants joining out of the public works schemes—some 80 percent—saw their savings from earnings (from investments and from interest on lending) increase by an average of 50 percent over their earnings from public works over the project period (TASAF 2013).
Public works. As a result of increased incomes due to wages earned in public works schemes, beneficiary households taking three meals per day increased from 35 percent of participants under TASAF I to 68 percent of participants prior to restructuring. Moreover, the frequency of two meals per day rose from 54 percent to 70 percent, and those eating one meal per day fell from 46 percent to 30 percent. This indicates that the primary objective of the public works schemes was to create the opportunity for beneficiaries to spend on food and alleviate food insecurity. More generally, some 94 percent of public works participants considered that their living standards had improved as a result of participating in public works (TASAF 2011a). Asset formation appears to have been less successful: key interviewees in the impact assessment indicated that, because the construction of PWP subprojects was labor intensive and in many cases done with inadequate budgets, the infrastructures, especially roads, were of relatively low quality. Delays in road works, with construction slipping toward the latter part of the dry season, meant that the soil did not have time to compact, and the Earth roads were unstable and prone to erosion during the rainy season, reducing their usefulness.
Income-generating activities. Income-generating activities had been launched by 459,000 vulnerable individuals. Their livestock and asset holdings had increased by 740 percent by the end of the project. The bulk—close to 90 percent—was in the form of poultry, cattle, and goats. A survey (TASAF 2011a) indicated that practically all participants were able to generate some earnings from their assets—mainly spent on meeting day-to-day needs, although some 40 percent were able to establish savings accounts. Most of them also had acquired skills for managing their assets. The average value of the TASAF grant per group was US$ 6,730, while the total income generated was US$ 6,000. The latter reflects initial depreciation of assets, as well as funds spent on training and other expenses. Six months after disbursement of the grants, average sales of group members was US$ 32 during the previous month, and profits were negative. Over a twelve month period, profits started turning positive. A control group showed negligible business activity.
4.18 Unconditional cash transfers could have been an option to both public works schemes and income-generating activities. To the extent that the emphasis is placed on providing cash, in either case an unconditional cash transfer would have been more efficient—either providing more income, or the same income at lower cost. That said, the

25
income-generating component was not introduced as a poverty reduction measure but rather as a means of accumulating assets, creating economic activity, and laying the basis for a more permanent reduction of poverty with a one-time infusion of cash. The public-works scheme was initially a straightforward cash-for-work scheme. With the introduction of the voluntary savings-investment scheme, it opened the door for participants to build up assets and engage in income-generating activities.
4.19 In terms of size, both income- and asset-generating schemes were modest. This should have been expected: they were voluntary, and they were focused on the poorest households in the community, in which entrepreneurial initiative was likely to be low and results meager even under the best of circumstances. Casting a wider net might have produced more remarkable results but might also have diluted the emphasis on the poorest households.
CCT. An impact evaluation of the CCT was initiated in three districts covering 80 villages showed the following, based on data from 2010–2012 (Evans et al. 2014). In health, households who received CCT reported initially higher health service use than comparison groups, but over time, this became lower than for comparison households, suggesting that other demand- or supply-side factors are affecting service use. At the same time, treatment households17 were 25 percent more likely to enroll in health insurance and reported better health status. Effects were strongest in the poorest households. In education, the CCT led to significant increases (15 percent) in primary school completion in age group 15–18, particularly for girls (23 percent). However, the impact evaluation found no significant difference in literacy between treatment and control students. Overall, the program appears to have had a positive effect on activating participants: they were more likely to attend village council meetings, and female recipients were more likely to volunteer their time and labor to a community-development project.
5. Efficiency
5.1 Efficiency is rated modest.
5.2 Neither the PAD nor the ICR conducted a rigorous benefit-cost analysis of the project or of any of its component parts. Instead, the emphasis was placed on cost-effectiveness. The PAD argues that “poor communities are rational . . . and choices will reflect those subprojects that provide the greatest return to their input of labor, time, materials, and cash. [Consequently] . . . a traditional cost-benefit analysis is not suitable.” However, this was not always the case, as national and district-level priorities appear to have had a strong influence in subproject selection, resulting in second- or third-best solutions for the community. But due to the widespread lack of all kinds of basic services, it may still be true that welfare gains were achieved even when second- or third-best options were selected, and therefore this still represented good value for money. Moreover, benefit-cost analysis could have been applied to all the NVF components, and to
17 The study covered 1,764 households in three districts.

26
COMSIP, drawing on best estimates and experience under TASAF I at the appraisal stage and on hard data available at the time of the ICR. Instead, the PAD bases the economic rationale for the project purely on the strength of the decentralization-driven allocation process and cost-effective subproject designs.
5.3 The ICR states that a full benefit-cost analysis is not appropriate but offers no justification for that position. Its cost-effectiveness analysis provided the following results:
Based on available information, and considering the modest access to basic social services (schools, health facilities, and so on) in which some 80 percent of IDA resources were spent, the project did increase service access through cost-effective service-poor community subprojects: cost-effectiveness was established by a comparison undertaken by the ICR (p. 42), which determined that TASAF construction costs were lower than for other comparable projects in education and health. Although there usually is an element of uncertainty to such comparisons—design, technology, materials, and contractors may differ—the comparison appears rigorous. It is accompanied by a technical audit that notes that some major reasons for the higher efficiency of TASAF projects were community involvement in procurement and supervision, which had a moderating effect on contractor overhead costs.18 IEG was not in a position to determine if that effect extended to quality of construction; but in almost all cases—those observed by IEG and those noted in project surveys—completed facilities were providing services, and the population overwhelmingly expressed their satisfaction with them.
In some instances, while sector standards were being applied, quality still may have been compromised, considering that costing and budgeting problems did arise during implementation, which may have limited full equipping of facilities; and cases were reported in which badly timed road works allowed roads to wash away before they were compacted. Still, in almost all cases, completed facilities were providing services, and the population overwhelmingly expressed that it was satisfied with them.
Table 5.1 includes the findings of the technical audit with regard to costs (TSH).
Table 5.1. Technical Audit Findings on Costs
Sector TASAF cost/m2
Ministry of Education
cost/m2
National construction council
standard costs
TASAF cost savings
%
Education 122,000 145,000 380,000–420,000 19–244
Health 178,000 n.a. 430,000–450,000 141–153
Public works projects were at best modestly cost-effective, based on indicators of labor intensity and wage levels: the labor component was initially set at 40 percent of project costs, and later raised to 50 percent. Both are unusually low indicators for labor-intensive works. The wage rate was set at 10 percent below
18 While this may generally have been the case, cost escalation nevertheless did occur in “thin” markets with few bidders. Of course, community involvement may still have served to maintain prices below what could be expected in a public bidding where community pressures may have been less present.

27
the prevailing local market wage for similar works. Moreover, sustainability of roads, the major component in public works, was often doubtful, as noted above and in the discussion on Implementation Experience.
Project funds were moderately well targeted at the poor (see the section on Targeting), using geographic, community, and self-selection in targeting. Overall, targeting was determined to be weakly pro-poor. This was mainly driven by the national level poverty targeting criteria established by TASAF. At the intradistrict level, this was no longer the case, as noted in the Targeting section.
Based on field-level observations and drawing on project impact evaluations, the income-generating activities for vulnerable groups showed the component after 12 months averaging positive profits, and significant increases in household assets, mainly from animal husbandry; this reflected a turn-about after the initial six months period, which showed high asset accumulation, but negative profits.
5.4 The availability of a savings-investment mechanism strengthened the longer-term impact of the public-works schemes because it offered the opportunity to set aside some of the wages and invest them in small-business activities and household assets—essentially livestock. The ICR undertook a cost-effectiveness analysis, in which the main findings were that there had been a steady growth in membership and savings; some 70 percent of members borrowed from their group, and most repaid the loan and took out further credit.
6. Ratings
Outcome
6.1 The relevance of the original PDO is rated substantial, reflecting the continued relevance of project objectives to the country situation, government policy, and World Bank strategy, but also recognizing the change in emphasis of government and World Bank interventions toward safety net policies. The relevance of design is rated modest for the original objective, due to issues with the formulation of the objective and indicators. Achievement of objectives is rated modest for the empowerment objective in the absence of defined outputs and outcomes; modest for the enhanced socioeconomic services objective with only limited information on results of increased access to services; and substantial for the improved livelihood objective, with strong livelihood-enhancing results. Efficiency is rated modest.
6.2 The outcome for the original project objective is rated moderately unsatisfactory.
6.3 The relevance of the revised PDO is rated substantial, reflecting continued relevance to the country situation, and government and World Bank strategies. The relevance of the design is rated substantial, with a straightforward PDO and clear links between outputs, outcomes, and the PDO. Achievement of objectives is rated modest for the enhanced socioeconomic services objective, reflecting only limited information of results of increased access to services; and substantial for the improved livelihood
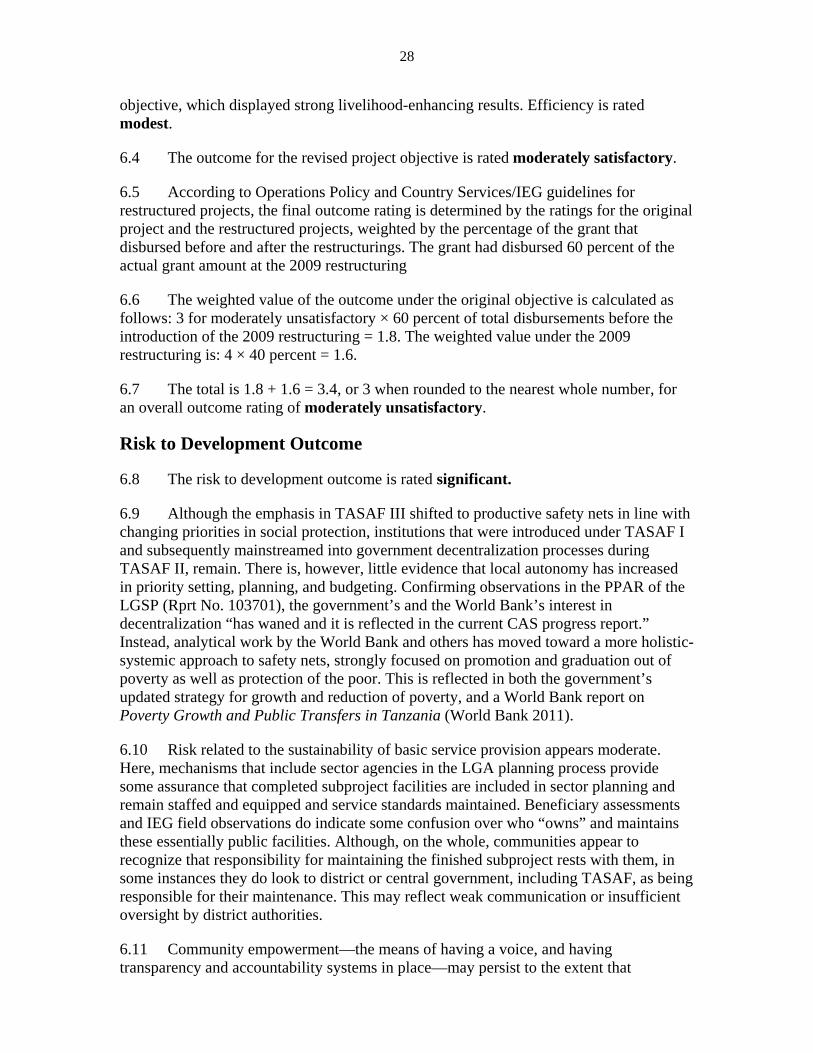
28
objective, which displayed strong livelihood-enhancing results. Efficiency is rated modest.
6.4 The outcome for the revised project objective is rated moderately satisfactory.
6.5 According to Operations Policy and Country Services/IEG guidelines for restructured projects, the final outcome rating is determined by the ratings for the original project and the restructured projects, weighted by the percentage of the grant that disbursed before and after the restructurings. The grant had disbursed 60 percent of the actual grant amount at the 2009 restructuring
6.6 The weighted value of the outcome under the original objective is calculated as follows: 3 for moderately unsatisfactory × 60 percent of total disbursements before the introduction of the 2009 restructuring = 1.8. The weighted value under the 2009 restructuring is: 4 × 40 percent = 1.6.
6.7 The total is 1.8 + 1.6 = 3.4, or 3 when rounded to the nearest whole number, for an overall outcome rating of moderately unsatisfactory.
Risk to Development Outcome
6.8 The risk to development outcome is rated significant.
6.9 Although the emphasis in TASAF III shifted to productive safety nets in line with changing priorities in social protection, institutions that were introduced under TASAF I and subsequently mainstreamed into government decentralization processes during TASAF II, remain. There is, however, little evidence that local autonomy has increased in priority setting, planning, and budgeting. Confirming observations in the PPAR of the LGSP (Rprt No. 103701), the government’s and the World Bank’s interest in decentralization “has waned and it is reflected in the current CAS progress report.” Instead, analytical work by the World Bank and others has moved toward a more holistic-systemic approach to safety nets, strongly focused on promotion and graduation out of poverty as well as protection of the poor. This is reflected in both the government’s updated strategy for growth and reduction of poverty, and a World Bank report on Poverty Growth and Public Transfers in Tanzania (World Bank 2011).
6.10 Risk related to the sustainability of basic service provision appears moderate. Here, mechanisms that include sector agencies in the LGA planning process provide some assurance that completed subproject facilities are included in sector planning and remain staffed and equipped and service standards maintained. Beneficiary assessments and IEG field observations do indicate some confusion over who “owns” and maintains these essentially public facilities. Although, on the whole, communities appear to recognize that responsibility for maintaining the finished subproject rests with them, in some instances they do look to district or central government, including TASAF, as being responsible for their maintenance. This may reflect weak communication or insufficient oversight by district authorities.
6.11 Community empowerment—the means of having a voice, and having transparency and accountability systems in place—may persist to the extent that

29
communities and citizens remain involved in the local development process. Observations in the field by IEG indicate that the empowerment process had activated villagers beyond the “elite.” The project’s impact assessment notes that beneficiaries themselves feel better equipped to analyze their poverty situation and decide on priorities; that communities now believe that they are better able to relinquish entrenched attitudes of dependency, better identify their assets, and exercise self-reliance and ownership of the development process. Still, to the extent that there is less emphasis on decentralization and on engaging the citizenry, it is not clear that this will remain sustainable: while the planning process was participatory, in many instances local priorities were still set by districts or by central government.
6.12 Savings and investment groups, and income-generating initiatives, continue to be supported under TASAF III. Regarding initiatives already put in place under TASAF II, there is business risk and risk of failure attached to them. That is to some extent mitigated by mutual support and advice from COMSIP for savings and investment, and council and NGO arrangements about vulnerable groups. Particularly challenging may be sustaining vulnerable group initiatives. They are dependent on mutual support; but they are also dependent on LGAs being motivated to provide effective technical services, mainly in elementary practical business skills based on learning by doing. Over the period under review, new entrepreneurs seem to have been reasonably successful, and failure rates have been low.
Bank Performance
QUALITY AT ENTRY
6.13 Quality at entry is rated as moderately unsatisfactory.
6.14 The project built on and benefited from the experience under TASAF I. Lessons learned from implementing that project as well as from other operations in Tanzania, and from extensive experience with social funds in other African countries, and elsewhere, were taken into account in the development of the operation, as was government decentralization strategy. Essentially, the project was designed to support that strategy, while at the same time focusing on poverty alleviation and the needs of the beneficiary communities and households. TASAF operating procedures were incorporated into LGA planning processes to facilitate interaction between LGAs where decisions were made, and communities where priorities were expressed. This change in focus was backed up by relevant capacity development for communities, designed to complement the parallel LGRP activities that focused on LGAs. To enhance the quality and consistency of subprojects, national sector standards were being introduced. Outside the strict framework of infrastructure subprojects, a group savings/investment scheme was linked to the public works scheme to offer group-based savings/investment opportunities for asset building, which otherwise were unlikely to be available to participants in works. Likewise, an income-generating scheme was introduced for vulnerable households who otherwise had few opportunities for asset accumulation. None of these were standard elements of the CDD/decentralization concept, but rather addressed a need that subsequently would be explicitly recognized as the government and the World Bank moved on to TASAF III.
30
6.15 There were also shortcomings of design. The results framework, including the causal chain and the M&E framework, had to be restructured during implementation. Some elements of the original objective were too broadly defined and difficult to monitor on a systematic basis. Issues of attribution would make assessment difficult. And there were concerns with design reflected in the implementation experience. There were delays in the finalization and agreement on the Operational Manual, which was an effectiveness condition in project documents, and these delays slowed down the project’s startup.
QUALITY OF SUPERVISION
6.16 Quality of supervision is rated moderately satisfactory.
6.17 With the team leader and fiduciary staff based in the country, the World Bank was able to provide regular implementation support to TASAF. During field discussions, TASAF underlined the value of this proximity: implementation required flexibility in order to deal with day-to-day challenges as they arose: these would turn out to be relatively frequent as the LGA levels were taking on increasing responsibility for implementing project processes. A proactive World Bank team also realized early on the shortcomings of the results framework—and notably its heavy process focus and the incompatibility in practice between indicators and results. Many of the design challenges that arose during implementation (indicated in the section on Implementation Experience) might have been addressed earlier during implementation, for instance subproject approval and clearance processes, and the seemingly uneven support given to savings groups and vulnerable individuals.
6.18 In 2008, the World Bank team and the government had already collaborated on significant adjustments to the project. The country had been hit by the international food, fuel and financial crisis, and by higher local food prices, as a short rainy season increased food insecurity for vulnerable households, and first drove up the price of basic staples and subsequently of transport costs and construction costs. Consequently, the World Bank team prepared the two additional financings in 2009 and 2010. Japanese funds were also secured to pilot test CCT in three districts. That element is now being scaled up under TASAF III (Productive Social Safety Net Project). The supervision team also promoted learning events on safety nets, including south—south events with South Asia and other African countries. Shortcomings included delays in World Bank No Objection that slowed down procurement, and in approving contracting of the national statistics agency for the impact evaluation.
6.19 Overall World Bank performance is rated moderately unsatisfactory.
Borrower Performance
GOVERNMENT PERFORMANCE
6.20 Government performance is rated satisfactory.
6.21 The government was committed to grassroots community participation in the development process, as reflected in its policy and strategy papers. The institutions introduced under the two TASAF projects, and in particular their mainstreaming into the

31
devolution of financial and administrative decision making in local development to LGAs, facilitated this, and this was reflected in the strong support the government gave to the TASAF management unit and the project: the organization was considered a top performer among government agencies, and the project a key instrument in poverty alleviation. Externalities from a government financial management reform (consolidation of budget accounts) did delay execution toward the end of the project, but did not affect outcomes.
IMPLEMENTING AGENCY PERFORMANCE
6.22 Implementing agency performance is rated satisfactory.
6.23 The implementation agency was the TASAF management unit. In Tanzania, it is recognized as a well-performing government agency, based on its work under TASAF I and 2. There, it showed persistence and resolve in applying the CDD approach at local and community levels, in particular through the challenges of mainstreaming processes and ensuring adequate implementation capacity in an environment where administrative capabilities of LGAs and communities could vary greatly. For the most part, its performance was rated satisfactory by the World Bank supervision team. Many of the challenges that arose during implementation, and which are noted in the section on Implementation Experience, were systemic and could only be marginally influence by TASAF; some might have been better handled, albeit in collaboration with the World Bank supervision team—notably potential weaknesses in design relating to the timing of public works schemes, technical support for vulnerable groups, and approval and clearance processes. Over a period of time, TASAF had staffing problems (World Bank 2006a, p. 27), but it is not clear how these in fact affected performance, if at all.
6.24 Overall borrower performance is rated satisfactory.
Monitoring and Evaluation
6.25 Overall, the quality of M&E was modest.
6.26 Monitoring and Evaluation (M&E) Design. The M&E framework for project startup was uneven. Although performance indicators at the level of outputs and intermediate and final outcomes had been identified, they did not initially offer a strong platform for M&E, especially in the absence of any explicit indicators on empowerment and with the heavy emphasis on difficult-to-monitor MDG indicators. Moreover, baselines and targets had not been identified for many key indicators because most of them related to the availability and use of basic services: the PAD indicated that the project was demand driven, and therefore the number of subprojects in each specific sector could not be determined in advance—an argument that applied to at most four of the twelve key indicators. The three main indicators in the results framework were not formulated in a measurable way, leaving the question unanswered as to how achievements were to be measured (for example, individuals with increased availability, as measured by. . .?). The PAD did contain a set of secondary indicators with baselines and targets provided to monitor processes for the access to enhanced economic services and access to improved livelihoods components.

32
6.27 That was to change with the revision to the PDO and indicators in 2009, when a results framework with explicit goals, objectives, outputs, and activities with corresponding indicators for which the project could be held directly accountable, was introduced. Moreover, outcome indicators were at a level of detail that made it easy to determine if satisfactory results were being achieved.
6.28 M&E Implementation. The M&E system was able to use performance indicators to track progress and provide information on the impact of the project through quarterly and annual progress reports, project implementation support missions, and Implementation Status and Results Reports. Measurement of several key outcome indicators was first done by sector ministries through household budget surveys or sector-specific surveys or administrative data. The system became more robust when the indicators were revised at the midterm review and were made more outcome-focused and directly relevant to the revised PDO as both baselines and targets were set.
6.29 M&E Use. The management information system, based on data collection and initial analysis at the LGA level, was able to track inputs, outputs, and qualitative findings, which drove adjustments in the program. For example, the process evaluation of the CCT pilot was instrumental in designing an effective scale-up of the program, even though some innovative participatory M&E tools, such as community score cards and citizens’ report cards, piloted during implementation, proved to be difficult and costly to repeat with the required frequency.
Safeguard Compliance
6.30 The project triggered the Environmental Assessment (OP/BP 4.01) requirement with an environmental screening category of B and the safeguard policy for Involuntary Resettlement (OP/BP 4.12). Environmental and social safeguard aspects were included in an Environmental and Social Management Framework and incorporated in the Operational Manual, the Service Guidelines for Community Participation, and the Community Project Management Handbook. Environmental screening was done by LGA staff trained in environmental management.
6.31 Although no significant safeguard issues were reported during project implementation, nor observed during IEG field visits, technical audits had revealed some shortcomings in the environmental screening process, essentially due to still-insufficient knowledge in some LGAs and at community level.
Fiduciary Compliance
6.32 Financial management continued the procedures successfully introduced under TASAF I, with resources transferred through LGA accounts to village-level project-management committee accounts. Payment to contractors and beneficiaries were made by the committees from these accounts. Supervision consistently rated financial management performance satisfactory, with the exception of the first project year, when it was rated unsatisfactory as the positions of financial director and audit director remained unfilled. The issue was subsequently resolved.

33
6.33 Audits were submitted in a timely way and were unqualified.
7. Lessons
7.1 Mainstreaming of the social fund subproject process at the local government level can strengthen outcomes of decentralized planning. A central feature of TASAF II was the introduction of a participatory planning process between communities and local authorities in shaping district-level investment programs. Although the weight of decision making—final subproject selection and design features—was with the local authorities and sector ministries to ensure standards and adequate operating arrangements, community preferences came to be voiced and recognized in the process of setting priorities and shaping plans.
7.2 Community participation in the local planning process does not ensure that community priorities are realized. The institutions for implementing the subproject cycle in social funds may provide reasonable assurances that community priorities are implemented. This is not necessarily the case when social fund practice is integrated into the local development planning process. Then project selection may be more likely to be driven by national and local government investment priorities that may or may not coincide with community preferences. The capabilities of the local authorities then become particularly important, especially the ability of their field-level agents to advise communities, remain neutral in their advice, and mediate between the interests of targeted beneficiaries and vested interests. When there is high turnover of staff, continuous training of field agents becomes an important auxiliary function.
7.3 When poverty alleviation is the underlying goal, as in TASAF, a combination of interventions can be effective. TASAF evolved from a straightforward social fund financing socioeconomic infrastructure projects to extend access to basic economic and social services to one that combined that activity with productive safety nets for improved livelihoods. Although they initially seemed to be disparate components, they in fact came to form the elements of an integrated strategy for improving people’s basic economic security.
7.4 Setting realistic guidelines can improve subproject outcomes. To promote better subproject outcomes, project design should include mechanisms to ensure that subprojects are affordable and suited to community management and maintenance and to ensure that national construction standards are met in the implementation of service delivery and public works subprojects. Implementation of TASAF I identified that although sector norms and standards exist, they may be poorly enforced at the local level for a variety of reasons that range from capacity constraints to vested interest to subproject financing. To address this issue, TASAF II adopted sectoral standards for facility design, developed by the sectoral ministries. To address the lax enforcement of sectoral norms and standards at the local level, TASAF II established a Sectoral Expert Team, comprised of higher-level representatives from sectoral ministries to review and authorize all subprojects for conformity with sector norms and standards and ensure any necessary staffing positions or additional equipment were integrated into sector planning.

34
7.5 Community preferences in the planning system are influenced by subproject menus. Community preferences are likely to be influenced by the social fund’s menu of eligible subprojects, local government planning priorities (which in turn usually reflect national priorities), and capture by the local elite. During field discussions, allusions were made about district planning officers and elected officials having undue influence on project selection. The challenge is to design local planning systems that reduce chances of local capture and better target poor communities. Box 7.1 describes such an approach in Mexico.
Box 7.1. Giving Incentives for Pro-Poor Investments in Local Planning Processes
Mexico’s Municipal Fund program was launched with an official discourse that mandated broad community participation in project selection and implementation; government-community co-responsibility in project management; and civil society oversight of the use of project funds. But this was not enough to encourage autonomous, informed participation and power-sharing. To improve the accountability and targeting of resources, additional measures were put in place:
• Encouraging better antipoverty targeting within municipalities by capping the fraction allowed for town centers; and
• Setting a sliding scale for varying levels of community counterpart contributions intended to encourage investments with higher social impacts—participants had to contribute more toward the cost of projects that were either less directly related to fighting poverty or were not public goods
These measures not only promoted better antipoverty targeting, they also encouraged broader participation. For example, if most of the funds had to be spent outside the town center, then that measure potentially magnified the voices of the poorer communities that lived outside the town centers. The targeting measure created an entitlement that had often not existed before. This entitlement in turn created an accountability benchmark that served to encourage participation.
Source: Fox and Van Wicklin 2008.

35
References
Baird, Sarah, Craig McIntosh, and Berk Ozler. 2013. “The Regressive Demands of Demand Driven Development,” Journal of Public Economics, Vol. 106, pp. 370-403.
Evans, David K., Stephanie Hausladen, Katrina Kosec, and Natasha Reese. 2014. Community based conditional cash transfers in Tanzania: Results from a randomized trial. Washington, DC: World Bank.
Fox, Louise and Warren A. Van Wicklin III. 2008. Tanzania Social Action Fund (TASAF I) Evaluation Report. Washington, DC: World Bank.
Government of Tanzania. 1999. The Tanzania Development Vision 2025. Dar es Salaam Government of Tanzania.
Independent Evaluation Group. 2016. Tanzania Local Government Support Project: Project Performance Assessment Report. Washington, DC: World Bank.
National Bureau of Statistics, Tanzania. 2002. Tanzania Population and Housing Census 2002. Dar es Salaam: Ministry of Planning, Economy and Empowerment.
Ozler, Berk. 2011. Short-term Impacts of TASAF II VG component. Social Protection Discussion Paper Series No. 0518. Washington, DC: World Bank.
Tanzania Social Action Fund (TASAF). 2007a. Beneficiary Assessment Study in TASAF II Operational Areas. Dar es Salaam: ACHRID Ltd.
______. 2007b. Technical Audit in TASAF Operating Areas. Dar es Salaam: Don Consult and NETWAS Ltd.
______. 2010a. Assessment of the Performance of Four Pilot Community Foundations. Dar es Salaam : Daima Associates.
______. 2010b. Information Education and Communications (IEC) Impact Assessment in TASAF Supported Areas. Dar es Salaam: Unique Consortium of Consultancy Services.
______. 2011a. Assessment of the Viability of the Income-Generating Activities Interventions Implemented under TASAF II. Dar es Salaam: EcomResearch Group.
______. 2011b. Rapid Assessment of Implementation of Public Works Program and Vulnerable Support under the Tanzania Social Action Fund. Dar es Salaam: ACHRID Ltd.
______. 2012a. Assessment of the Current Information Technology Systems and Infrastructure at TASAF. Dar es Salaam: Advantech.
______. 2012b. Survey of Household Enterprises and Group Economic Activities. Dar es Salaam: Institute of Management and Entrepreneurship Development.
______. 2013. Impact Assessment of Service Poor, PWP Interventions and Capacity Enhancement (COMSIP and Training) in TASAF II Supported Activities. Dar es Salaam: ACHRID Ltd.
Tanzania. 2010. “Accelerating Progress toward the MDGs: Country Action Plan 2010–2015.” Final Report 2, Dar es Salaam.
World Bank. 2000. Social Action Fund Project—Project Appraisal Report. Washington, DC: World Bank.
______. 2002. Empowerment and Poverty Reduction: A Sourcebook. Washington, DC: World Bank.
______. 2003. Tanzania Poverty Reduction Strategy Paper and Joint IDA-IMF Staff Assessment of the PRSP. IMF Country Report No. 04/283 Washington, DC: World Bank.
______. 2004a. Second Social Action Fund Project. Appraisal Report. Washington, DC: World Bank.
______. 2004b. Local Government Support Project: Project Appraisal Report. Washington, DC: World Bank.

36 REFERENCES
______. 2005. Development Financing Agreement: Second Social Action Fund Project. Washington, DC: World Bank.
______. 2006a. Implementation Completion and Results Report: Tanzania Social Action Fund Project. Washington, DC: World Bank.
______. 2006b. National Strategy for Growth and Reduction of Poverty and Joint IDA-IMF Staff Advisory Note. Washington, DC: World Bank.
______. 2007a. Tanzania Sustaining and Sharing Economic Growth: Country Economic Memorandum and Poverty Assessment (Main Report). Washington, DC: World Bank.
______. 2007b. Joint Assistance Strategy for Tanzania FY2007–FY2010. Washington DC: World Bank.
______. 2009. Emergency Program Paper: Additional Financing: Tanzania Second Social Action Fund. Washington, DC: World Bank.
______. 2011. Tanzania: Poverty, Growth, and Public Transfers: Options for a National Productive Safety Net Program. Washington DC: World Bank.
______. 2012. Productive Social Safety Net Project (APL 1): Project Appraisal Report. Washington, DC.
______. 2013a. Tanzania Second Social Action Fund: Restructuring Paper. Washington, DC: World Bank.
______. 2013b. Implementation Completion and Results Report: Tanzania Second Social Action Fund. Washington, DC: World Bank.
______. 2014. Tanzania: Can Local Communities Successfully Run Cash Transfer Programs? Washington, DC: World Bank.
______. 2015. Tanzania Mainland Poverty Assessment. Washington, DC: World Bank.

37
Appendix A. Basic Data Sheet
TANZANIA SOCIAL ACTION FUND 2 (IDA 4002, IDA 4636)
Cumulative Estimated and Actual Disbursements
FY05 FY06 FY07 FY08 FY09
Appraisal estimate (US$M) 5.00 45.00 95.00 140.00 150.00
Actual (US$M) 5.00 45.00 95.00 140.00 150.0
Actual as % of appraisal 100 100 100 100 100
Date of final disbursement: July 2013
Project Dates
Original Actual
Appraisal 09/13/2004 09/13/2004
Negotiations 10/11/2004 10/08/2004
Board approval 11/23/2004 11/30/2004
Signing 01/19/2005 01/19/2005
Effectiveness 02/21/2005 05/11/2005
Closing date 06/20/2010 06/30/2013
Staff Time and Cost
Stage of Project Cycle Staff Time and Cost (World Bank Budget Only)
No. of staff weeks USD Thousands(including travel and consultants costs)
Lending
FY04 186.62
Total: 545.19
Supervision/ICR
FY05 86.60
FY06 145.02
FY07 149.96
FY08 137.58
Total 519.16

ANNEX A 38
Task Team members
Names Title Unit
Lending
Francis Ato Brown Sector Manager, Water MNSSD
Pascale Helene Dubois Evaluation and Suspension Officer OES
Tseggai Elias Consultant AFTTR
Lori A. Geurts Operations Analyst SASHN
Matthew D. Glasser Lead Urban Specialist SASDU
Muthoni W. Kaniaru Sr. Counsel LEGFI
Evelyne C. Kapya Program Assistant AFCE1
Amadou Konare Sr. Environmental Specialist AFTEN
Suleiman Namara Sr. Social protection Specialist AFTSE
Nginya Mungai Lenneiye Country Manager AFMZW
Ida Manjolo Sr. Social Protection Specialist AFTSE
Prasad C. Mohan Lead IEC Specialist AFTRL
Donald Herrings Mphande Sr. Financial Management Specialist AFTFM
Norbert O. Mugwagwa Operations Adviser HDNED
Krishna Pidatala Senior Operations Officer TWICT
Mercy Mataro Sabai Sr. Financial Management Specialist AFTFM
Pascal Tegwa Senior Procurement Specialist AFTPC
Hope C. Phillips Volker Senior Operations Officer EASHH
Supervision/ICR
Wim H. Alberts Sr. Social Protection Specialist AFTH1-HIS
Mary C.K. Bitekerezo Senior Social Development Specialist AFTCS
NginyamungaLenneiye Country Manager
Lori A. Geurts Operations Analyst SASHN
Evelyne C. Kapya Program Assistant AFCE1
Jane A. N. Kibbassa Sr. Environmental Specialist AFTEN
Emmanuel G. Malangalila Consultant AFTHE
Ida Manjolo Social Protection Specialist AFTSP
Zainab Semgalawe Senior Rural Development Specialist AFTAR
Blessing Manyanda Disbursement Asst. AFMZW
Donald Paul Mneney Senior Procurement Specialist AFTPC
Prasad C. Mohan Lead IEC Specialist AFTRL
Donald Herrings Mphande Sr. Financial Management Specialist AFTFM
Norbert O. Mugwagwa Operations Adviser HDNED
David Mayala Mulongo Urban Specialist AFTUW

39 ANNEX A
Anne Muuna Team Assistant AFCE1
Suleiman Namara Sr. Social Protection Specialist AFTSP
Krishna Pidatala Senior Operations Officer TWICT
Mercy Mataro Sabai Sr. Financial Management Specialist AFTFM
Pascal Tegwa Senior Procurement Specialist AFTPC
AnjuVajja E T Consultant IEGSE
Agnes Nderakindo Mganga Team Assistant AFCE1

40
Appendix B. List of Persons Met
The World Bank Ladislaus Mwamanga, Executive Director, TASAF Amadeus Kamagenge, Director, Community Services, TASAF Elisifa Kinasha, Infrastructure Development Manager, TASAF Alphonse Kyariga, Director of Coordination, TASAF Godwin Mkisi, Disbursement Manager, TASAF Mohamed Msallah, TASAF Shedrack Mziray, TASAF Bella Bird, Country Director Gayle Martin, Program Leader Emmanual Mungunasi, Senior Economist Tanzania Government Officials Obey Asseri, Director of Coordination of Government Business, Prime Minister’s Office Calist Luanda, Director, Local Government, Prime Minister’s Office Debis Bandisa, Director, Prime Minister’s Office Mr. Cheyo, Commissioner of Budget, Prime Minister’s Office Abbas Kandoro, Regional Commissioner, Tanzania National Steering Committee Amran M. Amran, Second Vice President, Tanzania National Steering Committee Anna Mwasha, Director, Poverty Eradication, Ministry of Finance Constancia Gabusa, Assistant Director, Gender Ministry of Community, Development, Gender and Children NGOs Tatu Mwaruka, Management Team, COMSIP19 Zacharia Malosha, Management Team, COMSIP Deo Binamungu, Consultant, ACHRID20 Abdallah Hassan, Senior Information Officer, Economic and Social Research Foundation Flora Myamba, Director of Social Protection, REPOA21 Felician Tungaraza, Chairman,Alpha and Omega Consulting Martin Mlele, Director of projects, Alpha and Omega Consulting Amon Manyama, Deputy Country Director, UNDP Bwijo Bwijo, Practice Specialist, HIV/AIDS UNDP Alison Jenkins , Chief HIV/AIDS, UNICEF Beatrice Targa , Social & Economic Analysis, UNICEF Gertrude Kihunrwa, Social Development Adviser, UKAid Academia and Country Experts
Robert Mhamba, Senior Lecturer, University of Dar Es Salaam Tumsifu Elly, Senior Lecturer, University of Dar Es Salaam
19 COMSIP: Community Savings and Investment Promotion 20 ACHRID: Associated Consultants in Human Resources and Institutional Development 21 REPOA: Policy Research for Development

41 ANNEX B
Winnie Terry, Executive Secretary, Association of Microfinance Institutions Local Officials
Bagamoyo District: District Council, District Executive Director, Council Management Team, Council Technical Team Mayuguru Village: Village Chairperson, Village Executive Officer, Village Council, CMC Dunda Mtaa Village: Village Chairperson, Village Executive Officer, Village Council, CMC, Teachers’ Committee
Ilala Municipality: Municipal Director, Council Management Team, Technical team Zigiziwa Mtaa Village: Village Chairperson, Village Executive Officer, Village Council, CMC Mwembe Madafu Village: Village Chairperson, Village Executive Officer, Village Council, CMC
Local NGOs
Rural Livelihoods Development Company, Dodoma Umoyawa Wakulimawa Mbogana Matunda, Zanzibar Morogoro Municipal Community Foundation Arusha Municipal Community Foundation