seb's first quarter 2015 results presentation
TRANSCRIPT
SEB January–March 2015 Press Conference
Annika Falkengren President & CEO

An exceptional environment
Repo rates % Stockholm stock exchange (OMXSPI)
400
450
500
550
600
Dec-13 Mar-14 Jun-14 Sep-14 Dec-14 Mar-15-0.4
-0.2
0.0
0.2
0.4
0.6
0.8
1.0
Dec-13 Mar-14 Jun-14 Sep-14 Dec-14 Mar-15
Eurozone Sweden USA

Highlights Q1 2015
3
Increased volatility drives customer demand for risk management products
Strong asset quality and resilience
High net inflows of AuM due to strong sales and positive equity markets

4.9 4.3
1.3 0.9
% Q1-14 %
Total Operating income 11,612 11,102 5 10,443 11Total Operating expenses -5,558 -5,791 -4 -5,338 4Profit before credit losses 6,054 5,311 14 5,105 19Net credit losses etc. -264 -395 -250
Operating profit 5,790 4,916 18 4,855 19
Q1-15 Q4-14
Financial summary excl. one-offs gains in Q4-14
4
42%
37%
11%
8% 2%
Operating income by type, Q1 2015 vs. Q1 2014 (SEK bn)
Profit and loss (SEK m)
Net interest income
Net fee and commissions
Net financial income
Net life insurance income
Q1-14 Q1-15 Q1-14 Q1-15 Q1-14 Q1-15 Q1-14 Q1-15
Income distribution Jan-Mar 2015

Net interest income development SEK bn
5
Net interest income Jan-Mar 2015 vs. Jan-Mar 2014
Net interest income type Q1 2013 – Q1 2015
3.5 3.9 4.2
Q1-13 Q1-14 Q1-15
0.6 0.8
0.3
Q1-13 Q1-14 Q1-15
0.4 0.2
0.4
Q1-13 Q1-14 Q1-15
Deposits
Funding & other
Lending
4.8 4.9
Jan-Mar '14 Jan-Mar '15
+3%

Net fee and commission income development SEK bn
6
Net fee and commissions Jan-Mar 2015 vs. Jan-Mar 2014
Gross fee and commissions by income type Q1 2013 – Q1 2015
Custody and mutual funds
Payments, cards, lending, deposits & guarantees
Advisory, secondary markets and derivatives
+15%
3.7
4.3
Jan-Mar '14 Jan-Mar '15
0.6 0.7 0.8
Q1-13 Q1-14 Q1-15
1.7 1.8 2.3
Q1-13 Q1-14 Q1-15
2.2 2.6 2.4
Q1-13 Q1-14 Q1-15

1.0 1.1 0.8
1.2 1.1 0.8
0.7 0.3
1.3
Q1-13 Q1-14 Q1-151.1
1.3
Jan-Mar '14 Jan-Mar '15
Net financial income development SEK bn
7
NFI and total Markets result Q1 2013 – Q1 2015 Net financial income Jan-Mar 2015 vs. Jan-Mar 2014
+16%
Net financial income development Q1 2013 – Q1 2015
Increased volatility in the quarter*
10
12
14
16
18
20
22
24
26
Dec-12 Mar-13 Jun-13 Sep-13 Dec-13 Mar-14 Jun-14 Sep-14 Dec-14 Mar-15
* (VIX S&P 500 volatility)

Operating leverage excluding one-offs Average quarterly income (SEK bn)
9.2 9.4 9.8 10.4 11.0 11.6
Avg 2010 Avg 2011 Avg 2012 Avg 2013 Avg 2014 Jan-Mar2015
Average quarterly expenses (SEK bn)
5.8 5.9 5.7 5.6 5.5 5.6
Avg 2010 Avg 2011 Avg 2012 Avg 2013 Avg 2014 Jan-Mar2015
Average quarterly profit before credit losses (SEK bn)
Notes: Excluding one-offs (restructuring in 2010, bond buy-back and IT impairment in 2012, sale of MasterCard shares and Euroline in 2014) Estimated IAS 19 costs in 2010
3.4 3.5 4.1 4.8 5.5 6.1
Avg 2010 Avg 2011 Avg 2012 Avg 2013 Avg 2014 Jan-Mar2015
8

Baltic
Merchant Banking
Life & Wealth
Retail Banking
All divisions driving operating leverage
4.6
2.2
Avg2010
Avg2011
Avg2012
Avg2013
Avg2014
Jan-Mar2015
3.1
1.4
Avg2010
Avg2011
Avg2012
Avg2013
Avg2014
Jan-Mar2015
2.9
1.3
Avg2010
Avg2011
Avg2012
Avg2013
Avg2014
Jan-Mar2015
0.9 0.4
Avg2010
Avg2011
Avg2012
Avg2013
Avg2014
Jan-Mar2015
SEB Group Op profit CAGR*
+15%
Op Profit CAGR*
+6% +27%
+11% +40%
Operating income
Operating expenses SEK bn
9 *CAGR on Operating Profit Avg Q 2010-Q1 2015
Op Profit CAGR*
Op Profit CAGR*
Op Profit CAGR*
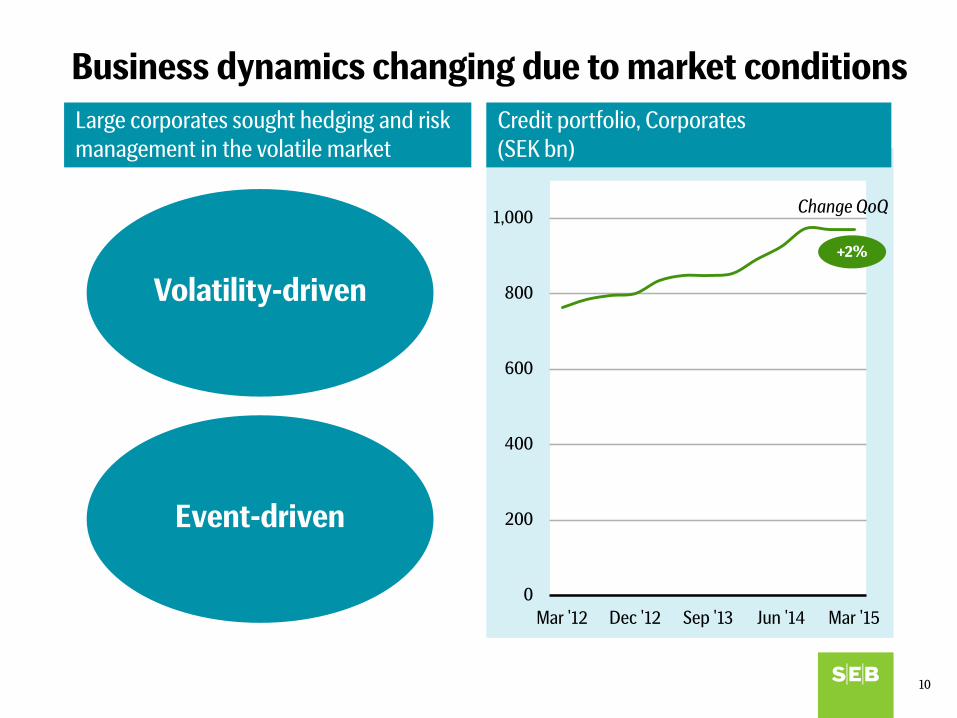
Business dynamics changing due to market conditions
10
Large corporates sought hedging and risk management in the volatile market
Credit portfolio, Corporates (SEK bn)
0
200
400
600
800
1,000
Mar '12 Dec '12 Sep '13 Jun '14 Mar '15
+2%
Change QoQ
Event-driven
Volatility-driven
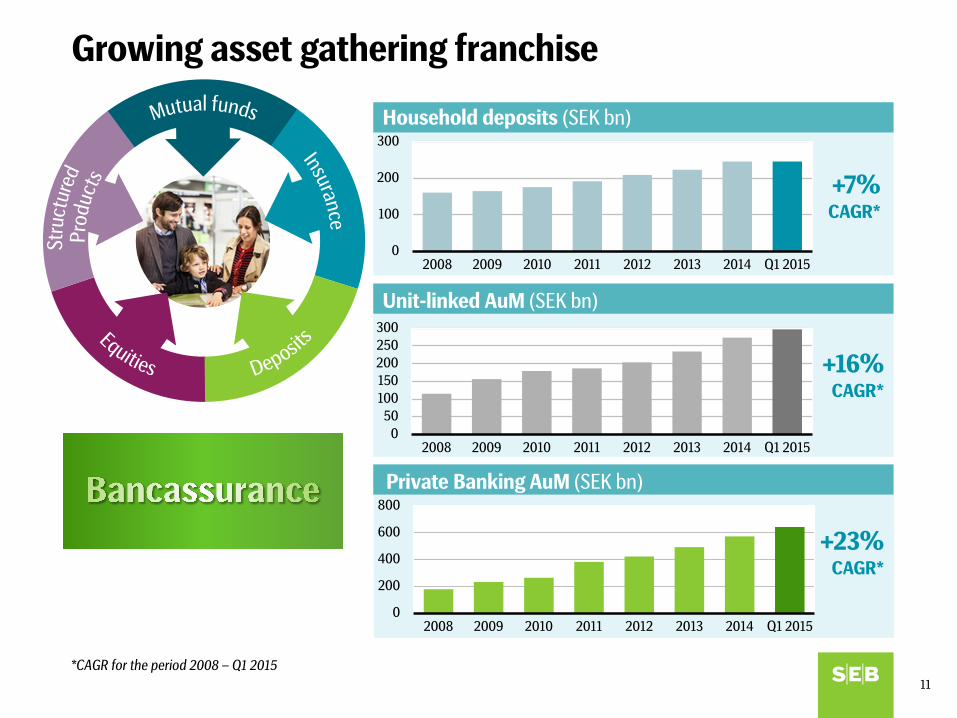
Growing asset gathering franchise
11
050
100150200250300
2008 2009 2010 2011 2012 2013 2014 Q1 2015
Unit-linked AuM (SEK bn)
+16% CAGR*
Private Banking AuM (SEK bn)
0
200
400
600
800
2008 2009 2010 2011 2012 2013 2014 Q1 2015
+23% CAGR*
Household deposits (SEK bn)
+7% CAGR*
0
100
200
300
2008 2009 2010 2011 2012 2013 2014 Q1 2015
*CAGR for the period 2008 – Q1 2015

Retail Sweden Corporates – low lending demand
12
Active full-service customers (thousands)
Corporate lending portfolio (SEK bn)
91
169
2010 2011 2012 2013 2014 Q1-15
106
153
2010 2011 2012 2013 2014 Q1-15

Retail Sweden – Mortgages and digitalisation
13
Mortgage lending(SEK bn)
272
407
2010 2011 2012 2013 2014 Q1-15
Amortisation of new mortgage lending Loan-to-value > 70%
60% 91%
”Before” ”Today”

Continued resilience and flexibility
14
Net credit loss level 0.05%
NPL coverage ratio 55%
CET1 16.6%
LCR 124%
Liquidity resources ~25%
Ass
et Q
ualit
y Li
quid
ity
Cap
ital
RoE 13.8%

Going forward
15
Continued disciplined execution
Resilience and long-term perspective in challenging economic climate
Focus on customer relationships