sebi penetration of mutual funds in india
TRANSCRIPT

8/12/2019 SEBI Penetration of Mutual Funds in India
http://slidepdf.com/reader/full/sebi-penetration-of-mutual-funds-in-india 1/62
1
Penetration of Mutual Funds in India:
Opportunities and Challenges
Rajesh
Chakrabarti *
Sarat
Malik
Sudhakar
Khairnar
Aadhaar
Verma
Abstract
We carry out a preliminary enquiry into the nature
of geographical penetration and distribution ofmutual funds in India as well as their likely
determinants. Using a questionnaire survey we
collect qualitative and quantitative evidence from
fund managers on the nature and determinants of
their geographical presence throughout the
country. Distribution channels seem to play a
major role in fund penetration and facilitating
these rather than trying to boost demand through
financial literacy may be a more effective way of
achieving better fund penetration.
-------------------
* The authors are respectively, as follows: Exec utive Direc tor, Bharti
Institute of Public Policy and Clinica l Assoc iate Professor, Indian School
of Business, Mohali, India; Joint Direc tor, Department of Economic and
Policy Analysis, Securities and Exchange Board of India, Mumbai;Assistant Director, Department of Economic and Policy Analysis,
Securities and Exchange Board of India, Mumbai, India; Research
Associate, Bharti Institute of Public Policy, Indian School of Business. We
are thankful to Avijeet Boparai, Manasa Gopal, and Tathagatha Biswas
for their useful comments and assistance throughout the writing of this
paper. The authors alone are responsible for errors, if any. Opinions
expressed here are strictly personal and do not reflect the opinions of
the organizations the authors are associated with.

8/12/2019 SEBI Penetration of Mutual Funds in India
http://slidepdf.com/reader/full/sebi-penetration-of-mutual-funds-in-india 2/62
2
Contents
List of Abbreviations Used ............................................................................................... 3
1
Executive
Summary ..................................................................................................... 4
2 Introduction................................................................................................................. 5
3 Literature Survey ......................................................................................................... 8
4 The Mutual Fund Industry in India: Opportunities and Challenges ...........................15
Financial literacy and investment practices........................................ 19
Distributional efficiency and number of agents ................................. 21
5 Data Collection, Methodology and Descriptive Statistics .......................................... 24
Methodology ................................................................................................ 25
District Domestic Product and AUM/GDP distribution....................... 26
Independent Financial Agent distribution by District GDP .............. 29
AUM per Agent............................................................................................. 30
Distributional efficiency of Fund Houses................................................ 31
Growth in AUM since FY2011.................................................................... 33
6 Statistical Analysis ..................................................................................................... 38
Multivariate Analysis.................................................................................... 41
7
Opinions of
Fund
Managers ......................................................................................45
Investor Awareness...................................................................................... 45
Distribution Channels.................................................................................. 45
Regulatory Framework............................................................................... 47
8 Conclusions and Policy Recommendations............................................................... 51
References.........................................................................................55

8/12/2019 SEBI Penetration of Mutual Funds in India
http://slidepdf.com/reader/full/sebi-penetration-of-mutual-funds-in-india 3/62
List of Abbreviations Used
Abbreviation Full Form
AMC Asset Management Company
AMFI Association of Mutual Funds in IndiaATM Automatic Teller Machine
AUM Assets Under Management
BRICS Brazil, Russia, India, China, South Africa
CAGR Compound Annual Growth Rate
CII Confederation of Indian Industry
ELSS Equity Linked Savings Schemes
GDP Gross Domestic Product
IFA Independent Financial Agent
INR Indian Rupee
KRA KYC Registration Agency
KYC Know Your Customer
LPA Lakhs Per Annum
MFA Mutual Fund Agents
NAV Net Asset Value
NCAER National Council of Applied Economic Research
RBI Reserve Bank of India
RGESS Rajiv Gandhi Equity Savings Scheme
RMSE Root Mean Squared Error
SEBI Securities Exchange Board of India
SEP Systematic Withdrawal Plan
SIP Systematic Investment Plan
T-15 Cities
The top 15 cities identified by AMFI as major investment
hubs. Cities include Mumbai (including Thane & Navi
Mumbai), Delhi (including NCR), Bangalore, Kolkata,
Chennai, Pune, Ahmedabad, Hyderabad, Baroda,
Panjim, J aipur, Lucknow, Surat, Kanpur and C handigarhUSB Ultra Small Branch

8/12/2019 SEBI Penetration of Mutual Funds in India
http://slidepdf.com/reader/full/sebi-penetration-of-mutual-funds-in-india 4/62
4
1 Executive Summary
1. The Indian mutual fund industry is one of the fastest growing and most
competitive segments of the financial sec tor. As of August 2013, the total
AUM stood at Rs. 7.66 trillion. However, growth rates of AMCs have come
down from the peak levels seen in the early 2000s. One of the biggest
reasons behind this is the lack of healthy participation from a large part of
the country.
2. This lack of penetration can be due to two reasons:
a.
Low demand of mutual funds from the public outside the major (T-15)cities. This low demand in turn could be caused by low levels of
financial literacy, cultural attitudes towards savings and investments
etc.
b. Low supply of mutual funds from AMCs outside the major cities. The low
supply could be due to perceived lack of demand from the general
retail investor or due to lack of available manpower in these areas.
3. The study first documents how Assets under Management (AUM) areunevenly distributed across the country and then proceed to scrutinize the
reasons behind this uneven penetration. It focuses on the AMCs distribution
networks using proxies such as the distribution of independent financial
agents (IFAs) across the country, sales made by IFAs, distributional
efficiency of AMCs etc.
4. A survey of fund houses was carried out to gain a better understanding of
the causes holding them back from expanding beyond T-15 cities.5. The study found that low number of agents (per capita) in sub-urban and
rural areas and the slow growth rates in mutual fund sales in the
corresponding areas are closely associated with each other.

8/12/2019 SEBI Penetration of Mutual Funds in India
http://slidepdf.com/reader/full/sebi-penetration-of-mutual-funds-in-india 5/62
5
2 Introduction
Although a large number of studies have been carried out on the growth and
financial performance of mutual funds in India (Boston Analytics, 2010), (PWC,
2013), not much light has been shed on the causes for the low penetration of
mutual funds outside the top fifteen cities. There is research looking at the causes
for the variation of mutual funds industry across developed countries. However,
such work typically does not differentiate between the various regions of the
nations included (Khorana et al., 2005). While such studies may help policymakers
in determining the ideal inter-regional macroeconomic conditions to develop a
healthy mutual fund industry, they rarely explain the differences in mutual fund
penetration within a country.
It is well known that mutual funds offer their investors benefits difficult to obtain
through other investment vehicles. Benefits such as diversification, access to
equity and debt markets at low transaction costs and liquidity are some such
advantages. Given these benefits, one would imagine that Indian households,
characterized with gross domestic savings of close to 28% of the total GDP (World
Bank, 2012), one of the highest in the world, would flock to invest their savings in
mutual funds. However, a recent report (PWC, 2013) points out that the
distribution of assets under management (AUM) across cities is highly skewed in
favor of the top fifteen (T-15) cities of India. The T-15 cities contribute to 87% of the
entire AUM in the country. Even within the T-15 cities, the top five cities (Mumbai,
Delhi, Chennai, Kolkata and Bangalore) contribute 85% of the entire AUM at the T-
15 level i.e. 74% of the entire AUM in the country (PWC, 2013).
It is important to inquire into the causes of this skewed investor participation rate.
There are several fac tors which could possibly explain this variation. Cross-country
studies have pointed out that laws, regulations and governance, supply side

8/12/2019 SEBI Penetration of Mutual Funds in India
http://slidepdf.com/reader/full/sebi-penetration-of-mutual-funds-in-india 6/62
6
factors, demand side factors and technological issues could all affect the size of
mutual industry in a given country (Khorana et a l. 2005). Some of these factors
such as laws and regulations are not applicable to our study since they are
uniform ac ross India and do not vary from one state to another. The factors that
we focus in our study are therefore mainly supply and demand side factors.
Our study divides the supply side i.e. delivery mechanisms into three alternative
channels: independent financial advisors (IFAs), banks and in-house distributors.
We focus on these delivery channels used by Indian mutual fund houses. To begin
with, we document relationships between demographic and economic variables
on one hand and mutual fund penetration on the other to discern the underlying
factors which could help explain the success of a mutual fund in a given part of
the country. We do this using data collected from all the mutual funds
aggregated at district levels and by observing time-series data.
We next survey Indian mutual fund houses to identify the regulatory and
distributional challenges that according to them hold them back from increasing
their business in areas which presently have a low number of mutual funds. We
also inquire into human resource problems that could be holding back theirpenetration even if the fund houses did want to increase their presence in the less
developed districts of India.
Our study brings out several interesting results which would be of considerable use
to the fund houses, regulators, financial prac titioners and scholars in general. We
confirm that bulk of the mutual fund sales outside the T-15 cities are c aused by
IFAs. We also find that demographic and social indicators such as adult literacy
and bank penetration are only weakly correlated with mutual fund penetration in
a given area. Areas with the highest mutual fund presence tend to be those
where the proportion of households with more than Rs. 300,000 income and IFA
presence happen to coincide. We also find that IFAs do not usually focus on
those areas which have the highest propensity to invest in mutual funds (as

8/12/2019 SEBI Penetration of Mutual Funds in India
http://slidepdf.com/reader/full/sebi-penetration-of-mutual-funds-in-india 7/62
7
reflected by the districts with the highest proportion of the families earning more
than Rs. 300,000 per annum). This suggests that the present AUM levels can be
increased by several percentage points if IFAs were made to apply their efforts in
the right areas.
The rest of this study is organized in four sections. The next section presents the
opportunities and challenges in investing in mutual funds. The third section
describes the methodology and the source of our data gathered for the study
together with the statistical analysis of the data. The fourth section presents the
responses of the fund houses on what is holding the industry back from increasing
its penetration outside the T-15 cities. The final section of the report presents the
conclusions and suggests direc tions for future studies.

8/12/2019 SEBI Penetration of Mutual Funds in India
http://slidepdf.com/reader/full/sebi-penetration-of-mutual-funds-in-india 8/62
8
3 Literature Survey
While discussing about various channels of distributions (PWC, CII, J une 2013)
points out that Independent Financial Advisors (IFAs) play a crucial role in fund
distribution. They interact with the investors on a regular basis and provide advice
on scheme selection to asset allocation and asset diversification. Thus, they have
the potential to influence the investors' decision and sell the MF products. This
approach has its risks as well. If the IFAs are not empowered with professional
training and education, they run the risk of mis-selling schemes. Without proper
training, it would be difficult for IFAs to explain or convince small town investors
about the advantages of mutual funds over traditional investments like savings
accounts, FDs etc. The AMCs and the regulator need to enhance the financial
literacy across the country through regular programs and campaigns beyond top
15 cities.
Laws, regulation and governance characteristics play an important role in the
development of financial sector. La Porta et al. (1998) examine the role of laws
governing investor protection, transparency of reporting, Insider trading, Taxation,
the quality of enforcement of the laws, potential conflicts of interest between the
fund and the fund investors (Thompson & Choi, 2001) and the ownership
concentration across several countries and their financial development.
Supply side issues, by which we mean the characteristics of the financ ial services
sector, will affect the size of the mutual fund Industry. Issues like bank
concentration (Nicola & Michele, 2001), breadth of the distribution channels,
restrictions from entering securities business (Barth et. al, 2001), ease of entry into
the fund industry like cost of setting up a new fund, time required to set up a new
fund and presence of government supported competitive financial products are
noted in the literature for their contribution to the growth of the industry.

8/12/2019 SEBI Penetration of Mutual Funds in India
http://slidepdf.com/reader/full/sebi-penetration-of-mutual-funds-in-india 9/62
9
Several demand side fac tors can be used to explain the size and diversification of
mutual fund industry in a country. Some of these factors include education,
literacy, presence of information sources, industry age etc. At the same time,
there are some trading characteristics like transparency and transaction costs
(Chiyachantana et. al, 2004) which also can be used to determine some of the
characteristics of the mutual fund industry.
Barber et al., 2005 argue that the purchase decisions of mutual fund investors are
influenced by salient, attention-grabbing information. Investors are more sensitive
to salient in-your-face fees, like front-end loads and commissions, than operating
expenses; they are likely to buy funds that attract their attention through
exceptional performance, marketing, or advertising. They found consistently
negative relations between fund flows and front-end load fees. A negative
relation between fund flows and commissions charged by brokerage firms was
also documented. In contrast, no relation (or a perverse positive relation) was
found between operating expenses and fund flows. Additional analyses indicate
that mutual fund marketing and advertising, the costs of which are often
embedded in a fund’s operating expenses, account for this surprising result.
Müller & Weber, 2010 investigate the consequences of financial literacy in the
context of mutual fund investments. They found that the level of financial literacy
is not related to the performance of the actively managed funds. In contrast,
overconfidence might prevent subjects from investing passively. A positive
relation was found between the belief of being better than average in identifying
superior investments and the likelihood of buying an active fund, thus confirming
this notion. Also, better-than-average thinking is positively correlated with financial
expertise.
Massa et al., 1999 identify a set of systematic factors that explain a significant
amount of the variation in flows. They examined common component to mutual

8/12/2019 SEBI Penetration of Mutual Funds in India
http://slidepdf.com/reader/full/sebi-penetration-of-mutual-funds-in-india 10/62
10
fund investor behaviour and tried to find out which asset classes may be
regarded as economic substitutes by the participants in the market for mutual
fund shares. They found that flows into equity funds, both domestic and
international, are negatively correlated to flows to money market funds and
precious metals funds. This suggests that investor rebalancing between cash and
equity explains a significant amount of trade in mutual fund shares. The negative
correlation of equities to metals suggests that this timing is not simply due to
liquidity concerns, but rather to sentiment about the equity premium. This paper
also finds that the factors derived from flows alone explain as much as 45 per cent
of the cross-sec tional variation in mutual fund returns.
There has been a debate in the mutual fund industry that the abolition of entry
load has reduced the incentives for the distributors to go after new clients. The
restriction of entry load on existing and new mutual funds in 2009 affected the
functioning of the mutual fund industry and leading fund houses and distributors
had to restructure their business and operating models in order to arrive at a
profitable solution. However, researchers (Anagol & Kim, 2012) who have
examined the claim that abolition of entry loads had hampered the penetrationof mutual funds have found no evidence behind such claims.
A study by Anagol et al. (2013), evaluated a major Indian investor protection
reform that reduced commissions tied to mutual fund sales by banning the
distribution fees that mutual funds had previously earmarked for commissions.
They identified the policy impact by comparing funds charging high versus low
distribution fees pre-reform. The researchers argued that contrary to industry
claims that limiting commissions would dramatically reduce mutual fund
investment; there was no evidence that the reform reduced asset growth in
mutual funds.

8/12/2019 SEBI Penetration of Mutual Funds in India
http://slidepdf.com/reader/full/sebi-penetration-of-mutual-funds-in-india 11/62
11
Apart from the macro economic factors the anecdotal evidence says that Indian
Mutual fund Industry is incapacitated by the lack of proper distribution channels1,
entry loads, investor awareness, governance and risk management, technology
and low retail participations2.
Zechner et al., 2011 study the interface between intermediaries and portfolio
managers (including mutual funds) and investors. There are often multiple
financial advisors between portfolio managers and investors. Portfolio managers
pay significant “kickbacks” to compensate advisors for price discrimination or
marketing. Kickback payments increase portfolio manager fees and reduce
returns. Portfolio manager competition reduces kickbacks, but increases
independent advisory services. The study focuses on financial intermediaries as
distinct agents and the economic roles they play. Their analysis of financial
intermediation also provides six major findings:
1. Financial advisers facilitate small investor use of actively managed funds by
minimizing information search costs. With rational investors and competitive
advisors, fund management fees are reduced. Advisers that do not receive
kickbacks increase investor welfare.2. Mutual funds make widespread use of kickbacks to compensate financial
advisors. With sophisticated investors, fund kickbacks subsidize advice costs
for smaller investors. With unsophisticated investors, kickbacks support
aggressive advisor marketing. When advisors receive fund kickbacks,
investors use additional advisory services.
3. Mutual fund payments of kickbacks are associated with higher
management fees and lower fund performance. When investors aresophisticated, kickbacks affect only high net worth investors. When investors
are unsophisticated, all investors are negatively impacted.
1 Distribution Spectrum and the changing Business Environment: Indian Mutual Fund Industry (PWC, 2011).2 Indian Mutual Fund Industry-Towards 2015

8/12/2019 SEBI Penetration of Mutual Funds in India
http://slidepdf.com/reader/full/sebi-penetration-of-mutual-funds-in-india 12/62
12
4. Mutual fund distribution channels impact fund performance. Indirect
channels distribute underperforming funds. Direc t and indirec t channels
distribute actively managed funds with equal or higher performance than
passive funds.
5. Kickbacks are reduced by competition among actively managed funds.
Increasing fund competition generates additional advisory services.
6. Lastly, fund investors would benefit from better disclosure of kickbacks.
Kickbacks should be paid with transparent cash payments, rather than for
spec ific sales related activities.
Khorana et al. find that consistent with related findings from the law and
economics literature, the mutual fund industry is larger in countries with stronger
rules, laws, and regulations, spec ifically where mutual fund investors’ rights are
better protec ted. The industry is smaller in countries where barriers to entry are
higher, measured by the effort required to set up a new fund. The fund industry is
larger in countries with a wealthier and more educated population, and where
the industry itself is older. Finally, the fund industry is larger in countries in which
defined contribution pension plans are more prevalent. These results indicate that
laws and regulation, supply-side, and demand-side factors simultaneously affect
the size of the mutual fund industry.
Investor reaction to mutual fund performance conditions the behavior of mutual
fund managers and fund complexes. It has wide-reaching ramifications for the
trading of assets across the globe. (Keswani & Stolin, 2012) have few observations
using UK data on monthly fund sales and purchases made via seven distinct
distribution channels. Their paper seeks to examine differences in the waydifferent types of investors respond to fund performance information, and in
particular, the extent of non-linearity in their response func tions.
Where mutual fund investments are deployed and how they are managed are
perennial issues that are largely determined by investor reaction to fund

8/12/2019 SEBI Penetration of Mutual Funds in India
http://slidepdf.com/reader/full/sebi-penetration-of-mutual-funds-in-india 13/62
13
performance. Yet the population of investors is heterogeneous and liable to be
influenced by the intermediation process (if any) of their fund purchases and
redemptions. Their investigation shows that the way investors respond to prior fund
performance has a great deal to do with who the investors are and how the fund
is being sold. Although both individuals and institutions buy into funds in a
“convex” manner, that is, they are more influenced by investment performance
when a fund has done well than when it has done poorly, this effect is much more
pronounced for retail investors. Yet among retail investors, too, sharp differences
exist: the flow performance relation is linear and rather flat, for buys made through
fund company affiliated sales force, while it is both steep and strongly convex for
fund purchases that are either un-intermediated, or intermediated byindependent advisors.
Consistent with the notion that investors take more care with making their
investments initially than with monitoring subsequently, the sensitivity of aggregate
outflows to performance is quite a bit lower than that of inflows. Investor outflows
increase at a faster rate when performance declines in the region of below-
average fund performance than they decrease when fund performance
improves in the region of above-average performance. Retail and institutional
investors behave comparably in this regard.
Performance of a mutual fund matters a great deal more while investors decide
whether to invest rather than whether to redeem. Nevertheless, several investor
types behave in an inconsistent manner with respect to the aspects of
performance they consider important. Specifically, independently advised
investors react to the non-alpha portion of performance when buying funds butnot when selling them, while insurance companies do the opposite.
The paper suggests that from the perspective of regulators the best active fund
investors are those who induce the most intense competition for superior
performance among fund managers, i.e. those whose reaction to fund

8/12/2019 SEBI Penetration of Mutual Funds in India
http://slidepdf.com/reader/full/sebi-penetration-of-mutual-funds-in-india 14/62
14
performance is especially strong. At the same time, strong reaction to past
performance tends to be convex, thus inducing excess risk-taking. It also tends to
spill over into sensitivity to non-alpha performance, rewarding active fund
managers for actions unrelated to stock-picking, which is the activity that justifies
active fees in the first place.

8/12/2019 SEBI Penetration of Mutual Funds in India
http://slidepdf.com/reader/full/sebi-penetration-of-mutual-funds-in-india 15/62
15
4 The Mutual Fund Industry in India: Opportunities and
Challenges
The Indian mutual fund industry finds itself in an ec onomic landscape which hasundergone rapid changes over the past three years. The industry achieved a high
water mark when it doubled its AUM from Rs. 3.6 trillion in FY2007 to Rs. 6.13 trillion
in FY2010 – clocking an impressive growth rate of 16.2% per year. Since then the
Indian economy (coupled with the emerging economies) has faced a slowdown
– the most severe of which are happening as this report is being written. From an
average GDP growth rate of 8-9% during the 2008-2011 years, the Indian
economy is now growing at a lackluster 4.8% growth rate in Q2 2013. Coupled
with a steep decline in the value of the Indian rupee, the mutual fund industry
now finds itself in a capricious global economic environment. However, there is
strong reason to believe that the Indian mutual fund industry has not yet seen its
global peak and if proper measures are taken, the industry could get back on its
former growth path.
One of the biggest challenges that the mutual fund industry faces is the lack of
healthy participation from a large part of the country. To illustrate this lack of
participation, we first aggregated the AUMs originating out of each district of
India. We then rank ordered all the districts of India in descending order of their
domestic product (GDP) and then partitioned this list into ten parts. The top 60
districts formed the first decile followed by the second decile and so on. We then
aggregated the AUMs and GDPs for each of these deciles and took the ratio of
these two figures. The AUM/GDP ratio is one of the best indicators of how much of
the yearly income in a given district is being invested into mutual funds.
While the figure of rupees 7.5 trillion of AUM may sound impressive on paper, this
figure is marred by a sharp divide in terms of investment in the first decile of
districts and the rest of the country. Chart 1 on the next page presents this stark
8/12/2019 SEBI Penetration of Mutual Funds in India
http://slidepdf.com/reader/full/sebi-penetration-of-mutual-funds-in-india 16/62
16
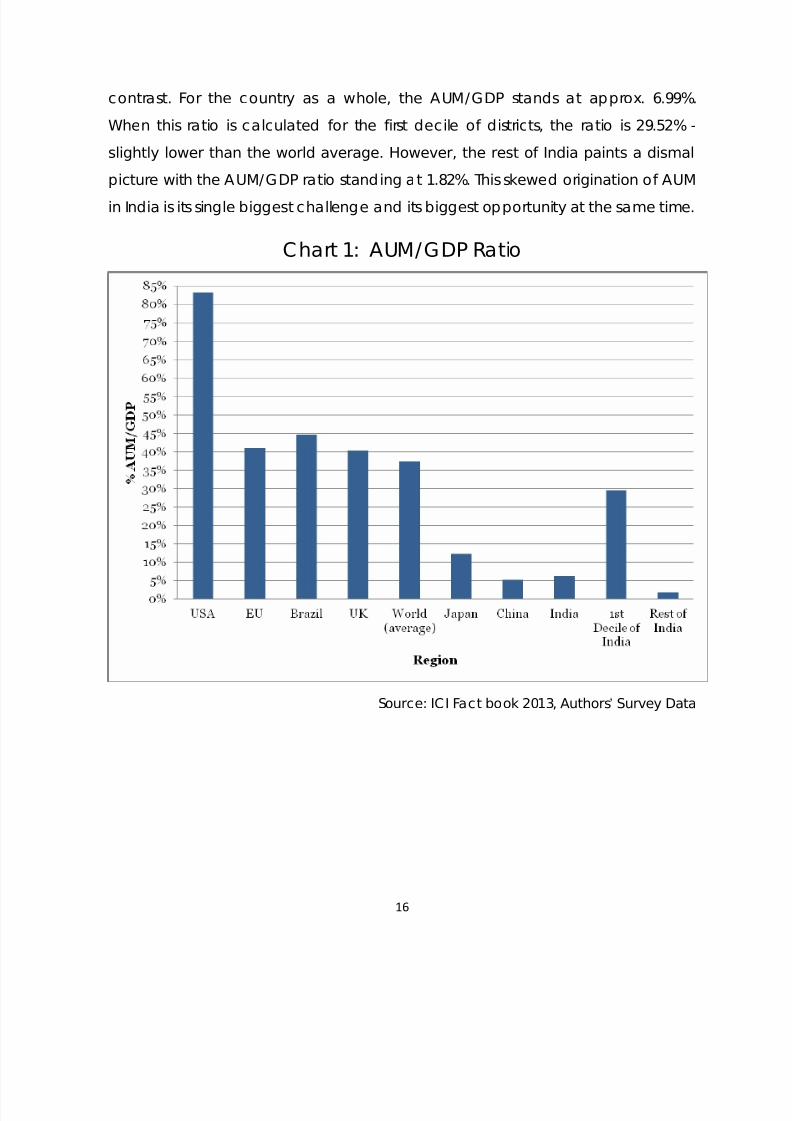
contrast. For the country as a whole, the AUM/GDP stands at approx. 6.99%.
When this ratio is calculated for the first decile of districts, the ratio is 29.52% -
slightly lower than the world average. However, the rest of India paints a dismal
picture with the AUM/GDP ratio standing at 1.82%. This skewed origination of AUM
in India is its single biggest challenge and its biggest opportunity at the same time.
Chart 1: AUM/GDP Ratio
Source: ICI Fact book 2013, Authors’ Survey Data

8/12/2019 SEBI Penetration of Mutual Funds in India
http://slidepdf.com/reader/full/sebi-penetration-of-mutual-funds-in-india 17/62

8/12/2019 SEBI Penetration of Mutual Funds in India
http://slidepdf.com/reader/full/sebi-penetration-of-mutual-funds-in-india 18/62
18
Chart 3: Saving propensity indicators
Source: Demirguc -Kunt & Klapper, 2012
Financial inclusion has for long been a priority for the policy makers in India. The
Reserve Bank of India (RBI) has permitted the banks to use the services of
Business Fac ilitators and Business Correspondents. A roll out of Ultra Small
Branches (USBs) in remote locations is one of the steps being taken in this
direction.
Direct Cash Transfers and linkages with Aadhaar would be a step forward
towards the goal of financial inclusion and may prove beneficial to mutual fund
houses in the long run. With below poverty households finally coming to own
8/12/2019 SEBI Penetration of Mutual Funds in India
http://slidepdf.com/reader/full/sebi-penetration-of-mutual-funds-in-india 19/62
19
bank accounts, fund houses could use pre-existing bank channels to offer
investment opportunities when these people finally start earning saving.
The advantages of having an active participation by retail investors in mutual
fund are not just limited to financial inclusion. It has been shown in past studies
that institutional investors (in the form of mutual funds) ‘herd’ towards small-cap
and mid-cap stock which offer growth prospects thereby increasing the depth
and breadth of capital markets (Wermers, 1999). Institutional buying and selling
of stocks also increases the price-adjustment process in capital markets and
under right conditions institutional investors tend to dec rease stock price
volatility. All these effects are desirables as far as financial markets are
concerned.
Financial literacy and investment practices
One of the major reasons behind the under-penetration of mutual funds is the
lack of understanding about mutual funds, how they differ from ordinary
investments and how they manage to offer superior returns over traditional
investments. According to a report on mutual funds investments published by
Boston Analytics in 2010, approximately a third of all of respondents from Tier II
Indian cities did not know how and where to invest in mutual funds (Boston
Analytics, 2010). Most people remain unaware of basic financial concepts such
reward (return) to variability (risk) ratio, asset allocation, benefits of
diversification, passive-active investment strategies etc.
Most Indian households tend to be extremely risk averse and wary where they
invest their hard earned savings. As a result, they are conservative with theirsavings and tend to invest in ‘safe’ assets. Investors perceive mutual funds as risky
investments (despite the fact that several funds invest in government bonds,
thereby being safer than bank deposits) and tend to invest their savings in
tangible assets such as gold, jewelry, real estate or fixed deposits in banks. These

8/12/2019 SEBI Penetration of Mutual Funds in India
http://slidepdf.com/reader/full/sebi-penetration-of-mutual-funds-in-india 20/62
20
choices are a result of a mindset which has generally seen investing in stock
markets and other market traded securities as akin to gambling. This is reflected
by the proportion of savings of Indian households in the financial markets. The
gross domestic savings and investment at current market price by households
was 22.3% of GDP 2011-12 (RBI Annual Report, 2012). The household investment
in physical and financial assets was 14.3% and 8.0% respec tively. The investment
in shares and debentures as a percentage of gross financial savings by
households was 3.6% during 2011-12. The gross financial savings by household in
mutual funds is estimated at 2.5% out of total 3.1% in shares/debentures.
According to a Max New York Life-NCAER India financial protection survey
carried out in 2008, Indians prefer keeping 65 percent of their savings in liquid
assets like banks, post office deposits or as cash at home, while investing 23
percent in physical investments like real estate and gold. Only 12 percent of the
total savings were invested in financial instruments like mutual funds or stocks
(NCAER Max New York Life, 2008).
The Mutual fund industry offers something for everyone. A large number of
schemes are offered by AMCs and offering are made to suit the investor’s risk
appetite, desired returns or period of investment. As of March 2013, a total of
1294 different mutual fund schemes were on offer ac ross AMCs (SEBI Annual
Report 2012-13). Investors can choose the schemes according to the structure:
Open-ended Funds or Close-ended Funds or by the objective of their
investment: Growth Funds, Income Funds, Balanced Funds or Money Market
Funds.
However, one of the ironies of having a large and established mutual fund
industry is that this variation serves to intimidate rather than inform a small
investor. To begin with, there exist mutual funds which focus exclusively on one
type of asset class and then there are funds which hold securities from different
assets. At the same time, several mutual fund schemes have two to three

8/12/2019 SEBI Penetration of Mutual Funds in India
http://slidepdf.com/reader/full/sebi-penetration-of-mutual-funds-in-india 21/62
21
variations on each fund such as growth, monthly dividend, annual dividend etc.
Besides offering different schemes for investment, AMCs also offer several
investment plans to their customers. Systematic Investment Plans (SIPs),
Systematic Withdrawal Plans (SWPs), Systematic Transfer Plans, Triggers,
Insurance Options and many other plans are designed to give a degree of
control and flexibility to the investor.
While all this is highly beneficial for a well informed investor, all this is highly
intimidating to an investor who is barely financially literate and has little time (or
energy) to do his/her research before buying a fund. Boggled by all this
complexity, the investor routes his savings to lesser complicated fixed deposits
and/or physica l assets (Halan, 2013). Lack of standardization in the processes
and customer service standards creates unnecessary hassles in investing
(Adajania, 2013).
This combination of ignorance, risk-aversion and mutual fund complexity are
huge hurdles that AMCs in India will have to overcome if there is to be any
increase in retail participation in mutual funds. Investors need to be made to
look beyond the traditional avenues of investment through sensitization and
education. In addition to this, campaigns should be tailored to increase the
visibility of debt funds which generally tend to be safer than equity funds.
Distributional efficiency and number of agents
Another challenge that AMCs in India face is increasing the efficiency of their
distributional channels. As we later show in our analysis, distributional efficiency
(defined as the AUM earned for one rupee spent on distribution costs) plummetsbeyond the 4th decile of districts. In other words, attracting new investors in small
cities does not come cheaply for the Asset Management Companies beyond
the top 200 districts by GDP. More money has to be spent on distribution and
marketing for getting investments in poorer districts.

8/12/2019 SEBI Penetration of Mutual Funds in India
http://slidepdf.com/reader/full/sebi-penetration-of-mutual-funds-in-india 22/62
22
However, AMCs tend to play safe and seem unwilling to focus on their
distribution channels outside the T-15 cities. This can be inferred by observing the
geographical spread of their distribution costs. It is seen that 89.75% of all the
distribution costs by AMCs are incurred in the T-15 cities and their corresponding
districts.
In a recent interview, an AMC reported that in the present distribution model, it
takes a typical AMC three years to break even (Kirkire, 2013). This presents a
significant challenge to the expansion of AMCs since they are judged on an
annual basis. Thus, even if an AMC did want to expand into several towns at
once, the paybacks would be so far away in the future that only the least risk-
averse managers would go ahead with such expansions.
As of March, 2013, the total number of ARN (AMFI Registration Number) holders
registered with AMFI stood at approximately 52,000. Of these, 48,000 are
individual ARN holders and 4000 are corporate ARN holders. While these
numbers may sound substantial, it should be noted that the number of active
distributors are just 18% of the total reported figures. Besides these,
approximately 38,000 corporate employees registered with AMFI under
corporate ARN holders (Association of Mutual Funds in India, 2013).
Furthermore, considering insurance sector’s 2.5 million agents, the number of
active mutual fund agents is a big hurdle for penetration and expansion of
AMCs outside of T-15 cities. If the reach has to be increased to Tier II and Tier III
cities, the distribution network needs to be overhauled and innovative incentive
structures need to be adopted.
Over here, it is worth comparing the incentive structures in place for mutual fund
agents and those of other commission based products such as insurance.
Insurance agents can earn up to 35% commission on the premium for the

8/12/2019 SEBI Penetration of Mutual Funds in India
http://slidepdf.com/reader/full/sebi-penetration-of-mutual-funds-in-india 23/62
23
signing up of a new customer3. Insurance c ompanies with less than ten years of
business operations offer up to 40% of the premium as commission. The
corresponding commissions offered to agents bringing in new mutual fund sales
ranges from 0.2-0.8% for debt fund to 1-4.5% for ELSS funds. This disparity
continues into years subsequent to the sale of the two financial products. For
insurance products, the commissions decline to 7.5% for second and third years
and 5% to the rest of the life of insurance product. Mutual fund companies on
the other hand offer a “trail commission” ranging from 0.5-1.0% on the AUM. This
commission is typically taken out from the investors’ AUM. This would have two
impacts on the sale of mutual funds. Firstly, if the mutual fund purchased by an
investor performs poorly (as compared to the index), the investor would not just
have a poorly performing investment but also have an additional expenditure to
be paid to the mutual fund agent. Secondly, an agent who works in an area
characterized with low AUMs will not be able to sustain an income by the trail
commission alone. These two factors combined could further depress the sale of
mutual fund sales.
However, the biggest question remains unresolved. What causes the AMCs to
invest less outside the T-15 cities? Is it bec ause of an inefficient distribution
network? Or is it because of lack of demand from areas outside T-15 cities? In
the following section, we try to answer this conundrum by looking at the data
we have collected through multiple angles. We report on where most growth in
AUM is taking place, the distributional efficiencies of AMCs outside T-15 cities
and what are the factors which influence growth of AMCs in a particular area.
3 http://www.basunivesh.com/2013/06/14/life-insurance-vs-mutual-fund-agents-who-earns-more/

8/12/2019 SEBI Penetration of Mutual Funds in India
http://slidepdf.com/reader/full/sebi-penetration-of-mutual-funds-in-india 24/62
24
5 Data Collec tion, Methodology and Descriptive Statistics
Data Collection Procedure and Survey Details
In conjunction with SEBI, we asked all the fund houses currently operating in
India to provide details about their operations throughout India through a
survey. The survey was designed in a manner to gain a better understanding of
the operational details of AMCs at both macro and micro levels.
At a macro level, the survey asked the AMC s to provide the total number of
folios and assets under management at a country level on the last date of the
fiscal year since 2010. The AMCs were also requested to provide a breakup of
their folios at a retail and non-retail level. The AMCs were also asked to provide
the distribution, commission and advertisement costs and total number of
schemes in operation at the end of each fiscal year since 2011.
To gain a better understanding of the geographical reach of the AMCs, we
asked the AMCs to provide all the c ities/towns in which they had at least one
office and the number of years since the AMC s were present in that city/town.However, since a large number of mutual fund sales happen outside dedicated
mutual fund offices (through independent financial agents), we asked AMCs to
also report on the number of folios and assets under management at a
city/town/village level as of the end of fiscal year since 2011.
We c lassified the distribution and delivery channels of mutual funds in three
categories: distributors, banks and independent financial agents. We asked
AMCs to provide details of the number of agents they employed at each level
and the amount of money spent on marketing and distributions costs at a
city/town level as of 31st March 2013.

8/12/2019 SEBI Penetration of Mutual Funds in India
http://slidepdf.com/reader/full/sebi-penetration-of-mutual-funds-in-india 25/62
25
We then asked AMCs to provide their opinions and views on a range of issues
such as financial literacy, availability of fresh talent for recruitment, regulatory
framework, distributional efficiencies etc. The AMCs were asked to score each
of these questions based on five-point Likert scale in which scores ranged from a
“strongly agree” to “strongly disagree”. Lastly, we asked AMCs to rank order
factors which effect penetration from the “least important” to the “most
important” factor.
To the best of our knowledge, this is the first study which takes distribution costs
and sales into account at the city/town level. Taken as a whole, the availability
of the data at this level revealed some interesting insights about AMCs’
operations – espec ially their operations outside the major cities. The actual
survey instrument is included at the end of this paper as Appendix A.
Methodology
Unlike previous studies which have largely used cities as their primary units of
analysis, it was decided the best results could be obtained only if the data was
aggregated at the district level. The reasons behind this were two-fold.
The main reason was that, the survey data revealed the operations of AMCs
extended well beyond Tier I and II cities. While it is true that the scale of AMCs’
operations in the large cities of India dwarfs their operations in the smaller cities,
it is worth noting that taken as a whole AMCs are present all across India. The
smallest town to have at least one independent financial agent was the town of
Singtam in East Sikkim with a population of just 5431. In our data, we found that
through their independent financial agents and bank agents, AMCs haveextant operations in well over 1,500 towns and cities.
In this regard, the distribution networks of AMCs are far wider and
comprehensive than is often perceived. However, performing an analysis on
such a large number of towns becomes unwieldy and is often accompanied

8/12/2019 SEBI Penetration of Mutual Funds in India
http://slidepdf.com/reader/full/sebi-penetration-of-mutual-funds-in-india 26/62
26
with a lot of noise. Many towns which are close to large cities (e.g. towns
located in between Indore and Ujjain (which are located just 50 kilometers from
each other) benefit from having two large cities thereby having much larger
fund representation than they otherwise would have had they not been in
between the c ities) become outliers which make the results difficult to interpret.
By aggregating all the towns and cities into their respec tive districts, the
information becomes far easier to understand.
The second reason was purely statistical. Municipal and city level data in India
are hard to come across. While the census results reveal a lot of demographic
information at the district level, the same is not true for city level results. Factors
such as literacy levels, SEC level classification, GDP levels etc. are not easily
available or reliable at a micro level. Often, when the data is available, it is ill-
suited to be used for statistical uses. For these reasons, we decided to take
districts as our unit of analysis.
District Domestic Product and AUM/GDP distribution
One of the most common metric to capture the penetration of mutual funds in
a given country or area is to find the AUM/GDP ratio. This ratio captures the
amount of wealth invested in mutual funds to the earnings of a given region.
It is well known that the geographical distribution of AUMs in India is heavily
lopsided in favor of the large cities. The recent report by C II-PWC highlights this
by pointing out that 74% of the AUMs originate in the top five cities with another
14% originating from the next ten cities. In other words, the top fifteen cities
contribute an astonishing 88% of the entire mutual fund market (PWC, CII, J une2013).
Before calculating the AUM/GDP distribution, all the districts of India were
ranked in the descending order of their respec tive domestic products. This list
was then split into ten equal groups (i.e. we took dec iles) and then each decile’s

8/12/2019 SEBI Penetration of Mutual Funds in India
http://slidepdf.com/reader/full/sebi-penetration-of-mutual-funds-in-india 27/62
27
contribution to the nation’s gross domestic product was calculated. The resulting
distribution is depicted by the vertical blue bars in Chart 4 below.
Chart 4: Contribution to GDP by Decile
Source: Authors’ Survey Data
As shown, the top 60 districts of the nation contribute a net of 41% to the
country’s GDP. The last four deciles (i.e. 240 districts) contribute to just 12% to the
nation’s economy. We then repeated this process for the same list, only this time
– AUMs were taken. The same sixty districts (contributing 41% to the GDP)
contribute over 90% to the total AUMs of the nation. The c ontribution of the next
sixty districts (i.e. the 2nd dec ile) is just 4% and proceeds to fall off rapidly for the
remaining districts.
The AUM/GDP ratio of the districts using the same distribution was then
calculated using the same method. While the first decile has an AUM/GDP ratio
of 29.53% - this ratio is comparable to developed economics like the UK (40%)

8/12/2019 SEBI Penetration of Mutual Funds in India
http://slidepdf.com/reader/full/sebi-penetration-of-mutual-funds-in-india 28/62
28
and EU member nations (41%). The corresponding AUM/GDP ratio for the
second decile is 2.82%. Starting from the fifth dec ile, AUM comprises less than 1%
of the district GDP. The exac t measures are given in Table I.
Table 1: AUM/GDP ratio across Indian districts
Region AUM/GDP
Mumbai 126.10%
1st Decile 29.53%
1st Dec ile Exc lud ing Mumbai city 12.67%
2nd Decile 2.82%
3rd Decile 3.72%
4th Decile 1.89%
5th to 10th Decile less than 1.00%
However, one thing to note in the above analysis is that Mumbai is the elephant
in the room. Mumbai alone contributes a staggering 58.25% to the entire
nation’s AUM. To put it an a lternate way: For every 5 rupees invested in a mutual
fund, 3 rupees of that investment originates in Mumbai. Mumbai’s AUM/GDP
ratio is 126.09% which indicates that money from outside Mumbai is coming to
be invested there. So, it should be kept in mind that any category/decile/state
etc. which includes Mumbai as one of its components will get a boost in its
measure. It should also be kept in mind that approximately 80% of the AUMs
invested in Mumbai are institutional or non-retail in nature. Such large non-retail
participation is justified considering that almost all large companies’
headquarters and financial operations are conducted out of Mumbai.
The inclusion of such high aberrational figures would lead to misleading results
and interpretations if one does not exclude them from the analysis. Therefore,
going forward we report the first decile of districts two times – once including
Mumbai and another time excluding it. If one excludes Mumbai from the first
8/12/2019 SEBI Penetration of Mutual Funds in India
http://slidepdf.com/reader/full/sebi-penetration-of-mutual-funds-in-india 29/62
29
dec ile of districts, the AUM/GDP ratio drops to 12.67% - a figure comparable to
J apan’s AUM/GDP ratio (12.4%).
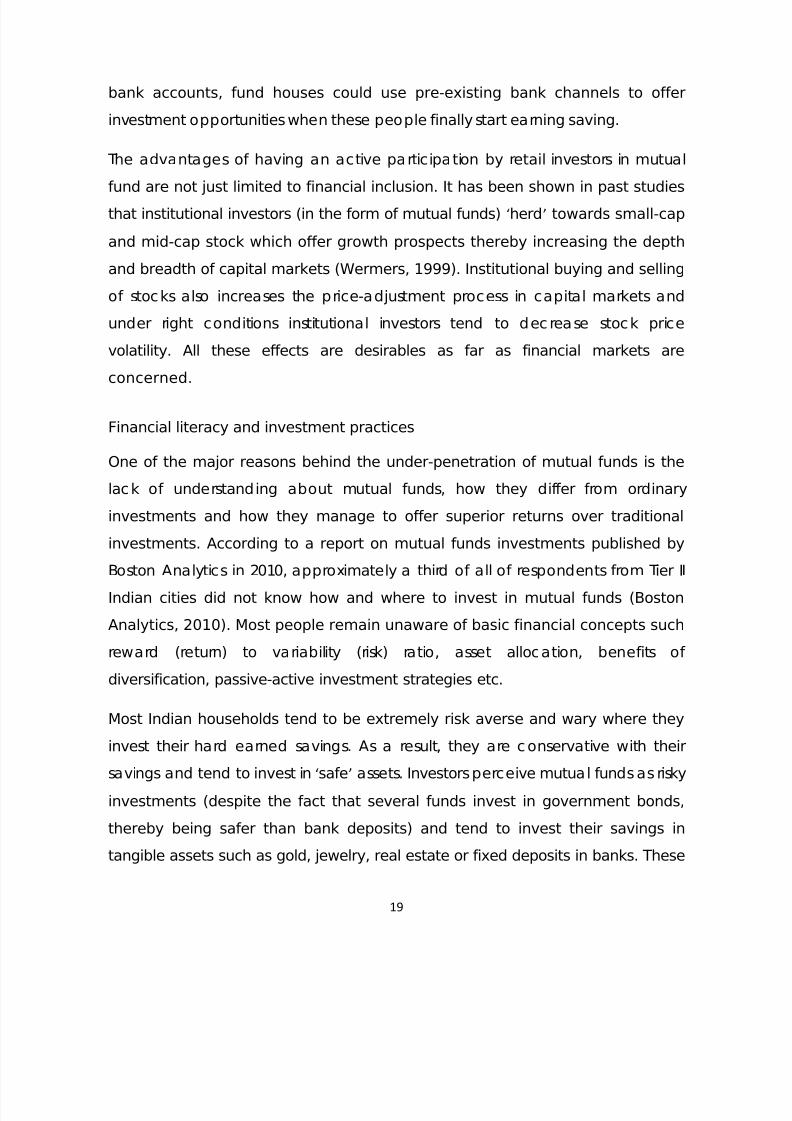
Independent Financial Agent distribution by District GDP
The above results raised the question to why there would be such a skewed
distribution of AUM distribution across the country. To shed more light on this, we
recalled from the PWC-CII study that Independent Financial Advisors (IFAs) play
a crucial role in fund distribution and sales. We therefore wished to find out how
agents are geographically distributed across the country. We first sorted the
districts into deciles in the same manner described above. The number of
agents working in each district was then calculated and aggregated into each
dec ile. The results are presented in Chart 5.
Chart 5: IFA by District GDP
Source: Authors’ Survey Data
Approximately, 75% of all the agents (independent and bank) are located in
20% of country’s districts. While the geographical distribution of IFAs is clearly

8/12/2019 SEBI Penetration of Mutual Funds in India
http://slidepdf.com/reader/full/sebi-penetration-of-mutual-funds-in-india 30/62
30
skewed in favor of the first decile, the level of skew is not to the extent it was in
AUM origination where the top 5 cities were contributing to 74% of the total
AUMs in the country.
At the same time, it is worth noting that the ratio of the agents is not
commensurate with the GDP distribution – the bottom 50% of districts contribute
17% to the nation’s GDP but have only 4% of all the agents in the c ountry. Even if
people in these districts would like invest their savings into mutual funds, they
would be hard pressed to find agents or distributors who would be willing to sell
them these investment products.
AUM per Agent
We then decided to see how agents are performing across these districts. To do
this, we decided to examine the AUM generated by each agent across all
districts. We again ranked and partitioned the districts as mentioned above and
computed the average AUM generated by each agent.
Chart 6: AUM/Agent (in Million Rupees)

8/12/2019 SEBI Penetration of Mutual Funds in India
http://slidepdf.com/reader/full/sebi-penetration-of-mutual-funds-in-india 31/62
31
Source: Authors’ Survey Data
As can be seen, the top 50 districts of the nation clearly dominate the rest of
India as far AUM generation is concerned. Even if we were to exclude Mumbai
from the first decile, the AUM generation potential still dominated the remaining
districts of India. However, there is another implication that can be drawn from
the above graph. If the average AUM generated is significantly higher in a
particular area (as it is here), it is expected that agents would tend to
congregate in those areas where they can achieve maximum sales. Thus, the
geographical reach of mutual fund agents is more likely to be explained by the
potential revenue or AUM generation of each district. So, even if mutual fund
houses (or the regulator) push agents into districts other than the first decile, they
are most likely to meet stiff resistance from the agents due to low potential sales
in that region.
Looking at the above results, it is clear that the top 50 districts of the country
receive a disproportionate amount of attention by AMCs and agents.
Distributional efficiency of Fund Houses
However, such overcrowding could have some other consequences. By having
such a large presence in just one location could lead to inefficiencies. We
decided to test this out by examining the distribution efficiencies of the fund
houses. Specifically, we asked how much does one rupee spent on distribution
earn in AUM.

8/12/2019 SEBI Penetration of Mutual Funds in India
http://slidepdf.com/reader/full/sebi-penetration-of-mutual-funds-in-india 32/62
32
Chart 7: AUM generated per rupee spent on distribution (by IFAs)
Source: Authors’ Survey Data
The above graph throws an interesting insight for fund houses: while it may be
true that the potential earnings for 90% of the districts are a fraction of the top
decile, the 2nd to 4th decile district offer more “bang for the buck” as far as
distribution costs are concerned. Spending one rupee in a top decile district
would earn a fund house an average of Rs. 270 in AUM. Spending the same
amount in the 2rd decile will earn an average of Rs. 355 in AUM. In other words,
due to the untapped potential of these districts, distribution networks in this
decile are 31.5% more efficient than the top decile. The corresponding figures
for the 3th and 4th deciles are 21.3% and 12.3% respectively.
8/12/2019 SEBI Penetration of Mutual Funds in India
http://slidepdf.com/reader/full/sebi-penetration-of-mutual-funds-in-india 33/62
33
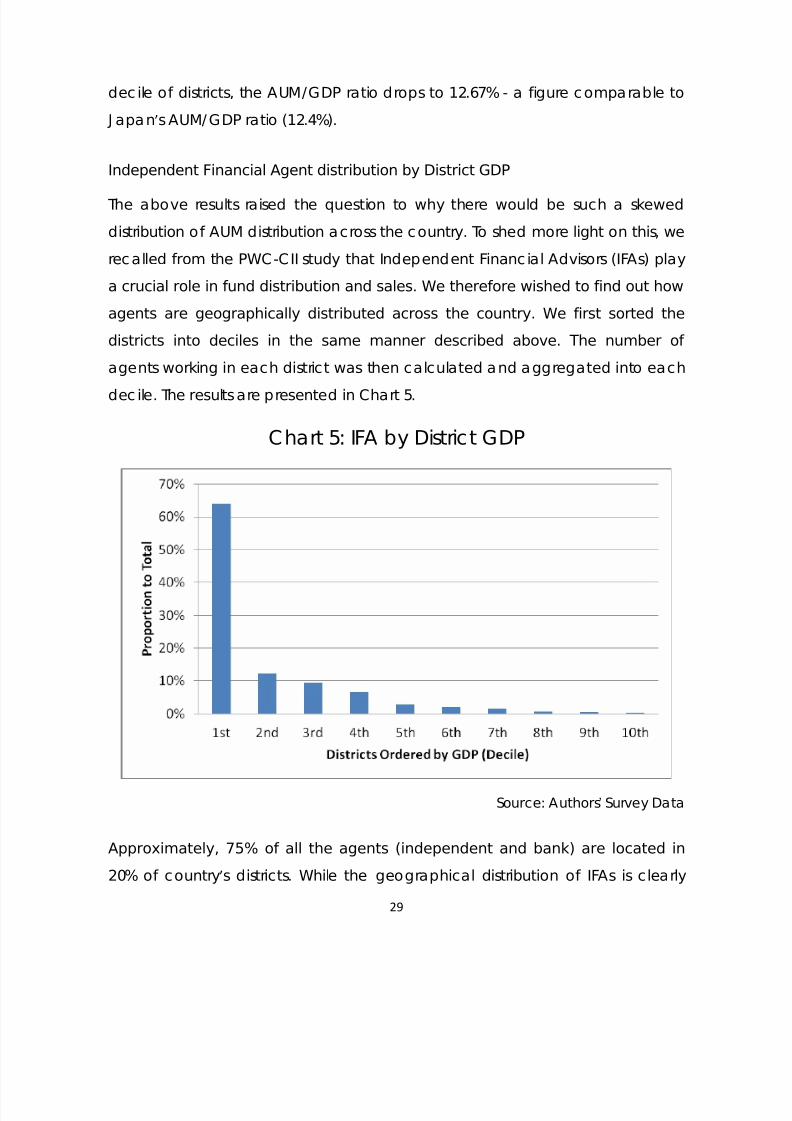
Growth in AUM since FY2011
We then wanted to examine the growth of assets under management for
individual districts and how they have grown over the last two years. Two areas
where we had expected growth to occur was Bihar and Gujarat given the higheconomic growth that these two states have experienced over the past 5-10
years. We calculated the growth of AUMs in these two states along with other
states which typically lag the national averages – Rajasthan, Uttar Pradesh,
J harkhand, Madhya Pradesh and Odisha. We computed the CAGR for these
states two times – once for the overall state and once after taking out the state
capital (this is because capital district would tend to crowd out the AUM growth
in the other districts in the state). The results for the states are given below:
Table 2: Growth Rates of AUM of select states
State Growth Rate
Bihar 5.54%
Bihar exc luding Patna district 24.64%
J harkhand 6.47%
J harkhand exc luding Ranchi district 4.14%Madhya Pradesh 2.79%
Madhya Pradesh exc luding Bhopal & Indore districts 8.11%
Odihsa 11.92%
Odihsa exc lud ing Bhubaneswar (Khurdha) district 3.97%
Rajasthan 6.77%
Rajasthan exc luding J aipur district 4.22%
Uttar Pradesh 7.01%
Uttar Pradesh exc luding Lucknow district 7.53%
Gujarat 8.61%
Gujarat excluding Ahmedabad district 1.87%

8/12/2019 SEBI Penetration of Mutual Funds in India
http://slidepdf.com/reader/full/sebi-penetration-of-mutual-funds-in-india 34/62
34
With the exception of Odihsa, all the states – including Gujarat – lag behind the
country average of 9.88%. However, the growth rate for some states – notably
Madhya Pradesh and Bihar – improves once the capital districts are taken out.
We remove the capital districts because their AUM levels which are often 10-20
times the AUM levels in smaller districts. If the capital districts are taken out,
smaller districts tend to outperform their larger counterparts is because the AUM
levels in these districts is so low that even a small addition in AUM leads to a
large percentage change in growth. Gujarat and Odihsa are standout states
where the bulk of the AUM growth is coming from their capital districts. Whether
this is due to economic factors or logistical is covered in a separate section of
the report.
We then proceeded to map the growth rate of all the districts of India as given
in Map 1A. Our findings suggest that the maximum growth is happening in areas
with the least AMC presence. Most of the places with the maximum growth (75%
and above) is happening in parts of Central India, Haryana, Himachal Pradesh
and Bihar. A comprehensive list of the fastest and slowest growing states is given
in Table 3.
Table 3: Fastest and Slowest Growing States
Slowest Growth Fastest Growth
State Name Growth Rate State Name Growth Rate
Arunachal
Pradesh -18.13% Sikkim 139.95%
Puducherry -7.83% Manipur 94.48%
Madhya Pradesh 2.79% Himachal Pradesh 36.02%
Andhra Pradesh 3.27% Haryana 32.82%
Tamil Nadu 3.75% Nagaland 23.77%
Bihar 5.54% Tripura 20.31%
J harkhand 6.47% Uttarakhand 18.54%
Source: Authors’ Survey Data

8/12/2019 SEBI Penetration of Mutual Funds in India
http://slidepdf.com/reader/full/sebi-penetration-of-mutual-funds-in-india 35/62
35
Map 1a: AUM Growth Rates of Districts (%)
AUM CAGR 2011-13
Source: Authors’ Survey Data

8/12/2019 SEBI Penetration of Mutual Funds in India
http://slidepdf.com/reader/full/sebi-penetration-of-mutual-funds-in-india 36/62
36
To further understand the characteristics of the spread of mutual funds, we
check the geographical distribution of folio growth in the country. The number
of new folios can be taken to approximate the size of new entrants in the mutual
fund market. We map out the growth in the number of folios from 2011 to 2013 in
Map 1B. It seems to indicate that growth is strongest in the states of
Maharashtra, MP, parts of Karnataka and Andhra Pradesh.
Map 1C presents the number of retail folios for every 1000 households. Here, a
clear north-south divide seems to be visible. Large parts of North India have very
low presence of mutual funds in the retail space. Exceptions to this are the north
Indian states of Punjab and Haryana where the proportion of retail folios is
relatively higher.
Map 1D shows the number of retail folios after controlling for bank account
penetration. This depicts the ratio of folios to the number of thousand
households with bank accounts in 2008 as per the Indicus Analytics database.
For example, a ratio of 60 implies that for 6% of bank holders in a given district
have invested in mutual funds. The map shows that districts with the lowest
measure were in Madhya Pradesh, Uttar Pradesh, Bihar and J harkhand, as well
as some pockets of Rajasthan and Andhra Pradesh.
Map 1E which plots the AUM/GDP ratio as of 2013 summarizes the current
penetration scenario and corroborates the T-15 bias already mentioned. As can
be seen in the map, the penetration of mutual funds in most districts of the
country is less than 1%.
In the coming section, we attempt an analysis of the causes of this scenario of
geographical distribution of mutual funds.

8/12/2019 SEBI Penetration of Mutual Funds in India
http://slidepdf.com/reader/full/sebi-penetration-of-mutual-funds-in-india 37/62
37
Other AUM characteristics
Map 1B: Folio Growth (2011-13, %) Map 1C: Retail Folio per 1000 households
(March 2013)
Map 1D: Retail Folios for 1000 households
with Bank Accounts (2013) Map 1E: AUM/GDP (2013, %)
Source: Authors’ Survey Data

8/12/2019 SEBI Penetration of Mutual Funds in India
http://slidepdf.com/reader/full/sebi-penetration-of-mutual-funds-in-india 38/62
38
6 Statistical Analysis
After observing the variation in AUM penetration and AUM growth rates acrossthe various districts, it would be worth finding out the factors which cause some
areas to receive preferential access to mutual funds, independent financial
agents etc. while other states lose out.
The most obvious reason that is often quoted in the literature is that financial
literacy for the average Indian household – especially in rural areas – is so low
that they have difficulty in understanding complex investment vehicles like
mutual funds. To test this hypothesis, two variables were chosen to see if there
was any such relationship could be established.
The first variable chosen was literacy. It would be reasonable to presume that
literate people would have a much better understanding of financial matters
and investments. A scatter plot depicting literacy rates on the vertical axis with
AUM penetration on the horizontal was plotted. We took out the values for TIER I
cities which had high AUM/GDP values since they would tend to distort the
graph. The result was as follows:
8/12/2019 SEBI Penetration of Mutual Funds in India
http://slidepdf.com/reader/full/sebi-penetration-of-mutual-funds-in-india 39/62
39
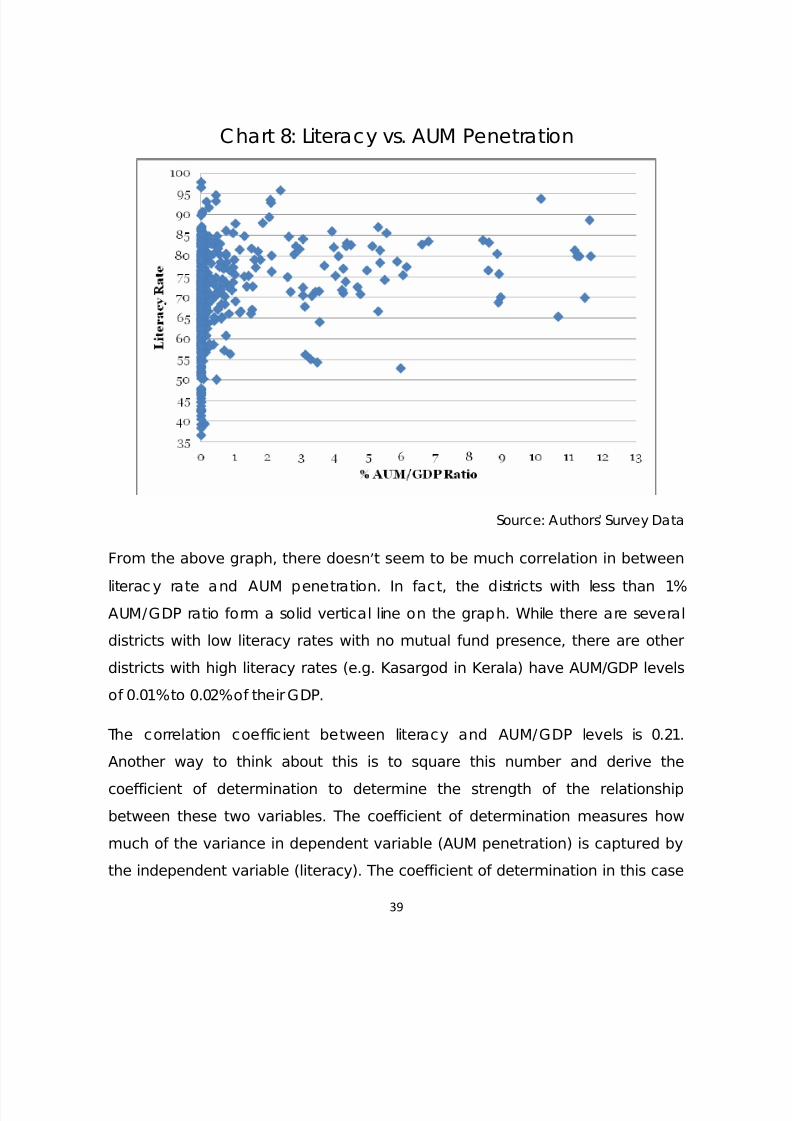
Chart 8: Literacy vs. AUM Penetration
Source: Authors’ Survey Data
From the above graph, there doesn’t seem to be much correlation in betweenliteracy rate and AUM penetration. In fact, the districts with less than 1%
AUM/GDP ratio form a solid vertical line on the graph. While there are several
districts with low literacy rates with no mutual fund presence, there are other
districts with high literacy rates (e.g. Kasargod in Kerala) have AUM/GDP levels
of 0.01% to 0.02% of their GDP.
The correlation coefficient between literacy and AUM/GDP levels is 0.21.
Another way to think about this is to square this number and derive the
coefficient of determination to determine the strength of the relationship
between these two variables. The coefficient of determination measures how
much of the variance in dependent variable (AUM penetration) is captured by
the independent variable (literacy). The coefficient of determination in this case

8/12/2019 SEBI Penetration of Mutual Funds in India
http://slidepdf.com/reader/full/sebi-penetration-of-mutual-funds-in-india 40/62
40
is just 0.0441 or 4.41%. This means that literacy rates explain only 4.41% of the
total variation in AUM/GDP ratio across the country. All this leads to the
conc lusion that literacy levels are not a good proxy for mutual fund penetration
in that area.
Chart 9: Bank Penetration vs. Mutual Fund Penetration
Source: Authors’ Survey Data
One flaw with choosing literacy as a proxy for explaining mutual fund
penetration is that it may not necessarily be true that literate people have
enough to invest in mutual funds. It is very much a possibility that a farmerpracticing subsistence agriculture has completed his primary education and
therefore is counted as a literate person. To compensate for this flaw, it was
decided to choose a variable which would capture a person’s exposure to
investment opportunities. The variable chosen to overcome this was the

8/12/2019 SEBI Penetration of Mutual Funds in India
http://slidepdf.com/reader/full/sebi-penetration-of-mutual-funds-in-india 41/62
41
proportion of households in the district having a savings account with a bank.
The scatter plot of these two variables is shown in Chart 9 (refer previous page).
A pattern similar to the previous graph emerges. While this time the districts are
more scattered about, there is no clear relationship between the two variables.
Most damagingly, there are several districts in which over two-thirds of the
households have savings accounts but still have little (or no) access to mutual
funds. The correlation coefficient is 0.36 which implies a weak correlation and an
inconclusive relationship between the two variables. The coefficient of
determination in this case is 0.1296 implying that bank penetration explains only
12.96% of the entire variation in AUM/GDP ratio.
However, this weak relationship can also be interpreted in the following manner:
Banks and savings account holders are not being tapped as much as one
would imagine for sale of mutual funds. It would be reasonable to suggest that
the number of people with surplus money is likely to be higher in those districts
where bank penetration is higher (say 65% and above). However, given that
there are a large number of districts with high penetration with little to no mutual
fund penetration suggest that banks are not being utilized as distribution centers
for mutual funds. If one can assume that saving account holders visit their bank
branches even once in two months, this would present a good opportunity to
inform people about mutual funds and possibly convert them into investors.
Multivariate Analysis
To overcome this, it was dec ided to run a regression analysis to better eke out
the causes for mutual fund penetration across India.
There are two reasons why penetration of mutual funds in some districts is higher
than another. The first reason could be that people in the district are extremely
rich and are looking for investment opportunities. In other words, the savings
propensity for a richer district would be higher than that of a poorer district. The

8/12/2019 SEBI Penetration of Mutual Funds in India
http://slidepdf.com/reader/full/sebi-penetration-of-mutual-funds-in-india 42/62
42
second reason for a high mutual fund penetration could be the presence of
agents and distributors. If the number of agents in a particular district is high, the
people in the district are more likely to be aware of mutual fund as an
investment asset. This would particularly be true for the districts in the first dec ile
(refer back to Chart 5).
We analyze the effect using two independent variables. The variable chosen to
capture the saving propensity in a district was the percentage of households
with more than Rs. 300,000 of annual income. Households with these income
levels above this can be expected to save at least some percentage of their
annual income in some form. This variable is represented by 3LPA and is
calculated by taking the number of households earning more than Rs. 300,000
and dividing it by the total number of households. The second variable is the
number of financ ial agents in the district. This variable is represented by MFA.
We thus have the following model in mind:
We take took out the outlier categories like Mumbai and other Tier I cities sincetheir AUM penetration levels are over a hundred times larger than the average.
The correlation coefficients of these variables are shown in Table 4 followed by
the scatter plot of all the three variables on the next page.
Table 4: Multivariate Analysis on
Independent Variables
AUM/GDP 3LPA MFA
AUM/GDP 1.0000 0.2750 0.8489
3LPA 0.2750 1.0000 0.2549
MFA 0.8489 0.2549 1.0000

8/12/2019 SEBI Penetration of Mutual Funds in India
http://slidepdf.com/reader/full/sebi-penetration-of-mutual-funds-in-india 43/62

8/12/2019 SEBI Penetration of Mutual Funds in India
http://slidepdf.com/reader/full/sebi-penetration-of-mutual-funds-in-india 44/62
44
cause of this relationship cannot be clearly discerned with the limited data we
have. At the same time, the mutual fund penetration is highly correlated with
the number of agents in the district which reinforces the notion that agents
comprise bulk of the mutual fund sales and remain the dominant channel for
delivery.

8/12/2019 SEBI Penetration of Mutual Funds in India
http://slidepdf.com/reader/full/sebi-penetration-of-mutual-funds-in-india 45/62
45
7 Opinions of Fund Managers
In this final section of the report, the opinions of fund houses on areas on whichthe regulator ought to focus on, and what are the causes for holding mutual
funds back on increasing their presence in rural India.
Investor Awareness
When fund houses were asked whether a typical investor was adequately
informed about different mutual fund products, an overwhelming majority (80%)
answered in negative. AMCs are of the opinion that investors in metros are
significantly better informed as compared to investors in non-metro cities.
However, the distinction is not as sharp when awareness levels of investors in T-15
and B-15 cities are compared. Also, within the T-15 cities, awareness levels about
different mutual funds were far higher in the five metro areas than the rest of the
T-15 cities. 57% of respondents think that lack of customer information is the
biggest challenge they face in selling mutual fund products.
Understandably, this lack of awareness on part of investors is one of the single
largest factors affecting penetration according to the fund houses. AMCs
suggest novel awareness campaigns wherein partnerships with colleges can be
established to inculcate financial knowledge at young age. Involving celebrities
to spread financial awareness regarding mutual funds at category level is also
one of the suggestions. One of the interviewed fund houses suggested opening
up of MF ‘education centers’ in smaller towns could serve as counseling centers
and provide fund updates, NAVs across AMCs.
Distribution Channels
Of all the fund houses surveyed, 61% of respondents said that finding quality
distributors continues to present a formidable challenge. Fund houses are of the

8/12/2019 SEBI Penetration of Mutual Funds in India
http://slidepdf.com/reader/full/sebi-penetration-of-mutual-funds-in-india 46/62
46
opinion that due to the current regulations that impose a limit on the incentives,
good quality distributors are hard to find. On the other hand a large majority of
respondents says that even if a reasonable commission is offered, it is difficult to
rec ruit sufficient number of distributors which implies that there is lack of skilled
distributors. Finding quality distributors especially in small towns and rural areas is
a major hurdle towards increasing mutual fund penetration. This problem is more
prevalent in case of AMCs with relatively lower AUM levels.
67% of fund houses opine that distribution, if carried out through post offices
could be a positive step towards increasing the penetration of mutual funds. If
this could be started, this would be a significant step considering the recent
push by India Post of the Post Office Saving Schemes. Since India Post is a loss
making enterprise, an introduction of such mutual fund sales through India Post
could also help them in reducing their deficit and this could be a highly
beneficial move for both parties. Furthermore, India Post through its broad
network spread throughout the nation offers a distribution channel that could
be leveraged. In J anuary 2001, India Post in association with IDBI-Financ ial
launched a pilot scheme in the Delhi, Mumbai, Kolakata and Patna. From 15th
J une 2001 onwards, sales of mutual funds by SBI, Principal, Franklin-Templeton
and Reliance Mutual Fund were extended to cover post offices in all major
capital and other cities all across the country.
Huge costs when entering new areas where there are no existing mutual funds
are also a barrier for the fund houses to establish the footprint. AMCs ask for
allowing differential incentives for such locations (including, possibly, upfront
fees to distributors) to make it mutual fund distribution financially viable and
compete with the sale of other financial products. The present regulation
provides incentive to the distributors for funds mobilized beyond top 15 cities.
However this benefit is effectively cancelled by the claw-back provision which
needs to be revisited. AMC s also demand fiscal incentives for opening branches

8/12/2019 SEBI Penetration of Mutual Funds in India
http://slidepdf.com/reader/full/sebi-penetration-of-mutual-funds-in-india 47/62
47
beyond top 15 cities as the infrastructure and set-up need to be incurred by
them. At the same time, a large majority of the respondents feel that
introducing new channels like transactions through ATMs would not boost AUM
levels.
Smaller fund houses and those in private sector count misselling by the
distributors as a major factor affecting the penetration of mutual funds. AMCs
suggested making the offence of misselling more stringently punishable. An
interesting insight obtained from the survey is that the fund houses do not feel
that agents have a clash of interest when they sell other financial products
along with mutual funds.
AMC s feel the need of using technology as much as possible to increase the
reach. Facilities like mobile wallet should be introduced which could help
accretions of daily SIPs particularly in small towns and help small investors
participate in equity and debt markets.
In order to tac kle the shortage of quality distributors, AMCs suggest that the
country-wide network of stock brokers can be effectively utilized. They propose
that fund houses should be allowed to pay commissions to them and their
registration with AMFI should not be made compulsory. AMC s also pointed that
restricting the scope of New Cadre Distributors to simple products affects
penetration in non metro locations.
Regulatory Framework
Fund houses also consider “Know Your Customer” (KYC) norms, excessive
paperwork and the restrictions impose on transactions by cash as roadblocks to
penetration by the. Public AMCs consider the regulatory restrictions on
advertisements as a reason for under-penetration.

8/12/2019 SEBI Penetration of Mutual Funds in India
http://slidepdf.com/reader/full/sebi-penetration-of-mutual-funds-in-india 48/62
48
AMCs demand that restrictions on advertisements should be relaxed and the
advertising guidelines should be simplified to enable better communication.
They should be allowed to compare their track record with other competing
products so that the investors can better understand the benefits of investing in
mutual funds.
At the time of our survey, fund houses reported that the cumbersome paper
work, especially related to KYC guidelines ought to be further refined and
simplified particularly in the case of retail investors. The recent simplification of
common KYC norms by SEBI by having i) Common KYC to cover entire financial
services sector, ii) fetching KYC related data directly from KYC Registration
Agency (KRA) and not from investors and iii) further simplification of rules around
disclosure of performance are steps in the right direction. By having this standard
format of application form across the industry, uniform procedures and
practices like transmission, change of name, and issues with signature mistakes
will make the entire investment process easier and simplified for the investor.
By making mutual funds more tax-efficient and friendly, more investors can be
attracted and hence, penetration can be increased. Suggestions include
introduction of new policies to make investment in mutual fund schemes qualify
under Capital Saving Scheme under Income Tax, extension of ELSS Tax benefit
for 3 more years in case of rollover and making mutual funds part of pension
plans.
From the feedback received from the AMCs, there is a lack of level playing field
as compared to other competing products in terms of tax advantages,
disclosure levels, after sales support and other regulations. Unless these issues are
addressed, it will be very hard for the AMCs to increase the penetration levels.
A summary of the views of fund houses is given below. To arrive at these
interpretations, we asked managers at fund houses questions ranging across
multiple issues. Fund houses which responded to the questions with “moderately

8/12/2019 SEBI Penetration of Mutual Funds in India
http://slidepdf.com/reader/full/sebi-penetration-of-mutual-funds-in-india 49/62
49
agree” and “strongly agree” were grouped under the category “Agree”. Similarly,
we grouped “moderately disagree” and “strongly disagree” under the category
“Disagree”. Questions on which no responses were received were grouped in the
third category of neutral.
Table 5: Views/opinions of Fund Houses
No View/Opinion Disagree Neutral Agree
1 The typica l investor is not adequately
informed about mutual fund products8.57% 8.57% 80.00%
2
Investors in metros (tier-I cities) are significantly
better informed than investors in non-metros
cities
2.86% 17.14% 80.00%
3 Investors in T-15 cities are significantly betterinformed than investors in B-15 cities
5.71% 34.29% 60.00%
4Lack of customer information is the biggest
hurdle in selling mutual fund products28.57% 11.43% 57.14%
5Quality of distributors is a challenge in selling
mutual fund products8.82% 23.53% 61.76%
6
Current limit permissible for incentives /
commission is a constraint in rec ruiting quality
distributors / agents
14.29% 20.00% 62.86%
7 Agents selling non mutual fund productsalong with mutual fund products is a
hindrance to mutual fund penetration
51.43% 14.29% 31.43%
8
Regardless of reasonable incentive /
commission, it is difficult to rec ruit sufficient
number of qualified distributors
20.00% 28.57% 48.57%
9Whether certification courses by NISM for
distributors requires improvement20.00% 40.00% 37.14%
10Penetration would increase if distribution were
broadly done through bank branches25.71% 11.43% 60.00%
11
Penetration would increase if distribution were
broadly done through individual financial
advisor
14.29% 22.86% 57.14%
12Fac ility of investing in mutual funds through
ATM machine would boost the investment40.00% 20.00% 34.29%
13 Distribution through post office would increase 11.76% 17.65% 67.65%

8/12/2019 SEBI Penetration of Mutual Funds in India
http://slidepdf.com/reader/full/sebi-penetration-of-mutual-funds-in-india 50/62
8/12/2019 SEBI Penetration of Mutual Funds in India
http://slidepdf.com/reader/full/sebi-penetration-of-mutual-funds-in-india 51/62
51
8 Conclusions and Policy Recommendations
We carry out a preliminary enquiry into the nature of geographical penetration
and distribution of mutual funds in India as well as their likely determinants. Using
a questionnaire survey we collect qualitative and quantitative evidence from
fund managers on the nature and determinants of their geographical presence
throughout the country.
We confirm that mutual fund presence in the country is heavily skewed in the
favor of the top 60 districts of India. Even within the 60 districts, a lion’s share of
the mutual fund presence originates from Mumbai. This is primarily due to the
fact that Mumbai houses the headquarters (or the financial headquarters) of
most of the large companies, thereby getting a bulk of investments through the
non-retail or institutional avenues. If the non-retail customers are taken out,
Mumbai starts looking like the other larger metros of the country.
We confirm that independent financial agents are associated with the bulk of
the sales of mutual funds in the country. We then report that the geographical
distribution of the financial agents is similarly skewed (but not as much) in the
favor of the top 60 districts. Agents in these top districts can expect to manage
to have AUM in the range of three to seven times the amount they can expect
to manage in the next 60 districts.
At the same time, the distribution costs as a function of AUM generated in the
top 60 districts are far higher than the costs in the lower districts. This suggests
that distribution networks have a larger throughput in the 2nd and 3rd decile of
the district distribution and fund houses ought to focus on these districts ceteris-
paribus if they did like to see the maximum amount of AUM generated for each
rupee spent in distribution costs.

8/12/2019 SEBI Penetration of Mutual Funds in India
http://slidepdf.com/reader/full/sebi-penetration-of-mutual-funds-in-india 52/62
52
We report that demographic and social development factors such as adult
literacy or bank penetration (savings account) do not show any strong
correlation with mutual fund penetration. This lack of strong correlation is a
strong indicator that banks are not being utilized as effective delivery channels.
Commissions offered to mutual fund agents appear to be significantly less
attractive than those for other financial products (particularly insurance). Mutual
fund agents outside T-15 cities cannot rely exclusively on the sale of mutual
funds as an income source and the products compete for the “push” given to
them by the agents. Low commissions could also be a reason for the difficulty in
finding talent.
At the same time, the number of agents together with number of households
with more than Rs. 300,000 of annual income does show a high correlation with
mutual fund penetration, thereby suggesting that fund houses ought to seek out
those districts where such households are present.
We finally present a brief summary on the opinions of fund house managers on
what is holding mutual funds from increasing their presence outside T-15 cities.
The main concern raised by fund houses was lack of good talent for training
and hiring mutual fund agents. Another major concern was about investor
awareness and the lack of financial sophistication of investors outside T-15 cities.
The growth in the mutual fund industry is by and large governed by the
macroeconomic factors affecting the country. Given the recent high inflation
rates with a slowdown in the economic output of the nation, it is not surprising to
see a slowdown in the rate of growth in the mutual fund industry as well.
However, there remains a large untapped market waiting to be explored and
serviced. Some of these areas, such as Himachal Pradesh, Haryana and
Manipur are already experiencing high growth rates (albeit from a smaller

8/12/2019 SEBI Penetration of Mutual Funds in India
http://slidepdf.com/reader/full/sebi-penetration-of-mutual-funds-in-india 53/62
53
base). However, this growth can be sped up substantially if the proper areas are
targeted.
While there is universal acknowledgement that there good talent is hard to find
and AMCs face difficulty in recruiting the right distributors and agents in small
towns and villages, they should take note of the large pool of Business
Correspondents which number 195,000 as on March 31, 2013. This could be a
talent pool waiting to be tapped to address the shortage of mutual fund agents
in the nation. (Dept. of Financial Services, Ministry of Finance, 2013).
We also feel that bank channels are currently being underutilized. With several
districts having high banking penetration among households, such districts ought
to be a prime target for further growth. With the RBI scheduled to roll out new
banking licenses by 2014, financial inclusion is set to receive a huge push,
thereby signaling a possible strengthening of banks’ distribution networks. AMCs
should therefore start to focus on their bank distribution channels and build
robust information systems in order to take advantage of these upcoming
opportunities.
The deduction of “trail commission” from investors makes mutual funds less
attractive. A possibility may be explored about the sharing of the “trail
commission” between fund houses and investors – this would increase the
attractiveness of mutual funds vis-a-vis other products. However, the exact
mechanics of such a change should take into account the elasticity of investors
to mutual fund returns.
This report is but a preliminary investigation into the delivery mechanism of
mutual funds in India and offers several avenues for further research and
exploration.
An area we have not looked into is the impact of advertisement and marketing
costs on distribution. While fund houses did report these figures, with the

8/12/2019 SEBI Penetration of Mutual Funds in India
http://slidepdf.com/reader/full/sebi-penetration-of-mutual-funds-in-india 54/62
54
exception of a few fund houses, marketing and advertisement costs were only
available at the central level for the fund as a whole. It is generally held that
“You can ’ t manage wha t you don ’ t measure ”. By not having these costs
allocated or measured at a micro level, fund houses would not know which
areas to increase their marketing and advertising efforts, which could lead to
inefficient marketing.
It may be helpful to explore the challenges faced by India Post’s 2001 pilot
programme for the sale of mutual funds through post offices in major cities. Such
a study could investigate whether such a rollout across villages would be
economically feasible and meaningful.
Finally, we have treated mutual fund sales as homogenous sales by the
independent financial agents. Analysis of sales data of agents would allow
future research to be much more precise in determining the impact of agents
on retail sales.

8/12/2019 SEBI Penetration of Mutual Funds in India
http://slidepdf.com/reader/full/sebi-penetration-of-mutual-funds-in-india 55/62
55
References
Adajania,
K.
E.
(2013).
MF
industry
needs
to
look
at
standardization
in
a
new
light.
HT
Mint,
September
04 .
Anagol, S., & Kim, H. H. (2012). The Impact of Shrouded Fees: Evidence from a Natural Experiment in the
Indian Mutual Fund Market. American Economic Review , 576 ‐ 593.
Anagol, S., Marisetty, V. B., Sane, R., & Venugopal, B. G. (2013). On the Impact of Regulating
Commissions: Evidence from the Indian Mutual Funds Market.
Association of Mutual Funds in India. (2013). AMFI Quarterly Updates. Retrieved October 14, 2013, from
amfiindia.com: http://portal.amfiindia.com/spages/aqu‐vol12‐issueIV.pdf
Barber, B., Zheng, L., & Odean, T. (2005). Out of Sight, Out of Mind: The Effects of Expenses on Mutual
Fund Flows. Journal of Business , 2095‐2120.
Barth, J., Gerard, C. J., & Ross, L. (2001). The Regulation and Supervision of Banks Around the World: A
New Database. Brookings Institution Press .
Boston Analytics. (2010). Mutual Funds Investments. Retrieved October 3, 2013, from Boston Analytics:
http://www.bostonanalytics.net/india_watch/BA_SMD_Press_release_June_Final_3.pdf
Chiyachantana, C., Jain, P., Jiang, C., & Wood, R. (2004). International evidence on institutional trading
behavior and price impact. The Journal of Finance , 869‐898.
Demirguc‐Kunt, A., & Klapper, L. (2012). Measuring Financial Inclusion: The Global Findex Database.
World Bank.
Dept. of Financial Services, Ministry of Finance. (2013). An Overview on Financial Inclusion. Report
(Accessed from http://financialservices.gov.in/banking/Overviewofefforts.pdf).
Halan, M. (2013). Why do Indians buy so much gold jewelry? HT Mint , June 11.
Indicus Analytics. District GDP of India, 2005‐09
Investment Company
Institute.
(2013).
2013
Investment
Company
Fact
Book.
Keswani, A., & Stolin, D. (2012). Investor Reaction To Mutual Fund Performance: Evidence From UK
Distribution Channels. Journal of Financial Research , 425‐450.
Khorana, A., Servaes, H., & Tufano, P. (2005). Explaining the Size of the Mutual Fund Industry Around the
World. Journal of Financial Economics , 50.

8/12/2019 SEBI Penetration of Mutual Funds in India
http://slidepdf.com/reader/full/sebi-penetration-of-mutual-funds-in-india 56/62
56
Kirkire, S. (2013). It is about time in the market and not timing the market. (L. P. Barbora, Interviewer)
HT Mint, August 09.
La Porta, R., Lopez‐de‐Silane, F., Shleifer, A., & Vishny, R. W. (1998). Law and Finance. Journal of Political
Economy , 106.
Massa, M.,
Goetzmann,
W.
N.,
&
Rouwenhorst,
G.
K.
(1999).
Behavioral
Factors
in
Mutual
Fund
Flows.
Yale ICF Working Paper No. 00‐14 , 42.
Müller, S., & Weber, M. (2010). Financial Literacy and Mutual Fund Investments: Who Buys Actively
Managed Funds? Schmalenbach Business Review , 126‐153.
NCAER Max New York Life. (2008). India Financial Protection Survey.
Nicola, C., & Michele, G. (2001). Banking market structure, financial dependence, and growth:
International evidence from industry data. Journal of Finance , 617‐648.
PWC, CII.
(2013).
Indian
Mutual
Fund
Industry:
Unearthing
the
growth
potential
in
untapped
markets.
Mumbai: CII.
Reserve Bank of India, Annual Report (2012)
Thompson, J., & Choi, S.‐M. (2001). Governance systems for collective investment schemes in OECD
countries. Paris: OECD.
Wermers, R. (1999). Mutual Fund Herding and the Impact on Stock Prices. Journal of Finance .
World Bank. (2012). World Development Indicators.
Zechner, J.,
Neal,
S.,
&
Youchang,
W.
(2011).
Intermediated
Investment
Management.
Journal
of
Finance
, 947‐980.

8/12/2019 SEBI Penetration of Mutual Funds in India
http://slidepdf.com/reader/full/sebi-penetration-of-mutual-funds-in-india 57/62
57
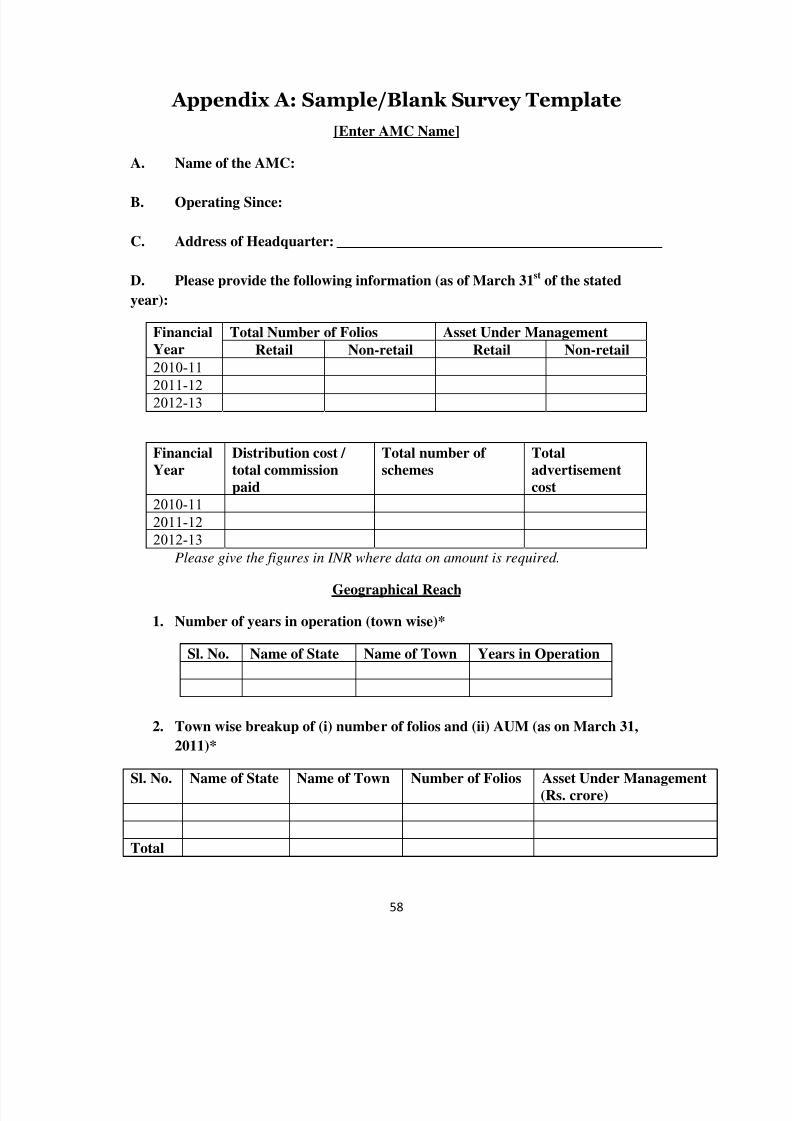
8/12/2019 SEBI Penetration of Mutual Funds in India
http://slidepdf.com/reader/full/sebi-penetration-of-mutual-funds-in-india 58/62
58
Appendix A: Sample/Blank Survey Template [Enter AMC Name]
A. Name of the AMC:
B. Operating Since:
C. Address of Headquarter:
D. Please provide the following information (as of March 31st of the stated
year):
Total Number of Folios Asset Under ManagementFinancial
Year Retail Non-retail Retail Non-retail
2010-11
2011-12
2012-13
Financial
Year
Distribution cost /
total commission
paid
Total number of
schemes
Total
advertisement
cost
2010-11
2011-12
2012-13
Please give the figures in INR where data on amount is required.
Geographical Reach
1. Number of years in operation (town wise)*
Sl. No. Name of State Name of Town Years in Operation
2. Town wise breakup of (i) number of folios and (ii) AUM (as on March 31,
2011)*
Sl. No. Name of State Name of Town Number of Folios Asset Under Management
(Rs. crore)
Total

8/12/2019 SEBI Penetration of Mutual Funds in India
http://slidepdf.com/reader/full/sebi-penetration-of-mutual-funds-in-india 59/62
59
3. Town wise breakup of (i) number of folios and (ii) AUM (as on March 31,
2012)*
Sl. No. Name of State Name of Town Number of Folios Asset Under Management
(Rs. crore)
Total
4. Town wise breakup of (i) number of folios and (ii) AUM (as on March 31,
2013)*
Sl. No. Name of State Name of Town Number of Folios Asset Under Management
(Rs. crore)
Total* Please add rows if required.
Distribution / Marketing
Breakup of (i) number of distributors / agents (ii) marketing cost (town wise)
Through National Distributor*
Sl.
No.
Name of
state
Name of
town
Number of
Agents
Marketing cost
(in rupees)
Distribution cost
(in rupees)
Total
Through Banks*
Sl.
No.
Name of
state
Name of
town
Number of
Agents
Marketing cost
(in rupees)
Distribution cost
(in rupees)
Total
Through Individual Financial Advisors (IFAs)*
Sl.
No.
Name of
state
Name of
town
Number of
Agents
Marketing cost
(in rupees)
Distribution cost
(in rupees)
Total
*Please add rows if required.

8/12/2019 SEBI Penetration of Mutual Funds in India
http://slidepdf.com/reader/full/sebi-penetration-of-mutual-funds-in-india 60/62
60
Yours Views / Opinions
Please tell us what you perceive about your customers across different geographical
areas where you work (e.g. rural vs. urban). Please choose a score for each question.
The scores are according to the following scale.
Strongly agree 5
Agree 4
Neutral 3
Disagree 2
Strongly disagree 1
1. The typical investor is not adequately informed about mutual fund products.
1 2 3 4 5
Strongly disagree Disagree Neutral Agree Strongly Agree
2. Investors in metros (tier-I cities) are significantly better informed than investors in
non-metros cities.
1 2 3 4 5
Strongly disagree Disagree Neutral Agree Strongly Agree
3. Investors in T-15 cities are significantly better informed than investors in B-15
cities.
1 2 3 4 5Strongly disagree Disagree Neutral Agree Strongly Agree
4. Lack of customer information is the biggest hurdle in selling mutual fund
products
1 2 3 4 5
Strongly disagree Disagree Neutral Agree Strongly Agree
5. Quality of distributors is a challenge in selling mutual fund products.
1 2 3 4 5
Strongly disagree Disagree Neutral Agree Strongly Agree
6. Current limit permissible for incentives / commission is a constraint in recruiting
quality distributors / agents.
1 2 3 4 5
Strongly disagree Disagree Neutral Agree Strongly Agree

8/12/2019 SEBI Penetration of Mutual Funds in India
http://slidepdf.com/reader/full/sebi-penetration-of-mutual-funds-in-india 61/62
61
7. Agents selling non mutual fund products along with mutual fund products is a
hindrance to mutual fund penetration
1 2 3 4 5
Strongly disagree Disagree Neutral Agree Strongly Agree
8. Regardless of reasonable incentive / commission, it is difficult to recruit sufficientnumber of qualified distributors.
1 2 3 4 5Strongly disagree Disagree Neutral Agree Strongly Agree
9. Whether certification courses by NISM for distributors requires improvement.
1 2 3 4 5
Strongly disagree Disagree Neutral Agree Strongly Agree
10. Penetration would increase if distribution were broadly done through bank
branches.
1 2 3 4 5Strongly disagree Disagree Neutral Agree Strongly Agree
11. Penetration would increase if distribution were broadly done through individual
financial advisor.
1 2 3 4 5
Strongly disagree Disagree Neutral Agree Strongly Agree
12. Facility of investing in mutual funds through ATM machine would boost the
investment.
1 2 3 4 5
Strongly disagree Disagree Neutral Agree Strongly Agree
13. Distribution through post office would increase penetration
1 2 3 4 5
Strongly disagree Disagree Neutral Agree Strongly Agree

8/12/2019 SEBI Penetration of Mutual Funds in India
http://slidepdf.com/reader/full/sebi-penetration-of-mutual-funds-in-india 62/62
Please give score to each following factors affecting penetration of mutual funds
using the scale 1 - 10 where 10 indicates most important and 1 indicates least
important. Different factors may have same scores and their scores are independent
from one another.
Lack of information / financial sophistication of the customers about mutual
funds.
Inability to distinguish between mutual funds and chit funds
Negative mindset about stock market
Inability to distinguish between different schemes
Mis-selling by distributors is a major hindrance to further penetration.
Cost of entering new regions with no existing mutual funds.
Finding quality distributors / agents in small towns and villages.
KYC / Paperwork / restrictions on cash transaction
Competition from chit funds / nidhis / NBFCs, etc.
Availability of investible surplus among customers
Regulatory restriction on commissions / incentives
Regulatory restriction on advertisement
Comments:
Apart from the above-mentioned reasons, please mention any other issues that are major
hindrance to penetration. You are requested to mention any kind of regulatory support
that according to you may be required for increasing the penetration of mutual funds in
B15 cities.