sebi 2010 expert group on indicators of climate change impacts on biodiversity presentation of the...
TRANSCRIPT
SEBI 2010 expert group onIndicators of climate change impacts
on biodiversity
Presentation of the SEBI 2009 report and follow-up
Sophie Condé SEBI WG1 coordinator, ETC/BD

3rd SEBI Expert Group Meeting Climate change and Biodiversity11-12 June 2009 Paris
2
Political context (1)
What ’ new since the adoption of the set of indicators
by CBD, PEBDLS and EU (2004) the EC Biodiversity Communication
(2006) The mid term EC BAP review (2008)

3rd SEBI Expert Group Meeting Climate change and Biodiversity11-12 June 2009 Paris
3
Political context (2)
G8 environment meeting in Syracuse, Italy, April 2009
Around 20 countries decided to take measures on
• Climate• Biodiversity, Economics and Business• Management of Biodiversity and Ecosystems Services• Science, Research and Policy• A common path toward the post-2010 framework on biodiversity

3rd SEBI Expert Group Meeting Climate change and Biodiversity11-12 June 2009 Paris
4
Political context (3)
High-level conference in Athens, Greece – “Commission calls for a shake-up in EU biodiversity policy”, May 2009
With 8 action points:• a vision of why biodiversity matters • a better understanding of where we are and what more we need to do • a fully functioning network of protected areas • biodiversity outside of protected areas • biodiversity and Climate Change • global biodiversity • integration of biodiversity into other policy areas • funding

3rd SEBI Expert Group Meeting Climate change and Biodiversity11-12 June 2009 Paris
5
Political context (4)
The future
• Setting post 2010 targets• Importance of biodiversity acknowledged• Links to ecosystem services and climate change• Further build the knowledge base• Sectoral integration!

3rd SEBI Expert Group Meeting Climate change and Biodiversity11-12 June 2009 Paris
6
SEBI2010 outputs (1)
2007: technical report documenting the indicators
Available on EEA website

3rd SEBI Expert Group Meeting Climate change and Biodiversity11-12 June 2009 Paris
7
SEBI2010 outputs (2)
2009: first assessment based on the 26 indicators
Available on EEA website

3rd SEBI Expert Group Meeting Climate change and Biodiversity11-12 June 2009 Paris
8
SEBI2010 outputs (3)
2009: first assessment based on the 26 indicators
First report based on biodiversity indicators defined within the CBD in 2004 at European level;
Takes stock of the state of biodiversity and its loss based on the most recent data;
Show what is missing to enable a comprehensive assessments

3rd SEBI Expert Group Meeting Climate change and Biodiversity11-12 June 2009 Paris
9
SEBI2010 outputs (4)
2009: fact sheets for the full set of 26 indicators
Will be available soon
on EEA website
3rd SEBI Expert Group Meeting Climate change and Biodiversity11-12 June 2009 Paris
10
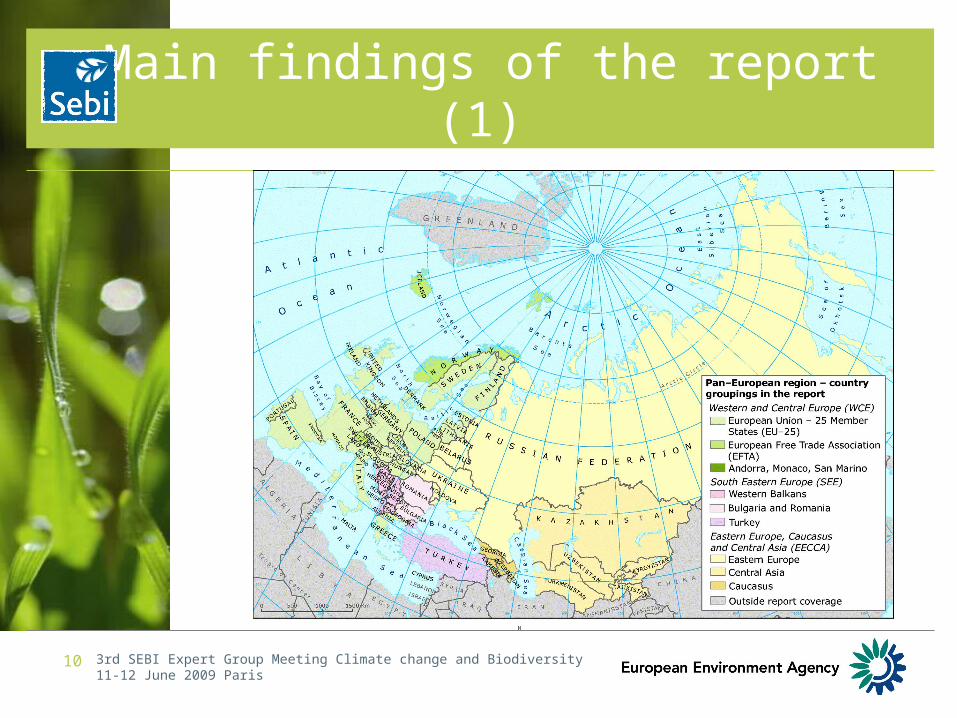
Main findings of the report (1)

3rd SEBI Expert Group Meeting Climate change and Biodiversity11-12 June 2009 Paris
11
Main findings of the report (2)

3rd SEBI Expert Group Meeting Climate change and Biodiversity11-12 June 2009 Paris
12
Main findings of the report (3)

3rd SEBI Expert Group Meeting Climate change and Biodiversity11-12 June 2009 Paris
13
Main findings of the report (4)
Status and trends of the components of biodiversity
Some progress has been made towards halting the loss of biodiversity within Europe but overall the status and trends of most species and habitats give rise to concern, whilst genetic diversity in livestock remains at risk. As for wildlife, the overall risk of species extinction in Europe has further increased.
Much progress has been made in designating protected areas and priority should now be given to their management. The conservation status of the species and habitats covered by EU legislation, however, remains unsatisfactory with 50-85 % of habitats and 40-70 % of species of European interest remaining in an unfavourable conservation status according to the terrestrial regions.
Data availability for ecosystems is limited. Land cover data show a further decline in the extent of grasslands and wetlands with an increase in urban, woodland and open water habitats.

3rd SEBI Expert Group Meeting Climate change and Biodiversity11-12 June 2009 Paris
14
Main findings of the report (5)
Threats to biodiversity
Some threats to biodiversity have decreased significantly, whereas others have not, as specified below.
Acidification and eutrophication caused by excess nitrogen are declining
but invasive alien species and climate change appear to have increasingly negative impacts.
Natural and semi-natural land is under pressure, especially from urban sprawl and abandonment of agricultural land. Fragmentation is a threat to forest areas.
Water quality is improving in freshwater and largely unchanged in transitional, coastal and marine waters. Overexploitation of marine fisheries is a major threat to marine ecosystems.
Nitrogen balances on farmland are decreasing, though they are still high.

3rd SEBI Expert Group Meeting Climate change and Biodiversity11-12 June 2009 Paris
15
Main findings of the report (6)
Ecosystem integrity and ecosystem services
Water quality in freshwater systems is improving.
In the marine environment, pollution levels are relatively constant and the state of marine fauna is worrying due to unsustainable fishing practices.
On land, habitat fragmentation is a major concern.

3rd SEBI Expert Group Meeting Climate change and Biodiversity11-12 June 2009 Paris
16
Main findings of the report (7)
Sustainable use
Forestry is generally sustainable in terms of wood volume harvested, but a stronger biodiversity focus is needed.
Agriculture still exerts a high pressure on the environment, despite agri-environmental measures and increasing organic production.
Commercial fisheries appear unsustainable, with as much as 45 % of assessed stocks being overexploited.
Overall, Europe uses more resources and produces more waste than it can sustainably produce and absorb respectively.

3rd SEBI Expert Group Meeting Climate change and Biodiversity11-12 June 2009 Paris
17
Main findings of the report (8)
Status of access and benefits sharing - Status of resource transfer and use - Public opinion
A significant proportion of patent applications is based on genetic resources, but additional work is required to link the data with wider economic and geographical information.
Spending on biodiversity is only a small part of the EU budget and more information on funding from other sources is needed.
Public awareness of biodiversity is low and urgently needs attention.

3rd SEBI Expert Group Meeting Climate change and Biodiversity11-12 June 2009 Paris
18
Main findings of the report (9)
For the next assessment
to determine target values and baselines for each indicator where possible.
will focus more strongly on interactions, responses and integration of biodiversity concerns into sectoral policies.
a deeper analysis will be done of the impact of Europe and its policies on biodiversity in the world

3rd SEBI Expert Group Meeting Climate change and Biodiversity11-12 June 2009 Paris
19
SEBI2010 outputs (4)
Interlinkages report (short term recommendations)
1. Accompany each indicator by a clear interpretation guidance. The indicators may produce contradictory messages (up and down).
2. Provide state and trend information (absolute and relative) and ranges.
3. Show underlying positive or negative exceptions in addition of the average results.
4. Use major ecosystem types (biome) and country groups as intermediate spatial scales between (pan) Europe and countries in order to show the diversity within Europe.
5. Reorder the focal areas in: i) state, ii) threats, iii) goods & services and sustainable use and , iv) response. They do better match the 4 policy key questions

3rd SEBI Expert Group Meeting Climate change and Biodiversity11-12 June 2009 Paris
20
SEBI2010 outputs (5)
Interlinkages report (long term recommendations)
1. Build models of the major cause-effect relationships (DPSIR) in a concerted scientific effort. The few models which do exist can be used as starting point.
2. Make temporal scales, spatial scales, baselines, assessment principles and critical levels more coherent. Current indicators draw on existing data and indicators as suggested by the CBD, coming from different institutions developed for different purposes. Consequently, they offer a scattered picture hampering clear policy conclusions.
3. Determine critical levels in order to assess whether marine ecosystems, forest and agriculture are sustainably managed.
4. Connection must be made with the European Platform Biodiversity Research Srategy and national biodiversity research strategies to reinforce research on these issues

3rd SEBI Expert Group Meeting Climate change and Biodiversity11-12 June 2009 Paris
21
SEBI2010 outputs (5)
ECOSYSTEM INTEGRITY, GOODS AND SERVICES Marine trophic index Connectivity/fragmentation of
ecosystems Water quality in aquatic ecosystems
SUSTAINABLE USE Area of ecosystems under sustainable management Forest Agriculture Fishery Aquaculture
Ecological footprint
STATUS AND TRENDS OF COMPONENTS OF BIOVERSITY Trends in extent of selected biomes,
ecosystems, habitats Coverage of protected areas Trends in abundance and distribution of
selected species Change in status of threatened and/or
protected species Trends in genetic diversity of domesticated
animals, cultivated plants, fish species of major socioeconomic importance
THREATS TO BIODIVERSITY Nitrogen deposition Numbers and costs of invasive alien
species (Trends in invasive alien species)
Impact of climate change
Status
Threats
Sustainable use
G & S + Ecosystem integrity
What is changing?
Why is it changing?
Why is it important?
Original focal areas
Status
Threats
G&S + Sust use
Response
Adjusted focal areas Key questions
What are & can wedo about it?
Status
Threats
Sustainable use
G & S + Ecosystem integrity
What is changing?What is changing?
Why is it changing?Why is it changing?
Why is it important?
Original focal areas
Status
Threats
G&S + Sust use
Response
Adjusted focal areas Key questions
What are & can wedo about it?

3rd SEBI Expert Group Meeting Climate change and Biodiversity11-12 June 2009 Paris
22
Indicator State Threats Use Response Sectors
01 Birds birds only agriculture, forestry, best regulation agriculture forestry
01 Butterflies butterflies only agriculture Pollinisation agriculture
02 RLI birds only Biodiv
03 Species FFH only FFH species Biodiv
04 Ecosystems main ecosystemsland use, habitat
lossBiodiv agriculture, households, industry, transports
05 Habitat FFH onky FFH habitats Biodiv
06 Livestock genetic sheep &cattles only agriculture meat & dairy agriculture
07 National sites biodiv, recreation protected areas
08 SCIs & SPAs biodiv, recreation Natura2000
09 Critical load eutrophication agriculture, households, industry, transports
10 IAS invasive species invasive species agriculture, households, transports, business
11 Temperature sensitive species
temperature sensitive species climate change agriculture, households, transports, etc
12 Marine Trophic Index marine fish & ecosystem fisheries Fish Fisheries
13 Frag Natural & semi, habitat
fragmentation agriculture, households, industry, transports
14 Frag Rivers freshwaters river fragmentation energy,
15 Nutrients coastal & marine waters
coastal & marine waters eutrophication clean water agriculture, households, industry, etc
16 Freshwater eutrophication clean water agriculture, households, industry, etc
17 Forest forestry Wood Forestry
18 Deadwood forest ecosystem forestry Forestry
19 Nitrogen eutrophication Agriculture
20 Agri Managt farmland agriculture agri products AES organic farming Agriculture
21 Fisheries fish fisheries Fish Fisheries
22 Aquaculture coastal & marine
watersaqua products Aquaculture
23 Footprint
24 Patents Patents
25 Financing nature policy
26 Public awareness nature policy

3rd SEBI Expert Group Meeting Climate change and Biodiversity11-12 June 2009 Paris
23
Has biodiversity loss been halted?
Extent
Threatened Agro-genetic
Zoom in:
40
60
80
100
120
1980 1985 1990 1995 2000 2005
Farmland birds
Forest birds
All common birds
species abundance
Habitats & Species Eu interest
STI birds and Butterflies
Intactness/integrity?
Quality distribution
0
10
20
30
40
50
60
70
80
90
100
1995 2000 2005 1995 2000 2005 1995 2000 2005 2001 2004 1995 2000 2005
France Germany Greece Netherlands Poland
% of CattlePopulationconsisting ofnative breeds
% of NativeCattle BreedsEndangered
0.85
0.90
0.95
1994 2004
Year
Red
Lis
t Ind
ex o
f sp
ecie
s su
rviv
al
-4 -2 0 2 4 6
Constructed, industrial, artif icial habitats (779362)
Inland surface w ater (99513)
Woodland and forest (603421)
Marine habitats (-6580)
Grassland (-223555)
Cultivated, agriculture, horticulture (-801538)
inland unvegetated or sparsely vegetated (-42197)
Coastal habitats (-3231)
heathland, scrub and tundra (-298108)
Mire, bog and fen habitats (-107044)
% change
Change in extent/biome

3rd SEBI Expert Group Meeting Climate change and Biodiversity11-12 June 2009 Paris
24
Is agriculture sustainably managed?
0
10
20
30
40
50
60
70
80
90
100
1995 2000 2005 1995 2000 2005 1995 2000 2005 2001 2004 1995 2000 2005
France Germany Greece Netherlands Poland
% of CattlePopulationconsisting ofnative breeds
% of NativeCattle BreedsEndangered
-10
20
50
80
110
140
170
200
230
260
290
320
350
380
410
440
1985
1986
1987
1988
1989
1990
1991
1992
1993
1994
1995
1996
1997
1998
1999
2000
2001
2002
2003
2004
2005
Kg
pe
r H
a
AT
BE
CZ
DE
DK
ES
FI
FR
GR
HU
IE
IT
LU
NL
PL
PT
SE
SK
UK
0
2
4
6
8
10
12
Austria
Belgiu
m
Czech
Rep
ublic
Denm
ark
Ger
man
y
Eston
ia
Irelan
d
Gre
eceSpa
in
Franc
eIta
ly
Cypru
s
Latv
ia
Lithua
nia
Luxe
mbo
urg
Hunga
ryM
alta
Nether
land
s
Polan
d
Portu
gal
Slove
nia
Slova
kia
Finlan
d
Sweden
Unite
d Kin
gdom
EU 25
Norway
2000
2003
2005
% organic farming
time
% E
urop
e
0
HNV farmland
Total agriculture
Minim
um le
vels
100%
time
% E
urop
e
0
HNV farmland
Total agriculture
Minim
um le
vels
100%
1960 2005
100%
Area usedoutsideEurope
0%
Food
1960 2005
100%
Area usedoutsideEurope
0%
Food
Agricultural area
Agro-geneticN-balance
HNV area
Footprint
Pressure
State
Response
40
60
80
100
120
1980 1985 1990 1995 2000 2005
Farmland birds
Forest birds
All common birds
STI farmland birds & butterflies
N-input
N-input
0
40
200
N-input
N-input
0
40
200
N-input
time
Bio
dive
rsity
-fri
endl
yfa
rmla
nd
%
Organic farming
Agri-env. schemes
time
Bio
dive
rsity
-fri
endl
yfa
rmla
nd
%
Organic farming
Agri-env. schemes
Organic farming
Agri-env. schemes
Potentially supporting practices

3rd SEBI Expert Group Meeting Climate change and Biodiversity11-12 June 2009 Paris
25
Thank you for your attention!