seattle dpd - south lake union final environmental …...• route 316: shoreline to uptown...
TRANSCRIPT

Appendix E
Transportation

SOUTH LAKE UNION HEIGHT AND DENSITY FINAL EIS APRIL 2012 1
Appendix E-1: Parking This appendix provides more information on the parking analysis completed for this document.
Existing Conditions Parking Analysis The data used for the existing conditions parking analysis is included as Attachments 1, 2, and 3.
Future Year Parking Estimates The future year parking estimates are based on the actual parking supplied by recent developments in South Lake Union. According to http://seattlecommercialpropertydirectory.com/, parking was provided at the following ratios for recently developed projects:
• 1 space per thousand square feet of non-residential area: Alley 24, 2200 Westlake Avenue, 2201 Westlake Avenue
• 1.4 spaces per thousand square feet of non-residential area: Amazon Headquarters
• 1.5 spaces per thousand square feet of non-residential area: 320 Westlake Avenue
• 1.6 spaces per thousand square feet of non-residential area: 428 Westlake
The current City of Seattle Municipal Code (Section 23.54.015) requires 1 space per thousand square feet of office and 2 spaces per thousand square feet for retail uses. As discussed in the text, no parking is required for multifamily residential uses in commercial zones in urban centers, which applies to most of the study area; however, parking is still usually provided. It was assumed that one parking space per dwelling unit would be supplied. Since the code regarding commercial uses is complex, and varies depending on specific land use, the following assumptions were made:
• 1 space per dwelling unit for residences
• 3 spaces per 1,000 square feet (ksf)of retail space
• 1.5 space per 1,000 square feet (ksf) of office (non-retail) space

SOUTH LAKE UNION HEIGHT AND DENSITY FINAL EIS APRIL 2012 2
Future growth was provided as jobs, rather than as square footage. Therefore, the assumptions used in the MXD tool were used to convert jobs to square footage. The conversion factors are:
• 500 square feet per retail employee
• 350 square feet per office (non-retail) employee
The following table shows the household and job growth and resulting parking spaces.
Table A3.13-1 ESTIMATED ADDITIONAL PARKING SPACES IN 2031
Alternative Households Retail Jobs Non-retail
Jobs Total
Expected Growth
No Action 9,200 2,087 13,913 25,200
Alternative 1 11,900 2,856 19,040 33,796
Alternative 2 11,900 2,856 19,040 33,796
Alternative 3 11,900 2,400 16,000 30,300
Expected New Parking Spaces
No Action 9,200 3,131 7,305 19,636
Alternative 1 11,900 4,284 9,996 26,180
Alternative 2 11,900 4,284 9,996 26,180
Alternative 3 11,900 3,600 8,400 23,900 Source: Fehr & Peers, 2010

SOUTH LAKE UNION HEIGHT AND DENSITY FINAL EIS APRIL 2012 3
Appendix E-2: Roadway Operations Analysis This appendix provides additional information on the methods used for roadway impact assessment.
The threshold for an impact on the roadway is defined as “an increase in traffic on a study corridor that operates unacceptably (as measured by d/c ratios and LOS) under the 2031 No Action scenario that results in the d/c ratio increasing by at least .01 (increases in d/c ratios of less than .01 are less than typical daily fluctuations and are not noticeable by drivers).”
Impact Threshold
The following analysis was completed to give show that an increase of less than 0.01 would not be noticeable by drivers. A Synchro network showing the intersection of Mercer Street and Fairview Avenue N was created with turning volumes for the PM peak hour. The Highway Capacity Manual LOS report determines the average delay experienced by drivers to be 85.9 seconds.
The d/c ratio on eastbound Mercer Street increasing by 0.01 equates to an additional 32 cars (i.e. one-hundredth of the total capacity). Therefore, 32 cars were added proportionally to the eastbound movements. The same growth factor (1.24 percent) was applied to the other approaches as well. The resulting Highway Capacity Manual LOS report determines the new average delay experienced by drivers to be 89.7 seconds, an increase of 3.8 seconds. Additional delay of this length would not be noticeable to drivers, and is within typical daily fluctuations. The HCM reports are included as Attachment 4.
To reduce model error, a technique known as the difference method was applied for traffic volumes. Rather than take the direct output from the 2031 model, the difference method calculates the growth between the base year and 2031 models, and adds that growth to an existing count. For example, assume a road has an existing count of 450 vehicles. If the base year model showed a volume of 400 vehicles and the future year model showed a volume of 550 vehicles, then 150 cars would be added to the existing count for a total of 600 cars.
The Difference Method
The increase in capacity for one-way streets is consistent with methodology recommended by the Florida Department of Transportation FDOT). Attachment 5 from FDOT’s 2009 Quality/Level of Service Handbook shows the relevant table.
Capacity Adjustments

SOUTH LAKE UNION HEIGHT AND DENSITY FINAL EIS APRIL 2012 4
Appendix E-3: Transit Analysis This appendix summarizes the transit analysis. All future year transit information comes from the City of Seattle travel model.
Existing Conditions The existing average headways reported in Table 3.13-1 were calculated using current King County Metro (KCM) schedules. Average headways are the ratio of the number of minutes in the time period to the number of busses expected over the time period. Note that within each time period, the actual headway will often vary.
The existing load factors reported in Tables 3.13-5 and 3.13-6 were provided by KCM (see Attachment 6). The peak hour for each route in each direction was chosen to reflect the highest load factor experienced over the peak period. Therefore, the time periods vary between routes as well as between directions of the same routes.
Future Year Analysis Future year analysis was conducted the same way for both the No Action and the Action Alternatives. Future transit operations are assessed using peak hour load factors. The City of Seattle travel model uses three hour peak periods, rather than one peak hour, so assumptions were made to factor the results to represent the peak hour. These assumptions are described below.
Since load factors are based on the number of seats available on the transit route during the peak commute hour, the capacity will change under 2031 conditions as headways change. The Seattle travel model does not explicitly model PM peak period transit trips (they are modeled as the reverse of the AM trips).
Table A.13-2 displays AM peak period transit route headways from the City of Seattle travel model for the base year and 2031 conditions. Since headways can vary over the course of the peak period, weighted headways were estimated. The travel model breaks routes into multiple pieces, for example some with 15 minute headways and others with 30 minute headways. Headways are weighted based upon the ridership volume for each piece so if the 15 minute headway busses have higher ridership, the headway will be weighted more heavily toward the 15 minute headway than the 30 minute headway. An example (using Route 5 SB) is provided below to illustrate. There are 298 passengers at 20 minute headways, 1,234 passengers at 30 minute headways, and 103 passengers at 120 minute headways.

SOUTH LAKE UNION HEIGHT AND DENSITY FINAL EIS APRIL 2012 5
𝑊𝑒𝑖𝑔ℎ𝑡𝑒𝑑 𝐻𝑒𝑎𝑑𝑤𝑎𝑦 =(20 ∗ 298) + (30 ∗ 1234) + (120 ∗ 103)
(298 + 1234 + 103)= 34
These weighted headways are assumed to remain constant over the entire peak period for this analysis. The following table shows that all headways are expected to decrease between the base year and 2031, with the exception of the Aurora RapidRide (replacing existing Route 358) SB which will remain constant at 6 minute headways.
Table A3.13-2 NO ACTION ALTERNATIVE: SOUTH LAKE UNION AM PEAK PERIOD TRANSIT
WEIGHTED HEADWAYS
Route Termini Locations
Base Year Headway
2031 Headway
NB SB NB SB
5 Downtown, Shoreline 33 34 26 32
8 Uptown, Rainier Valley 30 30 14 16
16 Downtown, Northgate 20 20 17 17
17 Downtown, Loyal Heights 23 21 17 15
25 Downtown, Laurelhurst 49 45 26 26
26 Green Lake, Tukwila 26 27 17 14
28 Downtown, Broadview 30 30 17 24
66 Downtown, Northgate 30 30 26 26
70 Downtown, University District 15 15 10 10
RapidRide
Downtown, Aurora Village Transit Center
15 6 6 6
Source: Fehr & Peers, 2010 The underlying principle used to estimate capacity is that the change in headways has an inverse relationship to the change in capacity. For example, a bus route running 35-seat busses on 30 minute headways offers 70 seats per hour. The same bus route running on 15 minute headways offers 140 seats per hour.
2031 𝐶𝑎𝑝𝑎𝑐𝑖𝑡𝑦 =𝐵𝑎𝑠𝑒 𝑌𝑒𝑎𝑟 𝐻𝑒𝑎𝑑𝑤𝑎𝑦
2031 𝐻𝑒𝑎𝑑𝑤𝑎𝑦∗ 𝐸𝑥𝑖𝑠𝑡𝑖𝑛𝑔 𝐶𝑎𝑝𝑎𝑐𝑖𝑡𝑦
To reduce model error, a technique known as the difference method was applied for transit ridership. Rather than take the direct output from the 2031 model, the difference method calculates the growth between the base year and 2031 models, and adds that growth to an existing count.
SOUTH LAKE UNION HEIGHT AND DENSITY FINAL EIS APRIL 2012 6
𝐹𝑜𝑟𝑒𝑐𝑎𝑠𝑡𝑒𝑑 𝑅𝑖𝑑𝑒𝑟𝑠ℎ𝑖𝑝= 𝐸𝑥𝑖𝑠𝑡𝑖𝑛𝑔 𝑅𝑖𝑑𝑒𝑟𝑠ℎ𝑖𝑝 + (2031 𝑀𝑜𝑑𝑒𝑙 𝑅𝑖𝑑𝑒𝑟𝑠ℎ𝑖𝑝− 𝐵𝑎𝑠𝑒 𝑌𝑒𝑎𝑟 𝑀𝑜𝑑𝑒𝑙 𝑅𝑖𝑑𝑒𝑟𝑠ℎ𝑖𝑝)
Ridership in the City of Seattle travel model is available for the peak period only. The peak hour of transit is often assumed to contain approximately 40 percent of peak period ridership. This figure was confirmed as a reasonable average, given that KCM data indicates 44 percent of AM peak period (6-9 AM) ridership and 35 percent of PM peak period (3:15-6:30 PM) ridership occurs within the respective peak hours. Therefore, peak period ridership was multiplied by 0.4 to arrive at peak hour ridership.
𝑃𝑒𝑎𝑘 𝐻𝑜𝑢𝑟 𝑅𝑖𝑑𝑒𝑟𝑠ℎ𝑖𝑝 = 𝑃𝑒𝑎𝑘 𝑃𝑒𝑟𝑖𝑜𝑑 𝑅𝑖𝑑𝑒𝑟𝑠ℎ𝑖𝑝 ∗ 0.4
The previous methods were used for all transit lines that appear in both the base year and future year travel models. Ridership for new routes was estimated using direct model output since the difference method correction cannot be applied to routes that do not have existing conditions ridership estimates. The same peak factor of 40 percent was used to calculate peak hour ridership. The new lines are listed below:
• Route 21: Arbor Heights to Downtown Seattle
• Route 29: Woodland Park to Downtown Seattle
• Route 56: Alki/West Seattle to South Lake Union
• Route 121: Burien to Downtown Seattle
• Route 308: Lake Forest Park to Downtown Seattle
• Route 313: Bothell to Uptown
• Route 316: Shoreline to Uptown
Capacities for the future lines were not available from KCM. Therefore, the project team made assumptions about the size of the busses that would run based upon the estimated ridership. Bus capacity does vary among the KCM fleet, but KCM plans to purchase only low-floor busses in the future. The articulated busses have 56 seats and the standard busses have 35 seats. Lines with at least 700 riders per peak period are assumed to run 56-seat busses, while lines with fewer than 700 riders per peak period are assumed to run 35-seat busses. These assumptions are based on the types of busses that serve existing routes with higher and lower ridership.

SOUTH LAKE UNION HEIGHT AND DENSITY FINAL EIS APRIL 2012 7
Using these assumptions and future headways, capacity was estimated for the new lines, as follows.
𝑃𝑒𝑎𝑘 𝐻𝑜𝑢𝑟 𝐶𝑎𝑝𝑎𝑐𝑖𝑡𝑦 =60 𝑚𝑖𝑛𝑢𝑡𝑒𝑠
𝑊𝑒𝑖𝑔ℎ𝑡𝑒𝑑 𝐻𝑒𝑎𝑑𝑤𝑎𝑦∗ 𝑁𝑢𝑚𝑏𝑒𝑟 𝑜𝑓 𝑠𝑒𝑎𝑡𝑠 𝑜𝑛 𝑏𝑢𝑠
Off-Peak Headways The UVTN calls for 15 minute frequencies 18 hours a day, every day of the week. Since the travel model only provides headway information for the AM peak hour, headways were extrapolated for other times of the day. The change in headway between the base year and 2030 was applied to existing midday headways.
Table A3.13-3 NO ACTION ALTERNATIVE: SOUTH LAKE UNION MIDDAY TRANSIT WEIGHTED
HEADWAYS
Route Termini Locations
Base Year Midday
Headway
Change in Headway
Between Base Year and 2031
2031 Estimated Headway
NB SB NB SB NB SB
5 Downtown, Shoreline 15 15 0.80 0.96 12 14
8 Uptown, Rainier Valley 15 15 0.47 0.52 7 8
16 Downtown, Northgate 20 20 0.87 0.87 17 17
17 Downtown, Loyal Heights
30 30 0.76 0.73 23 22
25 Downtown, Laurelhurst 65 65 0.53 0.58 35 38
26 Green Lake, Tukwila 29 29 0.67 0.54 19 16
28 Downtown, Broadview 30 30 0.58 0.78 17 23
66 Downtown, Northgate 30 30 0.87 0.87 26 26
70 Downtown, University District
15 15 0.69 0.69 10 10
RapidRide
Downtown, Aurora Village Transit Center
9 9 0.40 1.00 4 9
Source: Fehr & Peers, 2010 This analysis indicated that Routes 16, 17, 25, 26, 28, and 66 would not meet the UVTN frequency goals due to their midday schedules. Of the remaining routes, the following indicated that they would not meet other UVTN frequency goals:
• Route 70 does not operate on Sundays.

SOUTH LAKE UNION HEIGHT AND DENSITY FINAL EIS APRIL 2012 8
• Route 5 currently has approximately 30 minute headways on Sundays. The expected decrease in headway (0.80 NB and 0.96 SB) would not bring the headway to 15 minutes.
• Route 8 very narrowly misses the goals. It currently has approximately 30 minute headways on Sundays. The expected decrease in SB headway (0.52) would not bring the headway to 15 minutes.
Mitigation Transit mitigation was considered independently of any changes in trip generation and mode share. If the transit ridership remained the same as is expected under the Action Alternatives, then one to two busses per peak hour could be added to the routes with unacceptable load factors to bring them to an acceptable level. The following table details the calculations. The size of bus assumed for each route is the same as was assumed for the original Action Alternatives analysis.

SOUTH LAKE UNION HEIGHT AND DENSITY FINAL EIS APRIL 2012 9
Table A3.13-4 SOUTH LAKE UNION TRANSIT MITIGATION
Route Termini Locations Peak Hour Ridership
Peak Hour Capacity
Unmitigated Peak Hour
Factor
Minimum Required Capacity
Assumed bus size
Additional busses
required
Mitigated Load Factor
21 NB Downtown, Arbor Heights 520 386 1.35 416 56 1 1.18
21 SB Downtown, Arbor Heights 520 386 1.35 416 56 1 1.18 28 NB Downtown, Broadview 240 171 1.40 192 56 1 1.06
29 NB Downtown, Woodland Park 120 80 1.49 96 35 1 1.04 29 SB Downtown, Woodland Park 144 80 1.79 115 35 1 1.25
56 NB South Lake Union, West Seattle 396 258 1.53 317 56 2 1.07 Source: Fehr & Peers, 2010

SOUTH LAKE UNION HEIGHT AND DENSITY FINAL EIS APRIL 2012 10
Appendix E-4: MXD Tool Trip Generation This appendix contains detailed background information on the enhanced trip generation tool used for this analysis. The complete MXD report is included as Attachment 7.
Model Validation To ensure the accuracy of the MXD model, a set of 16 independent mixed use sites that were not included in the 239 initial model development MXD sites were tested to validate the model. Among the validation sites, use of the MXD model produced superior statistical performance when comparing the model results to observed data than are found when using traditional ITE methods. Specifically, the MXD model had a significantly lower root mean squared error (RMSE) and higher pseudo-R squared than traditional ITE methods when comparing estimated to observed external vehicle trips. Estimates from the ITE Trip Generation Handbook had an RMSE of 40% and pseudo-R squared of 0.58 (i.e., the ITE method only explains about 58 percent of the variability in external vehicle trips), modified estimates using ITE's traditional trip internalization techniques had an RMSE of 32% and pseudo-R squared of 0.73, whereas modified estimates using the MXD model had an RMSE of only 26% and pseudo-R squared of 0.82.
Trip Generation Tables Table A3.13-5 summarizes the daily, AM, and PM trip generation for all four alternatives. Mitigated trip generation is also shown for the three action alternatives. The following table is a more detailed version of Tables 3.13-8 and 3.13-16
ITE gross trips are generally based on vehicle trip generation data from suburban development projects with very little transit, pedestrian, or bicycle trip generation. In this case, gross trips were estimated using the “High Rise Condo – ITE 232,”, “Shopping Center – ITE 820,” and “General Office – ITE 710” land use types. The MXD model estimates the number of internal trips and external trips made by auto, pedestrian, bicycle, and transit by calculating the probability that a gross ITE trip will use one of these alternative modes. When this calculation is made, the vehicle-trip is converted into a person-trip. The MXD model assumed an ITE average vehicle occupancy of 1.1 persons per vehicle. This means that one vehicle trip shifted to another mode becomes 1.1 person-trips. Therefore, the sum of the auto and non-auto trips will be greater than the ITE gross trips.

SOUTH LAKE UNION HEIGHT AND DENSITY FINAL EIS APRIL 2012 11
Mode share must be calculated using the same unit of trips (i.e. vehicle-trips or person-trips). Therefore, the mode share is calculated before the conversion factor is applied to internal, bicycle, pedestrian, and transit trips.

SOUTH LAKE UNION HEIGHT AND DENSITY FINAL EIS APRIL 2012 12
Table A3.13-5 TRIP GENERATION BY ALTERNATIVE
Alternative
Daily PM Peak AM Peak
Auto Trips
(mode share %)
Non-auto Trips (mode share %) Auto Trips
(mode share %)
Non-auto Trips (mode share %) Auto Trips
(mode share %)
Non-auto Trips (mode share %)
Internal, Bike & Pedestrian Transit
Internal, Bike & Pedestrian Transit
Internal, Bike & Pedestrian Transit
No Action Alternative - Current Zoning 108,946 (49.4%)
70,540 (29.1%)
52,337 (21.6%)
12,648 (51.4%)
7,279 (26.9%)
6,091 (21.7%)
11,285 (56.2%)
4,688 (21.2%)
4,991 (22.6%)
UN
MIT
IGA
TED
Alternative 1
- Maximum Increases to Height and Density
136,973 (48.3%)
93,828 (30.1%)
67,509 (21.6%)
15,554 (50.5%)
9,429 (27.8%)
7,371 (21.7%)
13,262 (55.6%)
5,722 (21.8%)
5,945 (22.6%)
Alternative 2
- Mid-Range Increases to Height and Density
136,888 (48.3%)
93,908 (30.1%)
67,509 (21.6%)
15,548 (50.4%)
9,435 (27.8%)
7,371 (21.7%)
13,257 (55.5%)
5,728 (21.8%)
5,944 (22.6%)
Alternative 3
- Moderate Increases to Height and Density
117,326 (48.1%)
81,403 (30.3%)
57,855 (21.6%)
13,605 (50.3%)
8,334 (28.0%)
6,449 (21.7%)
12,239 (55.2%)
5,411 (22.2%)
5,501 (22.6%)
MIT
IGA
TED
Alternative 1
- Maximum Increases to Height and Density
108,027
(38.1%)
115,933 (37.2%)
77,236 (24.8%)
12,244 (39.7%)
11,835 (34.9%)
8,606 (25.4%)
10,787 (45.2%)
6,947 (26.5%)
7,443 (28.3%)
Alternative 2
- Mid-Range Increases to Height and Density
107,936
(38.1%)
116,030 (37.2%)
77,235 (24.8%)
12,236 (39.7%)
11,844 (34.9%)
8,606 (25.4%)
10,782 (45.2%)
6,953 (26.5%)
7,442 (28.3%)
Alternative 3
- Moderate Increases to Height and Density
92,607
(38.0%)
100,310 (37.4%)
66,139 (24.6%)
10,715 (39.6%)
10,435 (35.1%)
7,526 (25.3%)
9,951 (44.9%)
6,556 (26.9%)
6,873 (28.2%)
SOUTH LAKE UNION HEIGHT AND DENSITY FINAL EIS APRIL 2012 13
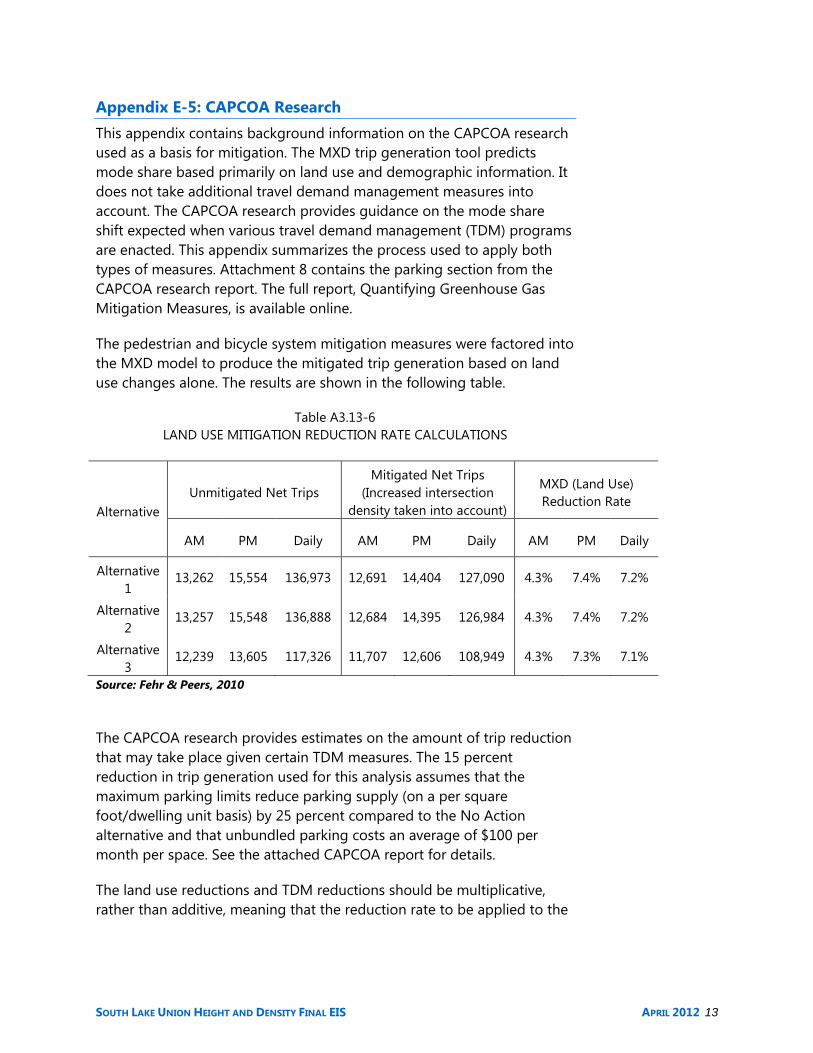
Appendix E-5: CAPCOA Research This appendix contains background information on the CAPCOA research used as a basis for mitigation. The MXD trip generation tool predicts mode share based primarily on land use and demographic information. It does not take additional travel demand management measures into account. The CAPCOA research provides guidance on the mode share shift expected when various travel demand management (TDM) programs are enacted. This appendix summarizes the process used to apply both types of measures. Attachment 8 contains the parking section from the CAPCOA research report. The full report, Quantifying Greenhouse Gas Mitigation Measures, is available online.
The pedestrian and bicycle system mitigation measures were factored into the MXD model to produce the mitigated trip generation based on land use changes alone. The results are shown in the following table.
Table A3.13-6 LAND USE MITIGATION REDUCTION RATE CALCULATIONS
Alternative Unmitigated Net Trips
Mitigated Net Trips (Increased intersection
density taken into account)
MXD (Land Use) Reduction Rate
AM PM Daily AM PM Daily AM PM Daily
Alternative 1
13,262 15,554 136,973 12,691 14,404 127,090 4.3% 7.4% 7.2%
Alternative 2
13,257 15,548 136,888 12,684 14,395 126,984 4.3% 7.4% 7.2%
Alternative 3
12,239 13,605 117,326 11,707 12,606 108,949 4.3% 7.3% 7.1%
Source: Fehr & Peers, 2010
The CAPCOA research provides estimates on the amount of trip reduction that may take place given certain TDM measures. The 15 percent reduction in trip generation used for this analysis assumes that the maximum parking limits reduce parking supply (on a per square foot/dwelling unit basis) by 25 percent compared to the No Action alternative and that unbundled parking costs an average of $100 per month per space. See the attached CAPCOA report for details.
The land use reductions and TDM reductions should be multiplicative, rather than additive, meaning that the reduction rate to be applied to the

SOUTH LAKE UNION HEIGHT AND DENSITY FINAL EIS APRIL 2012 14
mitigated net trips should be less than 15 percent. The following formula was used to identify the final TDM reduction percentage:
1 − (1 −𝑀𝑋𝐷 𝑟𝑒𝑑𝑢𝑐𝑡𝑖𝑜𝑛 𝑟𝑎𝑡𝑒) ∗ (1 − 𝑇𝐷𝑀 𝑟𝑒𝑑𝑢𝑐𝑡𝑖𝑜𝑛 𝑟𝑎𝑡𝑒)−𝑀𝑋𝐷 𝑟𝑒𝑑𝑢𝑐𝑡𝑖𝑜𝑛 𝑟𝑎𝑡𝑒
The following table shows the results. These reduction rates were applied to the unmitigated net trips above to identify the additional trips that should be subtracted from the mitigated net trips.
Table A3.13-7TDM MITIGATION REDUCTION RATE CALCULATIONS
Alternative
TDM Reduction Rate per CAPCOA Research
Additional Trip Reductions
Final Number of Trips
AM PM Daily AM PM Daily AM PM Daily
Alternative 1 14.4% 13.9% 13.9% 1,904 2,161 19,064 10,787 12,244 108,027
Alternative 2 14.4% 13.9% 13.9% 1,903 2,159 19,048 10,782 12,236 107,936
Alternative 3 14.3% 13.9% 13.9% 1,756 1,891 16,342 9,951 10,715 92,607 Source: Fehr & Peers, 2010

SOUTH LAKE UNION HEIGHT AND DENSITY FINAL EIS APRIL 2012 15
Appendix E-6: Commute Trip Reduction Surveys This appendix contains background information on the CTR programs in place in South Lake Union.
Attachment 9 contains the table of 16 companies with SOV rates and goals. Green indicates the company met their goal, yellow indicates they reduced their but did not meet their goal, and red indicates the rate increased. Attachment 10 contains the detailed reports used to create Table 3.13-7.

SOUTH LAKE UNION HEIGHT AND DENSITY FINAL EIS APRIL 2012 16
Appendix E-7: Comprehensive Plan Mode Share Goal Consistency This section describes the evaluation to determine consistency with the Seattle Comprehensive Plan mode split goals. The Comprehensive Plan sets the following two goals:
• South Lake Union work trips mode split: 50% non-SOV • South Lake Union resident trips mode split: 75% non-SOV
The trip generation analysis shown in Table 3.13-8 and the Seattle travel model’s estimate of SOV and HOV mode shares were used to determine the expected mode splits in 2031.
Under all three height and density alternatives, the project meets the first goal of at least 50 percent of South Lake Union work trips being made by non-SOV modes. However, the goal of 75 percent of all trips by South Lake Union residents being made by non-SOV modes is not met, as shown in Table A3.13-17. The mode shares of the three action alternative are closer to the goal than that of the No Action Alternative.
Table A3.13-17 SOUTH LAKE UNION RESIDENTS 2031 MODE SHARE
Alternative Total Auto Mode Share
(SOV & HOV) SOV Mode Share
No Action Alternative 49.4% 27.6%
Alternative 1 48.3% 27.0%
Alternative 2 48.3% 27.0%
Alternative 3 48.1% 26.9% Source: Fehr & Peers, 2010
Applying auto trip reduction rates correlated to the mitigation measures, the SOV mode share is reduced from approximately 27 percent to approximately 21 percent, which meets the Comprehensive Plan goal. Therefore, all three mitigated alternatives would meet the City’s mode share goals while the No Action Alternative would not. Details of these calculations are provided in the remainder of this appendix.
The Seattle travel model trip tables break trips down by type including home based work (HBW), home based non-work (HBNW), and non-home based (NHB). The model also breaks trips down by mode. The HBW trips were used to determine the mode share for the goal of at least 50 percent

SOUTH LAKE UNION HEIGHT AND DENSITY FINAL EIS APRIL 2012 17
non-SOV work trips into South Lake Union (Goal 1). All three trip types were used to determine mode share for the goal of at least 75 percent non-SOV total trips by South Lake Union residents (Goal 2). The mode shares were used to approximate SOV and HOV use, since the MXD model does not distinguish between the two.
The following table shows the number of person-trips made by SOV, HOV2 (2 passengers), and HOV3+ (3 or more passengers). Since the MXD results do not distinguish SOV from HOV trips, these proportions were applied to the MXD projection of total auto share. All alternatives have less than 50 percent SOV mode share so the first goal from the Comprehensive Plan is met.
Comprehensive Plan Goal 1
Table A3.13-8 COMPREHENSIVE PLAN MODE SHARE GOAL 1: AUTO OCCUPANCY
CALCULATION
Mode Work Trips to SLU Percentage of Total Auto Trips
SOV 28,105 86.1% HOV2 3,159 9.7%
HOV3+ 1,368 4.2% Total 32,632 100.0%
Source: City of Seattle travel model, 2010
Table A3.13-9 COMPREHENSIVE PLAN MODE SHARE GOAL 1: SOV CALCULATION
Mode Total Auto Trips per MXD SOV Trips
No Action 49.4% 42.5%
Alternative 1 48.3% 41.6%
Alternative 2 48.3% 41.6%
Alternative 3 48.1% 41.4% Source: City of Seattle travel model, 2010
A similar method to that used for Goal 1 is used here. The sum of all three trip types originating in South Lake Union is calculated. This is an approximation of the trips made by South Lake Union residents.
Comprehensive Plan Goal 2
SOUTH LAKE UNION HEIGHT AND DENSITY FINAL EIS APRIL 2012 18
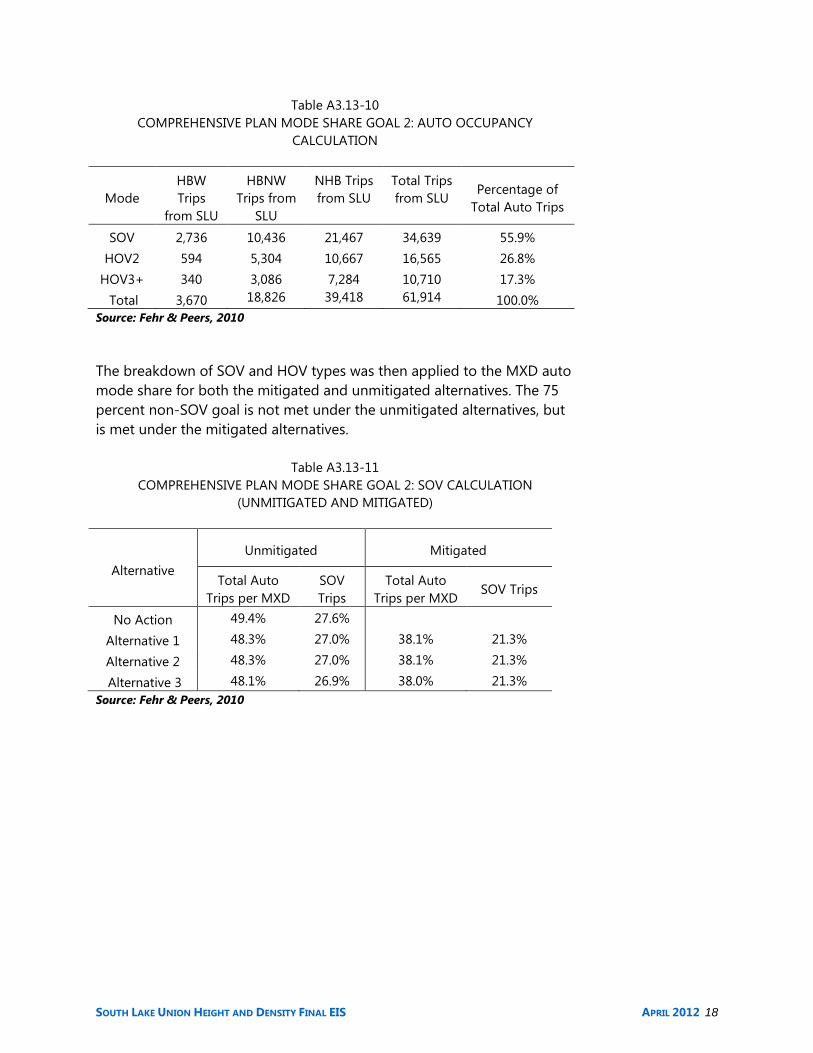
Table A3.13-10 COMPREHENSIVE PLAN MODE SHARE GOAL 2: AUTO OCCUPANCY
CALCULATION
Mode HBW Trips
from SLU
HBNW Trips from
SLU
NHB Trips from SLU
Total Trips from SLU
Percentage of Total Auto Trips
SOV 2,736 10,436 21,467 34,639 55.9% HOV2 594 5,304 10,667 16,565 26.8%
HOV3+ 340 3,086 7,284 10,710 17.3% Total 3,670 18,826 39,418 61,914 100.0%
Source: Fehr & Peers, 2010
The breakdown of SOV and HOV types was then applied to the MXD auto mode share for both the mitigated and unmitigated alternatives. The 75 percent non-SOV goal is not met under the unmitigated alternatives, but is met under the mitigated alternatives.
Table A3.13-11 COMPREHENSIVE PLAN MODE SHARE GOAL 2: SOV CALCULATION
(UNMITIGATED AND MITIGATED)
Alternative Unmitigated Mitigated
Total Auto Trips per MXD
SOV Trips
Total Auto Trips per MXD
SOV Trips
No Action 49.4% 27.6%
Alternative 1 48.3% 27.0% 38.1% 21.3%
Alternative 2 48.3% 27.0% 38.1% 21.3%
Alternative 3 48.1% 26.9% 38.0% 21.3% Source: Fehr & Peers, 2010
SOUTH LAKE UNION HEIGHT AND DENSITY FINAL EIS APRIL 2012 19
Appendix E-8: Growth Management Act Concurrency This section describes the evaluation to determine concurrency with Growth Management Act concurrency standards.
Methodology The Seattle Comprehensive Plan uses peak hour volume-to-capacity (v/c) ratios across designated screenlines to assess arterial LOS for GMA Concurrency assessment. The v/c ratio is defined as the ratio of measured traffic volumes to calculated roadway capacity1
The screenline analysis was based upon methods outlined in the Department of Planning and Development Director’s Rule 5-2009 which summarizes the 2008 traffic volumes and capacities at each of the City’s screenlines. From this document, the capacities of the key facilities were determined and the v/c ratio was calculated using the most recent traffic counts available from the City of Seattle.
. Since busses (the primary transit mode) operate in the same roadways as general traffic, the City uses the same screenline analysis for transit. Within the traffic impact analysis area (bounded by S King Street to the south, the ship canal to the north, Elliott Avenue to the west and Broadway to the east), screenlines run along four corridors: the Ship Canal, Fairview Avenue, S Jackson Street and I-5. Figure 3.13-24 in the Draft EIS shows the traffic impact analysis area and the screenlines it contains.
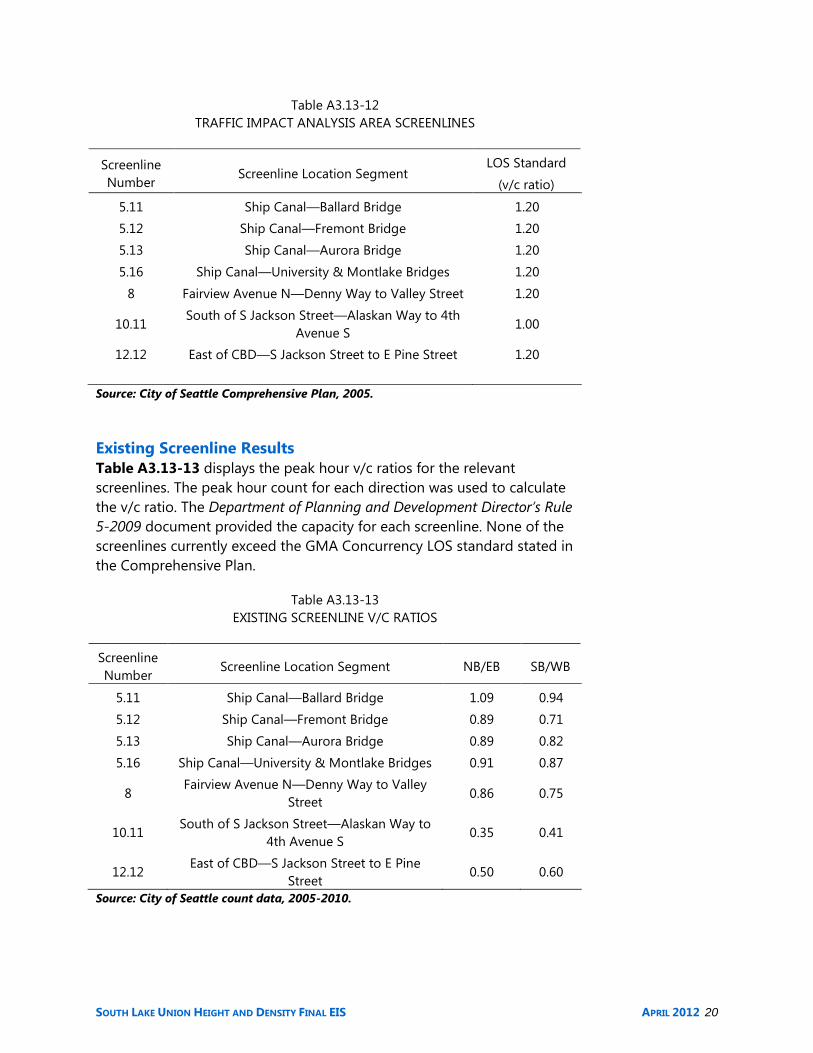
Concurrency Standard As previously described, the Seattle Comprehensive Plan uses v/c ratios across designated screenlines to assess arterial LOS. Each screenline is assigned a maximum acceptable v/c threshold. In the event a screenline’s measurement approaches this threshold, the Comprehensive Plan calls for vehicular demand reduction strategies to be pursued before increasing capacity. Table A3.13-12 displays the screenlines and their respective v/c thresholds in detail.
1 As noted above, v/c ratios measure vehicles that pass a given point during the peak hour and do not consider queuing. Demand/capacity ratios were not used for GMA concurrency analysis since the Comprehensive Plan specifies the use of v/c ratios.
SOUTH LAKE UNION HEIGHT AND DENSITY FINAL EIS APRIL 2012 20
Table A3.13-12 TRAFFIC IMPACT ANALYSIS AREA SCREENLINES
Screenline Number
Screenline Location Segment LOS Standard
(v/c ratio)
5.11 Ship Canal—Ballard Bridge 1.20
5.12 Ship Canal—Fremont Bridge 1.20
5.13 Ship Canal—Aurora Bridge 1.20
5.16 Ship Canal—University & Montlake Bridges 1.20
8 Fairview Avenue N—Denny Way to Valley Street 1.20
10.11 South of S Jackson Street—Alaskan Way to 4th
Avenue S 1.00
12.12 East of CBD—S Jackson Street to E Pine Street 1.20
Source: City of Seattle Comprehensive Plan, 2005.
Existing Screenline Results Table A3.13-13 displays the peak hour v/c ratios for the relevant screenlines. The peak hour count for each direction was used to calculate the v/c ratio. The Department of Planning and Development Director’s Rule 5-2009 document provided the capacity for each screenline. None of the screenlines currently exceed the GMA Concurrency LOS standard stated in the Comprehensive Plan.
Table A3.13-13 EXISTING SCREENLINE V/C RATIOS
Screenline Number
Screenline Location Segment NB/EB SB/WB
5.11 Ship Canal—Ballard Bridge 1.09 0.94
5.12 Ship Canal—Fremont Bridge 0.89 0.71
5.13 Ship Canal—Aurora Bridge 0.89 0.82
5.16 Ship Canal—University & Montlake Bridges 0.91 0.87
8 Fairview Avenue N—Denny Way to Valley
Street 0.86 0.75
10.11 South of S Jackson Street—Alaskan Way to
4th Avenue S 0.35 0.41
12.12 East of CBD—S Jackson Street to E Pine
Street 0.50 0.60
Source: City of Seattle count data, 2005-2010.

SOUTH LAKE UNION HEIGHT AND DENSITY FINAL EIS APRIL 2012 21
No Action Alternative Screenline Results Table A3.13-14 displays the v/c ratios for the relevant screenlines. As shown, the Ballard Bridge screenline exceeds the Comprehensive Plan standard in both directions. The Fairview Avenue N screenline exceeds the threshold of significance in the westbound direction only.
Table A3.13-14 NO ACTION ALTERNATIVE: SCREENLINE V/C RATIOS
Screenline Number
Screenline Location Segment NB/EB SB/WB
5.11 Ship Canal—Ballard Bridge 1.35 1.24 5.12 Ship Canal—Fremont Bridge 1.11 0.96
5.13 Ship Canal—Aurora Bridge 1.08 0.98
5.16 Ship Canal—University & Montlake Bridges 1.14 1.07
8 Fairview Avenue N—Denny Way to Valley
Street 1.02 1.21
10.11 South of S Jackson Street—Alaskan Way to
4th Avenue S 0.52 0.72
12.12 East of CBD—S Jackson Street to E Pine
Street 0.45 0.64
Source: Fehr & Peers, 2010
Action Alternatives Screenline Results Table A3.13-15 displays the v/c ratios for the screenlines within the traffic impact analysis area for all four alternatives. The 2031 travel model provided the volumes and capacities for all four future year scenarios.
As shown in the bold text, two screenlines exceed the Comprehensive Plan’s v/c ratios under the three height and density rezone alternatives. These are the same two screenlines that exceeded the v/c ratio under the No Action Alternative. The screenline analysis indicates that the GMA concurrency requirements will not be met under 2031 conditions with or without the height and density rezone.

SOUTH LAKE UNION HEIGHT AND DENSITY FINAL EIS APRIL 2012 22
Table A3.13-15 ACTION ALTERNATIVES COMPARISON: SCREENLINE V/C RATIOS
No Action Alternative Alternative 1 Alternative 2 Alternative 3
Screenline Number Screenline Location Segment
NB/EB SB/WB NB/EB SB/WB NB/EB SB/WB NB/EB SB/WB
5.11 Ship Canal—Ballard Bridge 1.35 1.24 1.37 1.25 1.38 1.26 1.36 1.24
5.12 Ship Canal—Fremont Bridge 1.11 0.96 1.13 0.99 1.13 0.98 1.11 0.98
5.13 Ship Canal—Aurora Bridge 1.08 0.98 1.10 0.99 1.10 0.99 1.09 0.98
5.16 Ship Canal—University & Montlake Bridges 1.14 1.07 1.16 1.09 1.16 1.09 1.15 1.08
8 Fairview Avenue N—Denny Way to Valley
Street 1.02 1.21 1.05 1.22 1.05 1.22 1.03 1.21
10.11 South of S Jackson Street—Alaskan Way to 4th
Avenue S 0.52 0.72 0.52 0.73 0.52 0.73 0.52 0.72
12.12 East of CBD—S Jackson Street to E Pine Street 0.45 0.64 0.46 0.66 0.46 0.66 0.45 0.65 Source: Fehr & Peers, 2010

SOUTH LAKE UNION HEIGHT AND DENSITY FINAL EIS APRIL 2012 23
Mitigated Action Alternatives Screenline Results Following the mitigation measures discussed in Chapter 3.13, the screenlines were re-evaluated. The results are shown in Table A3.13-16. The Ballard Bridge screenline continues to exceed the standard under all three mitigated alternatives. However, the v/c ratios under the mitigated scenarios are all less than or equal to the v/c ratios under the No Action Alternative. Therefore, the mitigated alternatives (in particular, Alternative 3) perform better than the No Action Alternative in terms of GMA concurrency.
The Fairview Avenue N screenline exceeds the Comprehensive Plan standard in the westbound direction under the No Action Alternative and Alternative 1. Alternatives 2 and 3 meet GMA concurrency requirements since they equal the maximum acceptable threshold.

SOUTH LAKE UNION HEIGHT AND DENSITY FINAL EIS APRIL 2012 24
Table A3.13-16
MITIGATED ACTION ALTERNATIVES COMPARISON: SCREENLINE V/C RATIOS
No Action Alternative Alternative 1 Alternative 2 Alternative 3
Screenline Number Screenline Location Segment
NB/EB SB/WB NB/EB SB/WB NB/EB SB/WB NB/EB SB/WB
5.11 Ship Canal—Ballard Bridge 1.35 1.24 1.35 1.23 1.35 1.23 1.34 1.22
5.12 Ship Canal—Fremont Bridge 1.11 0.96 1.10 0.96 1.10 0.95 1.08 0.94
5.13 Ship Canal—Aurora Bridge 1.08 0.98 1.07 0.97 1.07 0.97 1.06 0.97
5.16 Ship Canal—University & Montlake Bridges 1.14 1.07 1.13 1.06 1.13 1.06 1.12 1.05
8 Fairview Avenue N—Denny Way to Valley
Street 1.02 1.21 1.02 1.21 1.02 1.20 1.02 1.20
10.11 South of S Jackson Street—Alaskan Way to 4th
Avenue S 0.52 0.72 0.51 0.71 0.51 0.71 0.51 0.70
12.12 East of CBD—S Jackson Street to E Pine Street 0.45 0.64 0.44 0.64 0.44 0.64 0.44 0.63 Source: Fehr & Peers, 2010

SOUTH LAKE UNION HEIGHT AND DENSITY FINAL EIS APRIL 2012 25