seat belt use on north dakota rural roads: 2015
TRANSCRIPT

Department Publication No. 285 September 2015
Seat Belt Use on North Dakota Rural Roads: 2015
Prepared by:
Kimberly Vachal, Ph.D.
Laurel Benson, Research Project Specialist
Disclaimer
The contents presented in this report are the sole responsibility of the Upper Great Plains
Transportation Institute and the authors.
North Dakota State University does not discriminate on the basis of age, color, disability, gender expression/identity, genetic information, marital status, national origin, public assistance status, race, religion, sex, sexual orientation, or status as a U.S. veteran. Direct inquiries to: Equal Opportunity Specialist, Old Main 201, 701-231-7708 or Title IX/ADA Coordinator, Old Main 102, 701-231-6409.
TABLE OF CONTENTS
1. INTRODUCTION ...................................................................................................................1
2. METHODOLOGY ................................................................................................................3
3. RESULTS ...............................................................................................................................5
3.1 Driver Rural Seat Belt Use ................................................................................................7
3.1.1 Road Type ................................................................................................................7
3.1.2 Region ...................................................................................................................11
3.1.3 Driver Gender .......................................................................................................12
3.1.4 Vehicle Type .........................................................................................................15
3.2 Passenger Rural Seat Belt Use ........................................................................................17
3.3 Motorcycle Helmet Use ..................................................................................................20
4. DISCUSSION .......................................................................................................................22
REFERENCES .............................................................................................................................24
APPENDIX: SEAT BELT OBSERVATION TRAINING GUIDE ........................................25
LIST OF FIGURES
Figure 1.1 Seat Belt Use in Injury Crashes (includes Fatal Injuries), by Road Type ..................1
Figure 1.2 Seat Belt Use Rate in All Crashes, by Type of Injury ................................................2
Figure 1.3 Crash Type, VMT Incidence Rate Index ....................................................................2
Figure 2.1 Rural Seat Belt Regions ..............................................................................................3
Figure 2.2 Rural Seat Belt Counties .............................................................................................4
Figure 3.1 Driver Seat Belt Use by Road Type ............................................................................7
Figure 3.2 Driver Seat Belt Use by Road Type and County, 2013-2015 .....................................8
Figure 3.3 Highway Seat Belt Use by County, 2015 ...................................................................9
Figure 3.4 Highway Driver Seat Belt Use by Region: 2009-2015 .............................................11
Figure 3.5 Driver Seat Belt Use by Gender and Road Type: 2010-2015 ...................................12
Figure 3.6 Observed Rural Road Passenger Vehicle Fleet, by Vehicle Type ............................15
Figure 3.7 Driver Seat Belt Use by Vehicle Type ......................................................................16
Figure 3.8 Seat Belt Use in Passenger Observation Cases .........................................................17
Figure 3.9 Passenger Seat Belt Use by Road Type and Gender, Previous 3-Year Average
and Current Year .......................................................................................................18
Figure 3.10 Passenger Seat Belt Use by Road Type ....................................................................19
Figure 3.11 Passenger Observation Cases by Road Type ............................................................19
Figure 3.12 Driver Helmet use by Road Type .............................................................................20
Figure 3.13 Driver Helmet Use, Males on Rural Highways ........................................................21
LIST OF TABLES
Table 3.1 Observation Counts and Observation Site Counts by County: 2015 ..........................6
Table 3.2 Annual Observation of Highway Seat Belt Use by County ......................................10
Table 3.3 County Driver Seat Belt Use, by Road Type and Gender ........................................14
Table 3.4 Driver Seat Belt Use by Vehicle Type and Gender ..................................................16
Table 3.5 Driver Seat Belt Use by Vehicle Type, Gender, and Road Type .............................17
1
1. INTRODUCTION
North Dakota’s rural roads provide vital social and commercial links for a widely dispersed
population. The safety of these roadways is paramount in managing traffic assets to enhance the
state’s livability. Approximately two-thirds of the state’s travel, in vehicle-miles, takes place on
rural roads that interconnect small communities and join the rural geography to interstates,
principal state corridors, and urban centers (NDDOT). This level of rural driving is relatively
high considering only about a third of the nation’s travel occurs on rural roads (U.S. DOT). From
a safety perspective, this poses an inherent challenge because the risk for serious injury and death
on rural roads is relatively high compared to the risk on urban roads (U.S. DOT 2005, U.S. DOT
2009a). In North Dakota, crash reports from 2010 to 2014 show that nearly 82% of fatal crashes
and 89% of serious injury crashes – which includes those with fatal and disabling injuries –
occurred on non-interstate rural roads (NDDOT 2015).
With the understanding that seat belts are a relatively low-cost safety device, and are an easy
means of primary protection for occupants in passenger vehicles, North Dakota has chosen to
continue to measure seat belt use on non-interstate rural roads. Understanding tendencies and
trends in seat belt use on these rural roads is essential to wise decisions regarding efforts to
encourage seat belt use in the state. The U.S. Department of Transportation does work with states
to measure seat belt use through the long-standing annual National Occupant Protection Use
Survey (NOPUS).
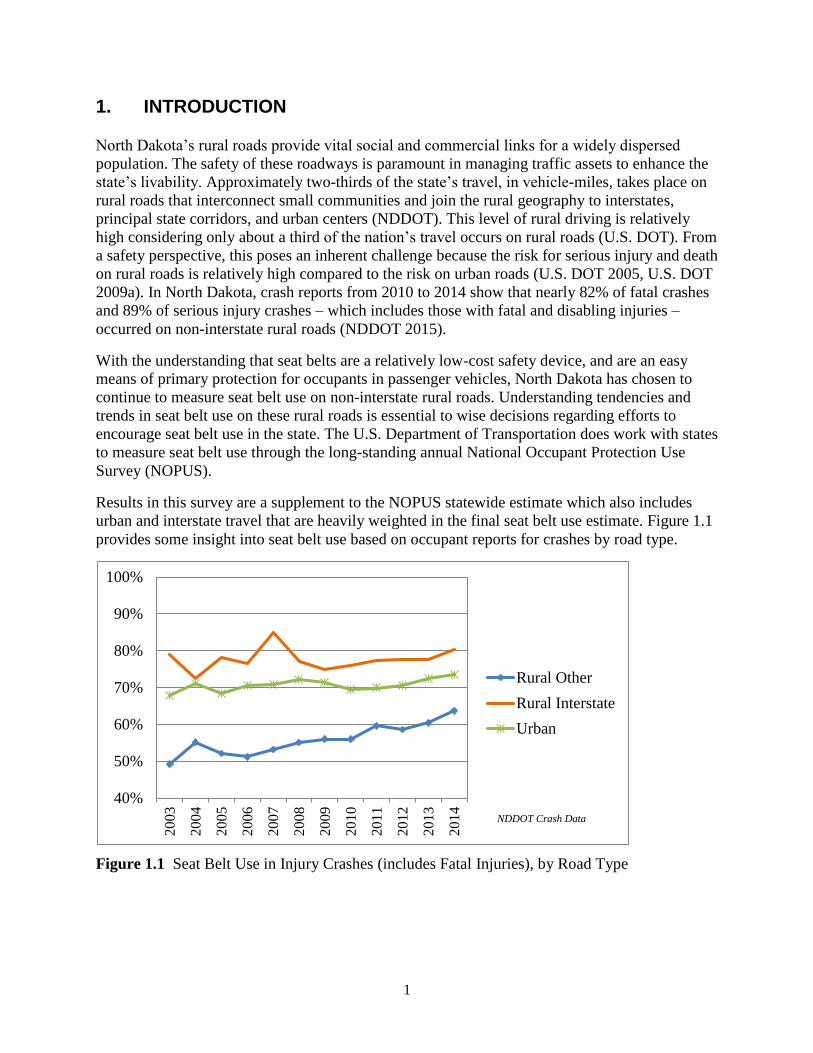
Results in this survey are a supplement to the NOPUS statewide estimate which also includes
urban and interstate travel that are heavily weighted in the final seat belt use estimate. Figure 1.1
provides some insight into seat belt use based on occupant reports for crashes by road type.
Figure 1.1 Seat Belt Use in Injury Crashes (includes Fatal Injuries), by Road Type
40%
50%
60%
70%
80%
90%
100%
20
03
20
04
20
05
20
06
20
07
20
08
20
09
20
10
20
11
20
12
20
13
20
14
Rural Other
Rural Interstate
Urban
NDDOT Crash Data

2
Figure 1.2 Seat Belt Use Rate in All Crashes, by Type of Injury
Although not a perfect reflection of use on the road types, trends do offer some insight for the
larger occupant population. Other perspective on the traffic crashes are offered in the seat belt
use rates by occupant injury outcome and crash incidence trends. The crash incidence is
categorized by the most serious injury outcome of a crash event to provide additional context
regarding traffic activity. The observation study of the larger occupant population reported on in
this study is a continuation of efforts to measure seat belt usage for all occupants on rural roads
in North Dakota.
Figure 1.3 Crash Type, VMT Incidence Rate Index
0%
10%
20%
30%
40%
50%
60%
70%
80%
90%
2003
2004
2005
2006
2007
2008
2009
2010
2011
2012
2013
2014
Use
Rat
e
None
Fatal
Disabling
Non-Disabling
Possible
0
2,000
4,000
6,000
8,000
10,000
12,000
14,000
16,000
18,000
20,000
0.60
0.70
0.80
0.90
1.00
1.10
1.20
2005
2006
2007
2008
2009
2010
2011
2012
2013
2014
Cra
sh E
ven
ts
Inci
den
ce I
ndex
, 3
-yr
Run
nin
g
Avg.
Total
None
Fatal
Disabling
Non-Disabling
Possible
Base Year=2003
NDDOT Crash Data
3
2. METHODOLOGY
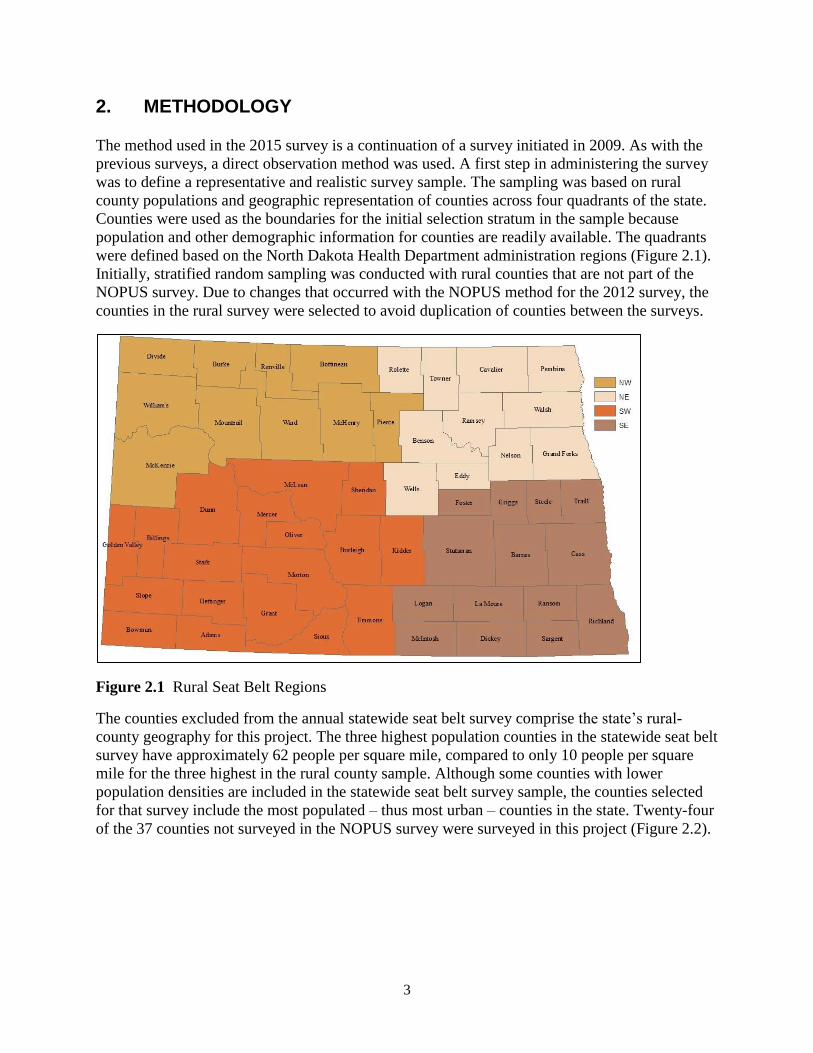
The method used in the 2015 survey is a continuation of a survey initiated in 2009. As with the
previous surveys, a direct observation method was used. A first step in administering the survey
was to define a representative and realistic survey sample. The sampling was based on rural
county populations and geographic representation of counties across four quadrants of the state.
Counties were used as the boundaries for the initial selection stratum in the sample because
population and other demographic information for counties are readily available. The quadrants
were defined based on the North Dakota Health Department administration regions (Figure 2.1).
Initially, stratified random sampling was conducted with rural counties that are not part of the
NOPUS survey. Due to changes that occurred with the NOPUS method for the 2012 survey, the
counties in the rural survey were selected to avoid duplication of counties between the surveys.
Figure 2.1 Rural Seat Belt Regions
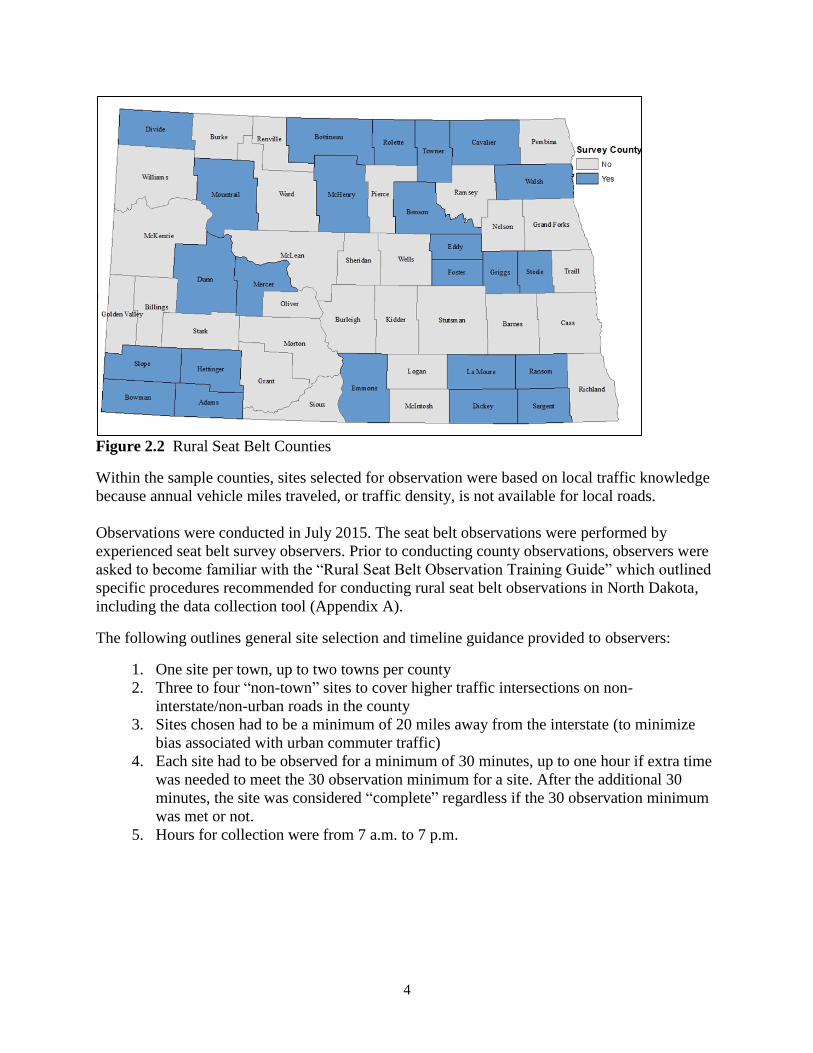
The counties excluded from the annual statewide seat belt survey comprise the state’s rural-
county geography for this project. The three highest population counties in the statewide seat belt
survey have approximately 62 people per square mile, compared to only 10 people per square
mile for the three highest in the rural county sample. Although some counties with lower
population densities are included in the statewide seat belt survey sample, the counties selected
for that survey include the most populated – thus most urban – counties in the state. Twenty-four
of the 37 counties not surveyed in the NOPUS survey were surveyed in this project (Figure 2.2).
4
Figure 2.2 Rural Seat Belt Counties
Within the sample counties, sites selected for observation were based on local traffic knowledge
because annual vehicle miles traveled, or traffic density, is not available for local roads.
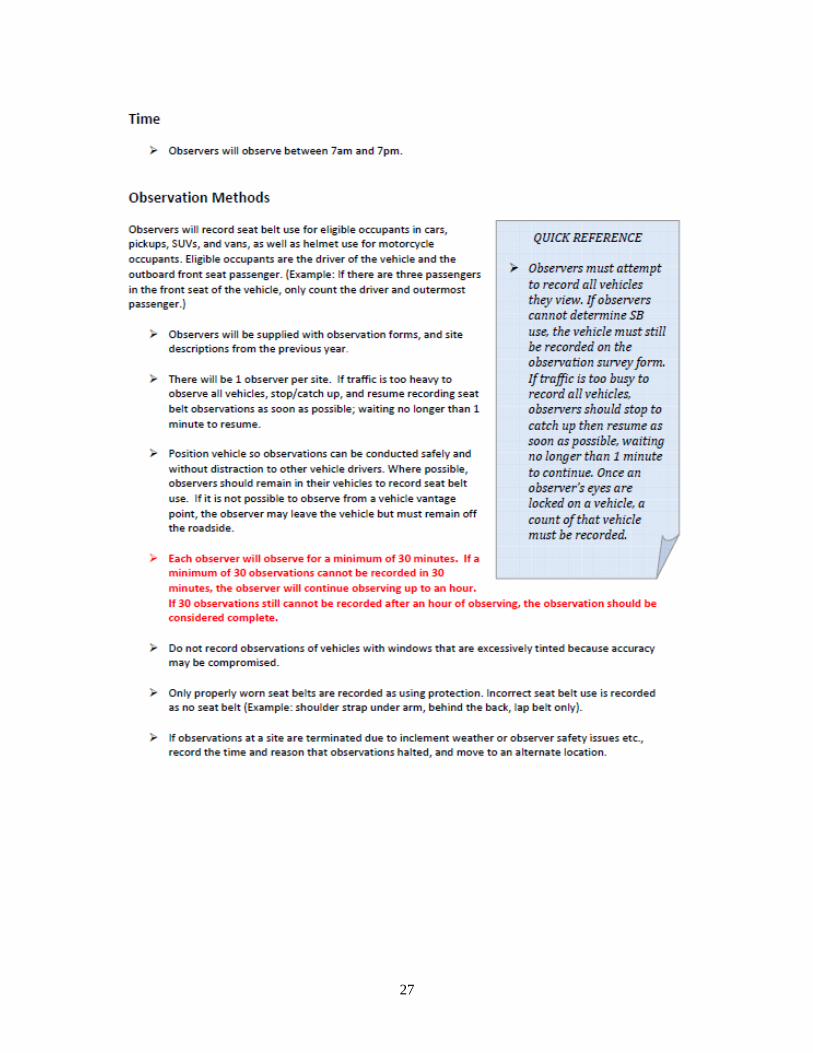
Observations were conducted in July 2015. The seat belt observations were performed by
experienced seat belt survey observers. Prior to conducting county observations, observers were
asked to become familiar with the “Rural Seat Belt Observation Training Guide” which outlined
specific procedures recommended for conducting rural seat belt observations in North Dakota,
including the data collection tool (Appendix A).
The following outlines general site selection and timeline guidance provided to observers:
1. One site per town, up to two towns per county
2. Three to four “non-town” sites to cover higher traffic intersections on non-
interstate/non-urban roads in the county
3. Sites chosen had to be a minimum of 20 miles away from the interstate (to minimize
bias associated with urban commuter traffic) 4. Each site had to be observed for a minimum of 30 minutes, up to one hour if extra time
was needed to meet the 30 observation minimum for a site. After the additional 30
minutes, the site was considered “complete” regardless if the 30 observation minimum
was met or not. 5. Hours for collection were from 7 a.m. to 7 p.m.
5
3. RESULTS
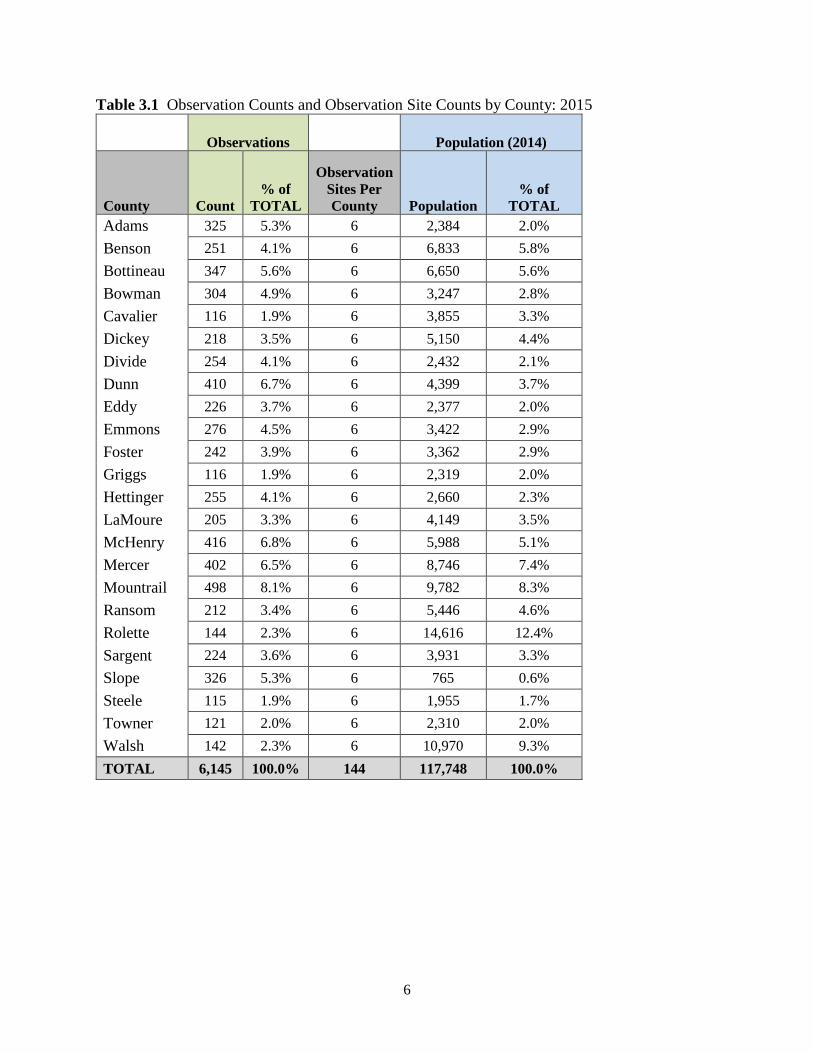
A total of 6,145 observations of driver seat belt use were collected during surveys conducted at
144 sites across the state. This includes 159 instances where driver seat belt use could not be
determined. These observations are not included when calculating driver seat belt use in this
report. Passenger seat belt use was also collected when possible. The limited information on
passenger use, which includes 1,487 observations, was used primarily to assess correlation with
driver use. This includes 64 instances where passenger seat belt use could not be determined.
These observations are not included when calculating passenger seat belt use in this report. The
non-response rates – defined as the number of cases where use could not be determined – were
low for both driver and occupant at 2.6% and 4.3% respectively. In addition to the observation
distribution by county, the following table also includes the county populations used for
weighted results highlighted in the following sections (Table 3.1).
6
Table 3.1 Observation Counts and Observation Site Counts by County: 2015
Observations Population (2014)
County Count
% of
TOTAL
Observation
Sites Per
County Population
% of
TOTAL
Adams 325 5.3% 6 2,384 2.0%
Benson 251 4.1% 6 6,833 5.8%
Bottineau 347 5.6% 6 6,650 5.6%
Bowman 304 4.9% 6 3,247 2.8%
Cavalier 116 1.9% 6 3,855 3.3%
Dickey 218 3.5% 6 5,150 4.4%
Divide 254 4.1% 6 2,432 2.1%
Dunn 410 6.7% 6 4,399 3.7%
Eddy 226 3.7% 6 2,377 2.0%
Emmons 276 4.5% 6 3,422 2.9%
Foster 242 3.9% 6 3,362 2.9%
Griggs 116 1.9% 6 2,319 2.0%
Hettinger 255 4.1% 6 2,660 2.3%
LaMoure 205 3.3% 6 4,149 3.5%
McHenry 416 6.8% 6 5,988 5.1%
Mercer 402 6.5% 6 8,746 7.4%
Mountrail 498 8.1% 6 9,782 8.3%
Ransom 212 3.4% 6 5,446 4.6%
Rolette 144 2.3% 6 14,616 12.4%
Sargent 224 3.6% 6 3,931 3.3%
Slope 326 5.3% 6 765 0.6%
Steele 115 1.9% 6 1,955 1.7%
Towner 121 2.0% 6 2,310 2.0%
Walsh 142 2.3% 6 10,970 9.3%
TOTAL 6,145 100.0% 144 117,748 100.0%
7
3.1 Driver Rural Seat Belt Use
3.1.1 Road Type
Because the overall rural seat belt use rate may be skewed by the mix of rural highway and rural
town seat belt observations – which may not truly reflect crash exposure risk – it may be more
appropriate to consider the different driving environments separately. The more relevant
numbers are seat belt use by road type, used here as the driving environment, because of the
differing relative injury risk on the rural town and rural highway roads. The greater risk
associated with travel outside of towns is evident in state crash data, which shows only about 3%
of fatal crashes on rural roads occur in towns (NDDOT 2015). Therefore, rural highways are
given special attention.
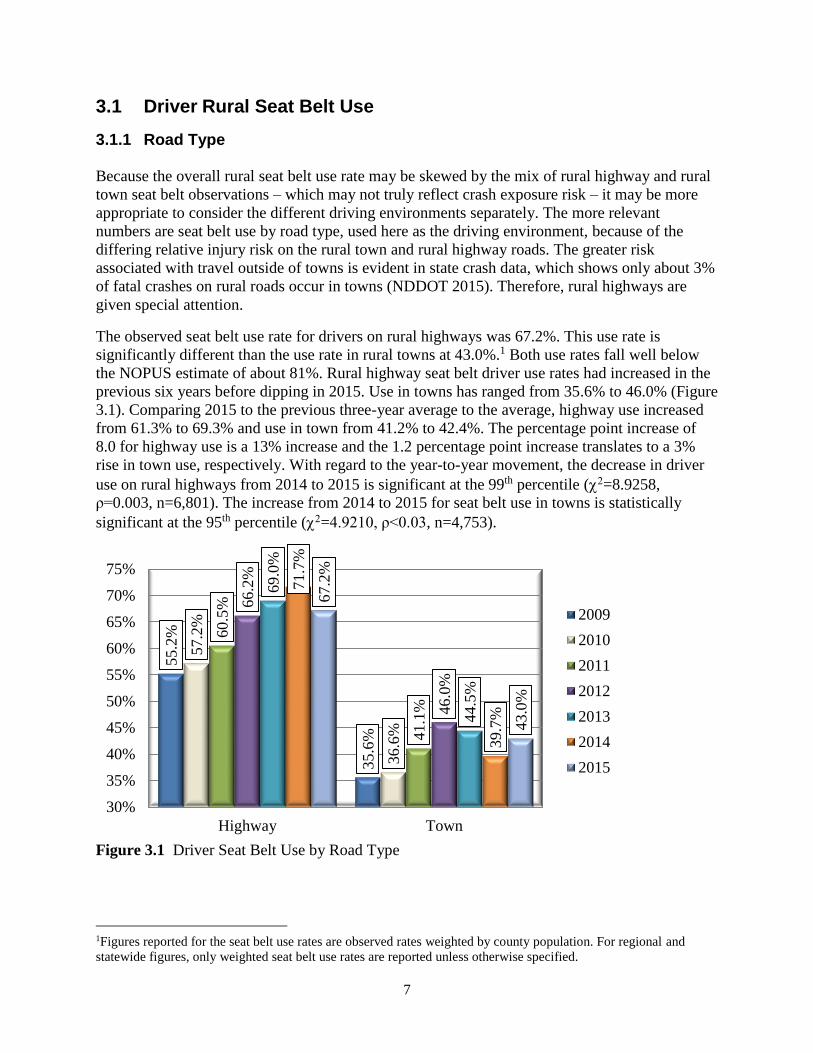
The observed seat belt use rate for drivers on rural highways was 67.2%. This use rate is
significantly different than the use rate in rural towns at 43.0%.1 Both use rates fall well below
the NOPUS estimate of about 81%. Rural highway seat belt driver use rates had increased in the
previous six years before dipping in 2015. Use in towns has ranged from 35.6% to 46.0% (Figure
3.1). Comparing 2015 to the previous three-year average to the average, highway use increased
from 61.3% to 69.3% and use in town from 41.2% to 42.4%. The percentage point increase of
8.0 for highway use is a 13% increase and the 1.2 percentage point increase translates to a 3%
rise in town use, respectively. With regard to the year-to-year movement, the decrease in driver
use on rural highways from 2014 to 2015 is significant at the 99th percentile (=8.9258,
ρ=0.003, n=6,801). The increase from 2014 to 2015 for seat belt use in towns is statistically
significant at the 95th percentile (=4.9210, ρ<0.03, n=4,753).
Figure 3.1 Driver Seat Belt Use by Road Type
1Figures reported for the seat belt use rates are observed rates weighted by county population. For regional and
statewide figures, only weighted seat belt use rates are reported unless otherwise specified.
55.2
%
35.6
%
57.2
%
36.6
%
60.5
%
41.1
%
66.2
%
46.0
%
69.0
%
44.5
%
71.7
%
39.7
%
67.2
%
43.0
%
30%
35%
40%
45%
50%
55%
60%
65%
70%
75%
Highway Town
2009
2010
2011
2012
2013
2014
2015

8
The range of highway seat belt use rates by county is large, considering an average high of 82%
in Steele County and an average low of 55.7 % in Emmons County over the past three years
(Figure 3.2). The range in seat belt use suggests some potential to investigate the environment
and practices in the more successful counties to determine if best practices can be transferred to
other areas or if there are unique cultural or travel situations surrounding the higher rates.
Average seat belt use in rural towns ranges from a high of 63.9% in Slope County to a low of
22.2% in Hettinger County.
Figure 3.2 Driver Seat Belt Use by Road Type and County, Average 2013-2015
0% 50% 100%
Walsh
Towner
Steele
Slope
Sargent
Rolette
Ransom
Mount…
Mercer
McHenry
LaMoure
Hettinger
Griggs
Foster
Emmons
Eddy
Dunn
Divide
Dickey
Cavalier
Bowman
Bottineau
Benson
Adams
78.3%
66.7%
82.0%
69.1%
62.9%
70.9%
68.1%
73.7%
65.4%
76.6%
63.3%
61.9%
76.2%
68.4%
55.7%
62.1%
70.8%
63.5%
63.5%
72.6%
66.1%
66.4%
64.2%
64.0%
Town
Highway
9
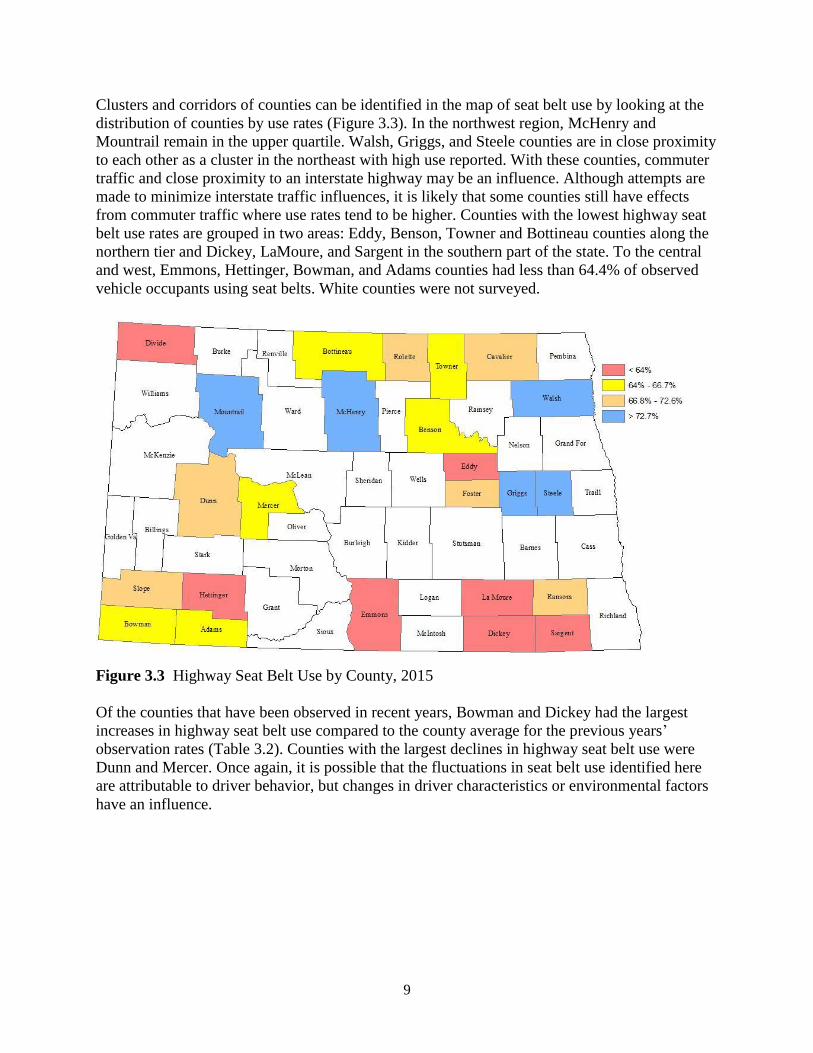
Clusters and corridors of counties can be identified in the map of seat belt use by looking at the
distribution of counties by use rates (Figure 3.3). In the northwest region, McHenry and
Mountrail remain in the upper quartile. Walsh, Griggs, and Steele counties are in close proximity
to each other as a cluster in the northeast with high use reported. With these counties, commuter
traffic and close proximity to an interstate highway may be an influence. Although attempts are
made to minimize interstate traffic influences, it is likely that some counties still have effects
from commuter traffic where use rates tend to be higher. Counties with the lowest highway seat
belt use rates are grouped in two areas: Eddy, Benson, Towner and Bottineau counties along the
northern tier and Dickey, LaMoure, and Sargent in the southern part of the state. To the central
and west, Emmons, Hettinger, Bowman, and Adams counties had less than 64.4% of observed
vehicle occupants using seat belts. White counties were not surveyed.
Figure 3.3 Highway Seat Belt Use by County, 2015
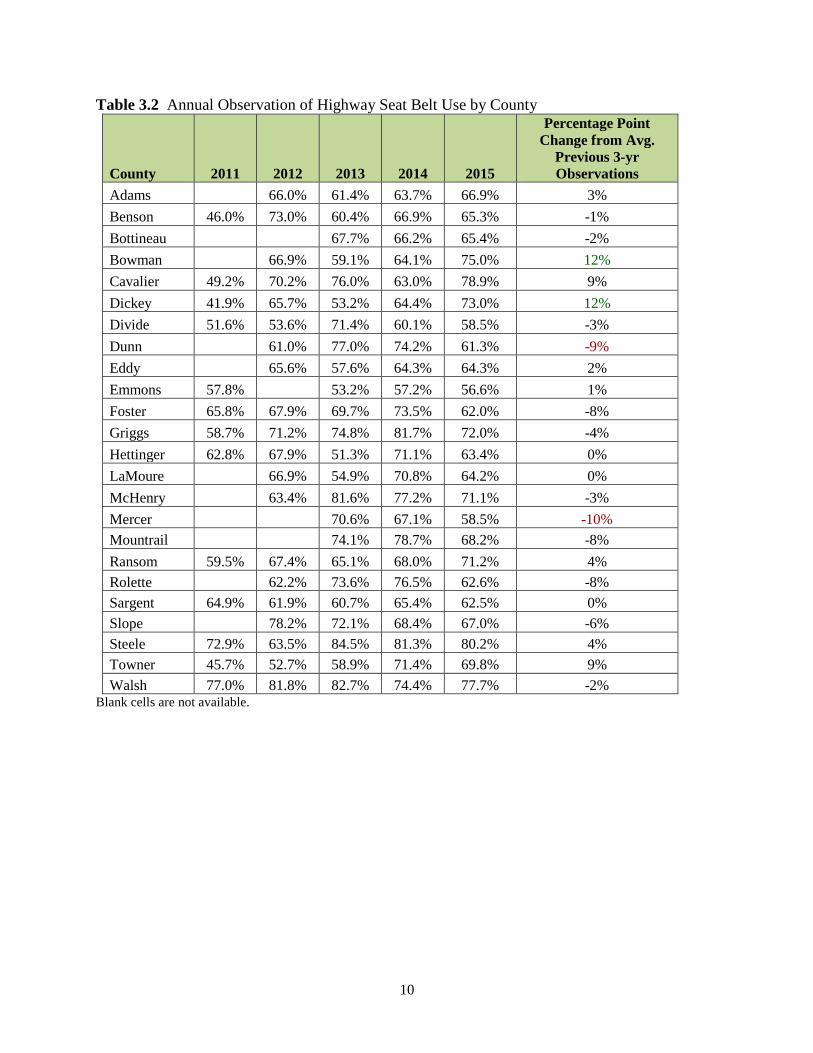
Of the counties that have been observed in recent years, Bowman and Dickey had the largest
increases in highway seat belt use compared to the county average for the previous years’
observation rates (Table 3.2). Counties with the largest declines in highway seat belt use were
Dunn and Mercer. Once again, it is possible that the fluctuations in seat belt use identified here
are attributable to driver behavior, but changes in driver characteristics or environmental factors
have an influence.
10
Table 3.2 Annual Observation of Highway Seat Belt Use by County
County 2011 2012 2013 2014 2015
Percentage Point
Change from Avg.
Previous 3-yr
Observations
Adams 66.0% 61.4% 63.7% 66.9% 3%
Benson 46.0% 73.0% 60.4% 66.9% 65.3% -1%
Bottineau 67.7% 66.2% 65.4% -2%
Bowman 66.9% 59.1% 64.1% 75.0% 12%
Cavalier 49.2% 70.2% 76.0% 63.0% 78.9% 9%
Dickey 41.9% 65.7% 53.2% 64.4% 73.0% 12%
Divide 51.6% 53.6% 71.4% 60.1% 58.5% -3%
Dunn 61.0% 77.0% 74.2% 61.3% -9%
Eddy 65.6% 57.6% 64.3% 64.3% 2%
Emmons 57.8% 53.2% 57.2% 56.6% 1%
Foster 65.8% 67.9% 69.7% 73.5% 62.0% -8%
Griggs 58.7% 71.2% 74.8% 81.7% 72.0% -4%
Hettinger 62.8% 67.9% 51.3% 71.1% 63.4% 0%
LaMoure 66.9% 54.9% 70.8% 64.2% 0%
McHenry 63.4% 81.6% 77.2% 71.1% -3%
Mercer 70.6% 67.1% 58.5% -10%
Mountrail 74.1% 78.7% 68.2% -8%
Ransom 59.5% 67.4% 65.1% 68.0% 71.2% 4%
Rolette 62.2% 73.6% 76.5% 62.6% -8%
Sargent 64.9% 61.9% 60.7% 65.4% 62.5% 0%
Slope 78.2% 72.1% 68.4% 67.0% -6%
Steele 72.9% 63.5% 84.5% 81.3% 80.2% 4%
Towner 45.7% 52.7% 58.9% 71.4% 69.8% 9%
Walsh 77.0% 81.8% 82.7% 74.4% 77.7% -2% Blank cells are not available.
11
3.1.2 Region
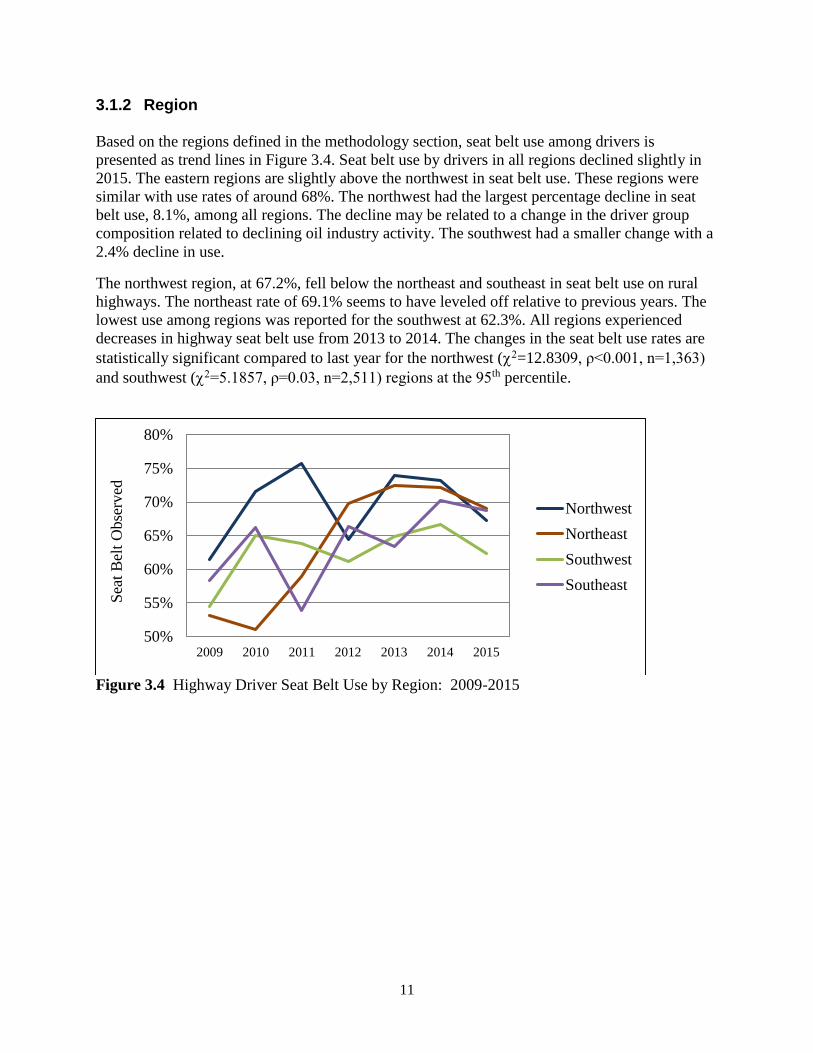
Based on the regions defined in the methodology section, seat belt use among drivers is
presented as trend lines in Figure 3.4. Seat belt use by drivers in all regions declined slightly in
2015. The eastern regions are slightly above the northwest in seat belt use. These regions were
similar with use rates of around 68%. The northwest had the largest percentage decline in seat
belt use, 8.1%, among all regions. The decline may be related to a change in the driver group
composition related to declining oil industry activity. The southwest had a smaller change with a
2.4% decline in use.
The northwest region, at 67.2%, fell below the northeast and southeast in seat belt use on rural
highways. The northeast rate of 69.1% seems to have leveled off relative to previous years. The
lowest use among regions was reported for the southwest at 62.3%. All regions experienced
decreases in highway seat belt use from 2013 to 2014. The changes in the seat belt use rates are
statistically significant compared to last year for the northwest (=12.8309, ρ<0.001, n=1,363)
and southwest (=5.1857, ρ=0.03, n=2,511) regions at the 95th percentile.
Figure 3.4 Highway Driver Seat Belt Use by Region: 2009-2015
50%
55%
60%
65%
70%
75%
80%
2009 2010 2011 2012 2013 2014 2015
Sea
t B
elt
Obse
rved
Northwest
Northeast
Southwest
Southeast
12
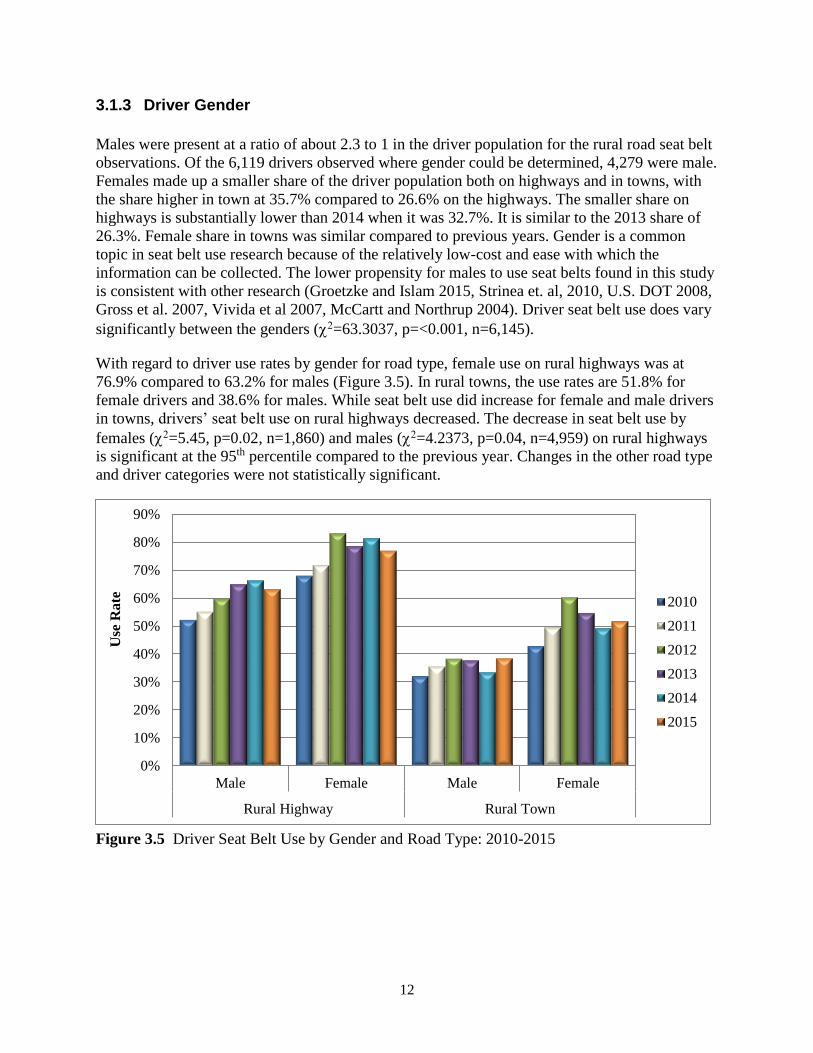
3.1.3 Driver Gender
Males were present at a ratio of about 2.3 to 1 in the driver population for the rural road seat belt
observations. Of the 6,119 drivers observed where gender could be determined, 4,279 were male.
Females made up a smaller share of the driver population both on highways and in towns, with
the share higher in town at 35.7% compared to 26.6% on the highways. The smaller share on
highways is substantially lower than 2014 when it was 32.7%. It is similar to the 2013 share of
26.3%. Female share in towns was similar compared to previous years. Gender is a common
topic in seat belt use research because of the relatively low-cost and ease with which the
information can be collected. The lower propensity for males to use seat belts found in this study
is consistent with other research (Groetzke and Islam 2015, Strinea et. al, 2010, U.S. DOT 2008,
Gross et al. 2007, Vivida et al 2007, McCartt and Northrup 2004). Driver seat belt use does vary
significantly between the genders (=63.3037, p=<0.001, n=6,145).
With regard to driver use rates by gender for road type, female use on rural highways was at
76.9% compared to 63.2% for males (Figure 3.5). In rural towns, the use rates are 51.8% for
female drivers and 38.6% for males. While seat belt use did increase for female and male drivers
in towns, drivers’ seat belt use on rural highways decreased. The decrease in seat belt use by
females (=5.45, p=0.02, n=1,860) and males (=4.2373, p=0.04, n=4,959) on rural highways
is significant at the 95th percentile compared to the previous year. Changes in the other road type
and driver categories were not statistically significant.
Figure 3.5 Driver Seat Belt Use by Gender and Road Type: 2010-2015
0%
10%
20%
30%
40%
50%
60%
70%
80%
90%
Male Female Male Female
Rural Highway Rural Town
Use
Rate 2010
2011
2012
2013
2014
2015
13
Table 3.3 shows county-level seat belt use rates on rural highways and in rural towns by gender.
The county information shows the highest female use rates for 2015, above 85%, on rural
highways are in Steele, Cavalier, and Bowman counties. The lowest rates seen among female
drivers, with rates under 70%, were in Foster, Mercer, Benson and Mountrail counties. Steele,
Cavalier and Bowman counties had the highest use rates among male drivers on rural highways,
with rates from 71% to 77%. The lowest seat belt use rates among male drivers, with rates under
57%, were in Divide, Hettinger, and Emmons counties.
Male driver seat belt use in towns was highest in Slope County at 64%. The use within this
driver group was lowest, under 20%, in Hettinger and Emmons counties. Among female drivers,
use was under 30% in Hettinger, Towner and Divide counties. The highest rate for females, 79%,
was reported in Griggs County. Divide County had the lowest rate in town with only 9% of
female drivers observed using seat belts.
County-level seat belt use figures should be used with caution because of factors which may
affect the figures relative to other counties and year-to-year changes. These factors may include
commuter traffic, observation site proximity to highways, community events, local economic
activity, and observation counts. The information is offered as additional insight, but should be
used sparingly as the sole factor in resource decisions. Used in conjunction with expanded
information from this survey or other seat belt use studies, the additional information may be
useful in targeting education and enforcement activities.

14
Table 3.3 County Driver Seat Belt Use, by Road Type and Gender
Average 2012-2014 2015
Rural Highway Rural Town Rural Highway Rural Town
County Male Female Male Female Male Female Male Female
Adams 57% 79% 30% 50% 65% 71% 25% 42%
Benson 61% 80% 34% 42% 66% 65% 26% 40%
Bottineau 63% 77% 35% 54% 61% 79% 33% 59%
Bowman 59% 81% 30% 58% 71% 87% 43% 50%
Cavalier 65% 84% 25% 38% 76% 88% 43% 57%
Dickey 56% 72% 34% 51% 70% 81% 43% 55%
Divide 58% 88% 33% 27% 55% 79% 21% 9%
Dunn 71% 73% 55% 66% 59% 74% 57% 68%
Eddy 59% 73% 45% 51% 59% 80% 21% 38%
Emmons 48% 80% 20% 34% 48% 77% 15% 46%
Foster 66% 82% 34% 52% 63% 59% 30% 48%
Griggs 71% 85% 27% 50% 65% 85% 30% 79%
Hettinger 48% 80% 21% 39% 54% 78% 11% 28%
LaMoure 60% 75% 28% 40% 57% 76% 26% 49%
McHenry 71% 83% 38% 63% 66% 82% 53% 72%
Mercer 64% 84% 37% 53% 57% 63% 49% 67%
Mountrail 75% 86% 48% 58% 69% 67% 42% 61%
Ransom 59% 79% 32% 53% 67% 79% 29% 49%
Rolette 64% 83% 38% 62% 59% 70% 61% 47%
Sargent 58% 73% 28% 49% 59% 70% 21% 41%
Slope 70% 83% 65% 63% 63% 83% 64% 72%
Steele 73% 84% 31% 41% 77% 94% 55% 50%
Towner 56% 74% 39% 51% 66% 79% 38% 25%
Walsh 75% 88% 35% 58% 65% 79% 29% 50%
15
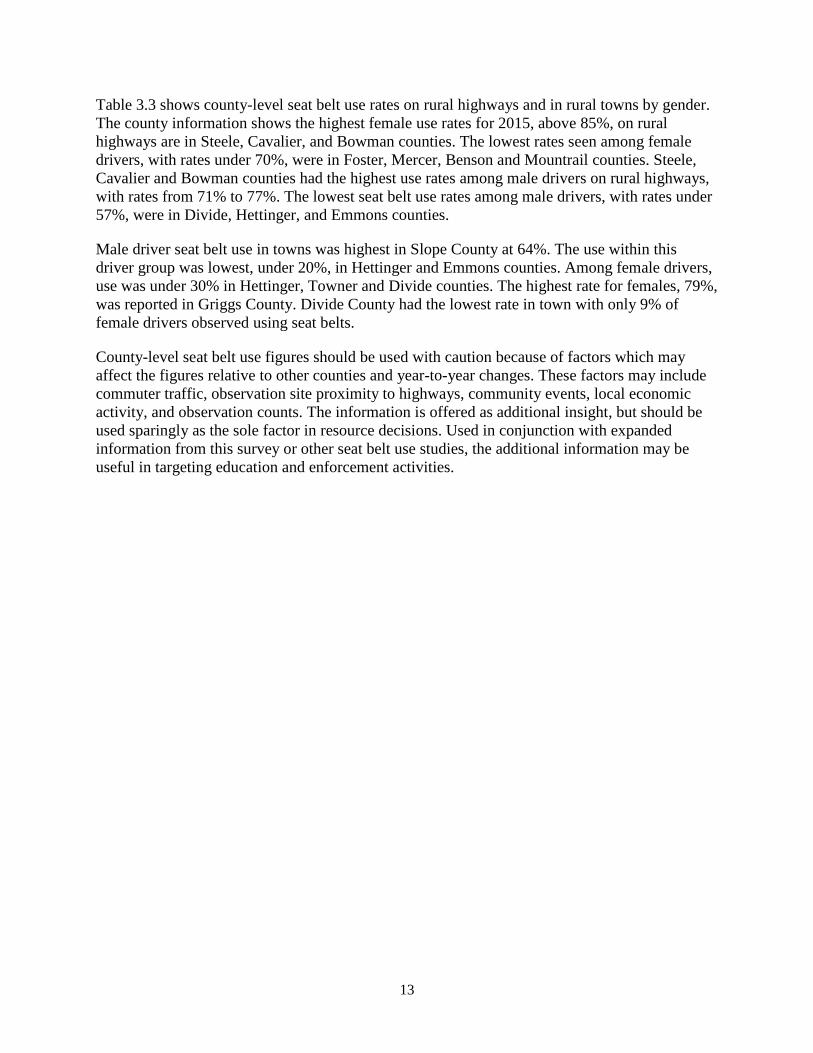
3.1.4 Vehicle Type
As with gender, vehicle type is also commonly considered in seat belt surveys. Both offer
potentially useful information for greater efficacy in directing education and enforcement outlays
toward a driver group (U.S. DOT 2009b). For example, a nationwide study of fatal crashes
showed that pickup truck occupants had the highest percent of unrestrained fatalities among all
passenger vehicle types (U.S. DOT 2012). Similar use patterns for this vehicle type were found
here, with male pickup truck drivers having the lowest use rates among the gender-fleet mix.
The rural seat belt observations included more pickup trucks than cars (2,883 and 1,376,
respectively), along with 1,368 sport utility vehicles (SUVs), and 412 vans (Figure 3.6). The
motorcycle figure varies substantially year-to-year based on weather conditions. For example,
the count in 2015 was relatively high at 106 compared to 57 in 2014. The fleet composition for
the seat belt observation, by vehicle type, is similar to 2014 with a slight increase in the share of
SUVs.
Figure 3.6 Observed Rural Road Passenger Vehicle Fleet, by Vehicle Type
Car
22.4%
Truck
46.9%
SUV
22.3%
Van
6.7%
Motor-
cycle
1.5%

16
A significant variation in seat belt use is found across passenger vehicle types on rural roads
(=118.5169, p<0.0001, n=5,986). In 2015, driver seat belt use in cars on rural roads was 59.1%
compared to 51.6% for pickup truck drivers (Figure 3.7). Use by pickup truck drivers on rural
highways increased slightly compared to 2014 while use by car drivers decreased by 4.0
percentage points. Sport utility vehicle drivers also had a slightly lower observed use rate in 2015
at 67.2%. Seat belt use by van drivers increased by 7.6 percentage points in 2015 compared to
2014. The changes between 2014 and 2015 by vehicle type, for rural roads, were not statistically
significant.
Figure 3.7 Driver Seat Belt Use by Vehicle Type
Further stratification for gender shows that female drivers have higher seat belt use rates among
all vehicle classes on all roads, ranging from 60.1% for pickups to 76.1% for vans (Table 3.4).
Males, in comparison, used seat belts only 50.6% of the time in pickup trucks and 70.4% of the
time in vans. Seat belt use in pickup trucks increased for both genders when comparing rates in
2015 to those in 2014. A decline is statistically significant at the 95th percentile for male car
drivers, with use rates falling from 60.2% in 2014 to 55.7% in 2015 (=9.7591, ρ=0.002,
n=870).
Table 3.4 Driver Seat Belt Use by Vehicle Type and Gender
2012 2013 2014 2015
Male Female Male Female Male Female Male Female
Car 59.6% 72.4% 60.8% 65.0% 60.2% 65.2% 55.7% 63.2%
SUV 63.4% 66.0% 65.5% 66.3% 65.8% 70.8% 60.6% 70.8%
Pickup 41.9% 68.5% 46.7% 63.6% 45.6% 53.7% 50.6% 60.1%
Van 66.3% 81.6% 60.8% 77.3% 63.8% 74.0% 70.4% 76.1%
20%
30%
40%
50%
60%
70%
80%
2009 2010 2011 2012 2013 2014 2015
Use
Rat
e Car
Truck
SUV
Van
17
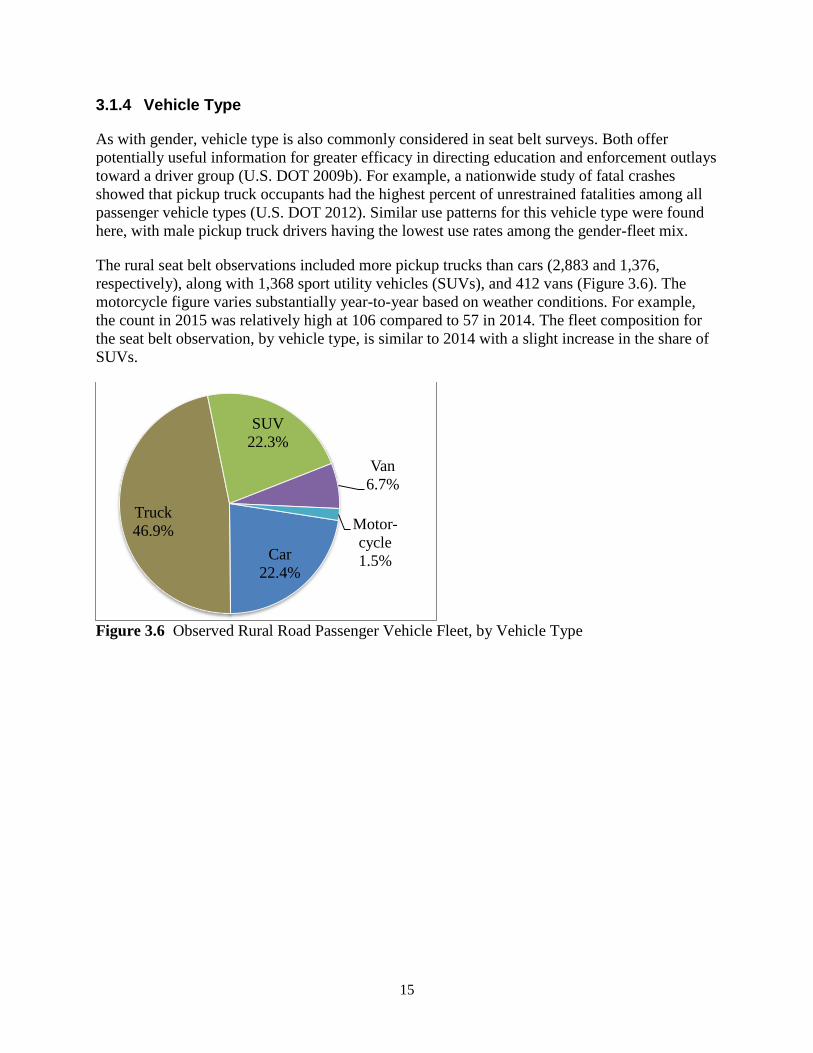
When also considering the road environment, the highest use rate was among females driving
vans on rural highways. Seat belts were in use for 93.5% of drivers observed in this group (Table
3.5). The lowest use rate, 34.1%, was again among males driving pickups in rural towns. Seat
belt use decreased for males and females driving cars and SUVs on both road groups comparing
2015 to the previous three-year average with the exception of female drivers in towns. Use rates
for males and females increased among pickup and van drivers on both road groups with the
exception of female drivers in towns. The largest decrease in use rates, considering gender, road
and vehicle mix, was for male car drivers on highways in comparing 2015 to the previous three-
year average.
Table 3.5 Driver Seat Belt Use by Vehicle Type, Gender, and Road Type
Average, 2011-2014 2015
Rural Highway Rural Town Rural Highway Rural Town
Male Female Male Female Male Female Male Female
Car 72.8% 76.4% 47.3% 53.4% 61.8% 72.4% 44.9% 49.5%
SUV 76.8% 82.8% 44.5% 52.7% 72.0% 81.6% 40.3% 56.3%
Pickup 57.6% 71.7% 33.0% 43.1% 59.7% 73.2% 34.1% 49.9%
Van 74.8% 91.0% 40.6% 62.7% 77.2% 93.5% 58.6% 55.6%
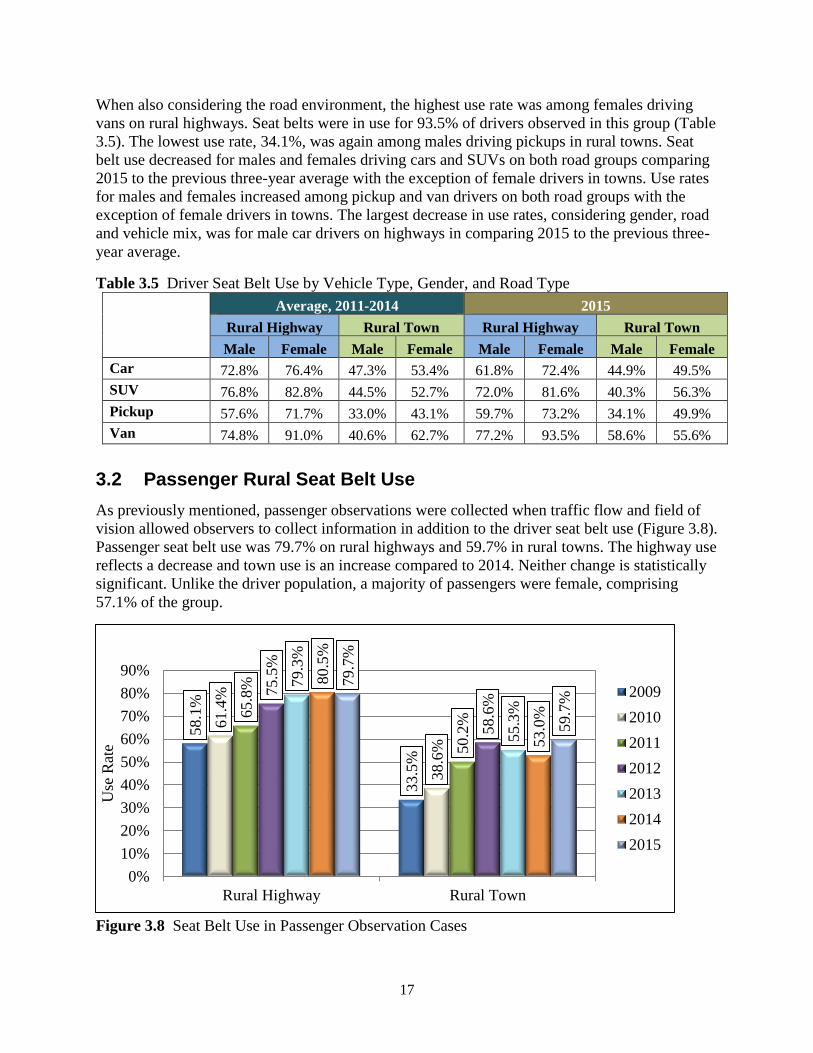
3.2 Passenger Rural Seat Belt Use
As previously mentioned, passenger observations were collected when traffic flow and field of
vision allowed observers to collect information in addition to the driver seat belt use (Figure 3.8).
Passenger seat belt use was 79.7% on rural highways and 59.7% in rural towns. The highway use
reflects a decrease and town use is an increase compared to 2014. Neither change is statistically
significant. Unlike the driver population, a majority of passengers were female, comprising
57.1% of the group.
Figure 3.8 Seat Belt Use in Passenger Observation Cases
58.1
%
33.5
%
61.4
%
38.6
%
65.8
%
50.2
%
75.5
%
58.6
%
79.3
%
55.3
%
80.5
%
53.0
%
79.7
%
59.7
%
0%
10%
20%
30%
40%
50%
60%
70%
80%
90%
Rural Highway Rural Town
Use
Rat
e
2009
2010
2011
2012
2013
2014
2015
18
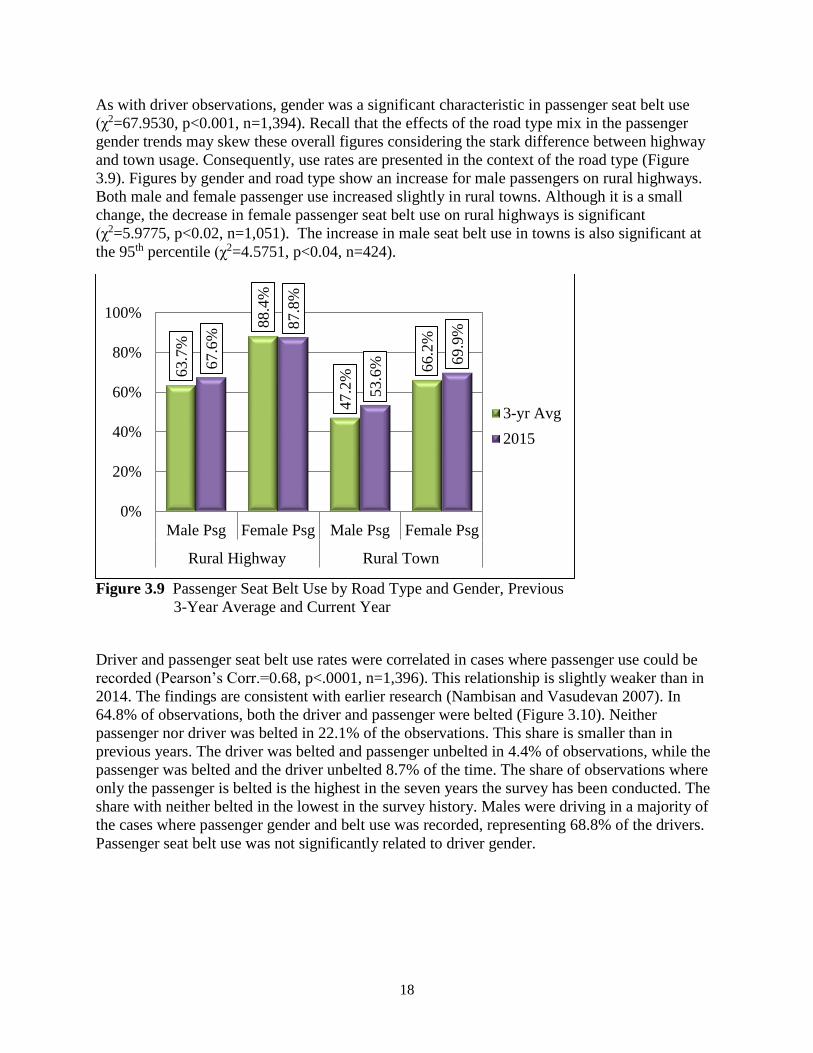
As with driver observations, gender was a significant characteristic in passenger seat belt use
(χ2=67.9530, p<0.001, n=1,394). Recall that the effects of the road type mix in the passenger
gender trends may skew these overall figures considering the stark difference between highway
and town usage. Consequently, use rates are presented in the context of the road type (Figure
3.9). Figures by gender and road type show an increase for male passengers on rural highways.
Both male and female passenger use increased slightly in rural towns. Although it is a small
change, the decrease in female passenger seat belt use on rural highways is significant
(χ2=5.9775, p<0.02, n=1,051). The increase in male seat belt use in towns is also significant at
the 95th percentile (χ2=4.5751, p<0.04, n=424).
Figure 3.9 Passenger Seat Belt Use by Road Type and Gender, Previous
3-Year Average and Current Year
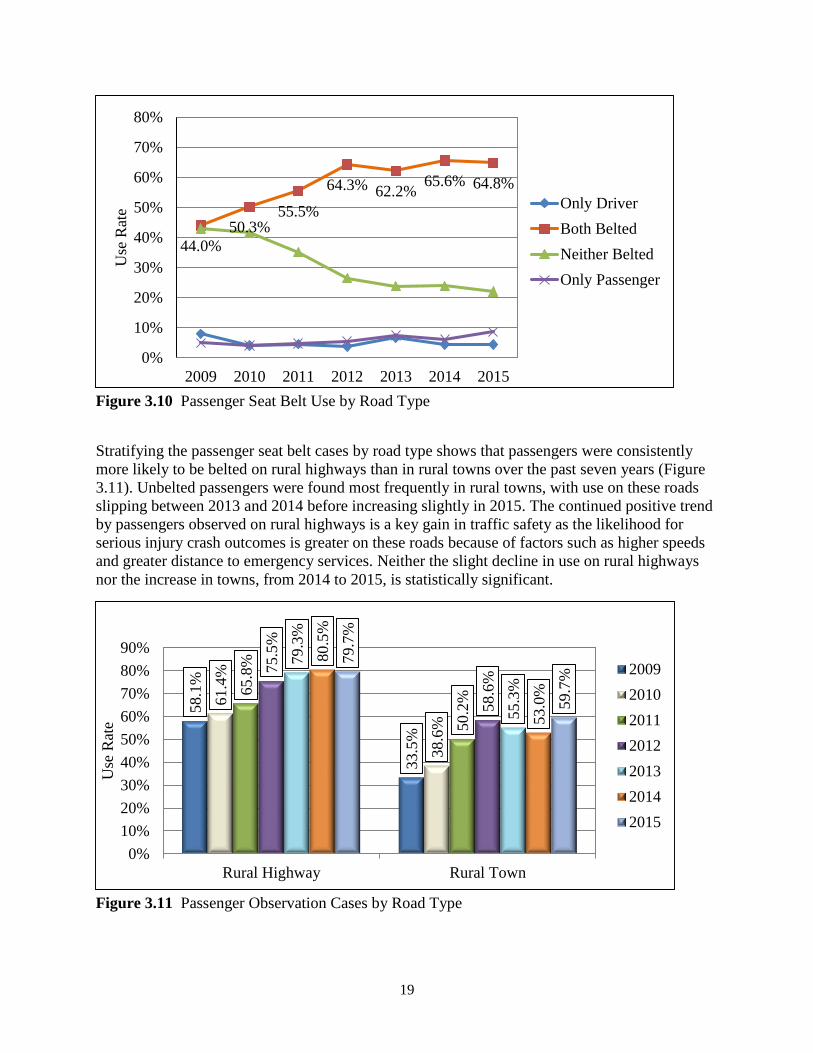
Driver and passenger seat belt use rates were correlated in cases where passenger use could be
recorded (Pearson’s Corr.=0.68, p<.0001, n=1,396). This relationship is slightly weaker than in
2014. The findings are consistent with earlier research (Nambisan and Vasudevan 2007). In
64.8% of observations, both the driver and passenger were belted (Figure 3.10). Neither
passenger nor driver was belted in 22.1% of the observations. This share is smaller than in
previous years. The driver was belted and passenger unbelted in 4.4% of observations, while the
passenger was belted and the driver unbelted 8.7% of the time. The share of observations where
only the passenger is belted is the highest in the seven years the survey has been conducted. The
share with neither belted in the lowest in the survey history. Males were driving in a majority of
the cases where passenger gender and belt use was recorded, representing 68.8% of the drivers.
Passenger seat belt use was not significantly related to driver gender.
63.7
%
88.4
%
47.2
%
66.2
%
67.6
%
87.8
%
53.6
% 69.9
%
0%
20%
40%
60%
80%
100%
Male Psg Female Psg Male Psg Female Psg
Rural Highway Rural Town
3-yr Avg
2015
19
Figure 3.10 Passenger Seat Belt Use by Road Type
Stratifying the passenger seat belt cases by road type shows that passengers were consistently
more likely to be belted on rural highways than in rural towns over the past seven years (Figure
3.11). Unbelted passengers were found most frequently in rural towns, with use on these roads
slipping between 2013 and 2014 before increasing slightly in 2015. The continued positive trend
by passengers observed on rural highways is a key gain in traffic safety as the likelihood for
serious injury crash outcomes is greater on these roads because of factors such as higher speeds
and greater distance to emergency services. Neither the slight decline in use on rural highways
nor the increase in towns, from 2014 to 2015, is statistically significant.
Figure 3.11 Passenger Observation Cases by Road Type
44.0%
50.3%55.5%
64.3% 62.2%65.6% 64.8%
0%
10%
20%
30%
40%
50%
60%
70%
80%
2009 2010 2011 2012 2013 2014 2015
Use
Rat
e
Only Driver
Both Belted
Neither Belted
Only Passenger
58.1
%
33.5
%
61.4
%
38.6
%
65
.8%
50.2
%
75
.5%
58.6
%
79.3
%
55.3
%
80.5
%
53.0
%
79.7
%
59.7
%
0%
10%
20%
30%
40%
50%
60%
70%
80%
90%
Rural Highway Rural Town
Use
Rat
e
2009
2010
2011
2012
2013
2014
2015
20
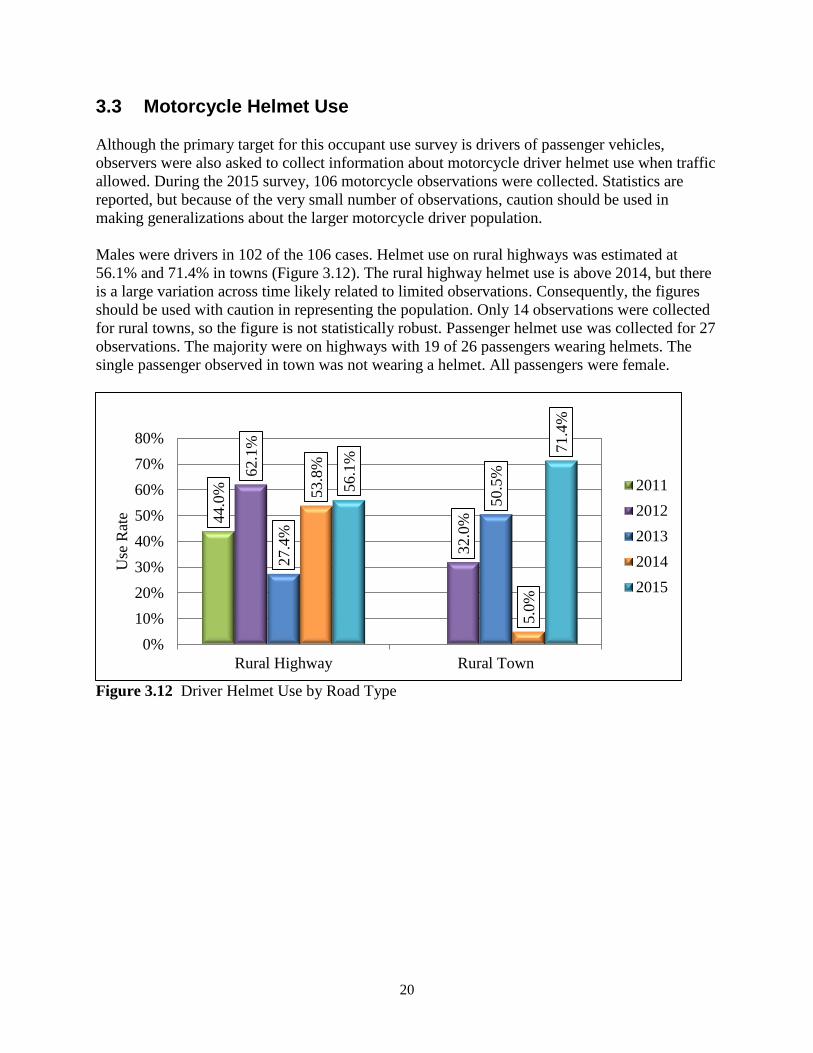
3.3 Motorcycle Helmet Use
Although the primary target for this occupant use survey is drivers of passenger vehicles,
observers were also asked to collect information about motorcycle driver helmet use when traffic
allowed. During the 2015 survey, 106 motorcycle observations were collected. Statistics are
reported, but because of the very small number of observations, caution should be used in
making generalizations about the larger motorcycle driver population.
Males were drivers in 102 of the 106 cases. Helmet use on rural highways was estimated at
56.1% and 71.4% in towns (Figure 3.12). The rural highway helmet use is above 2014, but there
is a large variation across time likely related to limited observations. Consequently, the figures
should be used with caution in representing the population. Only 14 observations were collected
for rural towns, so the figure is not statistically robust. Passenger helmet use was collected for 27
observations. The majority were on highways with 19 of 26 passengers wearing helmets. The
single passenger observed in town was not wearing a helmet. All passengers were female.
Figure 3.12 Driver Helmet Use by Road Type
44.0
%
62.1
%
32.0
%
27.4
%
50.5
%
53.8
%
5.0
%
56.1
%
71.4
%
0%
10%
20%
30%
40%
50%
60%
70%
80%
Rural Highway Rural Town
Use
Rat
e
2011
2012
2013
2014
2015
21
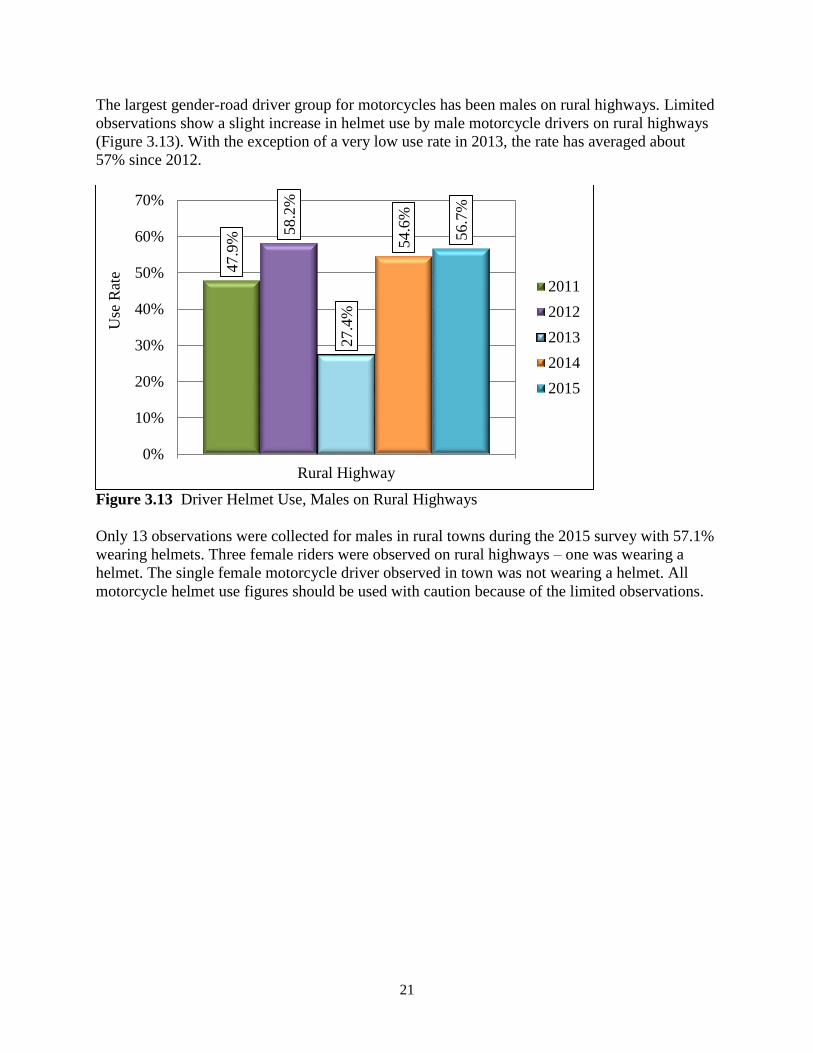
The largest gender-road driver group for motorcycles has been males on rural highways. Limited
observations show a slight increase in helmet use by male motorcycle drivers on rural highways
(Figure 3.13). With the exception of a very low use rate in 2013, the rate has averaged about
57% since 2012.
Figure 3.13 Driver Helmet Use, Males on Rural Highways
Only 13 observations were collected for males in rural towns during the 2015 survey with 57.1%
wearing helmets. Three female riders were observed on rural highways – one was wearing a
helmet. The single female motorcycle driver observed in town was not wearing a helmet. All
motorcycle helmet use figures should be used with caution because of the limited observations.
47.9
%
58.2
%
27.4
%
54.6
%
56.7
%0%
10%
20%
30%
40%
50%
60%
70%
Rural Highway
Use
Rat
e
2011
2012
2013
2014
2015
22
4. DISCUSSION
North Dakota’s roads provide vital economic and social connections for residents and visitors.
These roads are a relatively high-risk travel environment. Rural roads account for 75% of annual
travel and nearly 82% of fatal crashes and 89% of serious injury crashes. While there are many
important aspects of road safety, interest here is in measuring seat belt use for managing it as a
safety priority.
A total of 6,145 driver observations were collected at 144 sites across 24 rural counties. Highway
seat belt use decreased from 71.7% in 2014 to 67.2% in 2015. The survey has measured an 8.0
percentage point increase in rural highway seat belt use comparing average use between 2013
and 2015 to the previous three-year average. Similar to previous findings, seat belt use was
found to be significantly different on rural highways and in rural towns. Average observed
highway use rates ranged from 55.7% to 82.0% on rural highways in individual counties and
from 22.2% to 63.9% in rural towns between 2013 and 2015. The large ranges are similar to
previous studies. In addition to statewide media efforts, local programs focusing on education
and high visibility seat belt enforcement (such as the Click It Or Ticket campaign), individual
agency campaigns, and multi-agency enforcement efforts, have contributed to the increase. The
lower rate of seat belt use on rural highways may be due to a greater share of males, who tend to
have a lower use rate, in the 2015 sample. In addition, the observed female use did decline
compared to the previous three years.
A significant decrease in use by male drivers on highways was measured. Female driver seat belt
use on highways fell from 81.4% in 2014 to 76.9% in 2015. Female driver seat belt use on rural
highways remained higher than the male driver use rate of 63.2%. The declines in the male and
female use rates were significant. It is the second decline in the female driver seat belt use rate
that had previously trended upward. Based on year-to-year movements in the trend, it appears
that a specific education or enforcement campaign triggered a larger than “normal” increase in
this user group in 2012. It appears the large gain was not sustained in 2013. The rate was up
again in 2014, but fell below the 2013 use rate in 2015. Male seat belt use on highways also fell
below the 2013 rate.
Seat belt use rates on highways were also found to vary significantly by vehicle type. Pickup
truck drivers had the lowest propensity to use seat belts, at 51.6%, and van drivers had the
highest use rate at 72.3%. Stratification for gender and vehicle shows that female drivers have
higher seat belt use rates among all vehicle classes. As with previous surveys, comparable town
seat belt use rates were lower than highway use rates across all gender and vehicle strata.
Results also continued to show a correlation between driver and passenger seat belt use. Where
observations were collected in driver and passenger shared seat belt behavior, both were belted
in 64.8% of cases, a decrease from 65.6% in 2013. Neither was belted in 22.1% of observations,
the smallest share in the seven year survey history.
The limited number of motorcycle helmet use observations that were collected shows an increase
in usage on rural highways. A few observations were collected in towns but figures were not
statistically useful.

23
The seat belt use rate on the state’s rural roads was found to be lower than the commonly
reported NOPUS use rate collected in the annual statewide seat belt survey. The relative risk and
significant difference in use rates between rural highways and towns should continue to be
considered in research related to rural seat belt use. In addition, results indicate a need for
continued assessment of programs to increase local seat belt enforcement or awareness on rural
roads.
24
REFERENCES
Groetzke, Frank, and Samia Islam. “Determinants of Seat Belt Use: A Regression Analysis with
FARS Data Corrected for Self-Selection.” Journal of Safety Research 55, (2015): 7-12.
Gross, Eric A., Amy Axberg and Kathleen Mathieson. “Predictors of Seatbelt Use in American
Indian Motor Vehicle Crash Trauma Victims On and Off the Reservation.” Accident Analysis
and Prevention 39(5), (2007):1001-1005.
McCartt, Anne, and Veronika Shabanova Northrup. “Factors Related to Seat Belt Use Among
Fatally Injured Teenage Drivers.” Journal of Safety Research 35, (2004): 29-38.
Nambisan, Shashi, and Vinod Vasudevan. “Is Seat Belt Usage by Front Seat Passengers Related
to Seat Belt Usage by their Drivers?” Journal of Safety Research 38(5), (2007): 545-555.
North Dakota Department of Transportation. Crash Data. Safety Divison, Bismarck, ND.
Various years.
North Dakota Department of Transportation. Survey of Seat Belt Use in North Dakota. Safety
Division, Bismarck, ND. Various Years.
North Dakota Department of Transportation. 2014 North Dakota Crash Summary. Safety
Division, Bismarck, ND. 2015. http://www.dot.nd.gov/divisions/safety/docs/crash-summary.pdf.
Strinea, Tara, Laurie Beckb, Julie Bolena, Catherine Okoroa, Satvinder Dhingraa, and Lina
Balluza. “Geographic and Sociodemographic Variation in Self-Reported Seat Belt Use in the
United States.” Accident Analysis and Prevention 42, (2010): 1066–1071
U.S. Department of Transportation. Innovative Seat Belt Demonstration Programs in Kentucky,
Mississippi, North Dakota, and Wyoming. National Highway Traffic Safety Administration,
DOT HS 811 080. 2009.
U.S. Department of Transportation. Seat Belt Use in 2007 - Demographic Results Seat Belt Use
in 2008—Use Rates in the States and Territories. National Highway Traffic Safety
Administration, Traffic Safety Facts, Research Note, DOT HS 810 932. 2008.
U.S Department of Transportation. Rural/Urban Comparison. National Highway Traffic Safety
Administration, National Center for Statistics and Analysis, DOT HS 811 637, Washington, D.C.
2012.
Vivoda, Jonathon, David Eby, Renée St. Louis, and Lidia Kostyniuk. “A Direct Observation
Study of Nighttime Safety Belt Use in Indiana.” Journal of Safety Research 38, (2007).
25
APPENDIX: SEAT BELT OBSERVATION TRAINING GUIDE

26
27

28
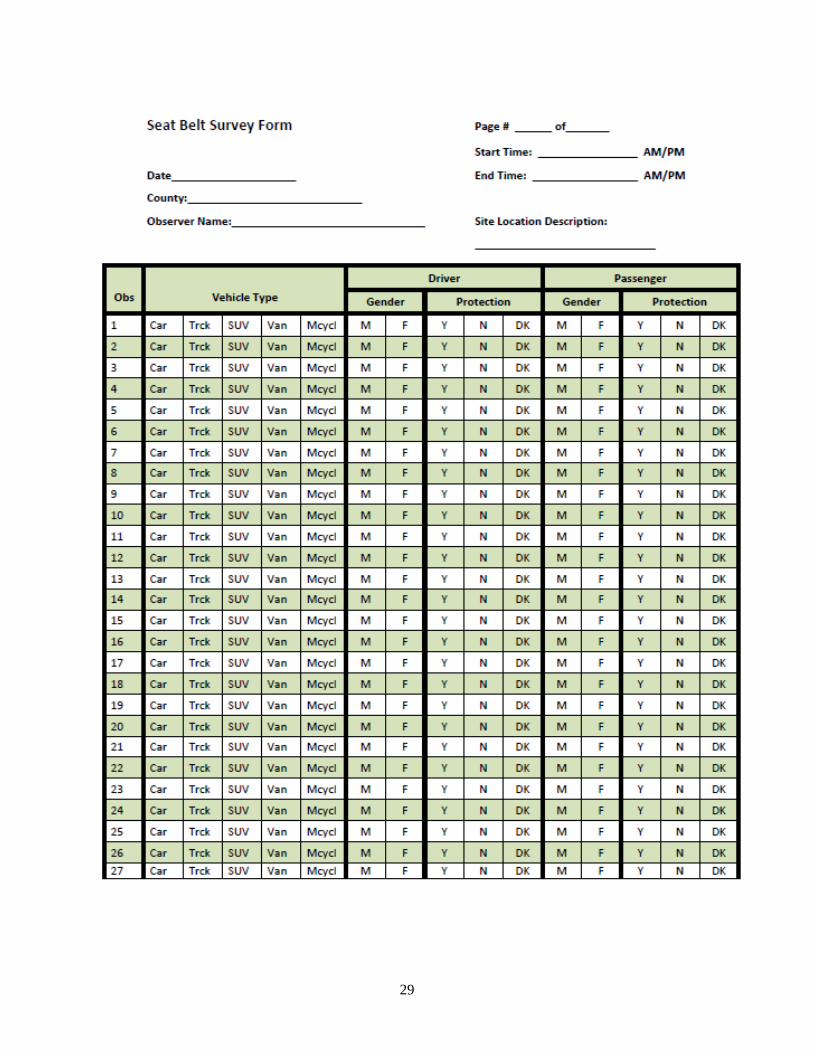
29