seasonal study of physico-chemical assessment of
TRANSCRIPT

www.wjpps.com Vol 8, Issue 7, 2019.
1334
Kamble et al. World Journal of Pharmacy and Pharmaceutical Sciences
SEASONAL STUDY OF PHYSICO-CHEMICAL ASSESSMENT OF
PARDESWADI LAKE WALUJ M. I. D. C. AURANGABAD (M. S.)
INDIA.
V. T. Kamble*1 and C. A. Jawale
2
1Dept of Zoology, Dr. Babasaheb Ambedkar Marathwada University, Aurangabad.
2Shri Madhavrao Patil Mahavidyalaya, Murum, Tq. Omerga, Dist. Osmanabad.
ABSTRACT
Life is sustained by water. In the present study, analysis of physico-
chemical parameters of Pardeswadi lake, waluj M.I.D.C. Aurangabad
lake were carried out to study the quality of water and suitability for
domestic during study period from Feb.2014 to Jan.2015. The
parameters W.T, Coloure, pH, Turbidity, TS, TDS, TSS Alkalnity,
Sulphate, phosphate, and ammonia were studied. The present
investigation revealed that the seasonal study of quality of water of this
lake showed fluctuations in physic-chemical parameters.
KEYWORDS: Pardeswadi lake, phosphate, suphate, ammonia, etc.
INTRODUCTION
Water is one of the most important compounds to the ecosystem. Better quality of water
described by its physical, chemical and biological characteristics. But some correlation was
possible among these parameters and the significant one would be useful to indicate quality
of water. The restored lakes have to be kept free from pollution to maintain their
ecosystem.[1]
The term water quality comprises the water column and the physical channel
required to maintain and sustain aquatic life.[2-3]
The Pardeswadi lake is getting polluted by
the sewage entering from the surrounding settlements, religious practices and human
activities like washing, bathing, etc. The physico-chemical parameters of water and the
dependence of all life process of these factors make it desirable to take as an environment. In
India still now several researchers have done study on physico-chemical and biological
characteristic of standing and running water resources.[4-6]
Water pollution can be analyzed
WORLD JOURNAL OF PHARMACY AND PHARMACEUTICAL SCIENCES
SJIF Impact Factor 7.421
Volume 8, Issue 7, 1334-1347 Research Article ISSN 2278 – 4357
*Corresponding Author
V. T. Kamble
Dept of Zoology, Dr.
Babasaheb Ambedkar
Marathwada University,
Aurangabad.
Article Received on
14 May 2019,
Revised on 05 June 2019, Accepted on 26 June 2019
DOI: 10.20959/wjpps20197-14093

www.wjpps.com Vol 8, Issue 7, 2019.
1335
Kamble et al. World Journal of Pharmacy and Pharmaceutical Sciences
by the changes in physical, chemical and biological properties like colour, organic / inorganic
contents and microbial load. Water quality is affected by a wide range of natural and human
influences.[7]
MATERIALS AND METHODS
Study Area
The Pardeswadi lake is 0.5km from Ramrai (Pardeswadi)village toWest, 0.5 km from
Jogeswari to North, 1.0 km from Kamlapur to East, and 1.5 km from WALUJ(Aurangbad-
Pune highway) to South and about 22 km from Aurangabad city. The present study was done
for the lake which is situated in Waluj MIDC,Aurangabad area and its geographical
coordinates are 19°54' 0" North, and 79°29' 0" East.[8]
Sampling
Water samples for the estimation of physico-chemical parameters were collected monthly
from four different sites A, B, C, and D during different seasons (winter, summer and
monsoon) over a period of one year from February 2014 to January 2015. Sample collection
was done during morning hours between 09.00 a.m. to 11.30 a.m. and brought to laboratory
for further analysis. Water samples were collected in plastic jerry canes. Parameters like
temperature, pH were estimated on the spot, while samples for other parameters were
analyzed in the laboratory as per standard methods prescribed by.[7, 8]
RESULTS AND DISCUSSION
Water temperature
Temperature is an important factor that influences primary production in reservoir. This may
be attributed to the sampling time which was between 8:00 and 10:00 am, when the water is
warmer than air. In the present investigation maximum 33.75°C was recorded in summer and
minimum 27°C in winter (Fig.1).Temperature is the important parameter which regulates the
overall environment of the aquatic ecosystem. Similar temperature fluctuations were also
observed by.[9]
Colour
Different matter present or dissolved in water imparts colour to natural water. Colour may
result due to different metallic ions, planktons or any suspended matter The colour value
ranged from145Hazen at station B in winter to 21.5Hazen B in monsoon (Fig.2).

www.wjpps.com Vol 8, Issue 7, 2019.
1336
Kamble et al. World Journal of Pharmacy and Pharmaceutical Sciences
pH
In the present study the highest pH 9.45 was recorded at sampling station B in the monsoon
(Fig.3). The minimum pH 8.463 was found at the station D summer. The values of pH are
shown in table1. The pH is in alkaline ranged which can be due to presence of alkali metals.
Turbidity
In the present study the highest turbidity 242.25NTU was recorded at sampling station „B‟ in
the summer (Fig.4). The minimum turbidity18.75NTU was found at the station „C ‟winter.
The values of turbidity are shown in table.1 Turbidity is the measure of water clarity, or the
amount of suspended materials suspended in water that can decrease the passage of light
through the water. Suspended materials include soil particles, planktonik algae, microbes and
other organisms. Turbidity can also affect the colour of the water. High turbidity increases
water temperatures because suspended particles absorb more heat. High turbidity increases
water temperatures.
Potassium
In the present study the highest potassium 1.4225 mg/l was recorded at sampling site C
(Fig.4). The lowest value 0.0287 mg/l was found at the station D in winter in the year 2014-
15.
TS
In the present study the TS value ranged from 174.75 mg/l to 441.25 mg/l. The lowest value
of TS was found in summer season at station B, while highest value of TS was recorded at
station D in winter Total hardness of water is not a pollution parameter but of water quality
mainly terms of Ca2+ and Mg2+.
TDS
In natural water dissolved solids are composed mainly of carbonate, bicarbonate, chlorides,
sulphates, phosphates, nitrates, calcium, magnesium, sodium, iron, manganese etc.[10]
In the
present study the TDS value ranged from 126.25 mg/l to 174.00 mg/l .The lowest value of
TDS was found in summer season at station C, while highest value of TDS was recorded at
station A in monsoon. Similar observation was made by Salve and Hiware, (2006), Raut et.
al.,2011.

www.wjpps.com Vol 8, Issue 7, 2019.
1337
Kamble et al. World Journal of Pharmacy and Pharmaceutical Sciences
TSS
Total suspend solids are the cause of suspend particles into water body influences turbidity
and transparency. in the present investigation, total suspended solids were ranged from 15.25
mg/l to 214.25 mg/l. The lowest value of TSS was found at station B in summer where as
highest value at station A in the same season.
Alkalinity
Alkalinity of water is a major of its capacity to neutralize acids.[9]
In the present study the
total alkalinity ranged from 48.5. to 97.75 mg/l, being minimum in winter and maximum in
summer season(Fig.9). Accumulation of large quantity of bicarbonate might be due to
organic decomposition and decrease in water level. It is composed primarily of carbonate
(co32-
) and bicarbonate(hco3-
). Alkalinity acts as a stabilizer for pH. Alkalinity, pH and
hardness effect the toxicity of many substances in the water. Alkalinity in boiler water
essentially results from the presence of hydroxyl and carbonate ions. Hydroxyl alkalinity
(causticity) in boiler water is necessary to protect the boiler against corrosion. Too high a
causticity causes other operating problems, such as foaming. Excessively high causticity
levels can results in a type of caustic attack of the boiler called “embrittlement”.[18]
Sulphate
During this study Sulphate ranged from 1.15 mg/l to 18.6 mg/l. It was maximum in summer
season at station D and minimum in monsoon season at station A. Sulphate is a naturally
occurring ion found all most in all types of water and its concentration occurs in wide ranges
in natures. Similar result was observed by.[12-15]
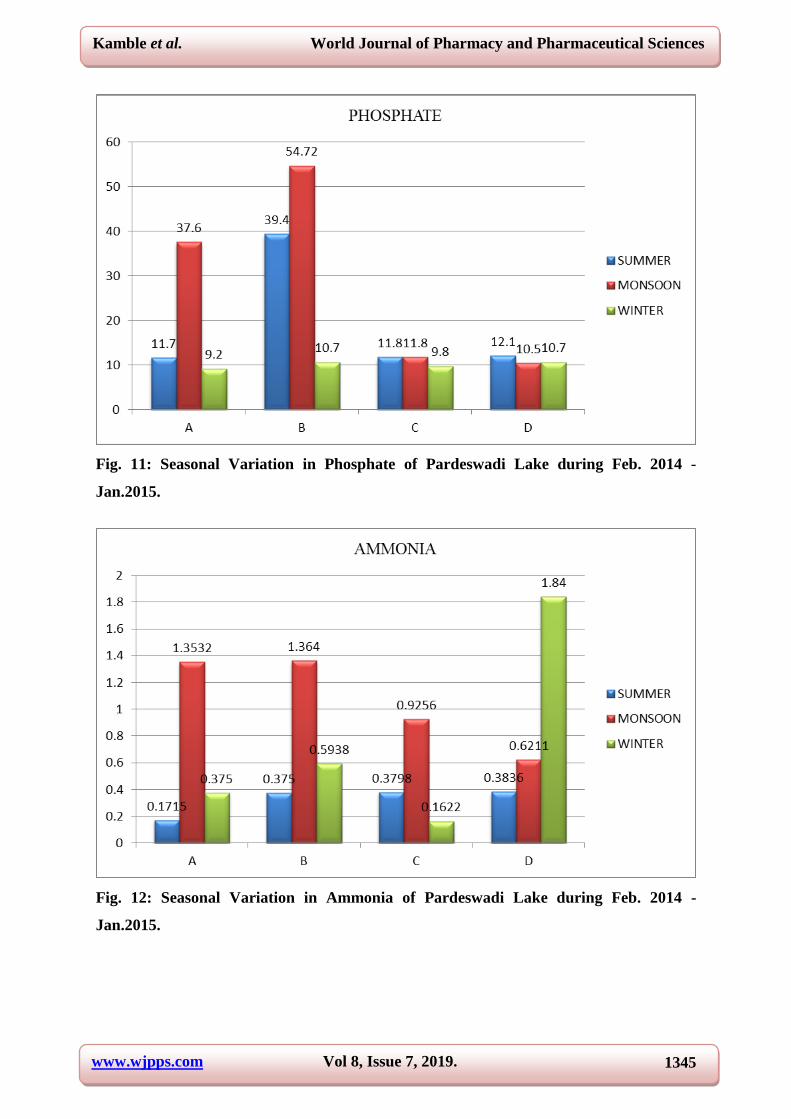
Phosphate
Phosphate is the most important nutrient for the production of phytoplankton in freshwater
which is the primary food for many of the commercial fishes. Phosphates occur in small
amounts in all aquatic environments and are required to maintain the growth and metabolism
of aquatic plants including algae.[16]
In the present study the phosphate concentration ranged
between 9.2mg/l to 39.4 mg/l, being higher in monsoon at station B low in winter season at
station A. The higher phosphate concentration in monsoon might be owing to on flux through
rain water.

www.wjpps.com Vol 8, Issue 7, 2019.
1338
Kamble et al. World Journal of Pharmacy and Pharmaceutical Sciences
Ammonia
The most important source of ammonia in water bodies is the ammonification of organic
matter. In higher concentrations ammonia becomes harmful to fishes and other biota. In the
present studyammonia ranged from 0.1715 mg/l to 1.84 mg/l. It was maximum in winter
season at station D and minimum in summer season at station A. The high ammonia content
during winter might be due to the decomposition of organic matter.[17]

www.wjpps.com Vol 8, Issue 7, 2019.
1339
Kamble et al. World Journal of Pharmacy and Pharmaceutical Sciences
Table 1. Seasonal Study of Physico-chemical Parameters of Pardeswadi Lake in the year 2014-2015.
stations
Parameters
W.T
(0ºC)
colour
Hazen pH
Turbi
dity
(NTU)
pota
ssiu
m
T.S
(mg/
l)
TDS
(mg/
l)
TSS
(mg/
l)
Alkali
nity
(mg/l)
Sulpha
te
(mg/l)
Phosp
hate
Amm
onia
Phosp
hate
(mg/l)
Seasons
A
Summer 33.75 42.75 8.55 193.75 0.87
5
388.
00
173.
75
214.
25 88.00 1.15 11.7
0.171
5
monsoon 29.75 111.00 9.15 53.75 1.15
5
218.
75
174.
00
71.5
0 78.25 1.20 37.6
1.353
2
Winter 27.00 132.75 8.52
5 99.40
0.64
25
262.
75
150.
25
112.
50 73.75 0.00 9.2 0.375
.
B
Summer 33.75 33.50 8.52
5 242.25
0.75.
25
441.
25
171.
75
15.2
5 60.75 2.92 39.4 0.375
monsoon 29.75 21.5 9.45 105 0.80
5
257.
5
145.
25
112.
5 53.25 5.24 10.2 1.364
Winter 27 145 9.01
2 115.25
1.16
25 280
150.
25
129.
25 48.5 0.00 10.7
0.593
8
C
Summer 33.75 38.75 8.7 24.5
0.67
75
287.
75
126.
25 20.5 78.75 2.15 11.8
0.379
8
Monsoon 29.75 43.75 8.55 88 1.06 247.
5
146.
25
102.
5 65.25 1.20 11.8
0.925
6
Winter 27 140.5 8.52
5 18.75
1.42
25
174.
75
154..
25 26.5 56.25 0.00 9.8
0.162
2
D
Summer 33.75 27.75 8.46
3 179.25
0.78
25 367
166.
5
200.
5 97.75 18.6 12.1
0.383
6
monsoon 29.75 112.25 8.82
5 39.25
0.72
5
184.
25
131.
75 52.5 83.75 0.00 10.5
0.621
1
Winter 27 132. 8.97
5 111.25
0.02
875 256
156.
75
99.2
5 73.5 0.00 10.7 1.84

www.wjpps.com Vol 8, Issue 7, 2019.
1340
Kamble et al. World Journal of Pharmacy and Pharmaceutical Sciences
Fig. 1: Seasonal Variation in W.T. of Pardeswadi Lake during Feb. 2014 - Jan.2015.
Fig. 2: Seasonal Variation in Colour of Pardeswadi Lake during Feb. 2014 - Jan.2015.

www.wjpps.com Vol 8, Issue 7, 2019.
1341
Kamble et al. World Journal of Pharmacy and Pharmaceutical Sciences
Fig. 3: Seasonal Variation in pH of Pardeswadi Lake during Feb. 2014 - Jan.2015.
Fig. 4: Seasonal Variation in Turbidity of Pardeswadi Lake during Feb. 2014 -
Jan.2015.

www.wjpps.com Vol 8, Issue 7, 2019.
1342
Kamble et al. World Journal of Pharmacy and Pharmaceutical Sciences
Fig. 5: Seasonal Variation in Potassium of Pardeswadi Lake during Feb. 2014 -
Jan.2015.
Fig. 6: Seasonal Variation in TS of Pardeswadi Lake during Feb. 2014 - Jan.2015.

www.wjpps.com Vol 8, Issue 7, 2019.
1343
Kamble et al. World Journal of Pharmacy and Pharmaceutical Sciences
Fig. 7: Seasonal Variation in TDS of Pardeswadi Lake during Feb. 2014 - Jan.2015.
Fig. 8: Seasonal Variation in TSS of Pardeswadi Lake during Feb. 2014 - Jan.2015.

www.wjpps.com Vol 8, Issue 7, 2019.
1344
Kamble et al. World Journal of Pharmacy and Pharmaceutical Sciences
Fig. 9: Seasonal Variation in Alkalinity of Pardeswadi Lake during Feb. 2014 -
Jan.2015.
Fig. 10: Seasonal Variation in Sulphate of Pardeswadi Lake during Feb. 2014 -
Jan.2015.
www.wjpps.com Vol 8, Issue 7, 2019.
1345
Kamble et al. World Journal of Pharmacy and Pharmaceutical Sciences
Fig. 11: Seasonal Variation in Phosphate of Pardeswadi Lake during Feb. 2014 -
Jan.2015.
Fig. 12: Seasonal Variation in Ammonia of Pardeswadi Lake during Feb. 2014 -
Jan.2015.

www.wjpps.com Vol 8, Issue 7, 2019.
1346
Kamble et al. World Journal of Pharmacy and Pharmaceutical Sciences
CONCLUSION
The present investigation of physico-chemical parameters of pardeswadi lake shows complete
information by taking important parameters like water temperature, color , PH, turbidity,
potassium, TS, TDS, TSS, phosphate, sulphate , alkalinity and ammonia. The winter, summer
and monsoon season shows seasonal fluctuation in various physico-chemical parameters. The
physico-chemical parameters are important to determine the quality of water body.
ACKNOWLEDGEMENT
We are thankful to Dr. C. A. Jawale, Shri Madhavrao Patil Mahavidyalaya, Murum,Tq.
Omerga, Dist. Osmanabad to guide us for our work and Head of the Dept. of Zoology, Dr.
Babasaheb Ambedkar Marathwada University, Aurangabad (M.S.) India to give us laboratory
facility.
REFERENCES
1. Anbarasu, K. and G. Anbuselvan (2013). Physico-chemical parameter analysis of water in
Musiri Taluk, Tamil Nadu, India. EISSN 2543-5426.
2. Jha, P., Barat, S. Hydrobiological study of the Lake Mirik in Darjeeling Himalyas.
Environmental Biology. 2003; 24(3): 339-344.
3. Sharma, J. N., Kanakiya, R. S.,Singh, S.K. Limnalogical study of water quality parameter
of DAL Lake, India, International journal of Innovative Research in science, Engineering
and Technology. 2015; 4(2): 380-386.
4. Pandey, A. K., Siddiqi S. Z. and Rama Rao, Physico-chemical and Biological
Characteristics of Husain Sagar, an Industrially Polluted Lake, Hyderabad. Proc. Acad.
Environ. Biol., 1993; 2(2): 161-167.
5. Trivedy, R. K. and Goel P. K., Chemical and Biological Methods for Water Pollution
Studies, Environmental Publication, Karad, (1986), Maharashtra.
6. Kodarkar, M. S.(1992). Methodology for Water Analysis, Physico-chemical, Biological
and Microbiological. Indian Association of Aquatic Biologists, Hyderabad, 2nd Edition,
pp. 50.
7. Sunder Singh Analysis of Plankton Diversity and Density with Physico-Chemical
Parameters of Open Pond in Town Deeg (Bhratpur) Rajasthan, India 2015; 4(11): 61-69.
8. Kamble, V. T. . and C. A. Jawale (2019), physico-chemical assessment of pardeswadi
lake waluj MIDC. Aurangabad (M. S.) India.

www.wjpps.com Vol 8, Issue 7, 2019.
1347
Kamble et al. World Journal of Pharmacy and Pharmaceutical Sciences
9. Deepshikha, G., Singh, R.V. and Sathish, K.M. 2008. Physico- chemical analysis of
ground water quality of Bharatpur district during the pre- monsoon season, 2007. Indian
J. Environ and Ecoplan. 15(1-2): 141146.
10. Esmaeili, H R and Johal, M S, Study of physicochemical parameters of water of
Gobindsagar reservoir, India, In Proceeding of National Seminar on New Trands in
Fishery Development in India, Panjab University, Chandigarh, India,2005.
11. Aher, S.K., mane, U.H., and Pawar, B.A. A study on physic chemical parameters of
kagdipura swamp in Realation to Pisciculture near Aurangabad, Maharashtra. J. aqua.
boil., 2007; 22(1): 93-96.
12. Mane, A.M. and Pawar, S.K. (2007). Some physicochemical properties of Manar River of
Nanded district. Maharashtra. J. Aqua. Boil., 2007; 22(2): 88-90.
13. kajalakshmi, s. and sreelatha, k. Studies on physicochemical parameters of river goutami
Godavari yanam (union territory of Pondicherry). J Aqua. Biol., 2005; 20(2): 110-112.
14. Ravi kumar, manjappa, S., kiran, B.R. and puttaiah E.T. Hydrochemistry of ayyanakere
tank in harapanahalli town, davangere district of Karnataka.J.aqua.biol., 2005; 20(2): 117-
120.
15. Shankar,P. Hosmani1, T.B. Mruthunjaya, (2013)Impact of Plankton diversity on the
water quality index in a lake. at Thirumakudal, Narasipura, Mysore District.
16. Lianthuamluaia, Asha T. Landge, C. S. purushothaman, Geetanjali Deshmukhe and
karankumar k. Ramteke.(2013) Assessment of seasonal variations of water quality
parameters of savitri reservoir, poladpur, raigad district, Maharashtra.
17. Patil,P.N,Sawant.D.V,Deshmukh.R.N.,(2012),Physico-Chemical Parameter for testing of
water-Areview Volume3,ISSN0976.