seasonal growth, retention, and movement of juvenile … · seasonal growth, retention, and...
TRANSCRIPT
SEASONAL GROWTH, RETENTION, AND MOVEMENT OF JUVENILE COHO
SALMON IN NATURAL AND CONSTRUCTED HABITATS OF THE MID-
KLAMATH RIVER
by
Shari K. Witmore
A Thesis Presented to
The Faculty of Humboldt State University
In Partial Fulfillment of the of the Requirements for the Degree
Master of Science in Natural Resources: Fisheries
Committee Membership
Dr. Darren Ward, Committee Chair
Dr. Margaret Wilzbach, Committee Member
Dr. Bret Harvey, Committee Member
Alison O’Dowd, Graduate Coordinator
July 2014

ABSTRACT
Seasonal growth, retention, and movement of juvenile coho salmon in natural and constructed habitats of mid-Klamath River
Shari K. Witmore
Juvenile coho salmon (Onchorynchus kisutch) in the Klamath River basin often
move long distances when natal streams become inhospitable due to high summer
temperatures and high winter flows. Therefore, non-natal rearing sites such as tributaries
and off- channel ponds are potentially important to the survival of juvenile coho salmon.
This study evaluated the potential benefit to juvenile coho salmon of different types of
non-natal rearing habitats in the mid-Klamath watershed including tributaries, beaver-
influenced ponds, and constructed off-channel ponds. These sites represent different
types of seasonal refugia habitat. Juvenile coho salmon were PIT tagged and measured in
ten study sites to evaluate their growth, retention within the habitats, and seasonal
movement patterns. Few relationships were found between type of site and growth rate,
retention rate, or abundance. However, growth rate of fish which reared year-round in
the same site was greater in beaver-influenced sites than in other habitat types. Depth,
water temperature, volume of habitat, and percent riparian cover were not correlated with
growth rates of coho salmon rearing in those sites. However, because I found significant
differences in growth rates of fish across individual sites, there may be other habitat
characteristics not measured as part of this study that influence growth. Retention rate
ii

was positively correlated with average maximum depth; however the summer retention
rate of juvenile salmon at the sites was not correlated with salmon growth at the sites. I
observed three seasonal movement patterns of juvenile coho salmon: spring redistribution
of fry; fall redistribution associated with initial high flows, and outmigration of smolts
during the following spring. A diurnal movement pattern was also detected at the mouths
of Tom Martin Creek and Caltrans Pond in which juvenile coho salmon left the study site
in the evening and returned in the early morning. This exploratory study showed that not
only do juvenile coho salmon in the mid-Klamath display several different migratory
patterns; choosing different types of off-channel habitats to rear, but the growth and
retention rates of those fish depend on complex and site specific characteristics rather
than type of habitat.
iii

ACKNOWLEDGMENTS
First and foremost I thank my employer National Marine Fisheries Service for
providing me the opportunity and funding to pursue my Master’s Degree under the
Advanced Studies Program. Specifically, I thank Irma Lagomarsino, Clarence Hostler,
and Kevin Chu for supporting my participation in the program. Most of all, thank you to
Clarence for affording me these last two years while skimping by with one less employee
when times are tight. Secondly, I thank my adviser Dr. Darren Ward who offered me
much more guidance and advice than I could have hoped for. His availability, patience,
and sense of humor assisted me each step of the way and was vital to the completion of
this project.
I’d also like to thank the Karuk Tribe, in particular Toz Soto and Ken Brinkman
for their support, local expertise, and help collecting the data that went into this project.
Along with Toz, Will Harling and the mid-Klamath Watershed Council provided
valuable guidance in developing the methods for data collection. I also thank Dr.
Michael Pollock for his help, review, and support throughout the project. Dr. Pollock’s
work initially inspired me to pursue my Master’s Degree and I was fortunate enough to
participate in brainstorming sessions which were instrumental in the development of the
research questions. Thank you to Dr. Peggy Wilzbach and Dr. Bret Harvey for their
review of this document and to Meiling Roddam, my fellow grad student who spent
many hours side by side in the lab working through the ups and downs of data analysis
and thesis writing!
iv

TABLE OF CONTENTS
Page
ABSTRACT ........................................................................................................................ ii
INTRODUCTION ...............................................................................................................1
Study Area .....................................................................................................................7
METHODS ........................................................................................................................12
Capture and Tagging Methods .....................................................................................12
Marking Techniques ....................................................................................................15
Habitat ..........................................................................................................................17
Abundance ...................................................................................................................18
Growth .........................................................................................................................19
Retention ......................................................................................................................20
Movement ....................................................................................................................23
Data Analysis ...............................................................................................................23
Comparison of habitat types ...................................................................................... 23
Identifying patterns in movement .............................................................................. 24
RESULTS ..........................................................................................................................26
Capture/PIT tagging .....................................................................................................26
Habitat ..........................................................................................................................30
Population Abundance and Density .............................................................................34
Growth .........................................................................................................................38
Retention ......................................................................................................................45
Movement ....................................................................................................................47
DISCUSSION ....................................................................................................................59
Alternative Habitat Parameters that May Explain Biological Responses ....................60
Movement Patterns and Strategies ...............................................................................62
Future Research ...........................................................................................................64
v

LITERATURE CITED ......................................................................................................68
APPENDIX A ....................................................................................................................75
vi

LIST OF FIGURES
Figure 1. Study site locations in the mid-Klamath watershed of northern California. .... 11 Figure 2. Potential recapture sites in the Klamath River. ................................................ 14 Figure 3. Proportion of study sites occupied in relation to main stem Klamath River
maximum weekly average temperature (MWAT), .......................................... 27 Figure 4. Mean weekly maximum temperatures during summer 2012 in the main
stem .................................................................................................................. 32 Figure 5. Average (+/- standard error) summer growth rates of juvenile coho salmon
at each study site, .............................................................................................. 39 Figure 6. Average winter growth rates (+/- standard error) of juvenile coho salmon at
each study site ................................................................................................ 40 Figure 7. Average growth rates (+/- standard error) for individual juvenile coho
salmon occupying the same habitat both in the summer and winter. ............... 43 Figure 8. Average growth rates of fish in habitat types which remained at a site in
both summer and winter seasons, with mean and standard error shown. ........ 44 Figure 9. Retention rate (overall ɸ) and standard error of juvenile coho salmon at
each study site. ................................................................................................. 46 Figure 10. Diurnal movement of juvenile coho salmon at the mouth of Tom Martin
Creek from August 14th - September 14th 2012. ............................................. 48 Figure 11. Diurnal movement of juvenile coho salmon in Seiad Creek at the mouth
of Caltrans Pond from July 14th - July 22nd 2012. ........................................... 49 Figure 12. Median fork length of juvenile coho salmon over time at each type of
habitat. ............................................................................................................. 54 Figure 13. Number of tagged fish from each study site in the Seiad Creek watershed
are shown over time as they were detected at the mouth of Seiad Creek. ...... 56 Figure 14. The proportion of fish tagged in Alexander, Caltrans, and Seiad Creek
Beaver pond during the summer (May - November 2012) which were detected moving out of Seiad Creek during different movement events. ....... 58
vii

LIST OF TABLES
Table 1. Selected study sites in the mid-Klamath basin, California. ................................. 9 Table 2. Proportion of captured juvenile coho salmon from mid-Klamath River
study sites which were large enough to PIT tag, ............................................... 16 Table 3. Number of capture events and the stop and start sampling dates ...................... 22 Table 4. Juvenile coho salmon tagging summary for the summer sampling season
(May 2012 - November 2012) ........................................................................... 28 Table 5. Juvenile coho salmon tagging summary during the winter sampling season
(November 2012 - March 2013) ........................................................................ 29 Table 6. Physical habitat data summary representing summer conditions during
2012 for each study site. .................................................................................... 31 Table 7. Minimum and maximum recorded dissolved oxygen levels (mg/l) for
constructed ponds............................................................................................. 33 Table 8. Summer (May 2012 - November 2012) and winter (November 2012 -
March 2013) population estimates and densities of juvenile coho salmon ....... 35 Table 9. Average densities, seasonal growth rates, and rates of retention of juvenile
coho salmon ....................................................................................................... 36 Table 10. Test statistics for various response and predictor variables across the study
sites. .................................................................................................................. 37 Table 11. Total number of fish tagged at each study site having both summer and
winter occupancy, and the proportion of tagged fish that remained both seasons. ............................................................................................................. 42
Table 12. Detection of tagged fish found in locations other than where tagged ............. 51 Table 13. Summary of movement events documented when tagged fish were
detected in locations other than where initially tagged. ................................... 53
viii

1
INTRODUCTION
Many streams in the Western United States and the Klamath Basin have been
altered from human activities which have reduced or degraded habitat for salmonid fishes
(Hicks et al 1991). Due to habitat destruction, over fishing, hatcheries, dams, and climate
change, the range and abundance of coho salmon (Oncorhynchus kisutch) have been
greatly reduced, resulting in the federal listing of many coho salmon populations as
threatened or endangered (Nehlsen et al. 1991, CDFG 2002). Of particular concern are
populations at the southern end of their range, including the Southern Oregon/Northern
California (SONCC) coho salmon Evolutionarily Significant Unit (ESU), which
encompasses the Klamath Basin. For this project, I compared seasonal habitat use,
growth, and movement of juvenile coho salmon between natural habitats and habitats
created specifically to enhance coho salmon populations in the mid-Klamath Basin. The
overall goal of this study was to collect information to help guide habitat improvement
projects that target coho salmon recovery.
In the Upper Klamath, severe hydrologic alteration has been occurring for more
than 100 years to support irrigation and hydropower. Five dams and hundreds of miles of
canals and pumps support significant water withdrawals, diversions, and transfers
throughout the Upper Klamath. Historic mining, logging, and road building practices
have contributed to significant environmental degradation in the mid-Klamath and Lower
Klamath sub basins (NMFS 2012). Because of these alterations, many streams are now

2
much warmer, shallower, less complex, and have more riffle habitat than they did a
century ago (Chamberlin et al. 1991; Hicks et al. 1991). These habitat changes have
significant implications for production of juvenile coho salmon.
Coho salmon typically have a 3-year life cycle. Fry emerge from the gravel in the
early spring, rear for one year in freshwater, and migrate to the ocean as smolts in the
spring. Two growing seasons are usually spent in the ocean before fish return to their
natal streams to spawn and die as three year olds. Studies of habitat use and movement
patterns in juvenile coho salmon have indicated two major movement events prior to
seaward migration: dispersal of fry following emergence in the spring/early summer
(Kahler et al 2001) and movement of parr to low velocity or off-channel rearing areas in
the fall and winter (Hartman and Brown 1987). In summer, fry movement may be a
response to poor habitat conditions such as a declining stream discharge, increasing water
temperature, low levels of prey availability, or high population density (Bilby and Bisson
1987, Bjornn 1971, Wilzbach 1985, Rosenfeld 2005). In winter, movement is likely a
response to increasing water velocities (Nickelson et al. 1992a, Giannico and Healy
1998). Coho salmon from locations in the Shasta River sub-basin of the Klamath River
basin have been found to exhibit seasonal movement in both summer and winter (Adams
2013).
In summer, the main stem Klamath River and major tributaries of the mid-
Klamath suffer from high water temperatures and low flows (Lynch and Risley 2003)
which can negatively affect juvenile salmonids. High water temperatures have been

3
shown to limit the distribution of salmonids within streams (Meisner 1990), reduce
abundance (Ebersole et al. 2001), and fragment populations within a watershed
(Matthews and Zimmerman 1990). Preferred temperature ranges for juvenile coho
salmon rearing have been reported from 11.4 - 14.6 ºC (Beschta et al 1987, Coutant 1977,
Brett 1952) with lethal temperatures occurring at 25.8 ºC (Beschta et al 1987) and
cessation of growth at a temperature of 20.3 ºC (Reiser and Bjornn 1979, Brett 1952). In
the Seiad Valley region of the Klamath River, main stem temperatures can range from 21
– 27 ºC in July and August with daily extremes as high as 29.5 ºC (Bartholow 2005,
Belchik 1997). Besides directly causing physiological stress, elevated water temperatures
in the Klamath River are correlated with prevalence of diseases including Ceratomyxa
shasta that cause mortality in Klamath River coho salmon (Ray et al 2012).
Given warm summer conditions that can occur in the main stem Klamath River
and major tributaries, many juvenile coho salmon born in these locations disperse and
seek suitable thermal habitat for summer rearing. The fate of juvenile coho salmon that
emigrate from natal habitats in response to summer habitat change is not known. Jeffres
and Moyle (2012) suggest that juvenile coho salmon that emigrate from the Shasta River
(a major Klamath tributary) in response to increasing water temperatures in the lower
Shasta River in spring are likely to perish from high temperatures and harsh conditions
they encounter in the main stem Klamath River. However, small tributaries and natural
reservoirs such as off- channel ponds and beaver ponds often interact with ground water,
and are potential sources of cool water through the summer (Knowles et al. 2006,

4
Kiparsky and Gleick 2003). Such habitats are available in many small tributaries of the
mid-Klamath, potentially allowing for survival of emigrating juvenile coho salmon.
In winter, the same natural reservoir features that can function as cool water
storage sites in the summer may also provide refuge from high winter flows for juvenile
coho salmon. Availability of slow water habitats is important to growth and survival of
coho salmon during the winter. Multiple studies show that off-channel ponds on the
floodplain play a major role in the life history of juvenile coho salmon during their winter
rearing period (Peterson 1982, Pollock et al. 2004, Tschaplinski and Hartman 1983). The
number of juveniles found in main stem habitat declines significantly as flow increases in
the fall, while the number of individuals increases in off-channel ponds, around large
wood structures, and undercut banks (McMahon and Hartman 1989, Tschaplinksi and
Hartman 1983). Nickelson et al. (1992a) concluded that if spawning escapement was
adequate, production of wild coho salmon smolts in most streams on the Oregon Coast
would probably be limited by availability of adequate winter habitat. However,
considering the severity of water quality stressors in the Klamath River basin
(Bartholomew 2005, NMFS 2012), summer conditions may present a threat of direct
mortality, independent of density.
Human activities in the Klamath River basin have reduced the amount of summer
and winter rearing habitat available to juvenile coho salmon, contributing to the decline
of local salmon populations and triggering restoration efforts for habitat improvement.
Many stream reaches in the basin have been straightened, diked and leveed to allow for

5
urbanization, road building, and agriculture (NRC 2008). These activities result in
channelization, channel simplification, acceleration of water velocity, and reduction in
the extent and accessibility of off-channel habitats for juvenile coho salmon (Bilby and
Bisson 1987; Lawson et al. 2004). Due to these past human activities, the principle
stresses to coho salmon in this stretch of the river are believed to be impaired water
quality (high water temperature) and lack of floodplain and channel structure (NMFS
2012).
Restoration actions that increase habitat complexity (i.e. LWD, off-channel
habitat) have been shown to increase the abundance of coho salmon occupying the site
and increase their overwinter survival (Solazzi et al. 2000). However, in-stream
restoration techniques used to create complex habitat can have varying results depending
on how and where the habitats are created. Cooperman et al (2006) found that
engineered off-channel ponds were most effective in supporting juvenile coho salmon use
when they were connected to a ground water source and if they received regular
maintenance. Morley et al. (2005) found that constructed channels supported equal or
higher densities of juvenile coho salmon than the natural side channels. It is not clear
from previous studies whether habitat improvement efforts intended to provide winter
refugia also provide suitable sites for summer rearing of juvenile coho salmon.
As restoration activities continue to focus on the construction of off-channel habitats
for winter and summer rearing, it is important to understand what habitat characteristics
contribute to growth and survival of juvenile coho salmon. Smaller-scale habitat
associations of fish are commonly defined in terms of preference for or use of discrete

6
habitat types (e.g., pools versus riffles; Nickelson et al. 1992a) or microhabitats defined
in terms of velocity, depth, and substrate (Moyle and Baltz 1985). Inferring habitat
requirements or identifying limiting habitats from such approaches is challenging
(Rosenfeld 2003). However, field investigations of fish presence, abundance, and growth
across habitats is often the only way to get information about how fish performance is
related to habitat characteristics. Using this approach, Nickelson et al (1992b) examined
the use of constructed and natural habitats by juvenile coho salmon and concluded that
the construction of off-channel habitats has the greatest potential to increase production
of coho salmon smolts.
In this study, I compared the seasonal movement and growth of juvenile coho
salmon occupying three different types of summer and winter habitats in the mid-
Klamath watershed: constructed off- channel ponds, beaver- influenced sites, and small
tributaries. I sampled these site types in order to determine if off-channel ponds
constructed during habitat restoration and improvement efforts are able to support coho
salmon growth and abundance at levels comparable to natural tributary and beaver-
influenced habitats. I had three specific research questions: 1) do coho salmon
abundance, growth, or retention rates differ among the three types of habitats? 2) Is coho
abundance, growth, and retention rate associated with biotic and abiotic habitat
characteristics (e.g., pool depth, volume of habitat, water temperature, and population
density) measured at the sites? 3) What are the patterns of coho salmon movement at the
sites? I hypothesized that fish would be more abundant, grow faster, and stay longer in
the slow water habitats than the tributary sites. Further, I expected to see higher growth

7
rates in deeper pools, larger habitats, and cooler water temperatures. Knowing that
Klamath River coho salmon are highly migratory, I expected to see a spring and fall
redistribution of juvenile coho salmon when seeking summer and winter rearing habitats.
Study Area
The Klamath River is located in Southern Oregon and Northern California,
draining a basin encompassing almost 41,440 square kilometers. The river flows for
approximately 423 kilometers and has been referred to as the “upside down river”
because of its geography (Rymer 2009). Typical rivers originate high in the mountains,
with steep gradients and are relatively undeveloped until they reach valleys where
gradients are lower, temperatures are warmer, and there is an increased level of
urbanization. The Klamath River originates in the arid deserts of eastern Oregon, which
contain a considerable amount of urbanization and agriculture. Low gradients and large
reservoirs are present in the upstream reaches of the Klamath watershed. However, the
lower reaches of the river run through the temperate rainforests of California and remain
relatively undisturbed with mostly tribal and federal land ownership.
Hydropower dams were constructed in the upper reaches of the Klamath basin in
the early to mid-1900’s and continue to alter main stem flows. Operations of the
upstream Iron Gate, Copco 1 and 2, JC Boyle, and Keno dams significantly alter flow
regimes resulting in low summer flows, elevated temperatures, and impaired water
quality downstream of the dams (NRC 2008, Stocking and Bartholomew 2007).
8
The mid-Klamath subbasin is comprised of the portion of the Klamath River
watershed between Iron Gate Dam (river mile 190.1) and the Trinity River confluence
(river mile 43.4) excluding the major tributaries, Shasta, Scott, and Salmon Rivers.
Nearly this entire region is in the northern California counties of Siskiyou and Humboldt,
with a very small amount of the subbasin in southern Oregon’s Jackson County.
Ten sites in the mid-Klamath River basin were selected for study (Table 1). Sites
included a mix of natural and constructed habitats. All sites are located in the mid-
Klamath subbasin and are known from previous sampling efforts (pers. comm., Soto) to
provide seasonal habitat for coho salmon. Other aquatic species may be found at the
sites, particularly Caltrans pond which has the highest densities of non-native species.
However, in most locations coho salmon are the primary species captured.
9
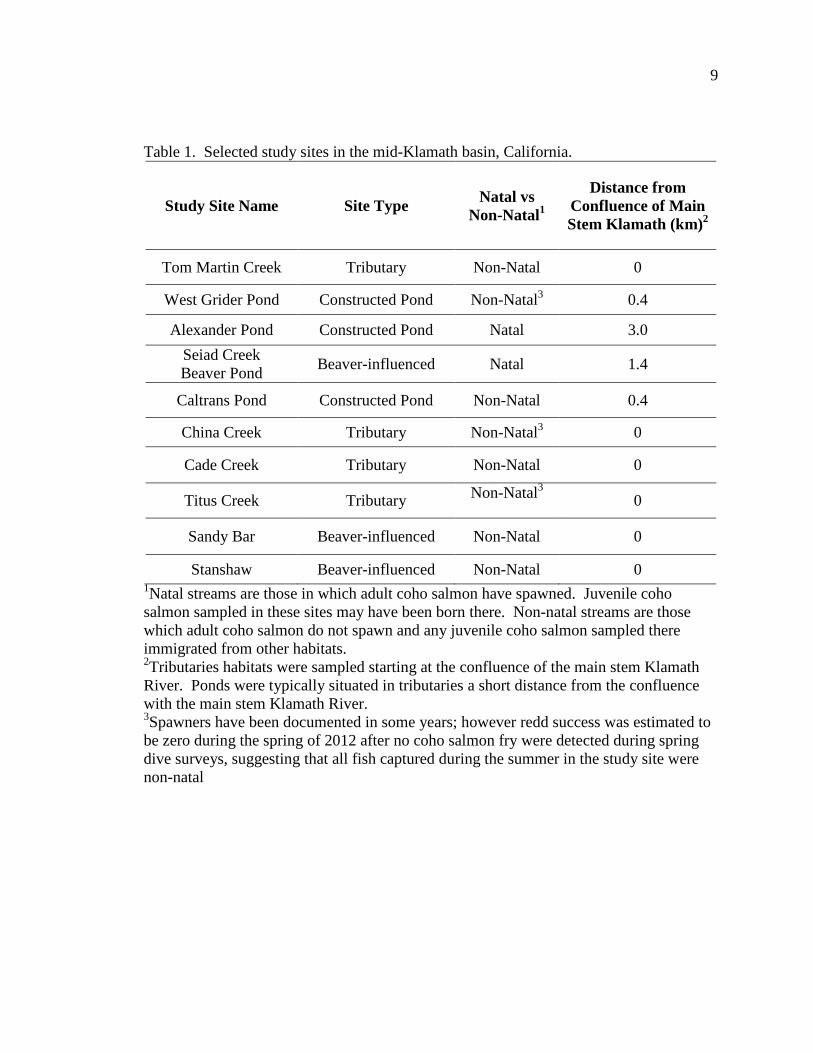
Table 1. Selected study sites in the mid-Klamath basin, California.
Study Site Name Site Type Natal vs Non-Natal1
Distance from Confluence of Main Stem Klamath (km)2
Tom Martin Creek Tributary Non-Natal 0
West Grider Pond Constructed Pond Non-Natal3 0.4
Alexander Pond Constructed Pond Natal 3.0 Seiad Creek Beaver Pond Beaver-influenced Natal 1.4
Caltrans Pond Constructed Pond Non-Natal 0.4
China Creek Tributary Non-Natal3 0
Cade Creek Tributary Non-Natal 0
Titus Creek Tributary Non-Natal3 0
Sandy Bar Beaver-influenced Non-Natal 0
Stanshaw Beaver-influenced Non-Natal 0 1Natal streams are those in which adult coho salmon have spawned. Juvenile coho salmon sampled in these sites may have been born there. Non-natal streams are those which adult coho salmon do not spawn and any juvenile coho salmon sampled there immigrated from other habitats. 2Tributaries habitats were sampled starting at the confluence of the main stem Klamath River. Ponds were typically situated in tributaries a short distance from the confluence with the main stem Klamath River. 3Spawners have been documented in some years; however redd success was estimated to be zero during the spring of 2012 after no coho salmon fry were detected during spring dive surveys, suggesting that all fish captured during the summer in the study site were non-natal
10
The ten study sites are located in the mid-Klamath watershed and geographically
range from near Somes Bar, upstream to the confluence of the Scott River (Figure 1). The
off-channel ponds were constructed by Mid-Klamath Watershed Council (MKWC) and
the Karuk Tribe for the purpose of providing winter rearing habitat, however fish may
occupy the sites in the summer season as well. Of the three beaver-influenced sites, one
(Seiad Creek beaver pond) contains a channel-spanning dam, while the other two are
natural off-channel water features at the confluence of small streams and the Klamath
River. The Seiad Creek beaver pond is likely the only beaver-influenced site with natal
fish rearing in the mid-Klamath River. The four small tributaries (0.05-0.25 m3/sec
summer base flow) selected for the study flow into the mid-Klamath River and each
support non-natal juvenile coho salmon. These tributaries provide cool water refugia
from the warmer water temperatures of the mid-Klamath River; however they do not
contain significant complex or off-channel habitat. In each of these streams, the
sampling reach extended from the confluence with the main stem Klamath River
upstream far enough to allow the capture of the majority of non natal fish. Sampling
reaches extended from 55 meters (Tom Martin Creek) where a barrier blocked upstream
migration, to 195 meters (Titus Creek) where the stream gradient became steeper and
pools were less frequent.

11
Figure 1. Study site locations in the mid-Klamath watershed of northern California.

12
METHODS
Capture and Tagging Methods
Fish capture, handling and tagging procedures were approved through Humboldt
State University Institutional Animal Care and Use Permit 11/12.F.71-A. To determine
the growth and movement patterns of individual fish, a mark and recapture program using
PIT tags was used, and was similar to that previously used by the Karuk Tribe. The
Karuk Tribe helped develop the sampling protocol and assisted during each sampling
event. Fish were captured in each of the ten study sites using seine nets and fyke traps,
depending on the time of year and depth of water. The summer sampling season began
May 30th 2012 and continued through November 2012. The winter sampling season
occurred from December 2012 through March 2013. A presence/absence snorkeling
survey was completed at each site during the first week of sampling, and weekly
thereafter until presence of juvenile coho salmon was confirmed and sampling could
begin. Initially, sampling efforts aimed to sample each site at least two times per month
in order to tag as many fish as possible. As main stem temperatures increased, additional
fish immigrated into the cool water habitats, providing new opportunities for tagging.
Sampling frequency declined to once per month in October. Captured juvenile coho
salmon were tagged (see marking techniques below), fork length (nearest mm) and
weight (nearest 0.1g) were measured and recorded, and fish were returned to the habitat
where initially captured. Recaptured fish were measured, weighed, and released. In
addition to recapturing fish at the study sites, fish were also detected as they passed PIT

13
tag antennas or were recaptured as part of other studies which are spread throughout the
Klamath River basin (Figure 2).

14
Figure 2. Potential recapture sites in the Klamath River. Fish captured at seine and trapping sites are scanned for PIT tags

15
A mobile PIT tag array, consisting of several deep cycle 12 volt batteries and a
hand-held scanner was set up temporarily at several of the sites, including the outlets of
Caltrans Pond (July 13 –July 22nd, 2012) and Tom Martin Creek (August 14 – September
14, 2012).
Marking Techniques
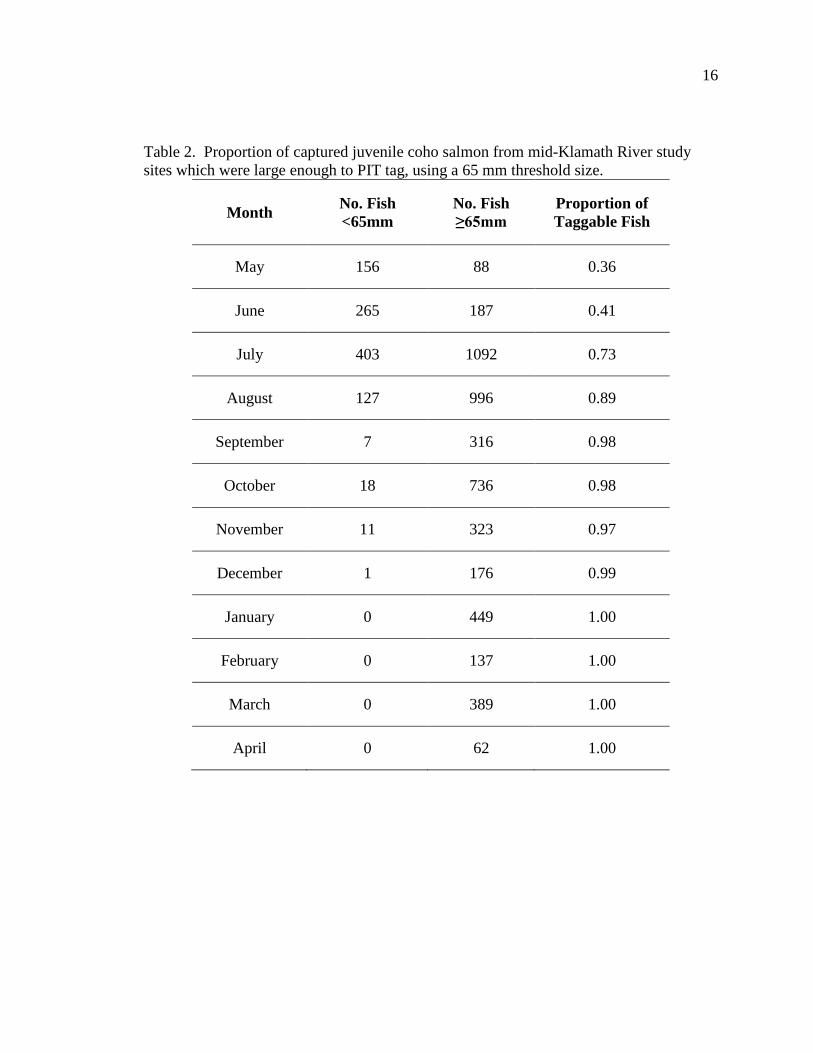
All captured juvenile coho salmon greater than 65 mm fork length (FL) were
marked using a PIT tag (Biomark, Inc., Boise, Idaho; full-duplex, 12mm long). The
percentage of captured fish large enough to tag increased with time, from 36% in May up
to 100% by January (
Table 2). PIT tags were inserted into the body cavity anterior to the pectoral fin using a
sterile syringe. Juvenile coho salmon selected for marking were first anesthetized with
MS-222 (tricaine methanesulfonate) and fork length and wet weight were recorded.
16
Table 2. Proportion of captured juvenile coho salmon from mid-Klamath River study sites which were large enough to PIT tag, using a 65 mm threshold size.
Month No. Fish <65mm
No. Fish ≥65mm
Proportion of Taggable Fish
May 156 88 0.36
June 265 187 0.41
July 403 1092 0.73
August 127 996 0.89
September 7 316 0.98
October 18 736 0.98
November 11 323 0.97
December 1 176 0.99
January 0 449 1.00
February 0 137 1.00
March 0 389 1.00
April 0 62 1.00

17
Habitat
Physical habitat parameters of each of the study sites were measured so that
differences in growth, abundance, and residence time of fish utilizing those habitats could
be correlated with site characteristics. Each of the sites was measured two times; once in
the summer low flow season, and once in the winter during high flows. The majority of
the measurements were made in the summer when access was safer. Measurements
during the summer included water temperature, width-to-depth ratio, volume, area,
riparian vegetation type/stand age, percent area with overhanging vegetation, and percent
cutbanks. A Level II Stream Survey (USFS 2012) was used to characterize the habitat in
a consistent format. Percent overhead cover from riparian vegetation was determined
using a spherical densiometer, and data were averaged for each site using three sampling
points spaced evenly through the reach. During the winter only the basic parameters
temperature and volume were recorded. Seasonal volume measurements at each site
were critical for calculating densities of fish occupying each habitat. Dissolved oxygen
data for a subset of sites were obtained from mid-Klamath Watershed Council who used a
YSI meter to monitor the constructed ponds.
Water temperatures at each of the sites were recorded continuously throughout the
study. Data were gathered by the US Forest Service Happy Camp Ranger District, the
Karuk Tribe, and the mid- Klamath Watershed Council. In the sites not monitored by
others, temperature monitors (Onset Water Temp Pro v2) were placed in June 2012 and
collected March 2013.

18
Abundance
Population abundance was estimated using a mark-recapture approach. Separate
population estimates were made for each site in summer and winter seasons. I conducted
population estimates during seasonal periods with maximum fish occupancy at each site
by sampling after seasonal redistribution movement events. In summer, population
estimates occurred in late August and early September after the spring redistribution
event and after the Klamath River warmed enough to reduce most movement. In the
winter, population estimates were made in January after the initial high flows and winter
redistribution period. The Lincoln-Petersen Method (Krebs 1998) was used to estimate
population size, requiring two sampling events for each density estimate. Because this
method assumes a closed system, the two sampling efforts occurred on consecutive days
to limit the number of individuals that would die, move out of, or move into the study
site. Population estimates are calculated as follows:
𝑁� =𝑀𝐶𝑅
Where:
𝑁� = Estimate of total population size
M = Total number of animals captured and marked on the first visit
C = Total number of animals captured on the second visit
R = Number of animals captured on the first visit that were then recaptured on the second visit
19
Population density of juvenile coho salmon at each site was estimated using
number of fish occupying a habitat divided by the volume of that habitat. I used density
per volume of water instead of area because many of the study sites include deep pools
where fish were distributed throughout the water column.
Growth
Summer and winter daily growth rates (g/g/day) for tagged juvenile coho salmon
were calculated at each of the study sites. Weight was used as a measure of growth
instead of length as it appeared to be a better indicator for the condition of the fish; some
individuals lost mass but not length over time. For each individual, a daily growth rate
was calculated as follows: (ln(final mass/initial mass)/number of days passed)), where
final mass and initial mass are the size at the first and last capture during summer or
winter. The daily growth rate of all individuals in each of the sites was averaged for each
season. Additionally, overall daily growth rates over both seasons were calculated for
sites where the same marked individuals were captured in both the summer and winter
sampling events.

20
Retention
Seasonal retention at each of the sites was calculated using a Cormack Jolly Seber
Model (CJS) in Program MARK (Cooch and White 2011). The CJS model estimates
apparent survival phi (φ) and recapture probability (p). Because fish move in and out of
the habitat, treating φ as an estimate of survival may be misleading. I treated φ as an
estimate of retention, the proportion of tagged fish present in the site at the beginning of
the season that are still alive and present at the site at the end of the season. Low
retention at a site could be due to low survival or to high rates of emigration from the site.
Retention could only be calculated for the summer (May-November) when capture events
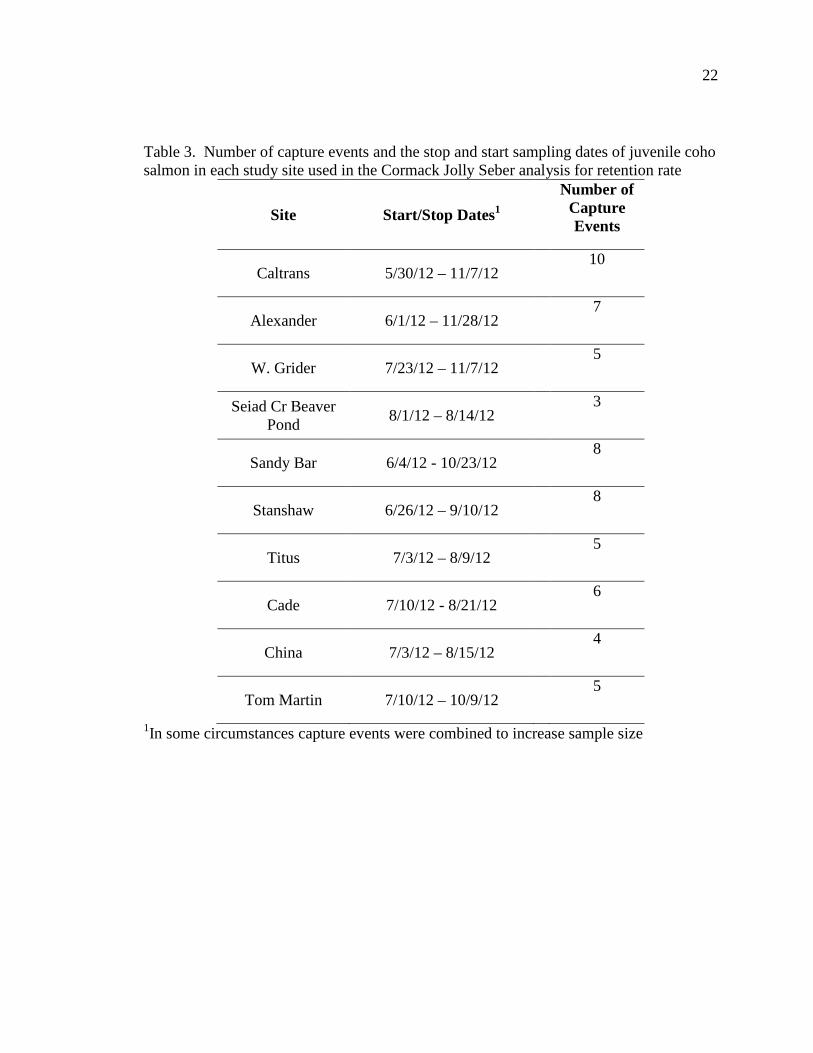
were more frequent and sample sizes were larger. The timing and number of capture
events varied greatly depending on the site and timing of fish immigration (
Table 3). For example, the beaver dam on Seiad Creek was not constructed until
August and was washed out in November during high flows, allowing only three
sampling efforts in that period. Also, sampling began in May 2012 in the sites already
occupied by natal fish, whereas sites relying on non natal recruits often had no fish
captured until mid-July when the main stem Klamath River warmed. Because of the
variation in the timing and number of sampling events, I combined the φ estimates for
each site into a single estimate of overall retention over the summer, combining sample
dates so that the interval was as similar as possible across sites (
Table 3). I estimated the standard error of the overall retention estimate using 5000
bootstrapped iterations. To avoid unrealistic estimates (e.g. φ > 1), bootstrapping was
21
performed on logit-transformed estimates and then back-transformed. Sampling intensity
varied across sites, which may confound estimates of retention if recapture probability
increases with the number of sample events. However, I found no relationship between
number of sampling events and the estimated rate of retention (F1,8 = 0.7679, p < 0.406).
22
Table 3. Number of capture events and the stop and start sampling dates of juvenile coho salmon in each study site used in the Cormack Jolly Seber analysis for retention rate
Site Start/Stop Dates1 Number of
Capture Events
Caltrans 5/30/12 – 11/7/12 10
Alexander 6/1/12 – 11/28/12 7
W. Grider 7/23/12 – 11/7/12 5
Seiad Cr Beaver Pond 8/1/12 – 8/14/12
3
Sandy Bar 6/4/12 - 10/23/12 8
Stanshaw 6/26/12 – 9/10/12 8
Titus 7/3/12 – 8/9/12 5
Cade 7/10/12 - 8/21/12 6
China 7/3/12 – 8/15/12 4
Tom Martin 7/10/12 – 10/9/12 5
1In some circumstances capture events were combined to increase sample size
23
Movement
The remote PIT tag antenna array at the mouth of Seiad Creek provided an
opportunity to document outmigration timing of juvenile coho salmon that were tagged in
the sites of the Seiad Creek drainage (Alexander Pond, Seiad Creek Beaver Pond,
Caltrans Pond). Additionally, fish initially tagged in upstream locations were discovered
entering the mouth of Seiad Creek. Other antenna arrays spread throughout the Klamath
River basin were also able to detect fish tagged in many of the ten study sites.
Data Analysis
Although data were collected throughout summer and winter seasons, most
statistical analyses were confined to the summer data. Adverse weather conditions, high
flows, and changes in sampling crews throughout the winter resulted in inconsistent
sampling efforts, technique, and low sample sizes which violated many assumptions of
the analyses performed.
Comparison of habitat types
I used a one-way analysis of variance (ANOVA) to evaluate the biological
responses (i.e., seasonal density, average growth, and retention of juvenile coho salmon)
by habitat type (tributary, constructed ponds, beaver ponds) (Table 4). This analysis tests
the hypothesis the habitat types differ, but does not test whether sampling captured
significant differences in individual growth across sites, so I use a separate ANOVA to
determine if individual growth rate differed significantly across sites, using individual
24
fish as the unit of observation. A two-way ANOVA was used to determine if an
interaction occurred between type of site and season, resulting in seasonal changes to
abundance of juvenile coho salmon.
Correlations with habitat characteristics
To answer the second question regarding the relationship between coho
abundance, retention, growth and biotic and abiotic variables, regression analyses were
used. I compared relationships between density, growth rate, and retention (response
variables) and the biotic and abiotic factors, mean weekly average temperature, habitat
volume, and average maximum depth, density of fish, and growth rate (predictor
variables). Additional variables (substrate, percent cover, and unstable banks) were
measured, however were associated with the type of habitat and would be further
investigated only if habitat type proved to be significant. This is an exploratory analysis
to identify the strongest relationships and generate hypotheses for future studies. The p-
values for the regressions are presented as indicators only and they have not been
corrected for multiple comparisons; they should not be treated as estimates of statistical
significance. I also tested the specific hypothesis that retention would be higher at sites
where average growth rate was higher.
Identifying patterns in movement
To answer the third question regarding patterns of fish movement, I qualitatively
explored movement patterns using graphs. Excel was used to graph counts of moving

25
fish using recorded PIT tag detections at permanent and mobile antenna arrays. Arrays at
the mouth of Tom Martin Creek and Caltrans Pond provided an opportunity to look at
diurnal movement in and out of the habitat, while the array at the mouth of Seiad Creek
showed timing and patterns of spring outmigration and immigration to Seiad Creek.

26
RESULTS
Capture/PIT tagging
Juvenile coho salmon were initially found only in Caltrans Pond, Alexander Pond,
and Sandy Bar. As Klamath main stem water temperatures warmed later in the season,
juvenile coho salmon were observed moving into the study sites where water
temperatures were cooler (Figure 3). Over the course of a two week period (June 24 -
July 8) water temperature in the main stem Klamath River rose from approximately 18 ºC
to 23 ºC. During this period the level of fish occupancy among study sites increased from
40 to 70 percent. By the end of July, the occupancy rate was 90 percent. The only site
not sampled at this time was Seiad Creek Beaver Pond, where the beaver dam had not yet
been constructed. Because seasonal occupancy was variable across sites, number and
timing of sampling efforts varied considerably (
Table 4,
Table 5). Across all sites, 1831 coho salmon were tagged in summer with a
seasonal recapture rate of 36 percent. During the winter, there were 716 tagged fish (a
portion of which were initially tagged during the summer) with a recapture rate of 28
percent.

27
Figure 3. Proportion of study sites occupied in relation to main stem Klamath River maximum weekly average temperature (MWAT), upstream of Indian Creek (at the town of Happy Camp). The left axis has been rescaled

28
Table 4. Juvenile coho salmon tagging summary for the summer sampling season (May 2012 - November 2012) at the ten study sites, including number of sampling events, number of fish tagged, and number of fish subsequently recaptured
Habitat Type Study Site No.
Sampling Efforts
Total No.
Tagged
Total No. Recaptured
(1 or more times)
Constructed Ponds
W. Grider Pond 5 98 47
Alexander Pond 7 221 29
Caltrans Pond 10 527 141
Beaver-influenced
Seiad Cr. Beaver Pond 3 283 93
Sandy Bar 8 238 124
Stanshaw 8 108 57
Tributaries
China Creek 4 92 54
Cade Creek 6 70 45
Titus Creek 5 194 74
Tom Martin 5 432 147
Total 56 1831 664
Rate of Recapture 0.36

29
Table 5. Juvenile coho salmon tagging summary during the winter sampling season (November 2012 - March 2013) at the ten study sites, including number of sampling events, number of fish tagged, and number of fish subsequently recaptured.
Habitat Type Study Site No.
Sampling Efforts
Total No.
Tagged
Total No. Recaptured
(1 or more times)
Constructed Ponds
W. Grider Pond 5 116 46
Alexander Pond 4 224 36
Caltrans Pond 5 206 32
Beaver-influenced
Seiad Cr. Beaver Pond 0 0 0
Sandy Bar 5 107 75
Stanshaw 5 63 15
Tributaries
China Creek 0 0 0
Cade Creek 0 0 0
Titus Creek 0 0 0
Tom Martin 4 124 32
Total 28 716 204
Rate of Recapture 0.28
30
Habitat
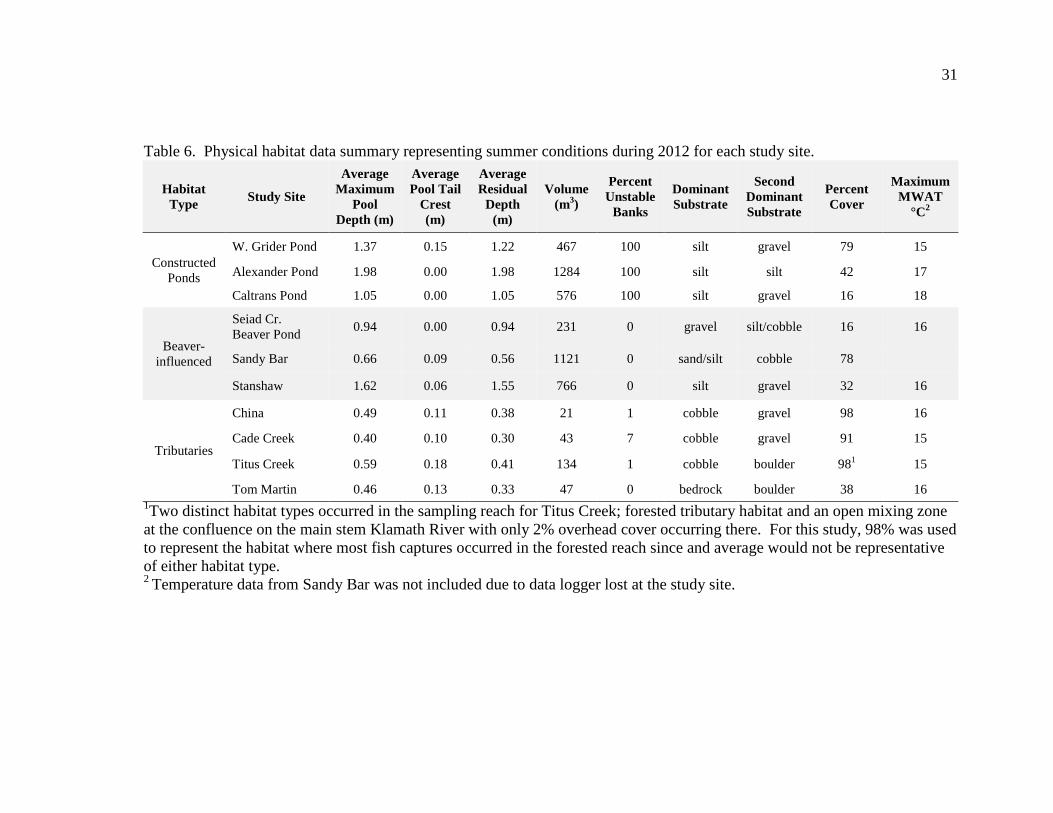
Physical habitat parameters varied greatly across study sites (
Table 6). During the summer, average maximum pool depths were deepest in the
constructed ponds with an average maximum depth of 1.47 meters; beaver-influenced
sites averaged 1.07 meters and tributaries had an average of just 0.15 meters. Volume of
habitat ranged dramatically across sites and within habitat types. The site with the
greatest volume was Sandy Bar at 1,121 m³ while Seiad Creek Beaver Pond had the least
volume at 231 m³. Types of substrate varied across habitat types. Because each of the
constructed ponds was recently excavated using heavy equipment, they each had 100
percent unstable banks with perched sediment within the bankfull range. The tributaries
had a minimal amount of unstable banks, while the beaver-influenced sites each had zero.
The constructed ponds were dominated by silt substrate, beaver-influenced sites were
mixed with both silt and gravel substrate dominating, and tributaries were dominated by
larger substrate such as cobble, boulders, and bedrock. Tributaries had the highest
amount of riparian overhead cover, averaging 81 percent, followed by constructed pond
with 46 percent, and beaver-influenced sites with 42 percent cover.
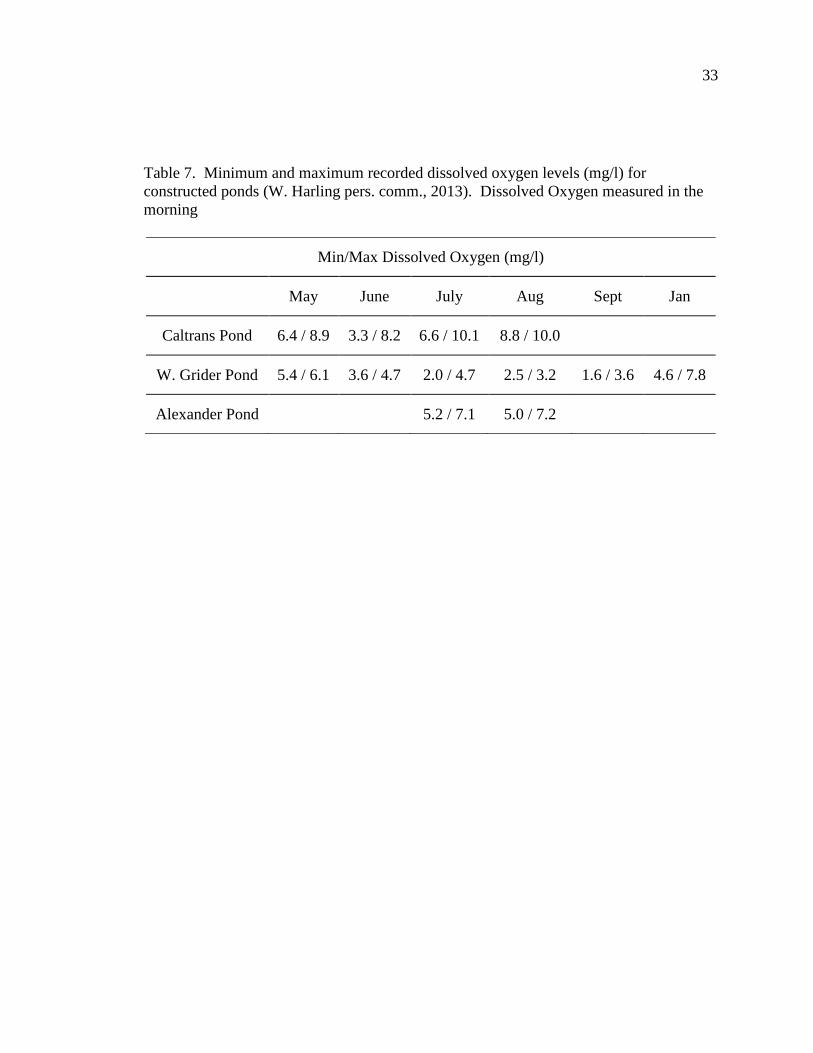
Water temperatures remained cooler in the study sites than in the main stem
Klamath River (Figure 4). Among the study sites, Caltrans Pond and Alexander Pond
had the warmest water temperatures throughout the summer. Dissolved oxygen levels
measured at the constructed ponds showed variability but no clear temporal pattern
(Table 7).
31
Table 6. Physical habitat data summary representing summer conditions during 2012 for each study site.
Habitat Type Study Site
Average Maximum
Pool Depth (m)
Average Pool Tail
Crest (m)
Average Residual
Depth (m)
Volume (m3)
Percent Unstable
Banks
Dominant Substrate
Second Dominant Substrate
Percent Cover
Maximum MWAT
°C2
Constructed Ponds
W. Grider Pond 1.37 0.15 1.22 467 100 silt gravel 79 15
Alexander Pond 1.98 0.00 1.98 1284 100 silt silt 42 17
Caltrans Pond 1.05 0.00 1.05 576 100 silt gravel 16 18
Beaver-influenced
Seiad Cr. Beaver Pond 0.94 0.00 0.94 231 0 gravel silt/cobble 16 16
Sandy Bar 0.66 0.09 0.56 1121 0 sand/silt cobble 78
Stanshaw 1.62 0.06 1.55 766 0 silt gravel 32 16
Tributaries
China 0.49 0.11 0.38 21 1 cobble gravel 98 16
Cade Creek 0.40 0.10 0.30 43 7 cobble gravel 91 15
Titus Creek 0.59 0.18 0.41 134 1 cobble boulder 981 15
Tom Martin 0.46 0.13 0.33 47 0 bedrock boulder 38 16 1Two distinct habitat types occurred in the sampling reach for Titus Creek; forested tributary habitat and an open mixing zone at the confluence on the main stem Klamath River with only 2% overhead cover occurring there. For this study, 98% was used to represent the habitat where most fish captures occurred in the forested reach since and average would not be representative of either habitat type. 2 Temperature data from Sandy Bar was not included due to data logger lost at the study site.

32
Figure 4. Mean weekly maximum temperatures during summer 2012 in the main stem Klamath River (Grunbaum 2012) and for study sites. Horizontal line at 25.8 °C represents potentially lethal temperature (Beschta et al 1987) and at 20.3° C represents potential cessation of growth (Brett 1952)
33
Table 7. Minimum and maximum recorded dissolved oxygen levels (mg/l) for constructed ponds (W. Harling pers. comm., 2013). Dissolved Oxygen measured in the morning
Min/Max Dissolved Oxygen (mg/l)
May June July Aug Sept Jan
Caltrans Pond 6.4 / 8.9 3.3 / 8.2 6.6 / 10.1 8.8 / 10.0
W. Grider Pond 5.4 / 6.1 3.6 / 4.7 2.0 / 4.7 2.5 / 3.2 1.6 / 3.6 4.6 / 7.8
Alexander Pond 5.2 / 7.1 5.0 / 7.2

34
Population Abundance and Density
All study sites were occupied by juvenile coho salmon during the summer season.
Conversely, only six of the ten study sites were occupied during the winter season. There
was not a significant statistical difference in abundance across site types and season (full
model p-value: 0.2279). However, population estimates and densities (Table 8, Table 9)
show that although occupied during the summer, constructed ponds had similar or larger
numbers of fish utilizing them during the winter. Increased densities in these ponds were
a function of greater population sizes as the volume did not change substantially. In
contrast, the beaver-influenced sites and tributaries had a substantial decrease in fish
abundance during the winter. The habitat predictors tested were not significantly related
to population density (
Table 10).

35
Table 8. Summer (May 2012 - November 2012) and winter (November 2012 - March 2013) population estimates and densities of juvenile coho salmon in each of the study sites.
Habitat Type Location Summer
Population Estimate
Winter Population Estimate
Summer Density (fish/m3)
Winter Density (fish/m3)
Constructed Ponds
W. Grider Pond 98 156 0.21 0.86
Alexander Pond 154 862 0.12 1.30
Caltrans Pond 387 299 0.67 0.48
Beaver-influenced
Stanshaw 140 28 0.18 0.02
Seiad Cr. Beaver Pond 390 0 1.69 0.00
Sandy Bar 326 64 0.29 0.05
Tributaries
Tom Martin Creek 748 136 15.96 3.24
Titus Creek 106 0 0.79 0.00
Cade Creek 51 0 1.19 0.00
China Creek 98 0 4.61 0.00

36
Table 9. Average densities, seasonal growth rates, and rates of retention of juvenile coho salmon with standard error at each site. Retention was not estimated for the winter season
Study Site Habitat Type Density (fish/m3) Growth (g/g/day) Retention (ɸ)
Summer
Winter Summer Winter
Alexander Pond Constructed Pond 0.12 1.30 0.006 ±0.0007 0.005 ±0.0005 0.891 ±0.072
Caltrans Pond Constructed Pond 0.67 0.48 0.006 ±0.0003 0.003 ±0.0007 0.230 ±0.084
W. Grider Pond Constructed Pond 0.21 0.86 0.005 ±0.0007 0.000 ±0.0002 0.793 ±0.020
Seiad Beaver Pond Beaver-influenced 1.69 N/A 0.002 ±0.0006 N/A 0.795 ±0.035
Sandy Bar Beaver-influenced 0.29 0.05 0.002 ±0.0003 0.008 ±0.0004 0.423 ±0.073
Stanshaw Beaver-influenced 0.18 0.02 0.004 ±0.0005 0.005 ±0.0007 0.806 ±0.050
Tom Martin Creek Tributary 15.96 3.24 0.001 ±0.0003 0.001 ±0.0003 0.456 ±0.078
Titus Creek Tributary 0.79 N/A 0.003 ±0.0005 N/A 0.426 ±0.046
China Creek Tributary 4.61 N/A 0.006 ±0.0007 N/A 0.565 ±0.088
Cade Creek Tributary 1.19 N/A 0.000 ±0.0005 N/A 0.302 ±0.081

37
Table 10. Test statistics for various response and predictor variables across the study sites. P-values are not corrected for multiple comparisons

38
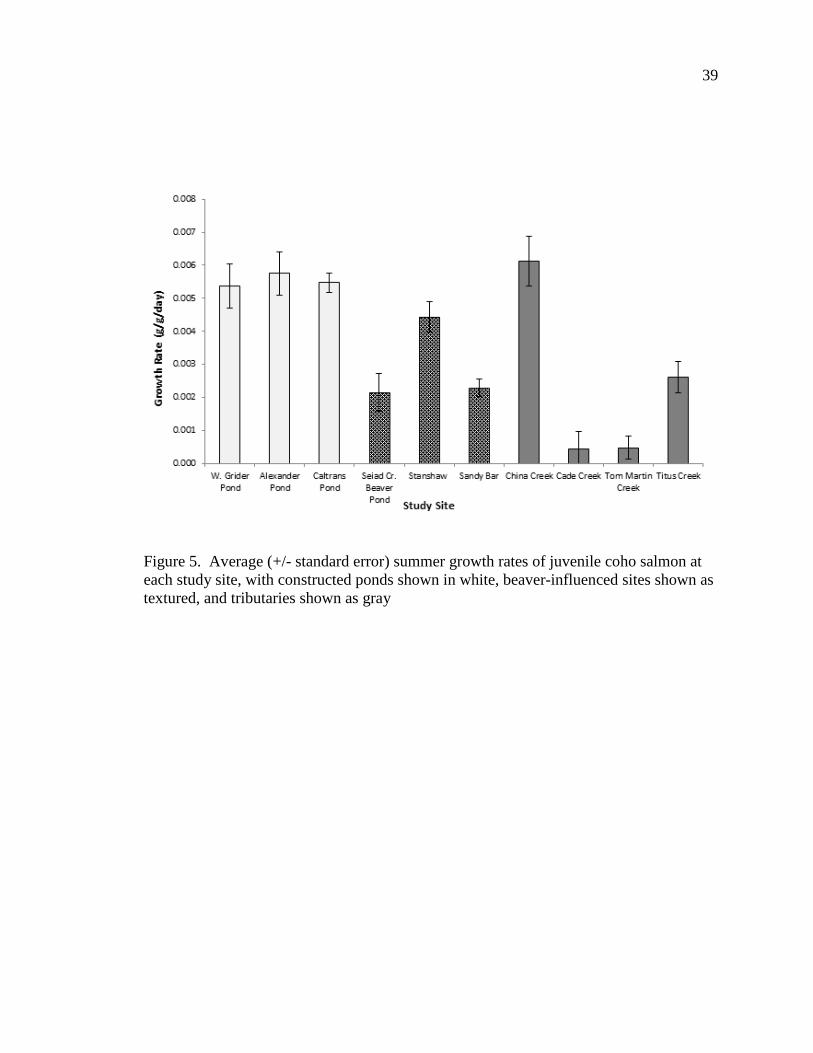
Growth
Summer growth rates of juvenile coho salmon varied significantly among the
study sites (F 9,787 = 22.43, P < 0.001, site means range from 0.0004 – 0.006 g/g/day);
however summer growth rates did not differ among habitat types (F2,7 = 2.641, P =
0.140, habitat type means range from 0.002 – 0.005 g/g/day). During the summer, the
constructed ponds each had similarly high growth rates (Figure 5). Variability in summer
growth rates was greatest in tributary sites; China Creek fish had the highest growth rate
among all study sites, and fish from Cade and Tom Martin Creeks had the lowest growth
rates. The beaver-influenced sites had intermediate summer growth rates.
Winter growth rates of juvenile coho salmon varied significantly across the six
study sites occupied in the winter (F5,226 = 46.312, P < 0.001, means range from 0.0002 –
0.008 g/g/day), however there was no significant difference in growth rates across the
habitat types (F2,3 = 2.66, P < 0.216, means range from 0.0007 – 0.006 g/g/day). During
the winter, both Caltrans and Alexander Pond fish continued to display high rates of
growth, but West Grider Pond fish showed the lowest growth rates among all sites
sampled during the winter (Figure 6). In the two remaining beaver-influenced sites,
Sandy Bar and Stanshaw, fish were observed to have the highest rates of growth among
all sites at 0.008 g/g/day and 0.005 g/g/day, respectively. The average winter growth rate
observed at Sandy Bar was higher than the average growth rates at all sites during the
summer.
39
Figure 5. Average (+/- standard error) summer growth rates of juvenile coho salmon at each study site, with constructed ponds shown in white, beaver-influenced sites shown as textured, and tributaries shown as gray

40
Figure 6. Average winter growth rates (+/- standard error) of juvenile coho salmon at each study site with constructed ponds shown in white, beaver-influenced sites shown as textured, and tributaries shown in gray.

41
A proportion of fish tagged in the summer remained in the study site during the
winter season as well (Table 11). For the sites that were occupied continuously by the
same individual fish throughout the summer and winter season, growth rates were
averaged and compared. Growth rates were highest in beaver ponds followed by
constructed ponds (Figure 7). Overall growth rates of juvenile coho salmon varied
significantly across the study sites (F3,62 = 42.973, P < 0.001 ) and showed a significant
difference in growth rates between habitat types (F2,3 = 11.368, P < 0.0398) (Figure 8).
Despite generally high growth rates in the constructed ponds, fish that continuously
occupied beaver-influenced sites had the highest overall rates of growth. The fish that
were found to continuously occupy Tom Martin Creek had the lowest rate of growth of
0.002 g/g/day.

42
Table 11. Total number of fish tagged at each study site having both summer and winter occupancy, and the proportion of tagged fish that remained both seasons.
Study Site Total No. Tagged Total No.
Captured Summer & Winter
Proportion Retained Both
Seasons
W. Grider Pond 155 45 29%
Alexander Pond 400 52 13%
Caltrans Pond 669 13 2%
Stanshaw 135 13 10%
Sandy Bar 322 6 2%
Tom Martin Creek 450 37 8%

43
Figure 7. Average growth rates (+/- standard error) for individual juvenile coho salmon occupying the same habitat both in the summer and winter. Constructed ponds are shown in white, beaver-influenced sites are shown as patterned, and tributaries are shown in gray.

44
Figure 8. Average growth rates of fish in habitat types which remained at a site in both summer and winter seasons, with mean and standard error shown.
Beaver Influenced Constructed Pond Tributary
0.00
10.
002
0.00
30.
004
0.00
5
Site Type
g/g/
day

45
There were no strong correlations between growth rate of fish and the density of
conspecifics or the measured habitat variables including water temperature (MWAT),
volume, or average maximum water depth (Table 10).
Retention
Summer retention rate of juvenile coho salmon was greatest in Alexander Pond
and lowest at Caltrans Pond (Figure 11). No significant correlation occurred between
retention and growth rate (
Table 10). The lack of correlation is counter to the hypothesis that fish would
remain in habitats where they experienced the highest rates of growth. Retention was not
related to temperature, population density, or growth rates, but it was positively related to
average maximum pool depth (
Table 10).

46
Figure 9. Retention rate (overall ɸ) and standard error of juvenile coho salmon at each study site. Constructed ponds are shown as white, beaver ponds are patterned, and tributaries are gray
47
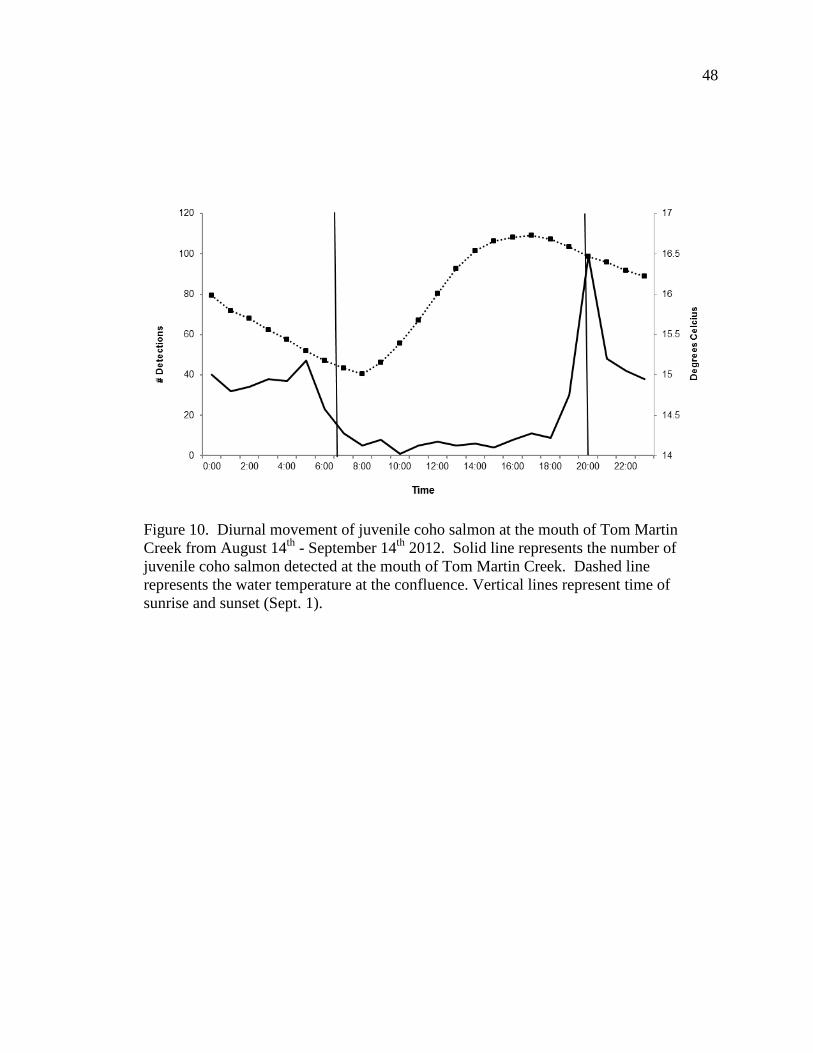
Movement
Diurnal movement of juvenile coho salmon was detected at the mouth of Tom
Martin Creek and at the outlet of Caltrans Pond in Seiad Creek. Detections indicated
juvenile coho salmon exited the study sites to feed in the main stem Klamath River or
Seiad Creek. Number of detections was greatest around sunrise and sunset (Figure 10,
Figure 11). Coho salmon appeared to move in relation to light rather than water
temperature, occupying the Klamath River or Seiad Creek during the darkest periods of
the day rather than during the coolest water temperatures.
48
Figure 10. Diurnal movement of juvenile coho salmon at the mouth of Tom Martin Creek from August 14th - September 14th 2012. Solid line represents the number of juvenile coho salmon detected at the mouth of Tom Martin Creek. Dashed line represents the water temperature at the confluence. Vertical lines represent time of sunrise and sunset (Sept. 1).

49
Figure 11. Diurnal movement of juvenile coho salmon in Seiad Creek at the mouth of Caltrans Pond from July 14th - July 22nd 2012. Solid line represents number of juvenile coho salmon detected at the outlet of Caltrans Pond. Box and triangle marked lines represent temperature in Seiad Creek and Caltrans Pond respectively. Two vertical lines represent time of sunrise and sunset (July 18).

50
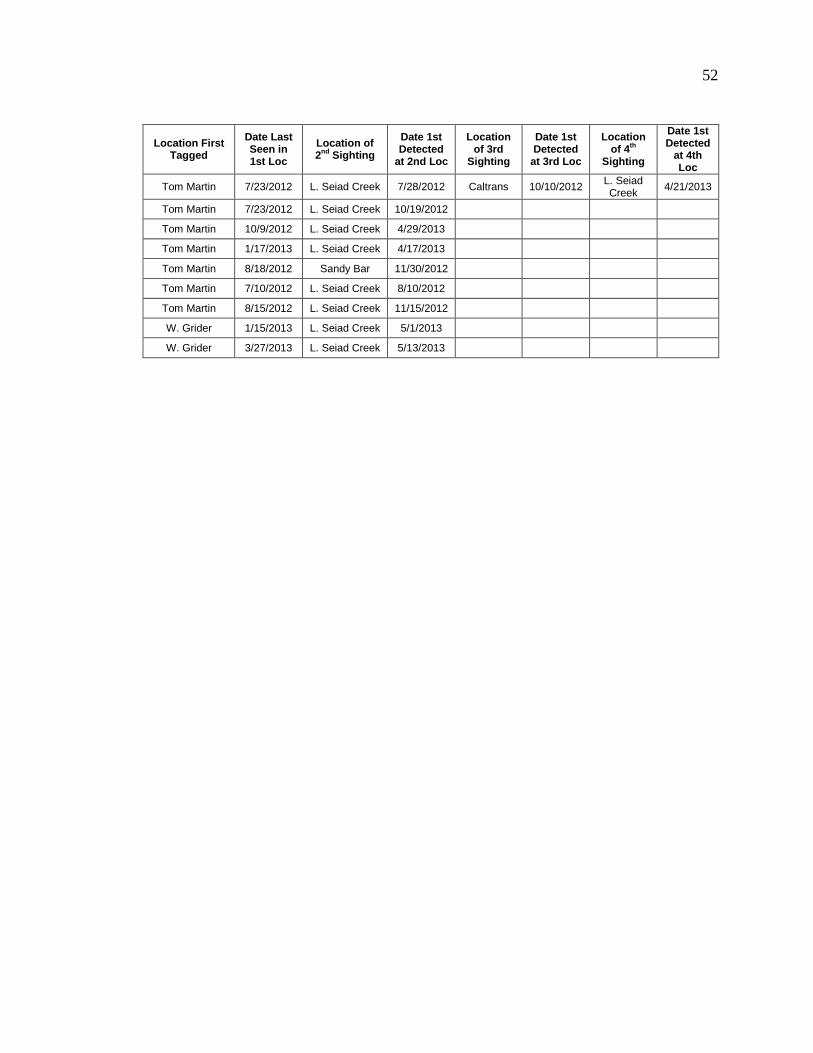
Tagged fish from most of the study sites were detected at downstream PIT tag
antennas during winter or spring. Seventeen of the 432 fish tagged during the summer in
Tom Martin Creek were detected as they entered Seiad Creek; one of those fish was even
captured in Caltrans Pond (Table 12). Fish were also detected utilizing over-winter
habitats near the mouth of the Klamath River such as McGarvey Alcove and Lower
Panther Pond (Table 12).
Three seasonal movement events were documented: during summer when most
fish migrated into non natal study sites where they were initially tagged; during fall and
early winter when high flows instigated movement, and spring outmigration (Table 13).
During the fall-winter redistribution event, most fish moved out of or were displaced
from the tributary sites as evidenced during the population estimates. During this same
period, an apparent immigration event occurred at the constructed ponds and beaver-
influenced sites. The median fork length of captured fish dropped during the winter
(Figure 12). If the same fish were being captured each month, an increase in fork length
would be expected. Instead, I assume the decrease is an indication of smaller fish,
presumably those rearing in the stream during the summer, immigrating into the ponds to
rear for the winter season. A drop in median fork length of fish was not observed in Tom
Martin Creek, the only tributary with winter rearing fish; instead fork length exhibited a
plateauing trend during the winter months (Figure 12).

51
Table 12. Detection of tagged fish found in locations other than where tagged
Location First Tagged
Date Last Seen in 1st Loc
Location of 2nd Sighting
Date 1st Detected
at 2nd Loc
Location of 3rd
Sighting
Date 1st Detected
at 3rd Loc
Location of 4th
Sighting
Date 1st Detected
at 4th Loc
Alexander 10/31/2012 Sandy Bar 1/24/2013
Alexander 10/31/2012 Bulk Plant 12/6/2012
Alexander 10/31/2012 Bulk Plant 12/7/2012
Cade 10/23/2012 Bulk Plant 12/4/2012
Cade 7/23/2012 Bulk Plant 12/3/2012
Cade 10/23/2012 Bulk Plant 12/4/2012
Cade 8/8/2012 Bulk Plant 12/8/2012
Caltrans 11/7/2012 Bulk Plant 12/14/2012
Caltrans 9/12/2012 Bulk Plant 12/14/2012
Caltrans 11/7/2012 Bulk Plant 12/12/2012
Caltrans 9/12/2012 Bulk Plant 12/16/2012
Caltrans 9/12/2012 Bulk Plant 12/18/2012
Caltrans 10/10/2012 Bulk Plant 12/13/2012
Caltrans 7/23/2012 Bulk Plant 12/17/2012
Caltrans 9/12/2012 Bulk Plant 1/15/2013
China 10/30/2012 L.McGarvey Alcove 1/29/2013
Sandy Bar 6/12/2012 L. Salt Creek 7/11/2012 Seiad Cr
Beaver Pond 10/24/2012 Caltrans 1/15/2013 L. Seiad Creek 4/19/2013
Seiad Cr Beaver Pond 8/14/2012 L. Panther
Pond 3/7/2013
Stanshaw 7/17/2012 L. Panther Pond 3/26/2013
Titus 11/5/2012 Sandy Bar 12/1/2012
Titus 9/5/2012 Sandy Bar 11/29/2012
Titus 7/3/2012 Sandy Bar 12/4/2012
Titus 7/3/2012 Sandy Bar 12/4/2012 Tom Martin 8/6/2012 L. Seiad Creek 11/23/2012 Bulk Plant 12/4/2012
Tom Martin 8/6/2012 L. Seiad Creek 11/25/2012
Tom Martin 10/9/2012 L. Seiad Creek 11/10/2012
Tom Martin 8/6/2012 L. Seiad Creek 5/9/2013
Tom Martin 10/9/2012 Bulk Plant 12/6/2012
Tom Martin 8/23/2012 L. Seiad Creek 4/10/2013
Tom Martin 7/23/2012 L. Seiad Creek 3/16/2013
Tom Martin 8/6/2012 L. Seiad Creek 11/21/2012 Bulk Plant 12/7/2012
Tom Martin 10/9/2012 L. Seiad Creek 11/23/2012
Tom Martin 10/9/2012 L. Seiad Creek 11/23/2012
Tom Martin 8/18/2012 L. Seiad Creek 11/25/2012
Tom Martin 8/6/2012 L. Seiad Creek 11/11/2012
52
Location First Tagged
Date Last Seen in 1st Loc
Location of 2nd Sighting
Date 1st Detected
at 2nd Loc
Location of 3rd
Sighting
Date 1st Detected
at 3rd Loc
Location of 4th
Sighting
Date 1st Detected
at 4th Loc
Tom Martin 7/23/2012 L. Seiad Creek 7/28/2012 Caltrans 10/10/2012 L. Seiad Creek 4/21/2013
Tom Martin 7/23/2012 L. Seiad Creek 10/19/2012
Tom Martin 10/9/2012 L. Seiad Creek 4/29/2013
Tom Martin 1/17/2013 L. Seiad Creek 4/17/2013
Tom Martin 8/18/2012 Sandy Bar 11/30/2012
Tom Martin 7/10/2012 L. Seiad Creek 8/10/2012 Tom Martin 8/15/2012 L. Seiad Creek 11/15/2012 W. Grider 1/15/2013 L. Seiad Creek 5/1/2013
W. Grider 3/27/2013 L. Seiad Creek 5/13/2013

53
Table 13. Summary of movement events documented when tagged fish were detected in locations other than where initially tagged. Most fish were tagged in non-natal streams, suggesting that they had already moved at the time of initial capture
Movement Event No. Fish Detected
Summer Re-distribution (5/12 - 9/12) 3
Fall/Winter Re-distribution (10/12 -2/13) 33
Spring Outmigration (3/13 - 5/13) 9

54
Figure 12. Median fork length of juvenile coho salmon over time at each type of habitat. Dips in the fall for most sites suggest a winter redistribution event where smaller fish emigrated from the stream
55
Timing of spring outmigration within the Seiad Creek drainage with suggested by
PIT tag detections at an antenna array placed at the mouth of Seiad Creek. Fifty-one
percent of the fish tagged in Alexander Pond over the course of the project were detected
at the mouth of Seiad Creek, 28 percent of the tagged Caltrans fish were detected at the
mouth, and 18 percent of the tagged fish from Seiad Creek Beaver pond were detected.
Likely, most of the tagged fish from the Seiad Creek study sites out-migrated. However,
the PIT tag antenna array was not functioning December 1st through January 17th 2013
due to high flows, which likely corresponds to a large outmigration event.
Using data from the Seiad Creek PIT tag antenna, I determined the frequency of
outmigration by date for each of the Seiad Creek study sites in 2013 (Figure 13). There
appeared to be little difference in the timing of outmigration among sites in Seiad Creek.
The median outmigration dates were estimated from detections that occurred between
February 20th and May 31st to avoid including movement associated with the winter
redistribution event which occurred earlier in the year (Figure 13). The median date for
outmigration of fish in Alexander Pond, Caltrans Pond, and Seiad Creek beaver pond
were April 7, April 12, and April 16, respectively in the spring of 2013. The frequency
of detections at the mouth of Seiad Creek correlates to spring flow events in the Klamath
River.

56
Figure 13. Number of tagged fish from each study site in the Seiad Creek watershed are shown over time as they were detected at the mouth of Seiad Creek. Peaks in detection events represent movement events relative to the flow (m3/sec) of the Klamath River at Seiad Valley. Flow data were used from the USGS gauging station 11520500 for the Klamath River near Seiad Valley, CA

57
I calculated the relative proportion of fish that were tagged during the summer
and subsequently detected at the mouth of Seiad Creek during different movement events
(Figure 14). Summer movement was characterized as detections recorded prior to
November 1st, 2012. The winter redistribution included detections from November 1st
2012 – February 20th, 2013 and the spring outmigration event includes detections after
February 20th, 2013. Movement was equally distributed throughout the year for those
fish tagged in Caltrans Pond as opposed to the other sites where the majority of
movement occurred during the spring outmigration, suggesting that fish rearing in the
beaver pond and Alexander Pond remained in the system for longer periods. Due to high
flows during the winter redistribution period, the PIT tag array at the mouth of Seiad
Creek was not operational for approximately two weeks. It is likely that the number of
fish moving out of the system during this time was higher than the numbers detected

58
Figure 14. The proportion of fish tagged in Alexander, Caltrans, and Seiad Creek Beaver pond during the summer (May - November 2012) which were detected moving out of Seiad Creek during different movement events.
59
DISCUSSION
I hypothesized that type of habitat (constructed, beaver influenced, tributary)
would influence biological responses. However, most responses did not differ across
habitat types. This was not because coho salmon abundance, growth, and retention were
similar at all sites. Rather, there were large differences in these responses across sites, but
these differences were not consistent within types. This pattern suggests that the
characteristics of individual sites likely have a greater influence on factors such as
growth, residence time, and density of fish than whether the site is constructed, beaver-
influenced, or a tributary. However, few significant relationships could be identified
with the site characteristics I chose to assess for this study. Nonetheless, I did find that
retention rate was higher at deeper sites and those individuals that reared year round in
beaver-influenced sites had the highest rates of growth.
Several reasons may explain why this study could not detect a relationship
between habitat variables and density or growth rates of juvenile coho salmon. Perhaps
there is no relationship between the predictor variables and biological responses I chose
to investigate. Or perhaps there was too much error in the measurements to detect the
relationship. However, I think the most likely explanation has to do with the small
sample size used for this study and possible complex interactions between predictor
variables. My observations in the field, lead me to believe there is too much variability
within site type categories to find a correlation between those categories of habitat and
growth or density of fish. I do, however, believe that there may be a relationship between
growth rates and habitat characteristics which I was unable to detect due to my small

60
sample size and potential interactions between habitat parameters. Had I gathered data
from a larger number of study sites, I could have used additional covariates to determine
interactions between habitat parameters. For example, perhaps the combination of deep
pools and cold water would result in high growth rates.
Alternative Habitat Parameters that May Explain Biological Responses
Because there was a significant difference in growth rates and retention across
individual study sites, other habitat characteristics not measured as part of my study
likely play a role in determining growth rate of coho salmon at these sites. For example,
productivity and available food resources play a role in determining growth rates of
juvenile coho salmon. Ward et al (2009) showed prey biomass alone accounted for a
significant variation in juvenile Atlantic salmon growth rates, while Wilzbach (1985)
found in laboratory experiments that food abundance was more important than cover in
determining abundance and distribution of cutthroat trout. Thus, difference in
productivity or prey availability across sites may explain the differences in growth rate or
densities of fish. However, directly comparing prey availability across the habitat types
will be a substantial challenge. Due to their recent construction and circular shape the
constructed ponds had little overhead cover while three of the four tributaries had a dense
canopy. Therefore, fish in the ponds were likely more reliant on autochthonous
production whereas the fish in tributaries were likely more reliant on allochthonous
inputs. Further, fish in constructed and beaver ponds likely had access to some food
resources not available in the tributaries, such as mosquito larvae and amphibian eggs
present in standing water. In a comparison of autochthonous and allocthonous resources
61
in logged and forested stream reaches in Washington, Bilby and Bisson (1992) found fish
populations appeared to depend upon food derived from autotrophic pathways during
spring and summer in the presence or absence of forest canopy. Their results indicated
that increased canopy cover would not benefit growth of fish during spring and summer.
Romaniszyn et al (2007) shows that peak food availability occurs in the spring and is
derived from aquatic insect larvae, however in the fall overall food availability decreases
but is dominated by terrestrial inputs which can prove more difficult for juvenile fish to
eat. Bilby and Bisson (1992) did not take into account the difference in energy
expenditure of fish residing in standing water compared to flowing water. In reference to
previous studies, it appears that the pond habitats in my study may provide preferable
food resources during the spring and summer when compared to the tributaries,
especially under the additional consideration that pond fish may be expending less energy
than stream rearing fish that are in constant flowing water.
The idea presented by Rosenfeld (2008), that a combination of flowing and
standing water is ideal, may explain the high growth rates measured in Stanshaw, Sandy
Bar, Caltrans Pond, and China Creek. During the winter, the growth rates of juvenile
coho salmon were much higher in Stanshaw and Sandy Bar sites than any measured
growth rate during the summer. Geomorphically, these sites are similar in the fact that
they are somewhat isolated from main stem flows during the summer, with cool tributary
water filling the pools in the secondary channel of the main stem Klamath River.
However, during the winter, main stem waters flow through the secondary channel.
Perhaps, the influence of the main stem provides additional nutrients or the ideal
combination of flowing and standing water. The increase in growth rates from summer

62
to winter may be related to the change in habitat from isolated from the main stem to
connected to the main stem. Similarly, the high summer growth rates in Caltrans Pond
may be attributable to the documented movement of fish between the standing pond
water and the flowing stream water. High summer growth rates in China Creek may be a
result of fish occupying the very deep pool near the mouth of the tributary, yet receiving
inputs from upstream flowing water. Or perhaps, the fish of China Creek move into the
main stem of Klamath as documented at Tom Martin Creek, taking advantage of different
flow patterns and food resources.
Movement Patterns and Strategies
The access to and location of a study site within a watershed seemed to influence
movement. I hypothesized that fish would reside longer in habitats where growth rates
were the highest, such as the constructed ponds. The retention analysis however, showed
that residence time was shortest in Caltrans Pond and longest in Alexander Pond; both
constructed ponds in the same watershed and both having fish with similarly high rates of
growth. The primary difference between the two ponds is access and location in the
watershed. I suspect that the high turnover rate in Caltrans Pond has to do with the deep
outlet channel draining into a glide-like reach of Seiad Creek. The lower reach of Seiad
Creek, where Caltrans Pond is located has a very high number of natal and non natal
juvenile coho salmon and is characterized by a low gradient, sinuous stretch of stream
with lots of deep pool habitat. It appears the fish move freely between the pond and
stream habitat. In fact, at one point during the summer, a beaver dam was constructed
just downstream of the Caltrans Pond outlet, increasing the water level in Caltrans Pond

63
and providing further connection between stream and pond. I saw similar proportions of
fish moving out of Caltrans during each season. Alexander pond, on the other hand, is
several miles upstream where the gradient of Seiad Creek increases and few coho salmon
rear in the stream channel. The outlet of Alexander Pond is very shallow and may even
completely close during a short period during the summer. I found that more than three
quarters of the fish from Alexander Pond did not move out until the spring outmigration
event. Additionally, the largest number of 1+ juvenile coho salmon was found in
Alexander Pond (Appendix A); another indication that fish may stay longer at that site.
Similar to Alexander Pond, West Grider Pond is located high in a watershed with more
difficult access and the fish there showed a high rate of retention.
Seventeen of the fish tagged in Tom Martin Creek were detected in other
locations, and can be described as having three differing strategies in migration timing.
First, two of the tagged fish were detected elsewhere during the summer of 2012 prior to
lethal main stem temperatures, indicating an exploratory movement pattern as
documented by Kahler et al (2001). Second, twelve of the fish detected elsewhere were
found during the fall redistribution period, primarily in Lower Seiad Creek. And thirdly,
five individuals were not detected until the spring of 2013 presumably as outmigrating
smolts, indicating they stayed through the winter season in Tom Martin Creek. Three of
the fish tagged in Tom Martin Creek were detected in two additional locations proving
they occupied at least four different off-channel habitats (because Tom Martin is a non
natal stream) during their freshwater rearing period.
At a shorter temporal scale, the diurnal migration pattern of juvenile coho salmon
that was documented at Tom Martin Creek and Caltrans Pond seems to be related to
64
daylight as suggested by other studies. Scheuerell and Schindler (2003) examined a diel
vertical migration pattern by juvenile sockeye salmon and found a correlation between
depth and amount of light on the lake surface. They suggest the timing of migration is
associated with an anti-predation window. Metcalf et al (1999) discusses the nocturnal
vs. diurnal foraging trade-off in juvenile Atlantic salmon and showed that winter diel
activity patterns in salmon were dependent on food availability. A change in food
density led to a parallel change in time spent in the refuge, but the effect was greatest at
the time of day with the least favorable ratio of predation cost to feeding benefit.
Similarly, I observed the greatest number of fish migrating at night when risk of
predation was minimized.
Future Research
Though this study provides evidence to support the value of off-channel
restoration sites, additional research could further improve our understanding of what
factors influence growth and survival of juvenile coho salmon and how best to maximize
these responses in restoration efforts. I found consistently high growth rates during the
summer and winter in Caltrans and Alexander Ponds, but oddly found extremely low
growth rates in West Grider Creek Pond during the winter. Because West Grider Creek
Pond was constructed with the purpose to provide high quality over-winter habitat, it is
important to conduct follow up research to determine the reason for low winter growth
rates. Dissolved oxygen may be a factor. During the winter, the pond is mostly fed by
ground water and overland flow. West Grider Creek Pond is surrounded more by
deciduous trees than Alexander and Caltrans ponds and likely has more decomposing
65
organic material in and around it. Because this decomposing material in the winter may
reduce the concentrations of dissolved oxygen, a more systematic monitoring approach is
necessary. A grid-like sampling design that measures dissolved oxygen at differing
locations and depths at the same time every day, repeated throughout the season, would
increase our understanding of the role dissolved oxygen may play in growth rates of coho
salmon. If in fact dissolved oxygen levels are low in the winter, new design elements
could improve the function of West Grider Pond and could be incorporated into future
projects. In constructing off-channel habitats in the Lower Klamath River with the Yurok
Tribe, Rocco Fiori (Fiori Geosciences) designs “infiltration galleries” to facilitate surface
and ground water exchange to enrich dissolved oxygen levels during the winter.
Future studies could investigate the reasons for differences in growth rates further,
using more standardized sampling of habitat characteristics and larger sample sizes (i.e.
number of habitats within each category) and look at different variables such as
production and availability of food resources in a site as discussed above. Perhaps there
is a relationship between allocthonous versus authochthonous production and growth
rates; perhaps this relationship changes seasonally.
Future studies may also want to broaden the spatial scope beyond the sites
themselves, including variables such as “opportunity” or “access” that account for the
habitat matrix surrounding the focal sites. Because I found that juvenile coho salmon in
the mid-Klamath watershed have high rates of seasonal movement and non-natal rearing,
it is important that they can find non natal rearing sites. It is particularly important to
understand the role of opportunity and access when designing future off-channel
restoration sites. In my study, fish were observed very early in the season at non-natal
66
sites that were best connected to the main stem Klamath River and had good mixing
zones (i.e., Titus Creek, Sandy Bar, Stanshaw, Tom Martin Creek). Fish arrived later and
in few numbers at non-natal sites that had poor connection (e.g., confluence at a high
velocity reach) or were further away in proximity to the main stem Klamath (i.e., Cade
Creek, West Grider Pond, China Creek). Future studies may look at off-channel sites and
relate their distance from the main stem Klamath River as well as characteristics of the
outlet channel such as depth, length, and location (i.e. does it enter into a riffle or pool?)
to the retention rate of juvenile coho salmon and the density of fish rearing there. We
may find that these are the elements that make the best off-channel habitat in terms of
allowing the maximum number of fish to benefit from the restoration site.
Additional research would be helpful in understanding the risk of introducing
exotic species to watersheds with the construction of off-channel habitats. I observed
varying densities and species composition of exotic species including bull frogs,
bullheads, and green sunfish in Alexander Pond, Caltrans Pond, Sandy Bar, and Stanshaw
study sites. No bull frogs, however, were observed in the natural habitats (Sandy Bar and
Stanshaw) whereas, extremely high densities of bullfrog adults and tadpoles were
observed in Caltrans Pond. These constructed habitats may serve as a stronghold for
invasive species that would otherwise be displaced seasonally with high flows. Bullfrogs
likely do not inhabit Sandy Bar and Stanshaw ponds because they receive flushing winter
flows.
Finally, the use of beaver-influenced habitats by juvenile coho salmon in the mid-
Klamath basin can be further explored. Very few sites with channel spanning dams and
off-channel beaver complexes exist in the mid-Klamath watershed. The constructed off-
67
channel ponds attempt to increase floodplain connection and replicate complex habitats
similar to those natural habitats created by beaver. However, the constructed off-channel
ponds may not function in the same dynamic sense as a natural system. The interaction
of the main stem with the two beaver-influenced sites, Sandy Bar and Stanshaw, may be
a key to the extremely high winter growth rates there. The seasonal beaver dam in Seiad
Creek provided summer rearing habitat, yet washes out during the winter preventing
exotic species from taking hold. Protecting and even reintroducing beaver to build
salmonid habitat is a topic of discussion among restoration groups and regulatory
agencies. Further documentation of the relationship between coho salmon and beaver
would be a valuable contribution.

68
LITERATURE CITED Adams, C. (2013). Survival and movement of juvenile coho salmon (Onchorynchus
kisutch) in the Shasta River, California. (Master’s thesis). Humboldt State University
Bartholow, J. M. (2005). Recent water temperature trends in the Lower Klamath River,
California. North American Journal of Fisheries Management, 25(1), 152–162. Belchik, M. R. (1997). Summer Locations and Salmonid Use of Cool Water Areas in the
Klamath River; Iron Gate Dam to Seiad Creek, 1996. Yurok Tribal Fisheries Program Technical Report. 13 pp.
Beschta, R. L. (1978). Long‐term patterns of sediment production following road
construction and logging in the Oregon Coast Range. Water Resources Research 14.6: 1011-1016.
Beschta, R.L., Bilby, R.E., Brown, G.W., Holtby, L.B., and Hofstra, T.D. (1987). Stream
temperature and aquatic habitat: fisheries and forestry interactions. In Forestry and Fisheries Interactions. Edited by E.O. Salo and T.W. Cundy. University of Washington Institute of Forest Resources, Seattle, Wash., Contribution No. 57. pp. 191– 232.
Beschta, R.L., and Taylor, R.L. (1988). Stream temperature increases and land use in a
forested Oregon watershed. Water Resources Bulletin: 24: 19–25 Bilby, R. E., and P. A. Bisson. (1987). Emigration and production of hatchery coho
salmon (Oncorhynchus kisutch) stocked in streams draining an old-growth and a clear-cut watershed. Canadian Journal of Fisheries and Aquatic Sciences 44:1397-1407.
Bjornn, T.C. (1971). Trout and salmon movements in two Idaho streams as related to
temperature, food, stream flow, cover, and population density. Transactions of the American Fisheries Society, 100(3): 423–438.
Brett, J. R. (1952). Temperature tolerance in young Pacific salmon, genus Oncorhynchus
sp. Journal of the Fisheries Research Board of Canada, 9:265-323.

69
Brett, J.R. (1979). Environmental factors and growth. In Fish physiology. Vol. 8. Edited by W.S. Hoar, D.J. Randall, and J.R. Brett. Academic Press, New York. pp 599–675.
Brown, G.W., and Krygier, J.T. (1971). Clear-cut logging and sediment production in the
Oregon Coast Range. Water Resources Research 7.5: 1189-1198. CDFG (California Department of Fish and Game). (2002). Status Review of California
coho salmon north of San Francisco. Candidate Species Status Review Report 2002-3 to the California Fish and Game Commission, Sacramento.
Chamberlin, T.W., R.D. Harr, and F.H. Everest. (1991). Timber Harvesting, Silviculture,
and Watershed Processes. In W.R. Meehan [ed.]. Influences of Forest and Rangeland Management on Salmonid Fishes and Their Habitats. American Fisheries Society Special Publication 19: 181‐205.
Cooch, E. and G. White. (2011). Program MARK: a gentle introduction. 10th edition. Cooperman, M.S., Hinch, S.G., Bennett, S., Quigley, J.T., Galbraith, R.V., and Branton,
M.A. 2006. Rapid assessment of the effectiveness of engineered off-channel habitats in the southern interior of British Columbia for coho salmon production. Canadian Manuscript Report of Fisheries and Aquatic Sciences 2768: v + 30 p.
Coutant, C. C. 1977. Compilation of temperature preference data. Journal of the
Fisheries Research Board of Canada 34:739-745. De Staso, J., III, and Rahel, F.J. 1994. Influence of water temperature on interactions
between juvenile Colorado River cutthroat trout and brook trout in a laboratory stream. Transactions of the American Fisheries Society 123: 289–297.
Ebersole, J.L., Liss, W.J., and Frissell, C.A. 2001. Relationship between stream
temperature, thermal refugia and rainbow trout Oncorhynchus mykiss abundance in arid-land streams in the northwestern United States. Ecology of Freshwater Fisheries, 10: 1–10.
Ebersole, J.L., Wigington Jr, P.J., Baker, J.P., Cairns, M.A., Church, M.R., Hansen, B.P.,
… & Leibowitz, S.G. (2006). Juvenile coho salmon growth and survival across stream network seasonal habitats. Transactions of the American Fisheries Society 135(6): 1681-1697.
Giannico, G.R., and M. C. Healey. (1998). Effects of flow and food on winter movements
of juvenile coho salmon. Transactions of the American Fisheries Society 127(4): 645-651.
70
Giannico, G. R., and S.G. Hinch. (2003). The effect of wood and temperature on juvenile coho salmon winter movement, growth, density and survival in side‐channels. River Research and Applications 19(3): 219-231.
Harling, W. 2013. Personal communication. Mid Klamath Watershed Council.
Dissolved Oxygen data, unpublished data Harr, D. R., Coffin B. A. (1992). Influence of Timber Harvest on Rain-On-Snow Runoff:
A Mechanism for Cumulative Watershed Effects. American Institute of Hydrology, 16.
Hartman, G. F., and T. G. Brown. (1987). Use of small, temporary, floodplain tributaries
by juvenile salmonids in a west coast rain-forest drainage basin, Carnation Creek, British Columbia. Canadian Journal of Fisheries and Aquatic Sciences 44:262–270.
Hicks, B. J., J. D. Hall, P. A. Bisson and J. R. Sedell. (1991). Response of salmonid
populations to habitat changes caused by timber harvest. pp. 438-518, In: W. R. Meehan (ed.). Influence of forest and rangeland management on salmonid fishes and their habitats. American Fisheries Society Special Publication 19, Bethesda, MD.
Jeffres, C., and P. Moyle. (2012). When good fish make bad decisions: coho salmon in an
ecological trap. North American Journal of Fisheries Management 32(1): 87-92. Kahler, T. H., P. Roni, and T. P. Quinn. (2001). Summer movement and growth of
juvenile anadromous salmonids in small western Washington streams. Canadian Journal of Fisheries and Aquatic Sciences 58:1947–1956.
Kiparsky M, and Gleick P.H. (2003). Climate change and California water resources: a
survey and summary of the literature. Pacific Institute for Studies in Development, Environment, and Security, Oakland, California. California Energy Commission. Report 500-04-073, Sacramento, CA
Knowles, N., Dettinger, M.D., &, Cayan, D.R. (2006). Trends in snowfall versus rainfall
in the western United States. Journal of Climate, 19(18), 4545–4559. Krebs, C. J. 1998. Ecological Methodology, 2nd ed. Benjamin Cummings, San Francisco,
California, U.S.A. Lawson, P.W., E.A. Logerwell, N.J. Mantua, R.C. Francis, and V.N. Agostini. (2004).
Environmental factors influencing freshwater survival and smolt production in Pacific Northwest coho salmon (Oncorhynchus kisutch). Canadian Journal of Fisheries & Aquatic Sciences, 61: 360-373.
71
Lynch, D.D. and Risley, J.C., (2003). Klamath River Basin hydrologic conditions prior
to the September 2002 die-off of salmon and steelhead. U.S. Geological Survey Water-Resources Investigations Report 03–4099, 10 p.
Matthews, W.J., and Zimmerman, E.G. (1990). Potential effects of global warming on
native fishes of the southern Great Plains and the Southwest. Fisheries, 15: 26–32.
McIntosh, B.A., J.R. Sedell, J.E. Smith, R.C. Wissmar, S.E. Clarke, G.H. Reeves, and
L.A. Brown. (1994). Management History of Eastside Ecosystems: Change in Fish Habitat Over 50 Years, 1935 to 1992. 1994. Forest Service, U.S. Department of Agriculture
McMahon, T. E., and G. F. Hartman. (1989). Influence of cover complexity and current
velocity on winter habitat use by juvenile coho salmon (Oncorhynchus kisutch). Canadian Journal of Fisheries and Aquatic Sciences 46(9) 1551-1557.
Meisner, J.D. (1990). Potential loss of thermal habitat for brook trout, due to climatic
warming, in two southern Ontario streams. Transactions of the American Fisheries Society 119: 282–291.
Metcalfe, Neil B., Neil HC Fraser, and Martin D. Burns. "Food availability and the nocturnal vs. diurnal foraging trade‐off in juvenile salmon." Journal of Animal Ecology 68.2 (1999): 371-381. Morley, S. A., P. S. Garcia, T. R. Bennett, and P. Roni. (2005). Juvenile salmon
(Oncorhynchus spp.) use of constructed and natural side channels in Pacific Northwest rivers. Canadian Journal of Fisheries and Aquatic Sciences 62:2811-2821.
National Marine Fisheries Service. (2012). Recovery Plan for the Southern
Oregon/Northern California Coast Evolutionarily Significant Unit of Coho Salmon - Public Review Draft. January 2012. Arcata, California. 1418 p.
NRC, 2008. Hydrology, Ecology and Fishes of the Klamath River Basin. National
Research Council of the National Academy of Sciences, The National Academy Press, Washington, D.C.
Nehlsen, W., J. E. Williams, and J. A. Lichatowich. 1991. Pacific salmon at the crossroads: stocks at risk from California, Oregon, Idaho, and Washington. Fisheries 16.2: 4-21. Nielsen J.L. (1992) Microhabitat-Specific Foraging Behavior, Diet, and Growth of
Juvenile Coho Salmon, Transactions of the American Fisheries Society, 121:5,
72
617-634, DOI: 10.1577/1548-8659(1992)121<0617:MFBDAG>2.3.CO;2 Nickelson, T.T., J.D. Rodgers, S.L. Johnson, M.F. Solazzi. (1992a). Seasonal changes in
habitat use by juvenile coho salmon (Oncorhynchus kisutch) in Oregon coastal streams. Canadian Journal of Fisheries & Aquatic Sciences 49: 783-789.
Nickelson, T. E., Solazzi, M. F., Johnson, S. L., & Rodgers, J. D. (1992b). Effectiveness
of selected stream improvement techniques to create suitable summer and winter rearing habitat for juvenile coho salmon (Oncorhynchus kisutch) in Oregon coastal streams. Canadian Journal of Fisheries and Aquatic Sciences, 49(4), 790-794.
Peterson, N. P. (1982). Population characteristics of juvenile coho salmon (Oncorhynchus
kisutch) overwintering in riverine ponds. Canadian Journal of Fisheries and Aquatic Sciences, 39(9), 1303-1307.
Pollock, Michael M., et al. "The importance of beaver ponds to coho salmon production
in the Stillaguamish River basin, Washington, USA." North American Journal of Fisheries Management 24.3 (2004): 749-760.
Ray, R. Adam, Richard A. Holt, and Jerri L. Bartholomew. (2012). Relationship between
temperature and Ceratomyxa shasta-induced mortality in Klamath River salmonids. Journal of Parasitology 98(3): 520-526.
Reiser, D. W., and T. C. Bjornn. (1979). Influence of forest and rangeland management
on anadromous fish habitat in western North America: Habitat requirements of anadromous salmonids. United States Department of Agriculture, Forest Service, Pacific Northwest Forest and Range Experiment Station.
Romaniszyn, E. D., Hutchens, J. J., & Bruce Wallace, J. (2007). Aquatic and terrestrial
invertebrate drift in southern Appalachian Mountain streams: implications for trout food resources. Freshwater Biology, 52(1), 1-11.
Rosenfeld, J. "Assessing the habitat requirements of stream fishes: an overview and
evaluation of different approaches." Transactions of the American Fisheries Society 132.5 (2003): 953-968.
Rosenfeld, J. S., Leiter, T., Lindner, G., & Rothman, L. (2005). Food abundance and fish density alters habitat selection, growth, and habitat suitability curves for juvenile coho salmon (Oncorhynchus kisutch). Canadian Journal of Fisheries and Aquatic Sciences, 62(8), 1691-1701.
Rymer, Russ. (2008). Reuniting a River: After fighting for years over its water, farmers,
Indians and fishermen are joining forces to let the troubled Klamath River run

73
wild again. National Geographic (National Geographic Society). Retrieved 2009-08-21.
Sandercock, F. K. (1991). Life history of coho salmon (Oncorhynchus kisutch). In C.
Groot and L. Margolis (editors), Pacific salmon life histories, p. 396-445. Univ. British Columbia Press, Vancouver.
Solazzi, M.F., T.E. Nickelson, S.L. Johnson, and J.D. Rodgers. (2000). Effects of
Increasing Winter Rearing Habitat on Abundance of Salmonids in Two Coastal Oregon Streams. Canadian Journal of Fisheries & Aquatic Sciences, 57: 906-914.
Soto, T. (2011). Personal communication. Juvenile coho habitat monitoring in the mid-
Klamath watershed. Unpublished data. Karuk tribal fisheries program.
Stocking, R.W. and J.L. Bartholomew. (2007). Distribution and Habitat Characteristics of Manayunkia speciosa and Infection Prevalence with the Parasite Ceratomyxa Shasta in the Klamath River, Oregon-California. Journal of Parasitology 93(l), 78-88.
Tschaplinski, P. J., and G. F. Hartman. (1983). Winter distribution of juvenile coho salmon (Oncorhynchus kisutch) before and after logging in Carnation Creek, British Columbia, and some implications for overwinter survival." Canadian Journal of Fisheries and Aquatic Sciences 40(4): 452-461.
U.S. Forest Service (USFS) (2012). Stream Inventory Handbook. Level I and II. Pacific
Northwest Region. Region 6. Version 2.12 Grunbaum, J. (2012). Personal communication. U.S. Forest Service. Happy Camp
Ranger District, unpublished data Vanni, M. J. (2002). Nutrient cycling by animals in freshwater ecosystems. Annual
Review of Ecology and Systematics, 33(1), 341-370. Ward, D. M., Nislow, K. H., & Folt, C. L. (2009). Increased population density and
suppressed prey biomass: relative impacts on juvenile Atlantic salmon growth. Transactions of the American Fisheries Society, 138(1), 135-143.
Wilzbach, M.A. (1985). Relative roles of food abundance and cover in determining the
habitat distribution of stream-dwelling cutthroat trout (Salmo clarki). Canadian Journal of Fisheries and Aquatic Sciences. 42: 1668–1672.
Witmore, S.K.. (2013). Personal observation, September 20. National Marine Fisheries
Service, Arcata, CA.

74
Ziemer, R.R. (1998). Flooding and stormflows. In: Ziemer, R.R., technical coordinator. Proceedings of the conference on coastal watersheds: the Caspar Creek story, 6 May 1998; Ukiah, California. General Tech. Rep. PSW GTR-168. Albany, California: Pacific Southwest Research Station, Forest Service, U.S. Department of Agriculture; 15-2

75
APPENDIX A
The Presence of 1+ Juvenile Coho across Sites
Throughout the sampling seasons, 1+ juvenile coho were recorded at each site. These fish were noted as 1+ by visual observation only and when they were obviously outside of the range of possible sizes of the 2012 cohort. No scale samples were collected to verify observations.
Site # tagged # 1+ Proportion 1+
Tom Martin 443 0 0.00%
W. Grider Pond 131 0 0.00%
Seiad Creek Beaver Pond 283 0 0.00%
Alexander Pond 322 15 4.66%
Caltrans Pond 613 1 0.16%
China Creek 92 0 0.00%
Cade Creek 70 0 0.00%
Titus Creek 195 0 0.00%
Sandy Bar Creek 262 0 0.00%
Stanshaw Creek 132 1 0.76%