seasonal food security and nutrition assessment in somalia
TRANSCRIPT

Key Findings from the 2013-14 Post Deyr Seasonal Food Security and Nutrition
Assessment in Somalia
3 February 2014, Nairobi
Information for Better Livelihoods

FSNAU Post Deyr 2013/14 Seasonal Assessment
Timeline : November-December (for Field work) Coverage: All parts of Somalia; however, assessment methodology adapted depending on the security condition:üteleconference with key informants (pink areas on the map)üuse of partners and rapid assessment techniques for nutrition surveys; andü assessment in urban areas was done using analyses of secondary data due to funding constraints.
Scope: Food security and nutrition assessment of rural livelihoods, urban livelihoods and Internally Displaced Persons
Process: (1)FSNAU-led assessment with the participation of Technical staff of other UN agencies, partners and government institutions (2) Regional analysis workshops in Garowe & Hargeisa(3) All team analysis workshop in Hargeisa(4) Technical vetting in Nairobi (with partners)(5) Presentation to Government authorities (Mogadishu, Garowe and Hargeisa) (6) Presentation to other stakeholders in Nairobi and technical release (today)(7) Public dissemination (technical release, food security and nutrition outlook; comprehensive technical reports)
With partners and government focal persons

Key Message Highlights
§Nearly 860, 000 people remain acutely food insecure and require urgent humanitarian assistance over the next six month period – a majority of them are IDPs (75%)
§Over 2 million additional people beyond those requiring urgent assistance are classified as Stressed (IPC Phase 2); their food security remains fragile and vulnerable to any major shock that could push them back to Crisis or Emergency (IPC Phases 3 and 4)
§203,000 children under 5 years of age are acutely malnourished of which 51,000 are severely malnourished and face a higher risk of death; a majority of the malnourished are found among non-IDP populations in South-Central Somalia
§Multi-sectoral efforts to address the underlying and basic causes of malnutrition are critical and must be supported by continued humanitarian action
§Lifesaving humanitarian assistance and livelihood support remain vitally important between now and June 2014 to help food insecure populations meet their immediate food needs.
Areas of major concern are: IDPs; mostly rural and some urban populations experiencing food security crisis in Sanaag, Sool, Bari, Nugaal, North and South Mudug, Galgaduud, Hiran, and Middle Shabelle as well as Middle and Lower Juba regions. Other areas (mostly in South and Central Somalia) that have in the past experienced repeated food security crises and persistently high levels of acute malnutrition also remain a major concern.
(‘000s)

Presentation Outline•Sectoral Analysis – Abdullahi Khalif, National Technical Manager, FEWS NET Somalia
•Nutrition Analysis – Nina Dodd, Nutrition Technical Manager, FSNAU
•Integrated Food Security Analysis – Tamara Nanitashvili, Food Security Technical Manager, FSNAU
•Summary Results and Key Messages - Daniel Molla, Chief Technical Advisor, FSNAU

SECTORAL ANALYSIS
• Civil Insecurity • Climate• Markets • Livestock• Agriculture

Civil InsecurityConflict in most part of the southern regions of the country remained active:§ Suicide attacks, hand grenades, Rocket Propelled grenades, mortar
attacks, targeted attacks on prominent individuals mainly in Mogadishu
§ In the Jubas and Shabelles, many forms of conflict have increased sinceJuly 2013
§ In Bay and Bakool, armed confrontations between insurgent andgovernment forces backed by troops from the African Union Mission toSomalia (AMISOM) emerged in November.
§ In Hiraan, conflict and trade restrictions have affected market access
§ Conflict in North of Jowhar town between two clans
Continued insecurity poses a major challenge to food security, especially inSouth-Central Somalia
Assumptions§Insecurity will likely continue through June. Clan conflicts in the Shabelle will likely continue with likely adverse impact on trade, labor migration, and normal movement of people and livestock.
§Conflict between insurgent and government forces supported by troops from AMISOM are unlikely to decrease between now and June with potential adverse impact on trader movements and humanitarian access in some areas.
§All forms of conflict in southern and central Somalia may lead to additional displacement of populations between now and June and requires close and continuous monitoring.

Climate Performances/OutlookOct – Dec 2013 Seasonal Cumulative Rainfall estimates
(Source: NOAA/FEWS NET)
• Statement: Deyr 2013 rainfall exhibited a mixed trend in terms of amount, temporal and spatial coverage across the country. The rains were normal to above normal in most of the country with the exception of most of Juba, some parts of Gedo, Lower Shabelle, Central, Hiran and Sanaag regions where rains were below to near normal.
§ In the North, Tropical Cyclone 3 led to flash floods in the eastern sector of Bari and Nugal regions of Northeast Somalia. The December to January Xays rains over Guban Pastoral of northwestern Somalia and East-Golis
§ Rains ended earlier than normal (3rd dekad of November 2013) across the country except parts of Lower and Middle Juba, Bay and Middle Shabelle regions which received localized light to moderate rains.
§ From October to December, the upper catchments in Ethiopia received unusually high amounts of rain. This led to river flooding on arable land in the Juba and Shabelle Valleys.

2014 Gu (Apr-Jun) Season Rainfall Outlook
An updated and more reliable forecast is expected at the end of February when the 36th Greater Horn of Africa Climate Outlook Forum (GHACOF 36) concludes its session.
ECMWF Seasonal (Jan to June) Statement: ENSO neutral conditions are expected to continue through June, therefore, near normal seasonal rainfall performance is forecast for the April – June period, across Somalia.
However, long-term forecasts have very low reliability skills and will require close monitoring and updates.

Market Trend Analysis
§ Exchange Rates: Somali Shilling: Stable/slightly depreciation in July-Dec . However, its slightly stronger than Dec 2012. Somaliland Shilling: Stable in since July and in Dec 12-Dec 13 period
§ Imported commodities: In most Sosh markets, prices of imported commodities were generally stable or declined from July 2013 . They are modestly lower than 2012. In SlSh zone commodity prices are relatively stable due to steady supply through Berbera Port and stable Shilling
§ Cross-border trade: reduced trade activity in re-exports of imported food items due to restrictions related to seasonal rains and security related restrictions in Ethiopia (Nov 2013)
§ Consumer Price Index (CPI): Slight increase In CPI in most regions related to seasonal peaks in staple cereals. CPI generally stable since a year a go.
Trend since January 2013: mostly stable
§ Exchange rates likely to remain stable through June
§ Imported commodity: prices will likely remain stable through April. Following the normal, seasonal trend, prices will likely start to rise slightly in May as shipping is curtailed from May to August during the monsoon winds off the coast
§ Livestock imports and exports expected to follow seasonal trend of decrease
§ Below average cereal production likely to affect the cost of minimum expenditure basket (MEB)
Expected trend to June 2014

Livestock Performances
§ Improved rangeland conditions across pastoral areas except pockets in central, Sanaag, Coastal deeh of central regions and Juba resulting in typical livestock migration
§ Livestock reproduction: medium to low kidding and lambing (small ruminants), low to medium calving for cattle and camel across the country
§ Livestock body condition (PET 3-4) is average to above average across the country
§ Milk production: generally improved in all pastoral livelihoods across the country. Average to good in the North, average to near average in Central (Camel) and average to near average in the South (all species)
§ No epidemic diseases reported
Deyr 2013/14
Outlook through June 2014:Medium kidding/calving (North/South). Medium kidding/low calving (Central). In the North: increased in herd size (camel = above baseline; goat/sheep near baseline). In Central: camel at baseline, goat/sheep at baseline. In the South: Increased trend in herd size but still below baseline except SIP.

Livestock Prices
• Increasing livestock prices from July to October and decreasing trend from November, consistent with seasonal trends
• Livestock price are expected to follow seasonal trend of decreasing through March 2014
Regional Trends in Local Quality Goat Prices (SOSH)
Regional Trends in Local Quality Goat Prices (SOSH/SLSH)
0
200,000
400,000
600,000
800,000
1,000,000
1,200,000
1,400,000
1,600,000
Dec
-09
Mar
-10
Jun-
10
Sep
-10
Dec
-10
Mar
-11
Jun-
11
Sep-
11
Dec
-11
Mar
-12
Jun-
12
Sep
-12
Dec
-12
Mar
-13
Jun-
13
Sep
-13
Dec
-13
Pric
e pe
r Hea
d of
Goa
t (SO
SH
)
Month
SorghumBelt Shabelle Valley Juba Valley
0
50,000
100,000
150,000
200,000
250,000
300,000
350,000
400,000
450,000
0
200,000
400,000
600,000
800,000
1,000,000
1,200,000
1,400,000
1,600,000
1,800,000
Dec
-09
Mar
-10
Jun-
10
Sep
-10
Dec
-10
Mar
-11
Jun-
11
Sep
-11
Dec
-11
Mar
-12
Jun-
12
Sep
-12
Dec
-12
Mar
-13
Jun-
13
Sep
-13
Dec
-13
Pric
e pe
r Hea
d of
Goa
t (S
LSH
)
Pric
e pe
r Hea
d of
Goa
t (S
OS
H)
Month
NE Central NW (SLSH)

Livestock Export Performance
• Livestock exports in 2013 remain among the highest in recent years and 18% higher than the 2008-2012 five-year average but slightly lower than in 2012 (by 4%).
0
1,000,000
2,000,000
3,000,000
4,000,000
5,000,000
6,000,000
2008 2009 2010 2011 2012 2013
Num
ber o
f Hea
ds
July-Dec Livestock Exports Jan-June Livestock Exports 5-year Average (2008-2012)

AgricultureDeyr 2013 Cereal (Maize and Sorghum) Production in Somalia
§ Deyr 2013/14 cereal production in the south is below average (by about 20%) and significantly lower than 2012 Deyr production (by 43%)
§ The decline in cereal production is mainly due to a reduced contribution from Middle Shabelle(flooding/conflict); Juba (floods/ poor rains); and a switch to sesame (cash crop) cultivation in Lower Shabelle
§ The Gu/Karan 2013 production in the North is also 38% below the three year average for 2010-2012
Regions
Deyr 2013 Production in MTDeyr 2013
as % of Deyr 2012
Deyr 2013 as % of Deyr
PWA(1995-2012)
Deyr 2013 as % of 5
year average
(2008-2012)
Maize Sorghum Total Cereal
Bakool 300 2,500 2,800 32% 101% 55%Bay 2,100 30,000 32,100 56% 93% 74%Gedo 2,200 3,600 5,800 100% 107% 139%Hiran 1,100 2,500 3,600 50% 60% 90%Juba Dhexe (Middle) 300 800 1,100 14% 23% 21%Juba Hoose (Lower) 1,100 100 1,200 49% 80% 101%Shabelle Dhexe(Middle) 4,200 5,900 10,100 61% 84% 83%
Shabelle Hoose(Lower) 13,800 10,700 24,500 65% 73% 83%
Deyr 2013 Total 25,100 56,100 81,200 57% 81% 78%
Regions
Gu - Karan 2013 Production Estimate in MT Gu-Karan 2013
as % of Gu-Karan 2012
Gu-Karan 2013 as %
PET average(2010-2012)
Maize SorghumTotal
Cereal
Awdal(Gu/Karan ’13 harvest)
2,800 11,750 14,550 88% 70%
Waqooyi-Galbeed(Gu/Karan ‘ 13 harvest)
5,500 23,000 28,500 55% 58%
Togdheer(Gu ’13 harvest)
50 1,000 1,050 24% 32%
Total (Harvest) 8,350 35,750 44,100 60% 62%

Agriculture: Cereal Prices
Local cereal prices generally showed a mixed trend, largely increasing during lean season consistent with seasonal trends.
Main cereal producing districts in Bay (Baidoa), Lower Shabelle (Qoryoley), Middle Juba (Jilib) and Gedo (Bardhere) still showing atypical cereal price increases in December 2013.
Sorghum Belt-Trends in Red Sorghum/White Sorghum Prices
Shabelle & Juba Riverine-Trends in White Maize Prices
North West -Trend in White Sorghum Prices
0
5,000
10,000
15,000
20,000
25,000
30,000
Dec
-09
Mar
-10
Jun-
10
Sep-
10
Dec
-10
Mar
-11
Jun-
11
Sep
-11
Dec
-11
Mar
-12
Jun-
12
Sep-
12
Dec
-12
Mar
-13
Jun-
13
Sep-
13
Dec
-13
Pric
e pe
r Kg
(SO
SH)
Month
Bardera (Red Sorghum 1 kg) Baidoa ( Red Sorghum 1 kg) Huddur ( Red Sorghum 1 kg) Betetweyne (White Sorghum 1kg)
0
5,000
10,000
15,000
20,000
25,000
Dec-
09
Mar
-10
Jun-
10
Sep-
10
Dec-
10
Mar
-11
Jun-
11
Sep-
11
Dec-
11
Mar
-12
Jun-
12
Sep-
12
Dec-
12
Mar
-13
Jun-
13
Sep-
13
Dec-
13
Pric
e pe
r Kg
(SO
SH)
Month
Jamame (White Maize 1kg)
Jilib (White Maize 1kg)
Qorioley (White Maize 1kg)
Jowhar (White Maize 1kg)
0
1,000
2,000
3,000
4,000
5,000
6,000
7,000
8,000
Dec
-09
Mar
-10
Jun-
10
Sep
-10
Dec
-10
Mar
-11
Jun-
11
Sep
-11
Dec
-11
Mar
-12
Jun-
12
Sep
-12
Dec
-12
Mar
-13
Jun-
13
Sep
-13
Dec
-13
Pric
e pe
r Kg
(SLS
H)
Month
Hargeisa (White Sorghum 1kg) Borama (White Sorghum 1kg) Togwajale (White Sorghum 1kg) Burao (White Sorghum 1kg)

NUTRITION ANALYSIS

•Rates of acute malnutrition improved slightly or remained stable since Gu 2013 –exception being Qardho IDPs and Berbera IDPs
•There have been no changes in the rates of malnutrition compared to Deyr 2012/13 for most livelihoods (except a deterioration in Garowe IDP)
•Positive correlation of Global (GAM) and Severe (SAM) Acute Malnutrition=0.73
•Median GAM rates for Somalia are 14.2% in Dec 2013 compared to 14.4% in August 2013
Acute Malnutrition
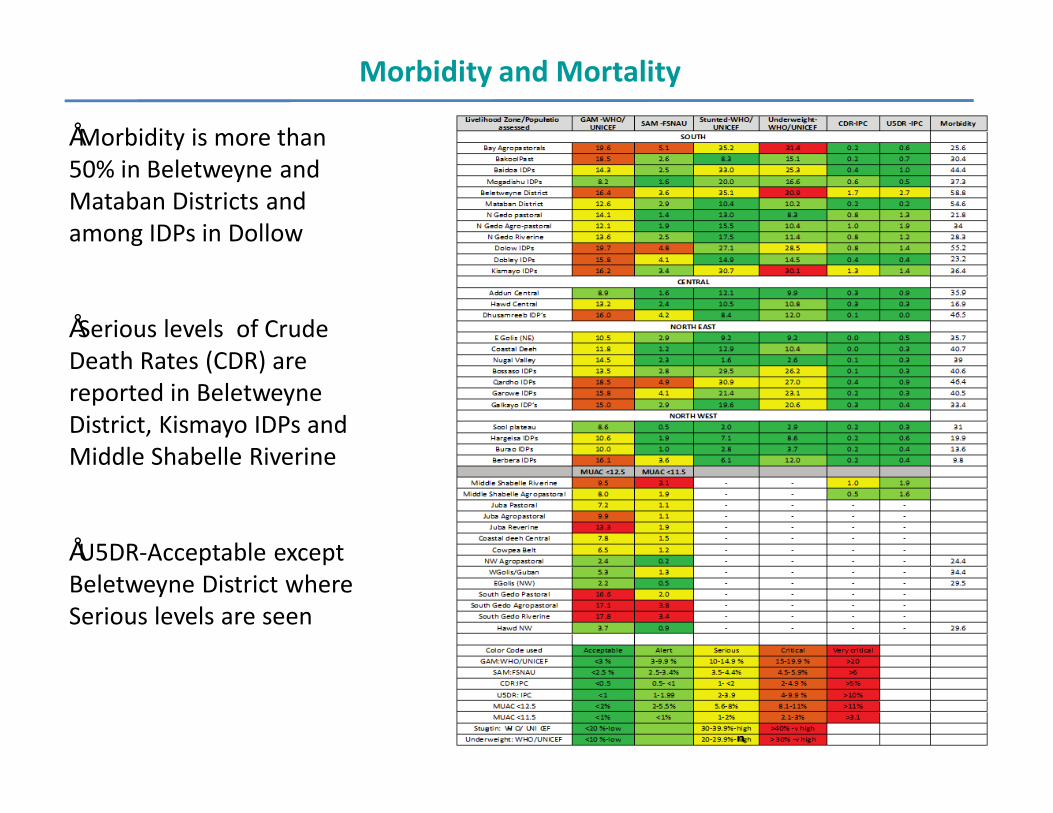
•Morbidity is more than 50% in Beletweyne and Mataban Districts and among IDPs in Dollow
•Serious levels of Crude Death Rates (CDR) are reported in BeletweyneDistrict, Kismayo IDPs and Middle Shabelle Riverine
•U5DR-Acceptable except Beletweyne District where Serious levels are seen
Morbidity and Mortality
Stunting and Wasting
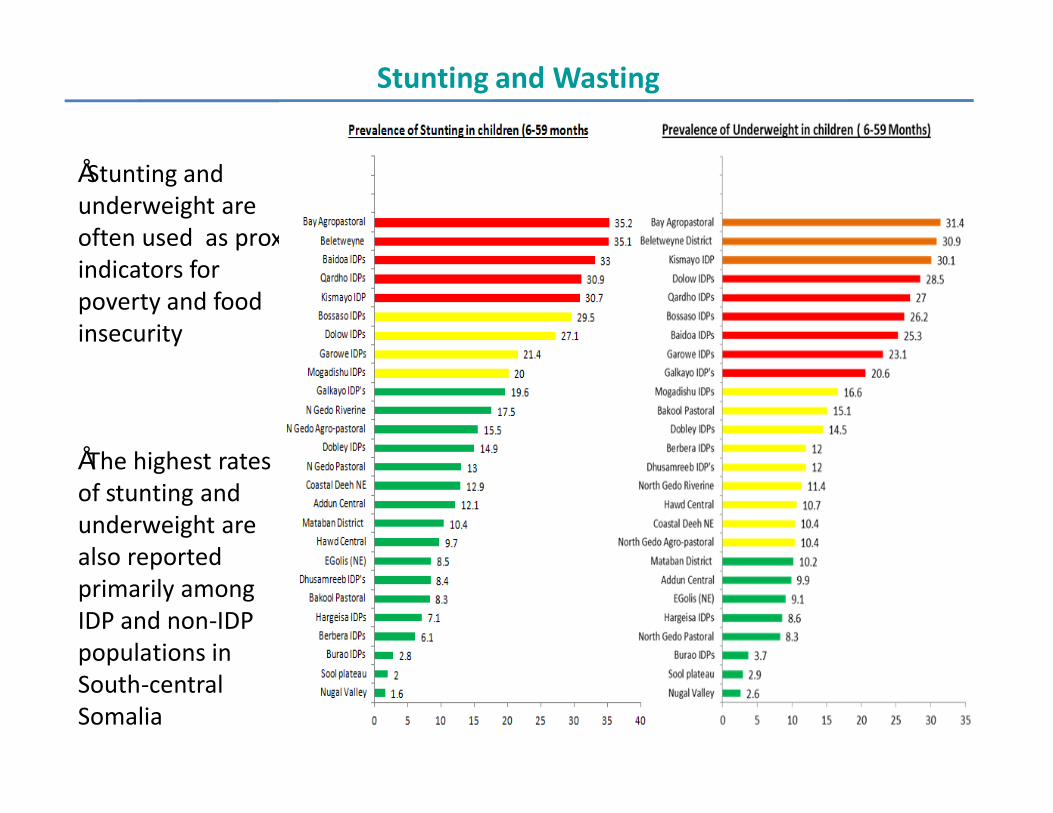
•Stunting and underweight are often used as proxy indicators for poverty and food insecurity
•The highest rates of stunting and underweight are also reported primarily among IDP and non-IDP populations in South-central Somalia
Trends in Malnutrition in Somalia
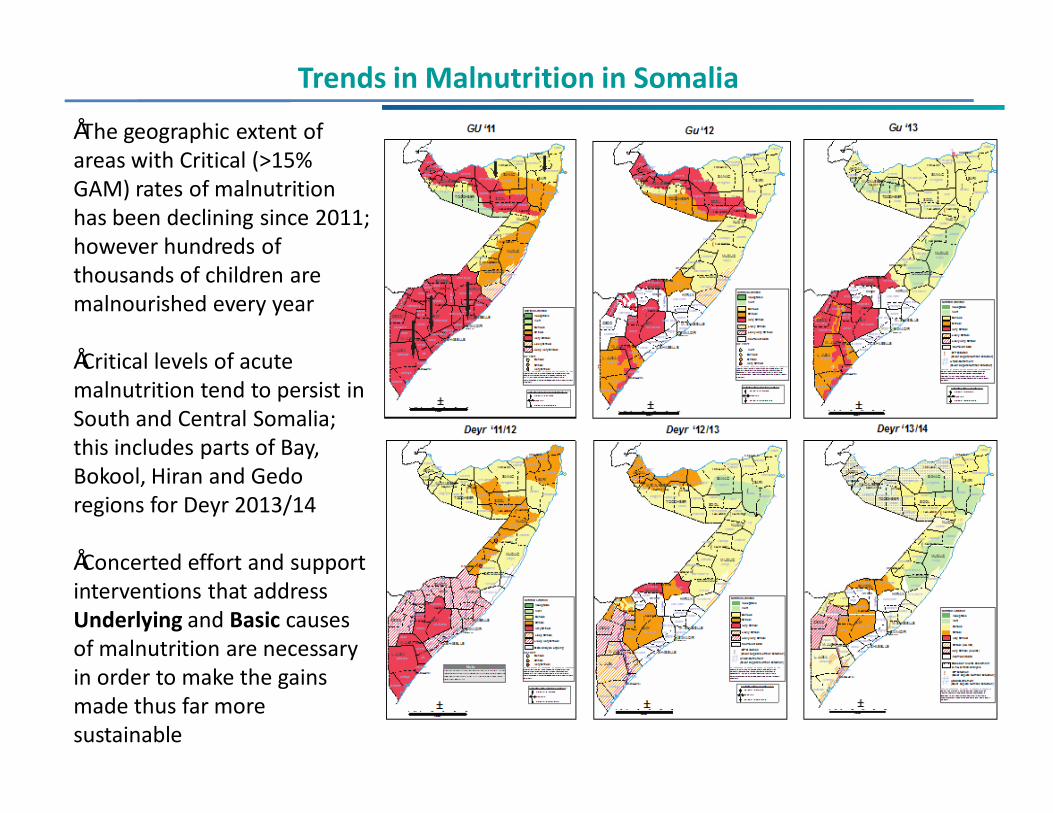
•The geographic extent of areas with Critical (>15% GAM) rates of malnutrition has been declining since 2011; however hundreds of thousands of children are malnourished every year
•Critical levels of acute malnutrition tend to persist in South and Central Somalia; this includes parts of Bay, Bokool, Hiran and Gedoregions for Deyr 2013/14
•Concerted effort and support interventions that address Underlying and Basic causes of malnutrition are necessary in order to make the gains made thus far more sustainable

Number of Malnourished Children (based on Prevalence)
•Deyr 2013/14 nutrition surveys indicate an estimated 203,000 children under-5 as being acutely malnourished (compared to 206,000 in Gu 2013 and 215,000 in Deyr 2012/13
•The largest proportion of acutely malnourished children (68%) are located in South-central Somalia
• Number of severely malnourished children under-5: 51,000 for Deyr 2013/14 (compared to 41,000 in Gu 2013 and 51,000 in Deyr 2012/13
•The number of severely malnourished children as a proportion of total number of acutely malnourished children is slightly higher in Deyr 2013 (25%) compared to Gu 2013 (20%) and Deyr 2012/13 (21%)

INTEGRATED FOOD SECURITYANALYSIS
•Rural Livelihoods•Urban Livelihoods•Internally Displaced Persons (IDPs)

Rural Livelihoods (Mostly Livestock Dependent)
Milk availability (source of income/ food): o Average in most livelihoods, apart from cyclone affected
areas in Northeast (Eyl, Bandarbayle and Dangorayodistricts)
Livestock holding (main asset): o Increasing trend in livestock herd size among the Poor except
the cyclone affected areas (drastic reduction); o Despite the increase, livestock herd size among the poor still
remains below baseline levels in most livelihoods apart from Juba camel pastoralists (SIP), which is above baseline.
Terms of Trade (ToT): o High ToT across pastoral livelihoods due to high livestock
prices and relatively low cereal prices; o ToT declined over the past one year in most regions although
still higher than 5yr average (2008-2012) across the country
Food consumption: o Protection and survival (food & water) deficits found among
populations in cyclone (Northeast) and flood-affected areas (Jowhar), respectively
There are an estimated 2.7 million pastoralists and mainly livestock-dependent agropastoralists across Somalia
Regional Trend in Terms of Trade: Cereal to Goat
Regional Trend in Terms of Trade: Cereal to Goat
0
10
20
30
40
50
60
70
80
90
100
Dec
-09
Mar
-10
Jun-
10
Sep
-10
Dec
-10
Mar
-11
Jun-
11
Sep
-11
Dec
-11
Mar
-12
Jun-
12
Sep
-12
Dec
-12
Mar
-13
Jun-
13
Sep
-13
Dec
-13
Kg
per H
ead
Month
Central (Red Rice) NE(Red Rice) NW (Red Rice)
0
50
100
150
200
250
300
350
Dec
-09
Mar
-10
Jun-
10
Sep
-10
Dec
-10
Mar
-11
Jun-
11
Sep
-11
Dec
-11
Mar
-12
Jun-
12
Sep
-12
Dec
-12
Mar
-13
Jun-
13
Sep
-13
Dec
-13
Kg
per H
ead
Month
SorghumBelt (Red Sorghum) Juba Valley (White Maize) Shabelle Valley(White Maize)

Rural Livelihoods (Mainly Crop-Dependent)
Cereal stock availability among poor households:o Average cereal stock availability (3-4 months) at
household level in major cereal-producing areas (Shabelle, Bay);
o Lack of cereal stocks due to poor harvest in agropastoral areas of Beletweyne (Hiran), Jowhar(Middle Shabelle) Riverine (flood/conflict affected areas) and Middle Juba Agropastoral & Riverine
Farm Labour: o High farm labour wages (> 5yr avg) in most areas
apart from agropastoral of Middle Juba and Jowhar; o Normal access to labour opportunities in the coming
Gu rainy season (projected as near normal) and off-season opportunities (riverines of L. Shabelle, Jubas)
Terms of Trade (ToT): o Higher ToT compared to 5yr average in most areas
apart from Middle Juba Agropastoral and Jowhar (< 5yr avg);
Terms of Trade Agriculture Labour Wage to Cereal
Terms of Trade Agriculture Labour Wage to Cereal
0
5
10
15
20
25
Dec-
09
Mar
-10
Jun-
10
Sep-
10
Dec-
10
Mar
-11
Jun-
11
Sep-
11
Dec-
11
Mar
-12
Jun-
12
Sep-
12
Dec-
12
Mar
-13
Jun-
13
Sep-
13
Dec-
13
Kg p
er L
abou
r Wag
e
Month
M Shabelle L Shabelle Jubas
0
5
10
15
20
25
30
35
40
Dec-
09
Mar
-10
Jun-
10
Sep-
10
Dec-
10
Mar
-11
Jun-
11
Sep-
11
Dec-
11
Mar
-12
Jun-
12
Sep-
12
Dec-
12
Mar
-13
Jun-
13
Sep-
13
Dec-
13
Kg p
er L
abou
r Wag
e
Month
Hiraan Bay Bakool Gedo
There are an estimated 1.8 million mainly crop-dependent agropastoralists and riverine people across Somalia

Terms of Trade Casual Labour Wage to Cereals:
Terms of trade (casual labour/ cereals) have either improved or remained stable in Dec-Jul 2013 in most urban markets (10 out of 18 regions); ToT is higher than 5yr average in most urban areas of the country
Urban Livelihoods
Cost of the Minimum Basket (CMB) Trend:Relatively stable or decreased CMB over the past one year in most regions; lower than 5yr average across urban areas due to the decline in prices of cereals and imported commodities
Market purchase represents main source of food or urban households;
0
5
10
15
20
25
Kg p
er D
aily
Lab
or W
age TOT Labor Wage to Cereals
Dec-12 Jul-13 Dec-13 5-Year average (Dec 13)
-50%
-40%
-30%
-20%
-10%
0%
10%
20%
30%% CMB change from July 13, Dec 12 & 5 YA
6 months 1 year 5YA

Vulnerability: % of Food Spending
§ Households in most urban areas of Somalia spend more than 75 percent of their income on food alone, which signifies a high degree of vulnerability to market food price fluctuations
Urban Livelihoods
§ No major shocks in rural areas in the past 6months to affect urban population through increased competition for labour/ social support in urban areas; Exceptions Middle Shabelle (flood &clan conflict), Middle Juba (poor harvest), Bari and Nugaal (cyclone) regions
§ Nutrition situation varied from Acceptable to Serious in most urban areas (Jul ‘13)

§ High proportion (> 20%) of newly arrived IDPs (within past one year): Dobley (32.7%), Mogadishu (27.5%) and Baidoa (24%) mostly from within or neighboring regions; > 50% are long-term IDPs (>3 years) in most settlements in the North
Internally Displaced Persons (IDPs)
There are an estimated 1.1 million internally displaced persons (IDPs) across Somalia of which 635,000 live in the assessed (13) major settlements; ~60% of the assessed IDPs are concentrated in Banadir/ Mogadishu
0.0%
20.0%
40.0%
60.0%
80.0%
100.0%
120.0%
Duration of Residency in the IDP Settlement
1-3 months 4-12 months 1-3 years >3 years
%
0.0%10.0%20.0%30.0%40.0%50.0%60.0%70.0%80.0%90.0%
100.0%
HH Dietary Diversity
4 food groups and more less than 4 food groups
§ Relatively diverse diet among the majority of IDPs in most settlements apart from Kismayo where 50% of IDPs have inadequate diet; WDHs are majority of HHs consuming less than 4 food groups

Access to Food Among IDPs
Food accounts for over 75% of IDP Households’ expenditures for all settlements. This signifies a high degree of vulnerability in times of high food prices and/or reduced income; no stat. significant difference between WDH and MDH0%
10%20%30%40%50%60%70%80%90%
100%Expenditure pattern
% Expenditures (food) % Expenditures (non-food)
0% 20% 40% 60% 80% 100%
Baidoa
Bossaso
Dobley
Dusamareb
Garowe
Kismayo
Qardo
none 1-2 assets 3 assets or more
Majority of IDPs (60% or above) have a very low level of productive asset ownership (0-2), which indicates at a reduced income generation and coping capacity; MDHs dominate in ownership of land and shoats.

Integrated Phase Classification Maps
Current: Jan 2014 Most Likely Scenario: Feb-Jun 2014
Populations experiencing acute food security crisis (IPC Phases 3 &4) are concentrated across the 13 main IDP settlements as well as rural and some urban areas in Sanaag, Sool, Bari, Nugaal, North and South Mudug, Galgaduud, Hiran, and Middle Shabelle as well as Middle and Lower Juba regions.
Behind the predominantly yellow IPC Phase 2 (Stress) map, there are pockets of population groups that are experiencing a food security Crisis (IPC Phase 3) or Emergency (IPC Phase 4). They are listed below.

Summary Results and Key Messages
Acute Food Insecurity SituationCurrent (Jan 2014)
Projected (Feb-Jun 2014)
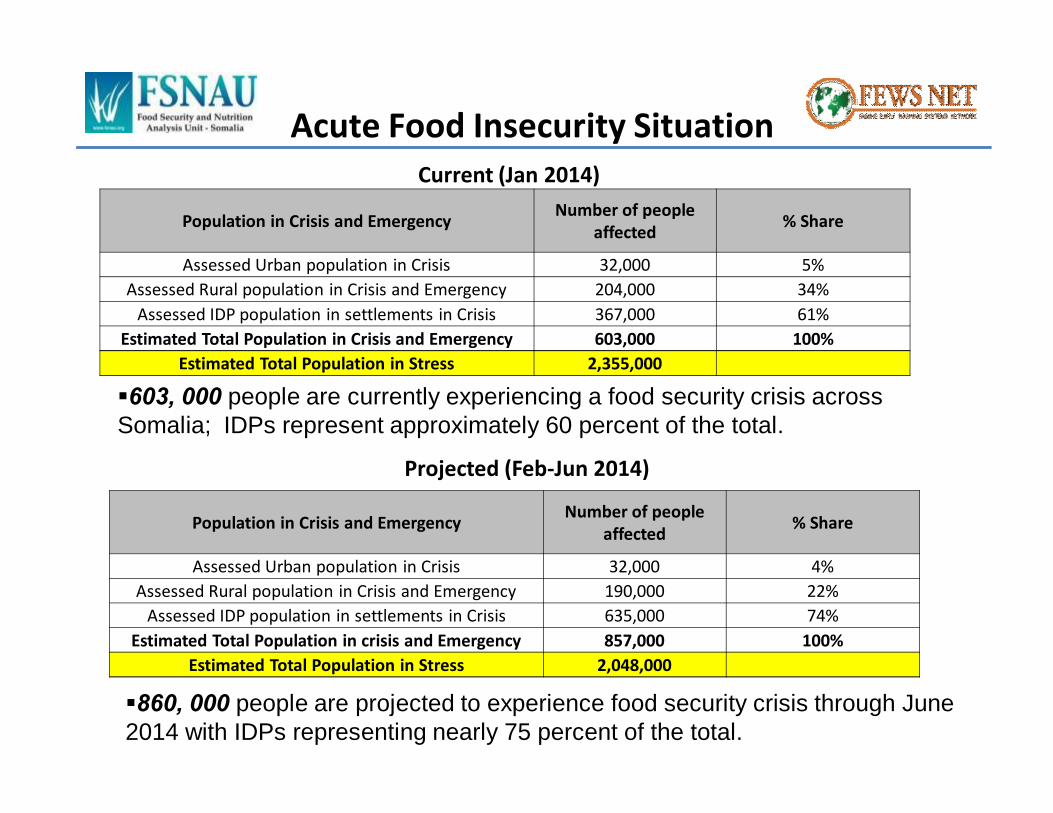
§603, 000 people are currently experiencing a food security crisis across Somalia; IDPs represent approximately 60 percent of the total.
§860, 000 people are projected to experience food security crisis through June 2014 with IDPs representing nearly 75 percent of the total.
Population in Crisis and Emergency Number of people affected % Share
Assessed Urban population in Crisis 32,000 5%Assessed Rural population in Crisis and Emergency 204,000 34%
Assessed IDP population in settlements in Crisis 367,000 61%Estimated Total Population in Crisis and Emergency 603,000 100%
Estimated Total Population in Stress 2,355,000
Population in Crisis and Emergency Number of people affected % Share
Assessed Urban population in Crisis 32,000 4%Assessed Rural population in Crisis and Emergency 190,000 22%
Assessed IDP population in settlements in Crisis 635,000 74%Estimated Total Population in crisis and Emergency 857,000 100%
Estimated Total Population in Stress 2,048,000

Food Insecurity Projection: Feb-Jun 2014
§Nearly 860, 000 people remain acutely food insecure across Somalia.
§The number of people facing acute food security crisis has shown very little improvement since August 2013.
§The positive impact of increased livestock prices, increasing livestock herd sizes, improved milk availability, low prices of both local and imported staple food commodities, higher purchasing power from labor income and livestock sales as well as sustained humanitarian interventions over the last six months was undermined by a nearly 20 percent decline in the Deyr 2013 cereal harvest compared to the long-term and five-year averages, exacerbated by rainfall deficit, conflict, floods and cyclone.
§Recovery remains fragile and acute malnutrition persists. Over 2 million additional people beyond those requiring urgent assistance are classified as Stressed (IPC Phase 2); their food security remains fragile and vulnerable to any major shock that could push them back to Crisis or Emergency (IPC Phases 3 and 4)

Food Insecurity Trends in Somalia
§There has been a steady decline in the severity of acute food security crisis in Somalia in recent years (an increasingly lower number of people in Emergency relative to the numbers in Stressed).
§However, this improvement remains fragile, with an average of over 2 million people remain in food security Stress (IPC=2) since February 2013;
§Nutrition support should be provided to the 203,000 malnourished children, a majority of which are found among rural populations in South and Central Somalia
§Measures aimed at addressing underlying and root causes of malnutrition are important to reduce levels of acute malnutrition on a sustainable basis with a focus on areas that have persistent high levels of acute malnutrition (south central Somalia)
§In order to ensure sustainability of the gains made thus far, it would be important to invest in interventions aimed at protecting livelihoods, and building the resilience of the 2 million people that will be experiencing a food security Stress (IPC Phase=2) – a major shock can push them back to a food security Crisis or Emergency (IPC Phases 3 and 4)
§ Somalia is a country with unacceptably high rates of acute malnutrition. One in nearly eight children under 5 suffers from acute malnutrition at the time of the assessments. The situation among IDPs is worse (about one in six)
§ Currently 203,000 children <5 yrs are estimated to be acutely malnourished ( approximately the same number as in Gu 2013). Sixty eight percent of these children are in South-central Somalia
§ 51,000 children under 5 are suffering from severe acute malnutrition and are at higher risk of death and disease, a slightly higher proportion (25 %) in Deyr 2013/4 compared to 20 % in Gu 2013 or 21% in Deyr 2012/13
§ Acute malnutrition in Somalia, particularly in South-Central and among IDP populations is also exacerbated by chronic malnutrition
§ Treatment of Severe and Moderate Acute Malnutrition (SAM and MAM) must become more central to the health care and health sector agendas
§ Multi-sectoral efforts to address the underlying and basic causes of malnutrition are critical and must be supported by continued humanitarian action
Malnutrition in Somalia