seafood exchange united states - global aquaculture … · industry association. ... protein...
TRANSCRIPT

1
Travis Larkin Seafood Exchange United States Travis Larkin is president of Seafood Exchange, a seafood-importing and wholesale company based in Raleigh, North Carolina USA. Previously, he handled shrimp procurement for Darden Restaurants until 1997. Larkin is actively involved in GAA and the National Fisheries Institute, where he currently serves as chairman of its Nominating Committee and previously served on its Executive Committee. He also served as president of the National Shrimp Industry Association.

Closing Remarks Travis Larkin
President, Seafood Exchange Raleigh, North Carolina, USA

GOAL 2013 “Join the Journey”
What have we learned on our journey together this week?

First, that this is a beautiful city
4

Five Major Challenges (+1)
1. Health and Disease Management
2. Feeds
3. Environmental/Social Accountability
4. Investment Capital
5. Market Support
6. Leadership
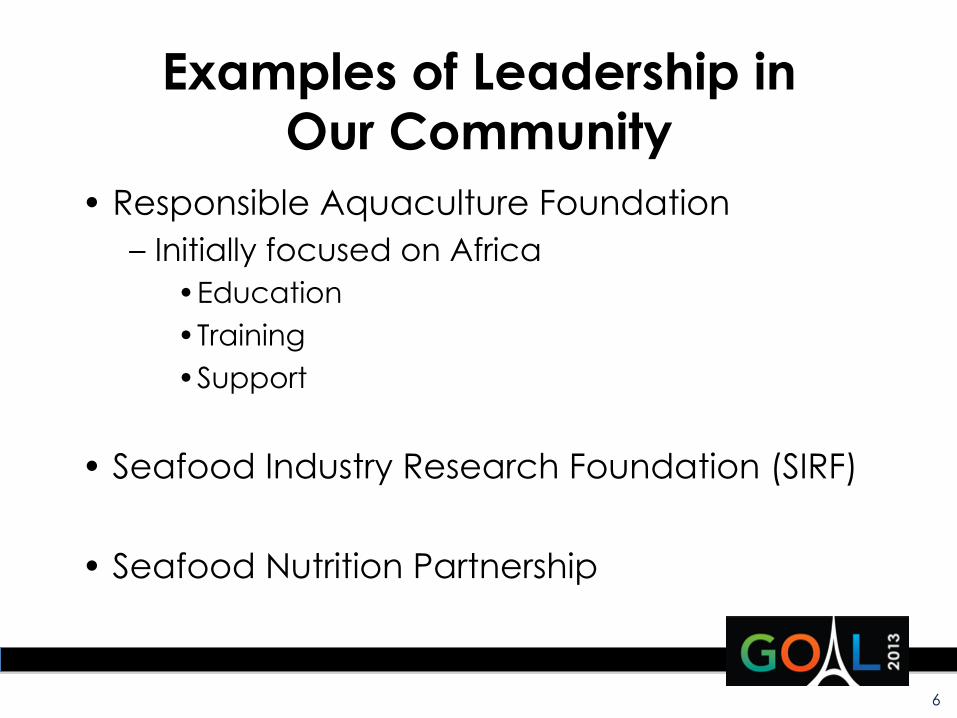
Examples of Leadership in Our Community
• Responsible Aquaculture Foundation – Initially focused on Africa
• Education • Training • Support
• Seafood Industry Research Foundation (SIRF)
• Seafood Nutrition Partnership
6

Seafood is Essential Nutrition Solution
Ea#ng 8 oz. of seafood a week reduces the risk of dying from
heart disease by
36%
Moms-‐to-‐be that eat 8 to 12 oz. of seafood a week
have
be'er outcome for baby brain and
eye health
Older adults who had the highest
blood levels of the faAy acids found in
fish lived, on average
2.2 years longer
Source: JAMA Source: JAND Source: Annals of Internal Medicine
7

Projected seafood consumption by source through 2050
8
-
20
40
60
80
100
120
140
160
180 19
50
1953
19
56
1959
19
62
1965
19
68
1971
19
74
1977
19
80
1983
19
86
1989
19
92
1995
19
98
2001
20
04
2007
20
10
2013
20
16
2019
20
22
2025
20
28
2031
20
34
2037
20
40
2043
20
46
2049
MM
T
Source: FAO, HighQuest Analysis
Wild Catch Aquaculture
HQP estimate based on linear growth rate (1980-2011) of production for wild catch(1.0%) and aquaculture(8.1%): • 2013 - 2021 at historical growth rate • 2022 - 2031 at 75% of historical growth rate • 2032 - 2041 at 50% of historical growth rate • 2042 - 2050 at 25% of historical growth rate

Insights from Ole-Eirik Lerøy
• By 2030: Additional 40 million MT of aquatic food needed
• We have a great story to tell! – Time for transparency and a straight telling of
our story…Remember doctors and “internet patients.”
– Blue is the new green!
9

World Shrimp Aquaculture by Species: 1991-2015 EMS takes a bite out of supply
0.0
0.6
1.2
1.8
2.4
3.0
3.6
4.2
Million MT
1991 1993 1995 1997 1999 2001 2003 2005 2007 2009 2011 2013 2015
P. vannamei P. monodon M. rosenbergii Other
12%
59%
67% 65%
71%
Percentages indicate the share of P. vannamei.
16%
72%
45%
76%
Sources: FAO (2013) for 1991-2011; GOAL (2013) for 2012-2015.

U.S. Shrimp Imports Down Over 15% Since 2011
0
80
160
240
320
400
480
560
640
1997 1999 2001 2003 2005 2007 2009 2011 2013*
Thou
sand
MT
Other
Honduras
Malaysia
Mexico
China
Vietnam
India
Indonesia
Ecuador
Thailand
Source: USDC/NMFS (2013) * Estimate
After peaking in 2010 at 203,000 tons, imports from Thailand declined in 2011 and 2012
and are expected to fall even further in 2013 to around 90,000 tons. Ecuador, Indonesia,
and India are picking up some of the slack. Imports from Mexico have also fallen.

Spanish Shrimp Imports Down 22% since 2011 First a weak economy, now high prices
0
20
40
60
80
100
120
140
160
180
200
1997 1999 2001 2003 2005 2007 2009 2011 2013*
Thou
sand
MT
Others India Honduras Morocco Senegal Thailand Nicaragua China Ecuador Argentina
Source: Eurostat (2013) * Estimate
Reflecting the difficult economic conditions in the country, the Spanish market
contracted substantially in 2012 and is expected to contract even further in 2013 (-20%
relative to 2011). Argentina and Ecuador currently supply around 50% of the market.

Prices Rising Sharply P. monodon vs. P. vannamei (U.S. Wholesale)
Source: Urner Barry (2013)
(2.00)
(1.00)
-‐
1.00
2.00
3.00
4.00
5.00
6.00
7.00
8.00
9.00
Jan-‐99 Jan-‐00 Jan-‐01 Jan-‐02 Jan-‐03 Jan-‐04 Jan-‐05 Jan-‐06 Jan-‐07 Jan-‐08 Jan-‐09 Jan-‐10 Jan-‐11 Jan-‐12 Jan-‐13
USD/
lb
Farmed, Ecuador White, 26-‐30 Farmed, SE Asian Tiger, 26-‐30 Premium (White minus Tiger)
Wholesale shrimp prices have been rising since 2010 but increased sharply during 2013, reflecting the reduced
availability of imported shrimp in the U.S. market as a result of EMS/AHPNS.

Diseases***Production costs - Feed/Fishmeal
Access to disease-free broodstock***International market prices
Seed stock quality & availabilityProduction costs - Others
Environmental managementFeed quality and availability
Product quality controlProduction costs - Fuel
Access to CreditBanned chemicals / antibiotic use
***International trade barriersMarket coordination
InfrastructureConflicts with other users
Public Relations Management
Not Important Extremely Important
Moderately Important
GOAL 2013 Survey Issues & Challenges in Shrimp Aquaculture
All Countries
Asterisk indicates a Top 3 issue in GOAL 2007 Survey

EMS: “It’s Complicated” - Robins McIntosh
A Perfect Killer??? • It grows extremely fast (competitive). • It is a colonizer (very sticky). • It produces a potent toxin. • Quorum Sensing (coordination of activity).
15

Market Impacts of EMS
1. Trade flow shift from West to East (China a key new net importer)
2. Demand contraction to accelerate in the west
3. Lack of quality information available to the public
16

Thailand's Recovery Scenarios
17
0
100,000
200,000
300,000
400,000
500,000
600,000
700,000
2010 2011 2012 2013 2014 2015 2016 2017 2018
U recovery
PessimisOc scenario
V recovery

Aquaculture Fish
• Production expected stable or down for 2013 and 2014
• Double in a decade? Yes for some species from 2003 to 2013, but slower growth rates now
• Growth trend declining in general
18

Production of Surveyed Species Excl. Carp in China 2002-2014
2.1 2.6 3.1 3.7 4.3 5.5 6.8 6.9 7.8 8.5 9.3 9.1 9.1
1.7 1.7 1.9 1.9 2.0
2.2 2.4 2.3
2.3 2.5
3.0 3.0 3.0
0.2 0.2 0.2
0.3 0.4
0.4 0.4 0.4
0.4 0.4
0.4 0.5 0.4
0.0
2.0
4.0
6.0
8.0
10.0
12.0
14.0
2002 2003 2004 2005 2006 2007 2008 2009 2010 2011 2012 2013 2014
Mill. M
etric
Ton
s
Marine Diadromous Freshwater
19
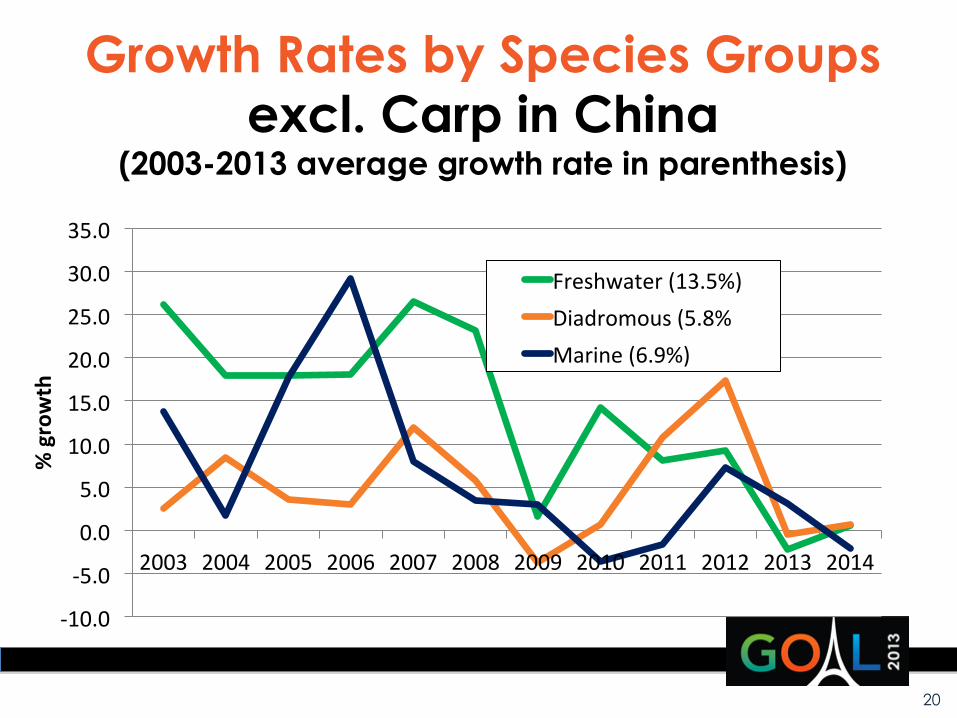
Growth Rates by Species Groups excl. Carp in China
(2003-2013 average growth rate in parenthesis)
-‐10.0
-‐5.0
0.0
5.0
10.0
15.0
20.0
25.0
30.0
35.0
2003 2004 2005 2006 2007 2008 2009 2010 2011 2012 2013 2014
% growth
Freshwater (13.5%) Diadromous (5.8% Marine (6.9%)
20

New Opportunities: Arabian Peninsula
• Ample coastline and superb waters, governments beginning to offer support
• Opportunities for partners with technical expertise and capital to invest
• Jim Greenberg: “Don’t lump all these countries together.”
21

New Opportunities: Africa • Positives: Favorable conditions, thousands of km of
coastline, growing domestic markets
• Constraints: Limited growth capital and lack of political will/systematic approach for aquaculture
• Intl. Finance Corp: Looking for sponsors with “deep experience and strong track record”
22

Feed Sustainability: Where to get protein for feed?
• 70-80% of global supplies of fish meal and fish oil currently used in aqua feeds
• Alternatives to fish protein needed: Soy protein forecast to supply one-half of global aqua feed requirements by 2020
23

Emerging Protein Sources… Time to Get Creative!
Algae
Krill
Insects
2
3
2
4
3

Fish Meal Challenge: Standards Example (from Sustainable Fisheries Partnership):
• Standards established in western countries to suit known production systems may not work elsewhere.
• Asia is the engine room of world aquaculture
production with a huge demand for fish meal. It needs systems that work there.
25

Tropical Asian purse seine catch: 40+ species, including benthic species lured by FADs and/or lights (not all species may go to fish meal). Trawl is even more diverse.
Purse seine catch in Panama

Standards Challenges (cont.) • In this case traceability is very difficult—if not
impossible—and further complicated by species diversity.
• Solution: – Accept that “one size does not fit all” in
standards development. – Diverse stakeholders must work together for
improvements that work for that producer community.
27

Wrapping Up: Today’s Issues
• Carl-Christian Schmidt: “Green Growth and Implications for Fisheries and Aquaculture”
• Health and Nutrition: Seafood Nutrition Partnership
• Retail and Foodservice Panels
28

Health and Nutrition: Addressing Public Health Crisis through Public-Private Partnerships
Seafood Industry
Healthcare Industry
Nonprofits & Foundations
Gov’t Agencies
Corporations Media
Local Communities
29

Doubling Consumption: Seafood Nutrition Partnership
Year 2
A. Provide Seafood Nutrition Education. Strategy: Partner w/ Health Influencers
B. Shape the American Palate. Strategy: Partner w/ Tastemakers
C. Inspire a Healthier America
Feb. Heart Health Month
Feb. Heart Health Month
30
Year 3 Year 1
Feb. Heart Health Month
30
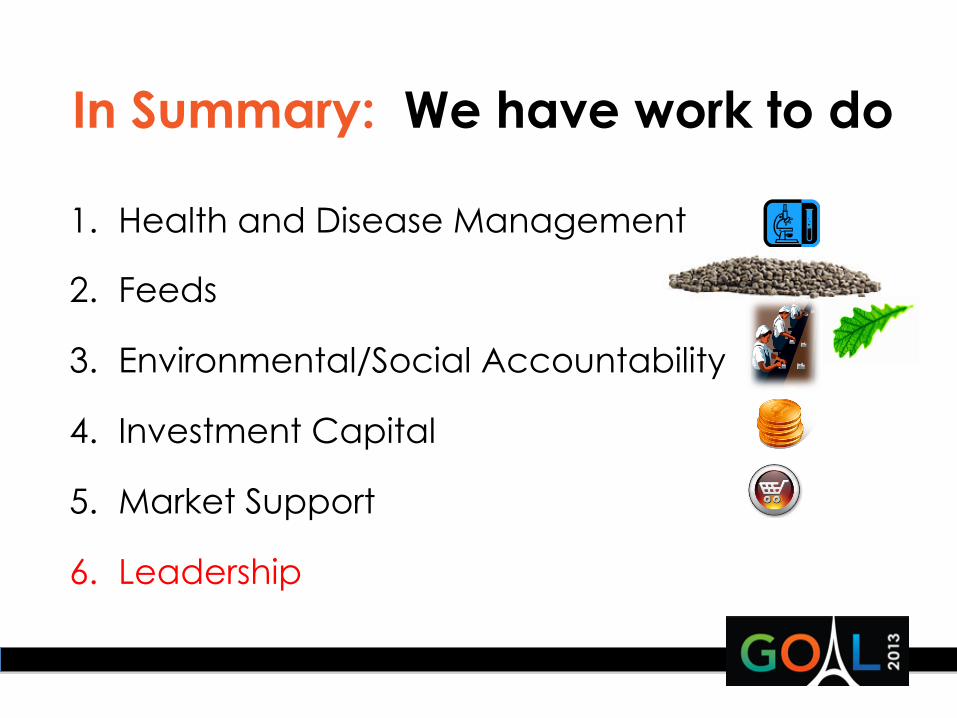
In Summary: We have work to do
1. Health and Disease Management
2. Feeds
3. Environmental/Social Accountability
4. Investment Capital
5. Market Support
6. Leadership

See you in Vietnam for GOAL 2014!
32