sea ice variations influence benthic community growth
TRANSCRIPT

Sea Ice Variations Influence Benthic Community Growth Rates over Decadal Scales: Evidence from Bivalve Population near
the Barents Sea Polar Front Michael L. Carroll1,*, William G. Ambrose, Jr.1, 2, Ben Levin2, Adam Ratner2, Stuart Ryan2, Gregory A. Henkes2,† 1) Akvaplan-niva, Polar Environmental Centre, N-9296 Tromsø, Norway 2) Bates College, Department of Biology, Lewiston, Maine 04240, USA † Current Address: Smithsonian Institution, Museum Conservation Institute, 4210 Silver Hill Road, MRC 534, Suitland, MD 20746-2863 * Corresponding Author: M.L. Carroll Tel: +47 7775 0318 Fax: +47 7775 0301 Email: [email protected] Running Head: Climate forcing and bivalve growth in the Barents Sea
Key Words: Arctic, Arctic Climate Regime Index, Barents Sea, benthic community bivalve
growth, climate oscillation, environmental forcing

Climate forcing and bivalve growth in the Barents Sea
M.L. Carroll et al. 2
Abstract We examined growth of the Arctic bivalve Clinocardium ciliatum from 1977-2006 in the
Barents Sea to evaluate the effect of different water masses on growth and to assess the
influence of climatic forcing on ecological processes over decadal scales. Analysis of
annually-deposited growth lines in shells of 22 individuals from 3 stations allowed us to
assess growth conditions for up to 30 years, thus encompassing both warmer and colder
climatic phases of the last century. Growth rates of specimens at younger ages (6-13 years)
were highest in Atlantic water, resulting in an average size 20% greater compared to similarly
aged individuals from Arctic water or at the Polar Front, reflecting warmer sea temperatures
and/or presumably greater food supplies in the Atlantic-dominated regions of the Barents Sea.
Despite different absolute growth rates, temporal patterns of ontogenetically-adjusted growth
(i.e. Standard Growth Index = SGI) had similar features, with below-average but increasing
SGI throughout the 1980s and culminating in 1994 or 1995 with the highest SGI. An abrupt
decline starting in 1996 led to below-average growth rates for most of the years from the turn
of the century to the end of the record in 2006. The decline in growth coincides with abrupt
phase shifts in two hemispheric oscillatory indices: the North Atlantic Oscillation (NAO) and
the Arctic Climate Regime Index (ACRI). The strongest statistical relationships were found
between growth and the ACRI, and its local manifestations through precipitation. The ACRI
explained 16.9% and 27.7% of the variation in growth at the Atlantic and Arctic stations
respectively while ACRI and annual precipitation together explained 42.1% of the growth at
the Polar Front station. Using a two year running mean of the ACRI improved these
relationships substantially, indicating a lag in the relationship between index and growth.
These results suggest that benthic communities in this area are responding more to regional
climate forcing than local parameters and that the predicted increase of Atlantic water in the
Climate forcing and bivalve growth in the Barents Sea
M.L. Carroll et al. 3
Barents Sea in response to climate change will have an impact on at least suspension feeding
benthic organisms.
Introduction
The abundance of organisms over a wide range of tropic levels is enhanced by oceanic
fronts (Munk et al. 1995; Josefson and Conley, 1997; Hunt and Harrison, 1990; Dewicke et
al., 2002; Mendes et al., 2002; Bluhm et al., 2007). These areas typically are the result of two
different water masses meeting and are characterized by rapid changes in physical, chemical,
and biological conditions over a short horizontal distance. They are commonly observed on a
small scale in tidal estuaries, but can also occur on larger, mesoscales on continental shelves.
Increased abundances of pelagic organisms associated with fronts is likely a consequence of a
combination of increased primary production and the concentration of primary producers into
a relatively narrow zone (Floodgate et al., 1981; Creutzberg, 1985; Franks 1992), with a
cascade up the food chain to higher order predators. Benthic communities under fronts also
receive more food relative to non-front areas because of a combination of higher primary
production in the overlying water column and tighter pelagic-benthic coupling (Creutzberg,
1985; Josefson and Conley, 1997). Regardless of the mechanism, high benthic biomass is
associated with fronts (Creutzberg et al., 1984; Josefson and Conley, 1997; Bluhm et al.,
2007; Carroll et al., 2008). Oceanic fronts are receiving increased attention by
oceanographers because they are hot spots of biodiversity and abundance, but the dynamics of
polar fronts are still relatively poorly studied. Our lack of knowledge of polar fronts has
recently been identified as a gap in our understanding of polar marine systems (ACIA, 2005).
The Polar Front is a well-known feature in the central Barents Sea (Loeng, 1991;
Wassmann et al., 2006), and is the zone where relatively warm and saline Atlantic (> 0ºC, >
34.8 psu) and cold, less saline Arctic (< 0ºC, < 34.8 psu) water masses meet. The convergence
of these two different water masses results in enhanced primary productivity and enriched

Climate forcing and bivalve growth in the Barents Sea
M.L. Carroll et al. 4
pelagic and benthic communities (Carmack and Wassmann, 2006; Carroll et al., 2008). The
location of the front moves on the scale of days to centuries, but in the western Barents Sea it
appears to be more constrained by topography than where it occurs in Russian waters to the
east (Johannessen and Foster, 1978; Harris et al., 1998). Nevertheless, the importance of the
Polar Front’s position is evident in the relationship between the Front’s position and the
distribution of capelin in the Barents Sea over decadal and multi-decadal periods (Vilhjálmsson,
1997a,b). The Barents Sea is an area of rapid climate change and the position of the front is
expected to change in response to Arctic warming. Under future climate change scenarios, the
Barents Sea is predicted to warm and the Atlantic waters in the southern Barents Sea are expected
to spread farther north displacing Arctic water (ACIA, 2005). The effect of this shift in the Polar
Front and the increased incursion of Atlantic water into the Barents Sea on the Barents Sea
ecosystem are unknown.
Sampling Arctic and Atlantic water masses across the narrow Polar Front allows a
comparison of the structure and function of the different biological communities these two
water masses support and insight into the consequences of a change in the position of the
Polar Front due to climate change or other forcing factors. Seafloor communities may be the
best location to examine the impact of the Polar Front on the marine ecosystem because in the
Arctic there is often a close relationship between water column and benthic processes
(Grebmeier et al., 1988; Ambrose and Renaud, 1995; Piepenburg et al., 1997; Wollenburg and
Kuhnt, 2000; Dunton et al., 2005). Therefore, long lived, sessile benthic organisms, may be
more appropriate monitors of change in the overlying water (e.g. Kröncke et al., 1998, 2001;
Dunton et al., 2005) than the more transient pelagic system. Bivalves dominate the benthic
biomass of many Arctic shelves (Zenkevich, 1963; McDonald et al., 1981; Gulliksen et al.,
1985; Grebmeier et al., 1988; Dayton, 1990; Feder et al., 1994). They also incorporate in their
shells a history of environmental conditions at the time of shell formation. This
environmental record coupled with the periodic banding, or growth lines, found in many

Climate forcing and bivalve growth in the Barents Sea
M.L. Carroll et al. 5
bivalves (Rhoads and Pannella, 1970; Clark, 1974; Rhoads and Lutz, 1980) makes it possible
to develop a chronology of environmental conditions over the life of the individual (Andrews,
1972; Hudson et al., 1976; Jones, 1981; Jones et al., 1989; Witbaard, 1996; Witbaard et al.,
1997, 1999; Tallqvist and Sundet, 2000; Schöne et al., 2003; Müller-Lupp and Bauch, 2005;
Ambrose et al. 2006).
Temperature and food are the two main factors influencing bivalve growth (Beukema
et al., 1985; Jones et al., 1989; Beukema and Cadeé, 1991; Lewis and Cerrato, 1997; Witbaard
et al., 1997, 1999; Dekker and Beukema, 1999; Schöne et al., 2005), and both are likely to be
influenced by different water masses and the position of the Polar Front. Sampling bivalves
from Atlantic and Arctic water masses and close to the Polar Front allows us to assess the
impact of these water masses on the growth of a dominant component of the Barents Sea
benthic community. Coupled with measurements of environmental conditions over the last 30
years, it also allows us to indentify the important factors affecting bivalve growth and make a
prediction about future growth in an era of climate change.
Materials and Methods
Sample Collection
Live Clinocardium ciliatum (hairy cockle) were collected from three sites in the
western Barents Sea. Sites were chosen based on CTD data to represent locations in Atlantic
or Arctic water masses or along the polar front separating these two water masses (Fig. 1,
Table 1). Samples were collected from the RV Lance (Norwegian Polar Institute, Tromsø
Norway) between 3 and 7 June, 2007 using a 1 x 1 meter stainless steel triangle dredge
dragged on the seafloor for ten minutes. Live, undamaged cockles were sorted from dredged
material on deck.

Climate forcing and bivalve growth in the Barents Sea
M.L. Carroll et al. 6
At each site, a Seabird CTD was used to characterize the salinity and temperature of
the water column. Data were used to generate TS profiles and these profiles and bottom water
temperature and salinity were used to determine if stations were in Atlantic or Arctic water
based on criteria established by (Loeng, 1991). Station B-14 had bottom water temperature
and salinity representative of Atlantic water (> 0º C and > 34.9 ‰), station B-12 was clearly
in Arctic water (< -1ºC and <34.5 ‰) and station B-5 had characteristics intermediate
between these two (Table 1). An extensive CTD survey in the area made it possible to locate
the polar front at the time of sampling (Figure 1).
Sample Preparation
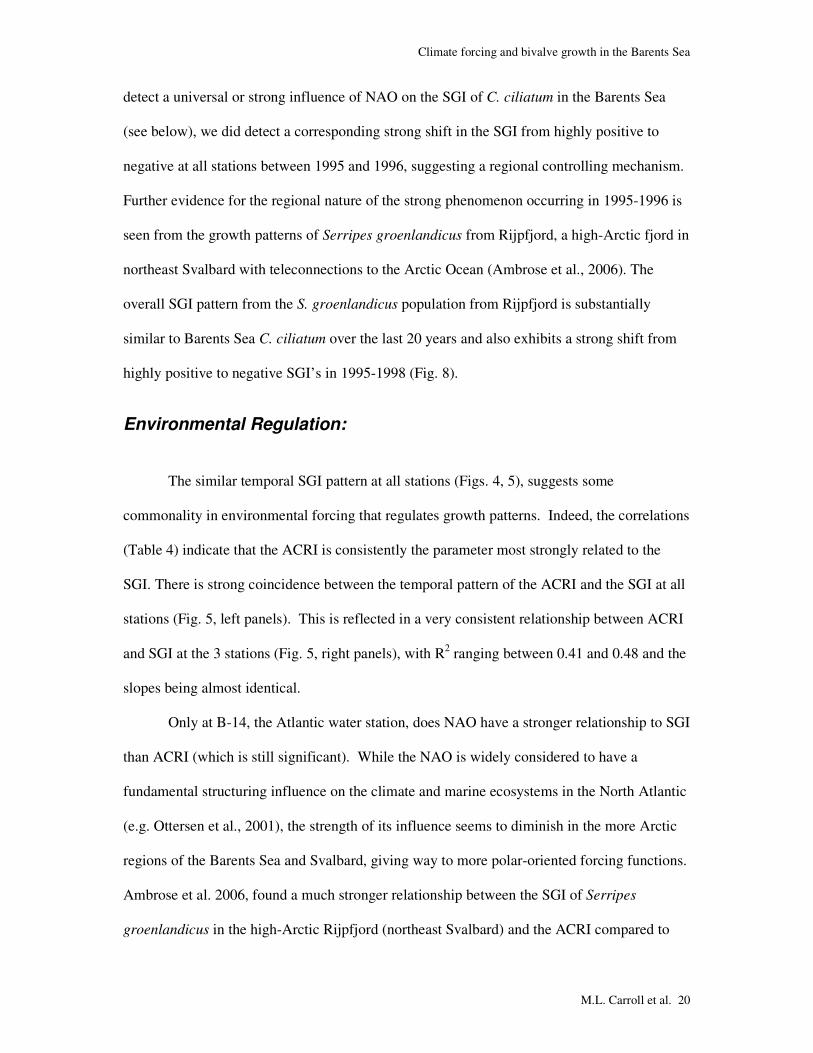
Clinocardium ciliatum have a distinct external banding pattern (Fig. 2), which has
been use to generate growth curves (Tallqvist and Sundet, 2000). We found external lines
hard to interpret. Thus, we compared C. ciliatum ages in a subsample of 9 cockles from
station B-12 using three methods: (1) external lines, (2) lines in the chondrophore exposed in
a cross section of the shell, and (3) exit lines from a cross section of the shell (Fig. 2). Results
of this comparison (see below) convinced us that it was necessary to section shells to examine
exit lines for an accurate determination of age.
Samples were frozen and shucked after returning to port. A Buehler Isomet low speed
diamond saw, running at approximately 90 rpm, was used to cut epoxy-embedded left valves
along the line of maximum growth. Samples were polished with 320, 400, and 600 grit
sandpaper and finished with a polishing cloth and 0.3 micron polishing powder. The polished
samples were imaged using a Nikon stereoscopic zoom microscope SMZ1500 with an
attached 2 mega-pixel digital camera at either 1X or 2X magnification. Images of the
chondrophore were taken at 4X magnification. Individual magnified images were assembled
using Adobe Photoshop into a complete composite image of the clam (Fig. 2).

Climate forcing and bivalve growth in the Barents Sea
M.L. Carroll et al. 7
External lines were clearly visible when a light was shown through the shell. We did
not measure the distance between external lines or between chordophone lines, but counted
them for comparison with the other measures of age. Exit lines were measured on a digital
image from the origin of growth in the chondrophore to where the growth line exited the shell,
using high resolution magnification. An exit line was defined as a distinct line stretching
across the entire ventral margin. Measurements taken from images were in pixels that were
converted to millimeters.
Growth Rates
Shell growth of Clinocardium ciliatum was modeled by fitting the von Bertalanffy
growth function to age and shell height data for each clam using Excel. The von Bertalanffy
function is:
SHt = SH∞ [1-e-k (t-t0
)]; (1)
where t = age in years; SHt = shell height at age t; SH∞ = maximum, asymptotic shell height, k
= growth constant, and t0 = age when SH = 0.
Bivalve growth declines with age, so growth increments within an individual and
among individuals of different ages must be standardized before growth among years can be
compared. We use the methods of Jones et al. (1989) and Ambrose et al. (2006) to derive an
ontogenetically-adjusted measure of annual growth. That method uses the first derivative of
the von Bertalanffy function with respect to time:
dSHt/dt= k*S H∞ e–kt ; (2)
where dSHt/dt = modeled yearly change in shell height. After determining the average yearly
changes in shell height based on growth data from all clams, we calculated the expected
yearly increase in shell height for each clam for each year. We then divided the measured or
observed shell growth for each year by the expected growth for that year to generate a
standardized growth index (SGI). This removes the ontogenetic changes in growth and
Climate forcing and bivalve growth in the Barents Sea
M.L. Carroll et al. 8
equalizes the variance for the entire series (Fritts, 1976). Once annual changes in shell growth
were standardized, we calculated the mean SGI for each calendar year. The result is a record
of year-by-year growth for the C. ciliatum sample, with an SGI greater than 1 indicating a
better than average year for growth, while a value less than one reflects a worse than average
growth year.
The growth rate of individuals at each station was determined by comparing growth
curves (age at shell height) for each station. This was done by generating omega (ω) values
for each individual at each station. The omega value is derived from the von Bertalanffy
growth function (Jones et al., 1989):
ω = S H∞ * k
Because C. ciliatum growth is linear for early years, slopes of a best fit straight line to size at
age relationships were also calculated for individual growth curves.
Environmental Data
We examined relationships between clam growth and other climate indices with
potential influence on the region: the Arctic Climate Regime Index (ACRI), the North
Atlantic Oscillation (NAO) in winter (December, January, February, March) and the Arctic
Oscillation (AO). The AO is the first principal component of the sea level pressure field at
latitudes greater than 20º N (Thompson and Wallace ,1998; Stenseth et al., 2003) while the
ACRI measures variations in Arctic Ocean and ice circulation based on the sea level height
anomaly at the North Pole (Proshutinsky and Johnson, 1997; Johnson et al., 1999;
Proshutinsky, pers. comm. for updated index). The sea surface height anomaly at the North
Pole is indicative of predominant high-Arctic wind pattern. Data for the NAO, using the sea
level pressure difference between Gibraltar and Southwest Iceland (Jones et al., 1997; Osborn
et al., 1999), were obtained from (http://www.cru.uea.ac.uk/cru/data/nao.htm) and for the AO
from (http://www.cpc.ncep.noaa.gov/products/precip/CWlink/daily_ao_index/ao_index.html).

Climate forcing and bivalve growth in the Barents Sea
M.L. Carroll et al. 9
The Barents Sea temperature data (PINRO, Murmansk) is a time series of integrated
ocean temperature from 0-200 m along the Kola transect, which runs from the Kola Peninsula
northward to the ice edge along the 33° 30’E meridian (Bochkov, 1982; Tereshchenko, 1997).
We have used yearly means of Barents Sea temperature in our analysis.
Meteorological data were obtained from the three of the four official weather stations
around Svalbard (Longyearbyen, Bear Island, and Hopen) maintained by The Norwegian
Meteorological Institute (http://eklima.met.no). Daily means of precipitation, pressure, and
temperature were used to calculate seasonal and yearly averages.
Ice conditions were estimated from data collected by the Nimbus-7 SMMR and DMSP
SSM/I passive microwave satellite (Cavalieri et al., 1997). The spatial resolution of the
satellite imagery is 25x25 km, and the cell used for the ice coverage at each station was the
one that included the station. The temporal resolution is daily from 1988 to 2006 and every
second day from 1978 to 1988. We calculated the ice free days per year as the number of days
with ice cover <25% from 1 July to 30 October of a given year; the estimated period of active
growth of C. ciliatum. Maximum ice coverage occurs in March and data were obtained from:
http://nsidc.org/data/seaice_index/archives/index.html.
Statistical analyses
We used both univariate and multivariate statistics to explore relationships between
growth and environmental factors. We calculated Pearson correlation coefficients in order to
determine basic pair-wise relationships between environmental and physical variables and the
SGI. Annual means were compared with environmental variables, and we also investigated
the time-dependence between data in consecutive years, leading us to incorporate two data
transformations: 2 year-running means were used to reduce the magnitude of interannual
variability of both growth rate and environmental data, and a 1-year lag was used to account
for the time for physical processes to be reflected in shell growth.
Climate forcing and bivalve growth in the Barents Sea
M.L. Carroll et al. 10
We also used Principal Component Analysis (PCA) (PRIMER version 6, Primer-E
Ltd.), a multivariate method, to explore the relationships between SGI and environmental
variables (Clarke and Warwick, 2001). Variables used in the PCA analysis were those that
had strong correlation coefficients in the pair-wise comparisons.
Finally, we used the best predictors from the univariate correlation analysis and the
multivariate PCA analysis in multiple regression models for each station.
Growth rates were compared among stations using a one-way ANOVA on both the
omega values and the slopes of the linear regressions, treating each individual as a replicate in
the analyses. Prior to conducting the ANOVAs, variances were examined for homogeneity.
When an ANOVA was significant (P<0.05), differences among stations were examined using
the post hoc Tukey test.
Results
Age Determination
We found substantial differences in cockle ages estimated by the 3 methods used
(Table 2). The lines on the chondrophore cross-section were extremely difficult to read in
both the first and last few years, resulting in severe underestimation of cockle age. The
external lines of whole shells became very difficult to consistently read in the last years of
older clams, leading to both underestimation and overestimation of clam ages. Thus despite
the ease of using external lines, we conclude that this method is not effective in accurately
identifying growth and age in older cockles. The exit lines read from a shell cross section was
the most reliable single method, but very early lines (up to 3-4 years), were typically hard to
discern. Based on these results, we therefore chose the dual-approach of using external lines
to identify very early years, first 1-3 years of growth, and then exit lines reveled in cross
Climate forcing and bivalve growth in the Barents Sea
M.L. Carroll et al. 11
section from that point forward. This combination of approaches proved to be the most
effective aging technique, and was used for all age and growth determinations.
Sample Population Characteristics
We analyzed 22 individual Clinocardium ciliatum, collected from 3 different sites in the
northwest Barents Sea (Table 1). Samples ranged in age from 30 years (B-5) to 20 years (all
stations). The lengths of time series from the samples at these stations are 30 years at B-5, 27
years at B-14 and 23 years at B-12 (Fig. 3). The largest individual in our dataset was 37.7
mm, with a corresponding age of 27 years (B-14). While our survey was not exhaustive, the
oldest individuals in our sample agree with the observations of Tallqvist and Sundet (2000),
suggesting that the maximum age of C. ciliatum in the Barents Sea is not much over 30 years.
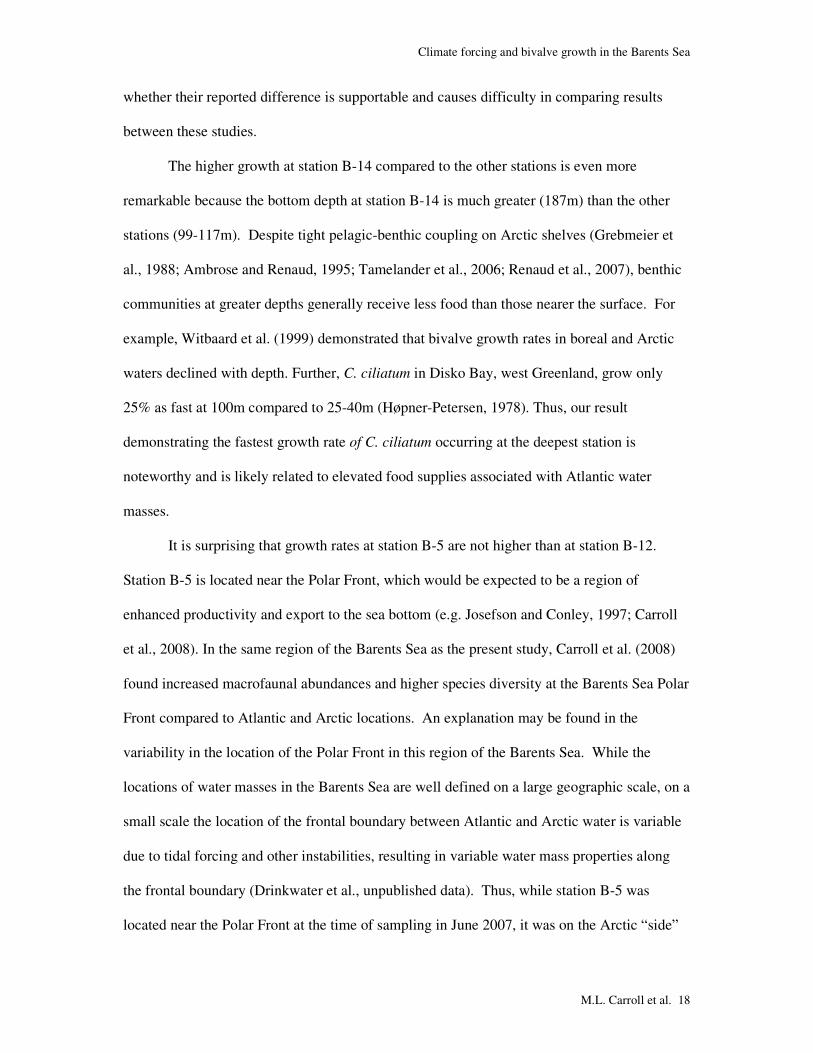
The overall growth rate, represented by the mean size at age, was identical at each of
the sites through age 5, but diverged thereafter (Fig. 3), with the population from station B-14
growing faster from age 5-14 compared to stations B-5 and B-12 which were not different
from each other (ANOVA, P<0.008). This significant difference was almost identical using
the slope and omega methods to calculate absolute growth (Table 3), suggesting strong
agreement of these methods in estimating site-specific growth rates for C. ciliatum.
Standardized Growth Index
The von Bertalanffy growth equations yielded high R2 values (R2 = 0.993 at B-5, R2 =
0.990 at B-12, and R2 = 0.986 at B-14, (P≈0 for all)), indicating that the von Bertalanffy
model was an excellent descriptor of these clams’ growth. This allowed us to confidently
correct for ontogenetic changes in growth with age and confidently generate the expected
growth for each calendar year (Standardized Growth Index = SGI).
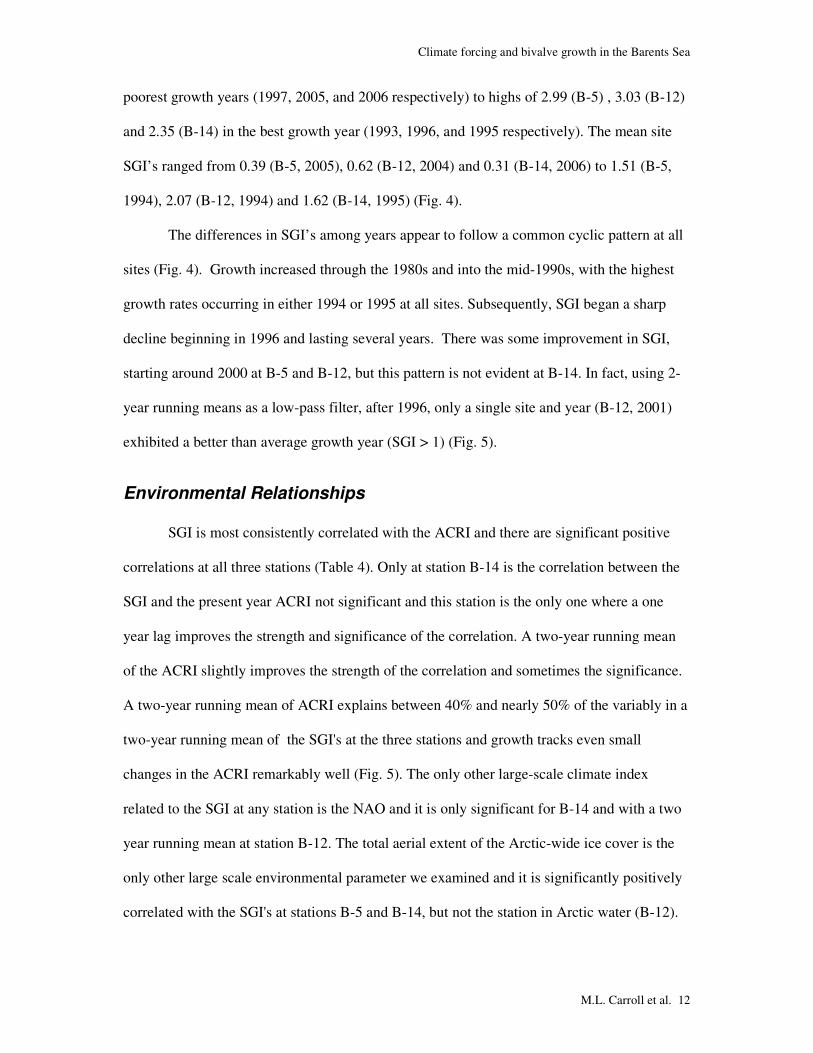
SGI varied considerably over the 23-30 year periods covered by the 3 stations (Fig. 4),
ranging for individual clams between a low of 0.11 (B-5), 0.22 (B-12) and 0.07 (B-14) in the
Climate forcing and bivalve growth in the Barents Sea
M.L. Carroll et al. 12
poorest growth years (1997, 2005, and 2006 respectively) to highs of 2.99 (B-5) , 3.03 (B-12)
and 2.35 (B-14) in the best growth year (1993, 1996, and 1995 respectively). The mean site
SGI’s ranged from 0.39 (B-5, 2005), 0.62 (B-12, 2004) and 0.31 (B-14, 2006) to 1.51 (B-5,
1994), 2.07 (B-12, 1994) and 1.62 (B-14, 1995) (Fig. 4).
The differences in SGI’s among years appear to follow a common cyclic pattern at all
sites (Fig. 4). Growth increased through the 1980s and into the mid-1990s, with the highest
growth rates occurring in either 1994 or 1995 at all sites. Subsequently, SGI began a sharp
decline beginning in 1996 and lasting several years. There was some improvement in SGI,
starting around 2000 at B-5 and B-12, but this pattern is not evident at B-14. In fact, using 2-
year running means as a low-pass filter, after 1996, only a single site and year (B-12, 2001)
exhibited a better than average growth year (SGI > 1) (Fig. 5).
Environmental Relationships
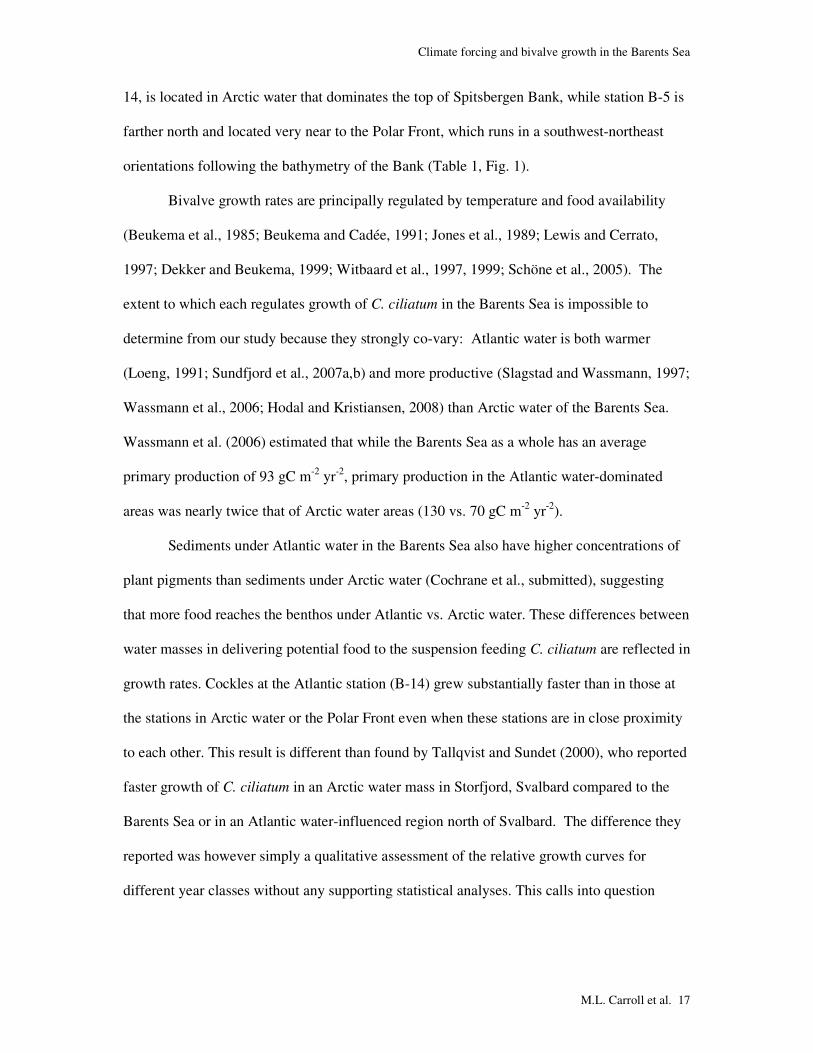
SGI is most consistently correlated with the ACRI and there are significant positive
correlations at all three stations (Table 4). Only at station B-14 is the correlation between the
SGI and the present year ACRI not significant and this station is the only one where a one
year lag improves the strength and significance of the correlation. A two-year running mean
of the ACRI slightly improves the strength of the correlation and sometimes the significance.
A two-year running mean of ACRI explains between 40% and nearly 50% of the variably in a
two-year running mean of the SGI's at the three stations and growth tracks even small
changes in the ACRI remarkably well (Fig. 5). The only other large-scale climate index
related to the SGI at any station is the NAO and it is only significant for B-14 and with a two
year running mean at station B-12. The total aerial extent of the Arctic-wide ice cover is the
only other large scale environmental parameter we examined and it is significantly positively
correlated with the SGI's at stations B-5 and B-14, but not the station in Arctic water (B-12).

Climate forcing and bivalve growth in the Barents Sea
M.L. Carroll et al. 13
Total annual precipitation is the only local environmental parameter related to growth
and there is very little difference in whether the precipitation is recorded on Hopen, closest to
the stations, or in Longyearbyen; the relationship is always positive and except at the Atlantic
water station, B-14, only significant with the two year running mean of the precipitation. The
number of ice free days is only significantly related to growth at the Arctic water station, B-5
and the relationship is negative. Temperature, whether air temperature at Longyearbyen or
Hopen, or water temperature on the Kola transect is not generally related to growth. The one
exception is a negative correlation with the present year’s temperature at Longyearbyen and
growth at station B-5.
Principal component analysis (PCA) generally confirms the results of the univariate
correlation analysis. In PCA, all variables are considered simultaneously. When the results are
depicted graphically, the strength of relationship between two variables is related to the
cosine of the angle between their vectors, so an angle of 90º indicates no relationship and one
of 180º a perfect negative relationship. The length of a vector is the absolute value of the
eigenvector and represents the importance of the variable in explaining variation in the data.
The first two axes of the PCAs explained approximately 60% of the variability in the data at
each of the stations (Fig. 6). The PCAs were nearly identical at Stations B-5 and B-12, and at
these two stations the strongest relationship is between SGI and ACRI. The PCA for station
B-5 shows a negative relationship between SGI and ice free days which is not quite as strong
at Station B-12. There are few strong relationships with SGI revealed by the PCA at Station
B-14. SGI is not a strong contributor to variability with a short vector, small eigenvector, on
the first PCA axis. SGI is, however, positively related to the temperature along the Kola
transect, a relationship not important in the PCAs at the other two stations and not reveled by
the Pearson Correlation analyses.

Climate forcing and bivalve growth in the Barents Sea
M.L. Carroll et al. 14
Modeling Growth
We used the same environmental parameters as in the PCA in determining the best
multiple regression model for each station. For stations B-5 and B-14 the ACRI is the only
parameter that explains a significant amount of variation in the SGI (R2= 0.277, P<0.007 for
station B-5; and R2 = 0.169, P<0.004 for station B-14). In addition to the ACRI, Hopen
precipitation is marginally significant in the multiple regression model for station B-12. These
two parameters together explain 42.1% of the variation in the SGI (P<0.02 for ACRI, and
P<0.17 for Hopen Precipitation). When the observed mean SGI for each year is plotted
against the value predicted by our model, it is evident that the model for station B-12 better
predicts the measured SGI than models for the other stations (Fig. 7). This is because there is
a larger range in the modeled SGI values at B-12 compared to B-5 or B-14.
Discussion
Periodicity of Growth Lines:
We can use shells of bivalves as indicators of climatic processes only if we can
properly interpret and chronologically calibrate markers in the shell. Two conditions must be
fulfilled in order for a specific bivalve population to be useful in interpreting environmental
variability: (1) major increments in the shell must be deposited with a known periodicity, and
(2) we must be able to accurately identify each shell band.
The most common markers used in bivalve growth studies are annual growth bands
secreted during periods of slow or no growth. In the Arctic, the growth band is likely a result
of senescence of the organism during the winter, characterized by cold temperatures and
minimal food availability (Sejr et al., 2002; Richardson, 2001; Ambrose et al., 2006). The
“winter growth check” then essentially marks the end of a calendar year, as the senescent
period encompasses the calendar year boundary.

Climate forcing and bivalve growth in the Barents Sea
M.L. Carroll et al. 15
Growth checks have been demonstrated to be annual in some Arctic species through
mark-recapture studies (Sejr et al., 2002), and analysis of oxygen isotopes (Khim et al., 2003),
and mineral ratios (Ambrose et al., 2006). Growth checks in C. ciliatum have not been
investigated for periodicity, and the one previous study of population dynamics and growth of
C. ciliatum (Tallqvist and Sundet, 2000) assumed that the growth checks were annual. While
we did not explicitly examine the periodicity of growth lines in C. ciliatum, we do concur,
based on several lines of evidence, that these growth checks are annual. First, growth lines are
annual in another Arctic species (Serripes groenlandicus) in the same family (Cardidae) as C.
ciliatum (Khim et al., 2003; Ambrose et al., 2006). Second, we have collected C. ciliatum
from the Barents Sea and Svalbard coastal waters throughout the year, and have observed that
the dark annual line is on the outermost margin of shells collected in winter (December-
February), while those collected in spring (April and May), immediately following the spring
bloom, show clear evidence (e.g. lighter shell color) of new shell growth beyond the last
check (Carroll et al., pers. obs.). This evidence strongly suggests that the annual shell growth
of C. ciliatum begins immediately when fresh food is available, despite water temperatures
being at their coldest at this period of the year. Third, if the growth checks were not annual,
then they would not be expected to correspond closely to inter-annual patterns of
environmental forcing (see below), except by coincidence. Finally, growth patterns of C.
ciliatum closely match that of S. groenlandicus (Fig. 8, discussed further below) which has
demonstrated annual growth checks. While these last two lines of evidence are unconvincing
by themselves, they do support the other evidence that suggests growth checks are annual in
C. ciliatum.
Developing schlerochronological records and identifying relationships between
growth and environmental variables potentially important in regulating growth rates
obviously depends on accurately reading annuli. As schlerochronologies are sequential, errors

Climate forcing and bivalve growth in the Barents Sea
M.L. Carroll et al. 16
in reading lines in any part of the shell record will confound proper assignment of all later
dates. Previous work with C. ciliatum has been confined to using only external lines (Tallqvist
and Sundet, 2000), while the use of cross-sectional exit lines and chondrophore patterns from
sectioned shells have been commonly used in other species such as Arctica islandica, Serripes
groenlandicus, and Mya truncata (exit lines: Schöne, 2003; Kilada et al., 2007;
Chondrophore: Witbaard et al., 1999; Sejr et al., 2002; Amaro et al., 2003; Kilada et al.,
2007). Kilada et al. (2007) compared the three methods using Serripes groenlandicus, finding
that thin sections of the chondrophore revealed the most easily interpretable lines. We found
substantial erosion near the umbo of C. ciliatum and very close lines at the outer shell margins
of adults. We were therefore unsure whether external reading external lines would provide
robust and consistent measurements of annual growth. The subsequent comparison of results
using external lines, cross-sectional exit lines, and chondrophore lines revealed that external
lines were more effective for early years, despite some erosion of the shell (in some cases
shell erosion enhanced the visibility of growth lines), and cross-sectional exit lines were most
robust for all years after the first three to four years of growth (Figure 2). Combining these
two methods proved to be the most effective and reliable method of aging (Table 2). While
we found the chondrophore to be a very inaccurate location to measure growth lines in C.
ciliatum, we did not make thin sections of the chondrophore as Kilada et al. (2007) did in
their study of S. groenlandicus.
Growth rates:
There was a significant difference in overall growth rate among stations, with station
B-14 exhibiting faster growth, and therefore larger size at a given age, compared to stations
B-5 or B-12 (Table 3, Fig. 3). This is likely related to the different water masses dominating
at the different stations. Station B-14 is located in Atlantic water along the slope between the
Hopen Trench and Spitsbergen Bank. Station B-12, although geographically near to station B-
Climate forcing and bivalve growth in the Barents Sea
M.L. Carroll et al. 17
14, is located in Arctic water that dominates the top of Spitsbergen Bank, while station B-5 is
farther north and located very near to the Polar Front, which runs in a southwest-northeast
orientations following the bathymetry of the Bank (Table 1, Fig. 1).
Bivalve growth rates are principally regulated by temperature and food availability
(Beukema et al., 1985; Beukema and Cadée, 1991; Jones et al., 1989; Lewis and Cerrato,
1997; Dekker and Beukema, 1999; Witbaard et al., 1997, 1999; Schöne et al., 2005). The
extent to which each regulates growth of C. ciliatum in the Barents Sea is impossible to
determine from our study because they strongly co-vary: Atlantic water is both warmer
(Loeng, 1991; Sundfjord et al., 2007a,b) and more productive (Slagstad and Wassmann, 1997;
Wassmann et al., 2006; Hodal and Kristiansen, 2008) than Arctic water of the Barents Sea.
Wassmann et al. (2006) estimated that while the Barents Sea as a whole has an average
primary production of 93 gC m-2 yr-2, primary production in the Atlantic water-dominated
areas was nearly twice that of Arctic water areas (130 vs. 70 gC m-2 yr-2).
Sediments under Atlantic water in the Barents Sea also have higher concentrations of
plant pigments than sediments under Arctic water (Cochrane et al., submitted), suggesting
that more food reaches the benthos under Atlantic vs. Arctic water. These differences between
water masses in delivering potential food to the suspension feeding C. ciliatum are reflected in
growth rates. Cockles at the Atlantic station (B-14) grew substantially faster than in those at
the stations in Arctic water or the Polar Front even when these stations are in close proximity
to each other. This result is different than found by Tallqvist and Sundet (2000), who reported
faster growth of C. ciliatum in an Arctic water mass in Storfjord, Svalbard compared to the
Barents Sea or in an Atlantic water-influenced region north of Svalbard. The difference they
reported was however simply a qualitative assessment of the relative growth curves for
different year classes without any supporting statistical analyses. This calls into question
Climate forcing and bivalve growth in the Barents Sea
M.L. Carroll et al. 18
whether their reported difference is supportable and causes difficulty in comparing results
between these studies.
The higher growth at station B-14 compared to the other stations is even more
remarkable because the bottom depth at station B-14 is much greater (187m) than the other
stations (99-117m). Despite tight pelagic-benthic coupling on Arctic shelves (Grebmeier et
al., 1988; Ambrose and Renaud, 1995; Tamelander et al., 2006; Renaud et al., 2007), benthic
communities at greater depths generally receive less food than those nearer the surface. For
example, Witbaard et al. (1999) demonstrated that bivalve growth rates in boreal and Arctic
waters declined with depth. Further, C. ciliatum in Disko Bay, west Greenland, grow only
25% as fast at 100m compared to 25-40m (Høpner-Petersen, 1978). Thus, our result
demonstrating the fastest growth rate of C. ciliatum occurring at the deepest station is
noteworthy and is likely related to elevated food supplies associated with Atlantic water
masses.
It is surprising that growth rates at station B-5 are not higher than at station B-12.
Station B-5 is located near the Polar Front, which would be expected to be a region of
enhanced productivity and export to the sea bottom (e.g. Josefson and Conley, 1997; Carroll
et al., 2008). In the same region of the Barents Sea as the present study, Carroll et al. (2008)
found increased macrofaunal abundances and higher species diversity at the Barents Sea Polar
Front compared to Atlantic and Arctic locations. An explanation may be found in the
variability in the location of the Polar Front in this region of the Barents Sea. While the
locations of water masses in the Barents Sea are well defined on a large geographic scale, on a
small scale the location of the frontal boundary between Atlantic and Arctic water is variable
due to tidal forcing and other instabilities, resulting in variable water mass properties along
the frontal boundary (Drinkwater et al., unpublished data). Thus, while station B-5 was
located near the Polar Front at the time of sampling in June 2007, it was on the Arctic “side”

Climate forcing and bivalve growth in the Barents Sea
M.L. Carroll et al. 19
of the Polar Front, and likely experiences substantial periods of time under the influence of
the Arctic water mass.
Temporal Patterns:
Despite differences in the overall growth rates between stations located in different
water masses, the temporal patterns of their SGI's are similar. At each station the SGI steadily
increased from the start of the chronology in the late 1970’s or early 1980s up until the mid-
1990s. This trend was most dramatic at station B-12, but was evident at all stations (Fig. 4).
Perhaps the most distinctive feature of the temporal pattern is the abrupt decline in the SGI
starting in 1996 and lasting for 3 or 4 years, which resulted in SGI’s below 1.0 by 2000. This
distinct shift in C. ciliatum growth rates in the middle of the mid-1990’s corresponds
precisely in time with a well-known phenomenon in which a number of both physical and
biological components of North Atlantic and Arctic ecosystems marine exhibited a regime
shift at that time. Analysis of sea surface temperature anomalies indicate that a major regime
shift took place in the North Atlantic between 1995 and 1996, with widespread ecological
effects on various components of the marine ecosystem including phytoplankton,
zooplankton, fish and birds (Reid et al., 1998; Beaugrand et al., 2002; Durant et al., 2004;
Richardson and Schoeman, 2004; Hátún et al., 2005; Heath, 2005; Perry et al., 2005; Hansen
and Samuelsen, 2008). On western Svalbard, marine benthic species diversity and abundance
patterns in Kongsfjorden exhibited strong shifts between 1994 and 1996 after years of relative
stasis (Beuchel et al., 2006). These regional phenomena were attributed largely to the
influence of the North Atlantic Oscillation Index (NAO), which shifted abruptly from a strong
positive phase in 1995 to a strong negative phase in 1996. There is evidence of the influence
of the NAO on ecological components in both the terrestrial and marine ecosystems (Ottersen
et al., 2001), including the bivalve Arctica islandica from the North and Norwegian seas
(Schöne et al., 2005), and the 1995/96 shift was a strong signal. Even though we did not
Climate forcing and bivalve growth in the Barents Sea
M.L. Carroll et al. 20
detect a universal or strong influence of NAO on the SGI of C. ciliatum in the Barents Sea
(see below), we did detect a corresponding strong shift in the SGI from highly positive to
negative at all stations between 1995 and 1996, suggesting a regional controlling mechanism.
Further evidence for the regional nature of the strong phenomenon occurring in 1995-1996 is
seen from the growth patterns of Serripes groenlandicus from Rijpfjord, a high-Arctic fjord in
northeast Svalbard with teleconnections to the Arctic Ocean (Ambrose et al., 2006). The
overall SGI pattern from the S. groenlandicus population from Rijpfjord is substantially
similar to Barents Sea C. ciliatum over the last 20 years and also exhibits a strong shift from
highly positive to negative SGI’s in 1995-1998 (Fig. 8).
Environmental Regulation:
The similar temporal SGI pattern at all stations (Figs. 4, 5), suggests some
commonality in environmental forcing that regulates growth patterns. Indeed, the correlations
(Table 4) indicate that the ACRI is consistently the parameter most strongly related to the
SGI. There is strong coincidence between the temporal pattern of the ACRI and the SGI at all
stations (Fig. 5, left panels). This is reflected in a very consistent relationship between ACRI
and SGI at the 3 stations (Fig. 5, right panels), with R2 ranging between 0.41 and 0.48 and the
slopes being almost identical.
Only at B-14, the Atlantic water station, does NAO have a stronger relationship to SGI
than ACRI (which is still significant). While the NAO is widely considered to have a
fundamental structuring influence on the climate and marine ecosystems in the North Atlantic
(e.g. Ottersen et al., 2001), the strength of its influence seems to diminish in the more Arctic
regions of the Barents Sea and Svalbard, giving way to more polar-oriented forcing functions.
Ambrose et al. 2006, found a much stronger relationship between the SGI of Serripes
groenlandicus in the high-Arctic Rijpfjord (northeast Svalbard) and the ACRI compared to

Climate forcing and bivalve growth in the Barents Sea
M.L. Carroll et al. 21
the NAO. In the present study, the ACRI also predominates as the driver at the Arctic and
Polar Front stations (B-12 and B-5, respectively), while the NAO shows up at the Atlantic-
dominated station (B-14).
Of the local manifestations of the large-scale drivers, precipitation (at Hopen and/or
Longyearbyen) sometimes gave strong relationships, ice cover at the sites was important only
at station B-5, and yet maximum Arctic-wide ice cover had a significant relationship at 2 of 3
sites. In these offshore, relatively deep locations, we doubt that precipitation per se, has such
a strong direct influence on growth rates as indicated in the correlations. We infer however,
that precipitation is probably the measurable local manifestation of the environmental
regulation occurring at these locations. For example, periods of low NAO are associated with
a greater frequency of stormy conditions in the Arctic, with both higher precipitation and
stronger wave action. These factors could substantially affect food availability to the benthos
through maintenance or disruption of the pycnocline with a resulting influence on primary
production (Josefson and Conley, 1997; Sakshaug, 1997, 2004) or via resuspension of food-
containing bottom sediments (Witbaard et al., 2005). Even at the depths of these stations,
there are episodic events of bottom currents strong enough to resuspend sediments (Sternberg
et al., 2001). There was not a strong signal between local ice cover and growth rates, with ice
free days being related to growth only at the Polar Front station (B-5). We view this result as
indicative of the strong heterogeneity of both the bathymetry, the distribution of bottom
sediments, and the variability in hydrographic processes. These all interact to provide a
complex environmental situation and obscuring a strong signal of sea ice on growth rates.
Tallqvist and Sundet (2000) also found no relationship between local ice cover and either
overall growth rates or annual relationship to relative growth, and suggesting that the ice
cover was decoupled from food supply in the region.
Climate forcing and bivalve growth in the Barents Sea
M.L. Carroll et al. 22
There was however a significant relationship between the maximum extent of winter ice in
the Arctic and relative growth at two of three sites, providing further support for the
conclusion of overriding regulation of bivalve growth by large-scale (hemispheric)
environmental phenomena.
The multiple regression analysis in order to develop a model of C. ciliatum growth for each
site yielded variable success in terms of variance explained and tightness of fit between
observed and modeled vales for each year. At two sites (B-5 and B-14), a single variable only,
ACRI, had a significant explanatory value on SGI, while at B-12, the model included ACRI
and precipitation. While significant, the two sites with only ACRI had a much lower
proportion of variance in SGI explained by the model (28 and 17%), compared to the site with
both ACRI and precipitation as predictors (42%). This is also evident when comparing the
observed vs. modeled SGI values for each year (Fig. 7). Sites which included only a single
predictor (B-5 and B-14) had modeled values which were constrained in a much smaller range
than the observed values, while the site whose model both the large-scale and local factor (B-
12) had a much better reflection of the observed values. This both limits the predictive
capability of the models of these populations, given the present set of environmental variables
and leads to the conclusion that while the large scale climatic regulation of these populations
is evident, this overriding influence by itself is inadequate to understand all the influences
leading to growth patterns in the Barents Sea.
The Barents Sea shelf is complex both bathymetrically and hydrographically, with myriad
factors interacting at different spatial and temporal scales that ultimately lead to a growth rate
of C. ciliatum in a given year. But given this complexity it is remarkable that a single large
scale factor, the ACRI, consistently is the most reliable overriding influence on C. ciliatum
growth in the Barents Sea. While there is a clear effect of water mass, with populations in
Atlantic water growing faster than their Arctic brethren, the importance of the Polar Front on

Climate forcing and bivalve growth in the Barents Sea
M.L. Carroll et al. 23
growth was not evident in this study. One reason for this may be related to the larger
geographic area covered by the three sites in the present study, which may obscure patterns
over a much smaller spatial scale commensurate with the variability in the Polar Front
location. Therefore, a follow-up study focusing on a much more limited geographic area
crossing the Polar Front would provide substantially better information on the influence of
this hydrographic feature would seem warranted.
Our results, taken together, suggest changes in benthic communities will occur as a result of
climate change. Given the demonstrated strong linkage between bivalve growth rates and
hemispheric climatic phenomena, if the positive phase of the ACRI and NAO (represent
warmer and wetter conditions) are reflective of future conditions then we can also expect the
benthos to be affected. If climate change results in increased Atlantic water regions in the
Barents Sea as predicted, the result will clearly be increased growth of C. ciliatum. If the
higher growth rate of cockles we observed at station B-14 compared to the Polar Front and
Arctic water stations is a consequence differences in food, then other components of the
benthic community, particularly, suspension feeders, can also be expected to respond to the
change in water mass distribution.
Acknowledgements This study was financially supported by the Norwegian Research Council through the
International Polar Year project “Norwegian Component of the Ecosystem Studies of
Subarctic and Arctic Regions (NESSAR)” led by K. Drinkwater (Institute of Marine
Research, Bergen Norway). Additional funding was provided by the Howard Hughes
Medical Institute through Bates College, and an internal grant from Akvaplan-niva. We thank
the captain and crew of the R/V Lance and cruise-leader V. Pavlov. The Bates College
Imaging Center provided advanced photographic and imaging facilities, and M. Inion
Climate forcing and bivalve growth in the Barents Sea
M.L. Carroll et al. 24
provided laboratory support. We also acknowledge K. Drinkwater for project leadership and
insightful discussions on physical oceanographic properties of frontal processes.
References
ACIA, 2005. Impacts of a warming arctic: Arctic climate impact assessment. Cambridge
University Press, Cambridge, UK.
Amaro, T., Duineveld, G., Bergman, M., Witbaard, R., 2003. Growth variations in the bivalve
Mya truncata: a tool to trace changes in the Frisian Front macrofauna (southern North
Sea)? Helgoland Marine Research 57, 132–138.
Ambrose, W.G., Renaud, P.E., 1995. Benthic Response to Water Column Productivity
Patterns - Evidence for Benthic-Pelagic Coupling in the Northeast Water Polynya.
Journal of Geophysical Research-Oceans 100, 4411-4421.
Ambrose, W.G., Carroll, M.L., Greenacre, M., Thorrold, S., McMahon, K., 2006. Variation in
Serripes groenlandicus (Bivalvia) growth in a Norwegian high-Arctic fjord: Evidence
for local- and large-scale climatic forcing. Global Change Biology 12, 1595-1607.
Andrews, J.T., 1972. Recent and fossil growth rates of marine bivalves, Canadian Arctic, and
Late-Quaternary arctic Marine environments. Paleogeography, Paleoclimatology,
Paleoecology 11, 157-176.
Beaugrand, G., Reid, P.C., Ibañez, F., Lindley, J.A., Edwards, M., 2002. Reorganization of
North Atlantic marine copepod biodiversity and climate. Science 296, 1692-1694.
Beuchel, F., Gulliksen, B., Carroll, M.L., 2006. Long-term patterns of rocky bottom
macrobenthic community structure in an Arctic fjord (Kongsfjorden, Svalbard) in
relation to climate variability (1980-2003). Journal of Marine Systems 63, 35-48.
Beukema, J.J., Knoll, E., Cadée, G.C., 1985. Effects of temperature on the length of the
annual growing season of the Tellinid bivalve Macoma balthica (L.) living on tidal
flats in the Dutch Wadden Sea. Journal of Experimental Marine Biology and Ecology
90, 129-144.
Beukema, J.J., Cadée, G.C., 1991. Growth of the bivalve Macoma balthica in the Wadden
Sea during a period of eutrophication: relationships with concentrations of pelagic
diatoms and flagellates. Marine Ecology Progress Series 68, 249-256.

Climate forcing and bivalve growth in the Barents Sea
M.L. Carroll et al. 25
Bluhm, B.A., Coyle, K.O., Konar, B., Highsmith, R., 2007 High gray whale relative
abundances associated with an oceanographic front in the south-central Chukchi Sea.
Deep Sea Research II 54, 2919-2933.
Bochkov, Y.A., 1982. Water temperature in the 0-200m layer in the Kola Meridian Section in
the Barents Sea, 1900-1981 (in Russian), Sb. Nauchn. Trud., Polar Research Institute
of Marine Fisheries and Oceanography (PINRO), Murmansk, 46, 113-122.
Carmack, E., Wassmann, P., 2006. Food webs and physical-biological coupling on pan-Arctic
shelves: Unifying concepts and comprehensive perspectives. Progress in
Oceanography 71, 446-477.
Carroll, M.L., Denisenko, S.G., Renaud, P.E., Ambrose Jr., W.G., 2008. Benthic infauna of
the seasonally ice-covered western Barents Sea: Patterns and relationships to
environmental forcing. Deep Sea Research II, in press
doi:10.1016/j.dsr2.2008.05.022
Cavalieri, D., Parkinson, C., Gloerson, P., Zwally, H.J., 1997 (updated 2004). Sea ice
concentrations from Nimbus-7 SMMR and DMSP SSM/I passive microwave data,
January 1979 to December 2003. National Snow and Ice Data Center, Boulder,
Colorado, USA. Digital media and CD-ROM (http://nsidc.org/data/nsidc-0051.html).
Clark, G.R., 1974. Growth lines in invertebrate skeletons. Annual Review of Earth and
Planetary Science 2, 77-99.
Clarke, K.R., Warwick, R.M., 2001. Change in marine communities: an approach to statistical
analysis and interpretation. PRIMER-E, Plymouth UK, p. 172.
Creutzberg, F.C., 1985. A persistent chlorophyll a maximum is coinciding with an enriched
benthic zone. In: Gibbs, P.E. (ed.), Proceedings of the 19th European Marine Biology
Symposium. Cambridge University Press, pp. 97–108.
Creutzberg, F., Wapenaar, P., Duineveld, G., Lopez, N.L., 1984. Distribution and density of
the benthic fauna in the southern North Sea in relation to bottom characteristics and
hydrographic conditions. Rapp. P.-v. Réun. Cons. perm. int. Explor. Mer 183,101–
110.
Dayton, P.K., 1990. Polar benthos. In: Smith, W.O. (ed.), Polar Oceanography, Part B
Chemistry, Biology, and Geology. Academic Press, San Diego, pp. 631-685.
Climate forcing and bivalve growth in the Barents Sea
M.L. Carroll et al. 26
Dekker, R., Beukema, J., 1999. Relations of summer and winter temperatures with dynamics
and growth of two bivalves, Tellina tenuis and Abra tenuis, on the northern edge of
their intertidal distribution. Journal of Sea Research 42, 207-220.
Dewicke, A., Rottiers, V., Mees, J., Vincx, M., 2002. Evidence for an enriched hyperbenthic
fauna in the Frisian front (North Sea). Journal of Sea Research 47, 121–139.
Dunton, K.H., Goodall, J.L., Schonberg, S.V., Grebmeier, J.M., Maidment, D.R., 2005.
Multi-decadal synthesis of benthic–pelagic coupling in the western arctic: Role of
cross-shelf advective processes. Deep Sea Research II 52, 3462-3477.
Durant, J.M., Anker-Nielssen, T., Hjermann, D.Ø., Stenseth, N.C., 2004. Regime Shifts in the
breeding of an Atlantic puffin population. Ecology Letters 7, 388-394.
Feder, H.M., Naidu, A.S., Jewett, S.W., Hameedi, J.M., Johnson, W.R., Whitledge, T.E.,
1994. The northeastern Chukchi Sea: benthos-environmental interactions. Marine
Ecology Progress Series 111, 171-190.
Franks, P.J.S., 1992. Sink or swim: accumulation of biomass at fronts. Marine Ecology
Progress Series 82, 1–12.
Fritts, H.C., 1976. Tree Rings and Climate. Academic Press, New York, 567 pp.
Floodgate, G.D., Fogg, G.E., Jones, D.A., Lochte, K., Turley, C.M., 1981. Microbiological
and zooplankton activity at a front in Liverpool Bay. Nature 290, 133–136.
Grebmeier, J.M., McRoy, C.P., Feder, H.M., 1988. Pelagic-benthic coupling on the shelf of
the northern Bering and Chukchi Seas I: Food supply and carbon cycling. Marine
Ecology Progress Series 48, 57-67.
Gulliksen, B., Holte, B., Jakola, K.-J., 1985. The soft bottom fauna in Van Mijenfjord and
Raudfjord, Svalbard. In: Gray, J.S., Christiansen, M.E. (eds.), Marine Biology of
Polar Regions and Effects of Stress on Marine Organisms. Proceedings XVIIIth
European Marine Biology Symposium. J Wiley and Sons, New York, pp. 199-215.
Harris, C.L., Plueddemann, A.J., Gawarkiewicz, G.G., 1998. Water mass distribution and
polar front structure in the western Barents Sea. Journal of Geophysical Research-
Oceans 103, 2905-2917.
Hansen, C., Samuelsen, A., 2008. Interannual differences in simulated primary production in
the Norwegian Sea connected to variations in NAO. Abstract, 2008 Ocean Science
Meeting, 2-7 March 2008, Orlando, Florida USA. p. 152.

Climate forcing and bivalve growth in the Barents Sea
M.L. Carroll et al. 27
Hátún, H., Sandø, A.B., Drange, H., Hansen, B., Valdimarsson, H., 2005. Influence of the
Antlatic Subpolar Gyre on the Thermohaline Circulation. Science 309, 1841-1844.
Heath, M.R., 2005. Changes in the structure and function of the North Sea fish foodweb,
1973-2000, and impacts of fishing and climate. ICES Journal of Marine Science 62,
405-411.
Hunt Jr., G.L., Harrison, N.M., 1990. Foraging habitat and prey taken by least auklets at King
Island, Alaska. Marine Ecology Progress Series 65, 141–150.
Hodal, H., Kristiansen, S., 2008. The importance of small-celled phytoplankton in spring
blooms at the marginal ice zone in the northern Barents Sea. Deep Sea Research II, in
press.
Høpner-Petersen, G., 1978. Life cycles and population dynamics of marine benthic bivalves
from the Disko bugt area of west Greenland. Ophelia 17, 95-120.
Hudson, I., Shinn, E., Halley, R., Lidz, B., 1976. Sclerchronology: a new tool for interpreting
past environments. Geology 4, 361-364.
Johannessen, O.M., Foster, L.A., 1978. A note on the topographically controlled oceanic
Polar Front in the Barents Sea. Journal of Geophysical Research 83, 4567-4571.
Johnson, M.A., Proshutinsky, A.Y., Polyakov, I.V., 1999. Atmospheric patterns forcing two
regimes of Arctic circulation: A return to anticyclonic conditions? Geophysical
Research Letters 26, 1621-1624.
Jones, D.S., 1981. Annual growth increments in shells of Spisula solidissima recorded marine
temperature variability. Science 211,165-165.
Jones, D.S., Arthus, M.A., Allard, D.J. 1989. Sclerochronological records of temperature and
growth from shells of Mercenaria mercenaria from Narragansett Bay, Rhode Island.
Marine Biology 102, 225-234.
Jones, P.D., Jonsson, T., Wheeler, D., 1997. Extension to the North Atlantic Oscillation using
early instrumental pressure observations from Gibraltar and South-West Iceland.
International Journal Climatology 17, 1433-1450.
Josefson, A.B., Conley, D.J., 1997. Benthic response to a pelagic front. Marine Ecology
Progress Series147, 49–62.

Climate forcing and bivalve growth in the Barents Sea
M.L. Carroll et al. 28
Khim, B.-K., Kranz, D.E., Cooper, L.W., Grebmeier. J.M., 2003. Seasonal discharge to the
western Chukchi Sea shelf identified in stable isotope profiles of mollusk shells.
Journal of Geophysical Research 108 (C9), 3300, doi:10.1029/2003JC001816
Kilada, R.W., Roddick, D., Mombourquette, K., 2007. Age determination, validation, growth
and minimum size of sexual maturity of the Greenland Smoothcockle (Serripes
groenlandicus, Bruguiere, 1789) in Eastern Canada. Journal of Shellfish Research
26(2), 443-450.
Kröncke, I., Dippner, J.W., Heyen, H., Zeiss, B., 1998. Long-term changes in macrofaunal
communities off Norderney (East Frisia, Germany) in relation to climate variability.
Marine Ecology Progress Series 167, 25-36.
Kröncke, I., Zeiss, B., Rensing, C., 2001. Long-term variability in macrofauna species
composition off the island of Norderney (East-Frisia, Germany) in relation to changes
in climatic and environmental conditions. Senckenbergiana Maritima 31, 65-82.
Lewis, D.E., Cerrato, R.M., 1997. Growth uncoupling and the relationship between shell
growth and metabolism in the soft shell clam Mya arenaria. Marine Ecology Progress
Series 158, 177-189.
Loeng, H., 1991. Features of the physical oceanographic conditions in the Barents Sea. Polar
Research 10, 5-18.
McDonald, J., Feder, H.M., Hoberg, M., 1981. Bivalve mollusks of the Southeastern Bering
Sea. In: Hood, D.W., Calder, J.A. (eds.), The Eastern Bering Sea Shelf: Oceanography
and Resources. University of Washington Press, Seattle. pp. 1155-1204.
Mendes, S., Turrell, W., Lütkebohle, T., Thompson, P., 2002. Influence of the tidal cycle and
a tidal intrusion front on the spatio-temporal distribution of coastal bottlenose
dolphins. Marine Ecology Progress Series 239, 221–229.
Müller-Lupp, T., Bauch, H.A., 2005. Linkage of Artic shelf atmospheric circulation and
Siberian shelf hydrography: a proxy validation using δ18O records of bivalve shells.
Global Planetary Change 48,175-186.
Munk, P., Larsson, P.O., Danielsen, D., Moksness, E., 1995. Larval and small juvenile cod
Gadus morhua concentrated in the highly productive areas of a shelf break front.
Marine Ecology Progress Series 125, 21–30.

Climate forcing and bivalve growth in the Barents Sea
M.L. Carroll et al. 29
Osborn, T.J., Briffa K.R., Tett, S.F.B., Jones, P.D., Trigo, R.M., 1999 Evaluation of the North
Atlantic Oscillation as simulated by a coupled climate model. Climate Dynamics 15,
685-702.
Ottersen, G. Planque, B. Belgrano A., Post, E., Reid, P.C., Stenseth, N.C., 2001. Ecological
effects of the North Atlantic Oscillation. Oecolgica 128, 1-14.
Perry, A.L., Low, P.J., Ellis, J.R., Reynolds, J.D., 2005. Climate change and distribution shifts
in marine fisheries. Science 308, 1912-1915.
Piepenburg, D., Ambrose, W.G. Jr., Brandt, A., Renaud, P.E., Ahrens, M.J., Jensen, P., 1997.
Benthic community patterns reflect water column processes in the Northeast Water
Polynya (Greenland). Journal of Marine Systems 10, 476-482.
Proshutinsky, A., Johnson, M., 1997. Two circulation regimes of the wind-driven Arctic
Ocean. Journal of Geophysical Research 102, 12493-12512.
Reid, P.C., Planque, B., Edwards, M., 1998. Is observed variability in long-term results of the
Continuous Plankton Recorder survey a response to climate change? Fisheries
Oceanography 7, 282-288.
Renaud, P.E., Riedel, A., Michel, C., Morata, N., Gosselin, M., Juul-Pedersen, T., Chiuchiolo,
A., 2007. Seasonal variation in benthic community oxygen demand: A response to an
ice algal bloom in the Beaufort Sea, Canadian Arctic? Journal of Marine Systems 67,
1-12.
Rhoads, D.C., Panella, G., 1970. The use of molluscan shell growth patterns in ecology and
paleoecology. Lethaia 3, 143-161.
Rhoads, D.C., Lutz, R.A. (eds.), 1980. Skeletal Growth of Aquatic Organisms: Biological
Records of Environmental Change. Plenum Press, New York, 750 pp.
Richardson, C.A., 2001. Molluscs as archives of environmental change. Oceanography and
Marine Biology: An Annual Review 39, 103-164.
Richardson, A.J., Schoeman, D.S., 2004. Climate impact on plankton ecosystems of the North
Atlantic. Science 305, 1609-1612.
Sakshaug, E., 1997. Biomass and productivity distributions and their variability in the Barents
Sea. ICES Journal of Marine Science 54, 341-350
Climate forcing and bivalve growth in the Barents Sea
M.L. Carroll et al. 30
Sakshaug, E., 2004. Primary and secondary production in the Arctic Seas. In: Stein, R,
Macdonald, R.M. (eds.), The Organic Carbon Cycle in the Arctic Ocean. Springer
Verlag, Heidelberg, pp. 57-81.
Schöne, B.R., Oschmann, W., Rössler J., Freyre Castro, A.D., Houk, S.D., Kröncke, I.,
Dreyer, W., Janssen, R., Rumohr, H., Dunca, E., 2003. North Atlantic Oscillation
dynamics recorded in shells of a long-lived bivalve mollusk. Geology 31, 1037-1042.
Schöne, B.R., Houk, S.D., Freyre Castro, A.D., Fiebig, J., Oschmann, W., Kröncke, I.,
Dreyer, W., Gosselck, F., 2005. Daily growth rates in shells of Arctica islandica:
Assessing sub-seasonal environmental controls on a long-lived bivalve mollusk.
Palaios 20, 78-92.
Sejr, M., Jensen, K.T., Rysgaard, S. 2002. Annual growth bands in the bivalve Hiatella
arctica validated by a mark-recapture study in NE Greenland. Polar Biology 25, 794-
796.
Slagstad, D., Wassmann, P., 1997. Climate change and carbon flux in the Barents Sea: 3-D
simulations of ice-distribution, primary production and vertical export of particulate
organic matter. National Institute of Polar Research, Special Issue 51, 119-141.
Stenseth, N.C., Ottersen, G., Hurrell, J.W., Mysterud, A., Lima, M., Chan, K.-S., Yoccoz,
N.G., Adlandsvik, B., 2003. Studying climate effects on ecology through the use of
climate indices: the North Atlantic Oscillation, El Niño Southern Oscillation and
beyond. Proceedings of the Royal Society of London 270, 2087-2096.
Sternberg, R.W., Aagaard, K., Cacchione, D., Wheatcroft, R.A., Beach, R.A., Roach, A.T.,
Marsden, M.A.H., 2001. Long-term near-bed observations of velocity and
hydrographic properties in the northwest Barents Sea with implications for sediment
transport. Continental Shelf Research 21, 509-529.
Sundfjord, A., Fer, I., Kasajima, Y., Svendsen, H., 2007a. Observations of turbulent mixing
and hydrography in the marginal ice zone of the Barents Sea. Journal of Geophysical
Research 112, C05008, doi:10.1029/2006JC003524.
Sundfjord, A., Ellingsen, I., Slagstad, D., and Svendsen, H., 2007b. Vertical mixing in the
marginal ice zone of the northern Barents Sea – results from numerical model
experiments. Deep-Sea Research-II, Deep Sea Research II, in press
doi:10.1016/j.dsr2.2008.05.07

Climate forcing and bivalve growth in the Barents Sea
M.L. Carroll et al. 31
Tallqvist M.I., Sundet, J.H., 2000. Annual growth of the cockle Clinocardium ciliatum in the
Norwegian Arctic (Svalbard area). Hydrobiologia 440, 331-338.
Tamelander, T., Renaud, P.E., Hop, H., Carroll, M.L., Ambrose, W.G., Hobson, K.A., 2006.
Trophic relationships and pelagic-benthic coupling during summer in the Barents Sea
Marginal Ice Zone, revealed by stable carbon and nitrogen isotope measurements.
Marine Ecology Progress Series 310, 33-46.
Tereshchenko, V.V., 1997. Seasonal and interannual temperature and salinity variations of
main flows at the Kola section of the Barents Sea. Polar Research Institute of Marine
Fisheries and Oceanography (PINRO), Murmansk, 71pp. (with updates).
Thompson, D., Wallace, J., 1998. The Arctic Oscillation signature in the wintertime
geopotential height and temperature fields. Geophysical Research Letters 25, 1297-
1300.
Vilhjálmsson, H., 1997a. Interactions between capelin (Mallotus villosus) and other species
and the significance of such interactions for the management and harvesting of marine
ecosystems in the northern North Atlantic. Rit Fiskideildar 40, 31-63.
Vilhjálmsson, H., 1997b. Climatic variations and some examples of their effects on the
marine ecology of Icelandic and Greenland waters, in particular during the present
century. Rit Fiskideildar, 40, 7-29.
Wassmann, P., Reigstad, M., Haug, T., Rudels, B., Carroll, M.L., Hop, H., Gabrielsen, G.W.,
Falk-Petersen, S., Denisenko, S.G., Arashkevich, E., Slagstad, D., Pavlova, O., 2006.
Food webs and carbon flux in the Barents Sea. Progress in Oceanography 71, 232-
287.
Witbaard, R., 1996. Growth variations in Arctica islandica L. (Mollusca): a reflection of
hydrography-related food supply. ICES Journal of Marine Science 53, 981-987.
Witbaard, R., Franken, R., Visser, B., 1997. Growth of juvenile Arctica islandica under
experimental conditions. Helgolander Meeresuntersuchungen 51, 417-431.
Witbaard, R., Duineveld, G.C.A., de Wilde, P.A.W.J., 1999. Geographic differences in
growth rates of Arctica islandica (Mollsuca: Bivalvia) from the North Sea and
adjacent waters. Journal of the Marine Biological Association of the UK 79, 907-915.
Witbaard, R., Jansma, E., Sass Klaassen, U., 2003. Copepods link quahog growth to climate.
Journal of Sea Research 50, 77-83.

Climate forcing and bivalve growth in the Barents Sea
M.L. Carroll et al. 32
Witbaard, R., Duineveld, G.C., Amaro, T., Bergman, M.J., 2005. Growth trends in three
bivalve species indicate climate forcing on the benthic ecosystem in the southeastern
North Sea. Climate Research 30, 29-38.
Wollenburg, J.E., Kuhnt, W., 2000. The response of benthic foraminifera to carbon flux and
primary production in the Arctic Ocean. Marine Micropaleontology, 40, 189-231.
Zenkevich, L.A., 1963. Biology of the seas of the USSR. George Allen and Unwin Ltd.,
London.

Climate forcing and bivalve growth in the Barents Sea
M.L. Carroll et al. 33
Tables and Figures Table 1. Station information for the three collection sites of Clinocardium ciliatum in the northwest Barents Sea.
Station Location Latitude
(°N) Longitude
(°E)
Water Depth
(m)
Bottom Water
Temp. (ºC)
Bottom Salinity (psu)
Water Mass
No. Analyzed
Date Collected
(2007)
B-5 East Hopen
Bank 76˚30.33 27˚29.87’ 117 -0.90 34.63 Polar Front 11 3 June
B-12 Spitsbergen
Bank 75˚39.80 24˚01.14’ 99 -1.05 34.49 Arctic 8 6 June
B-14 Spitsbergen
Bank 75˚00.06 25˚05.82’ 187 0.68 34.86 Atlantic 3 7 June

Climate forcing and bivalve growth in the Barents Sea
M.L. Carroll et al. 34
Table 2. Comparison of ages determined for Clinocardium ciliatum from Station B-12 by analyzing growth lines from three different methods (exit lines on cross-section, external lines of whole shell, and chondrophore from cross-section).
Sample Exit Lines External Lines Chondrophore Both External and Exit Lines
1,2
B12-1 19 21 13 20
B12-2 23 21 17 23
B12-4 23 20 13 21
B12-5 21 22 18 23
B12-6 19 21 16 22
B12-7 22 17 12 22
B12-8 18 23 12 20
B12-9 21 N.A.3 19 21
1 Using external lines on umbo for the first few years of growth until agreement is found between the exit and external lines, and then using exit lines for the remainder.
2 Method used for statistical analysis. 3 Shell was too eroded to analyze.
Climate forcing and bivalve growth in the Barents Sea
M.L. Carroll et al. 35
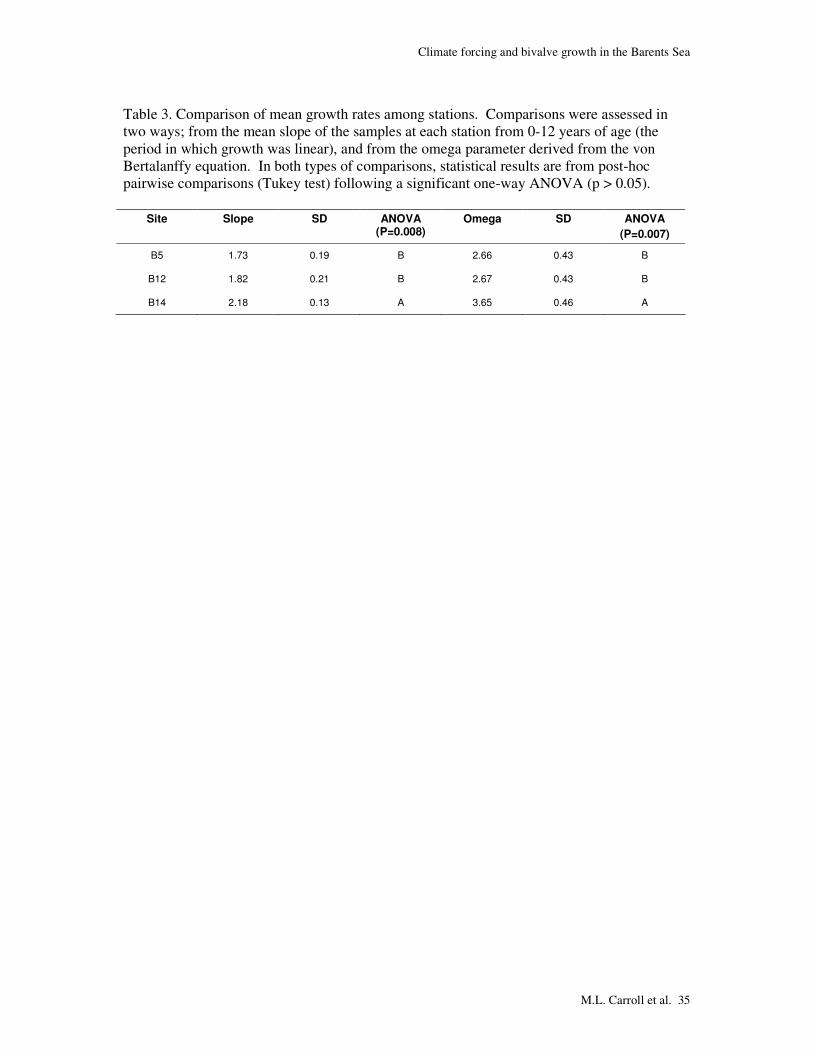
Table 3. Comparison of mean growth rates among stations. Comparisons were assessed in two ways; from the mean slope of the samples at each station from 0-12 years of age (the period in which growth was linear), and from the omega parameter derived from the von Bertalanffy equation. In both types of comparisons, statistical results are from post-hoc pairwise comparisons (Tukey test) following a significant one-way ANOVA (p > 0.05).
Site Slope SD ANOVA (P=0.008)
Omega SD ANOVA
(P=0.007)
B5 1.73 0.19 B 2.66 0.43 B
B12 1.82 0.21 B 2.67 0.43 B
B14 2.18 0.13 A 3.65 0.46 A

Climate forcing and bivalve growth in the Barents Sea
M.L. Carroll et al. 36
Table 4. Coefficients from Pearson correlations relating Clinocardium ciliatum standard growth index (SGI) to various environmental variables at each site, 1977-2006. The first column of coefficients at each site is from present year data. The second column has the environmental data lagged by 1 year with respect to growth. The third column shows relationships using 2-year running means (previous and present year) of environmental data. Bold lettering denotes a significant correlation at the P < 0.01 level. The levels of the significant correlations are: * P<0.01, ** P<0.001
B-5 B-12 B-14
Environmental Variable Present Year
Lagged Running Mean
Present Year
Lagged Running Mean
Present Year
Lagged Running Mean
NAO1 0.33 0.21 0.37 0.29 0.50 0.53* 0.61* 0.38 0.68**
AO2 0.36 0.27 0.39 0.27 0.46 0.47 0.51 0.29 0.52
ACRI3 0.59* 0.46 0.67** 0.63* 0.38 0.65* 0.52 0.62* 0.71**
Precipitation (Hopen)4 0.46 0.35 0.48* 0.49 0.50 0.56* 0.72** 0.51 0.69**
Temperature (Hopen)5 -0.47 -0.19 -0.37 0.17 0.17 0.19 -0.40 -0.32 -0.41
Precipitation (Longyearbyen)6 0.38 0.35 0.53* 0.48 0.32 0.58* 0.34 0.43 0.56*
Temperature (Longyearbyen)7 -0.49* -0.18 -0.39 0.11 0.06 0.10 -0.49 -0.45 -0.53
Kola Transect Temperature8 0.03 0.09 -0.03 0.12 0.30 0.20 0.19 -0.08 -0.01
Ice Free Days9 -0.52* -0.12 -0.37 -0.16 -0.07 -0.13 0.24 0.29 0.20
Max Arctic Ice Extent10
0.52* 0.42 0.49* -0.10 -0.11 -0.14 0.59* 0.75** 0.58*
1. Winter North Atlantic Oscillation Index (from December, January, February, March). 2. Winter Arctic Oscillation Index (from December, January, February, March). 3. Arctic Climate Regime Index (Annual) 4. Total Annual Precipitation from Hopen Island. 5. Average annual temperature from Hopen Island. 6. Total Annual Precipitation from Longyearbyen. 7. Average annual temperature from Longyearbyen. 8. Average Annual sea temperature on the Kola Transect 9. Number of days with ice concentration <25% at the sampling site 10. The total aerial extent of the Arctic-wide ice cover at its maximum extent (March).
Climate forcing and bivalve growth in the Barents Sea
M.L. Carroll et al. 37
B12
B14
B05
Bear Island
20 E 30 Eo o
Hopen Island
78 No
76 No
74 NoAtlantic currentsArctic currentsPolar front
SVALBARD
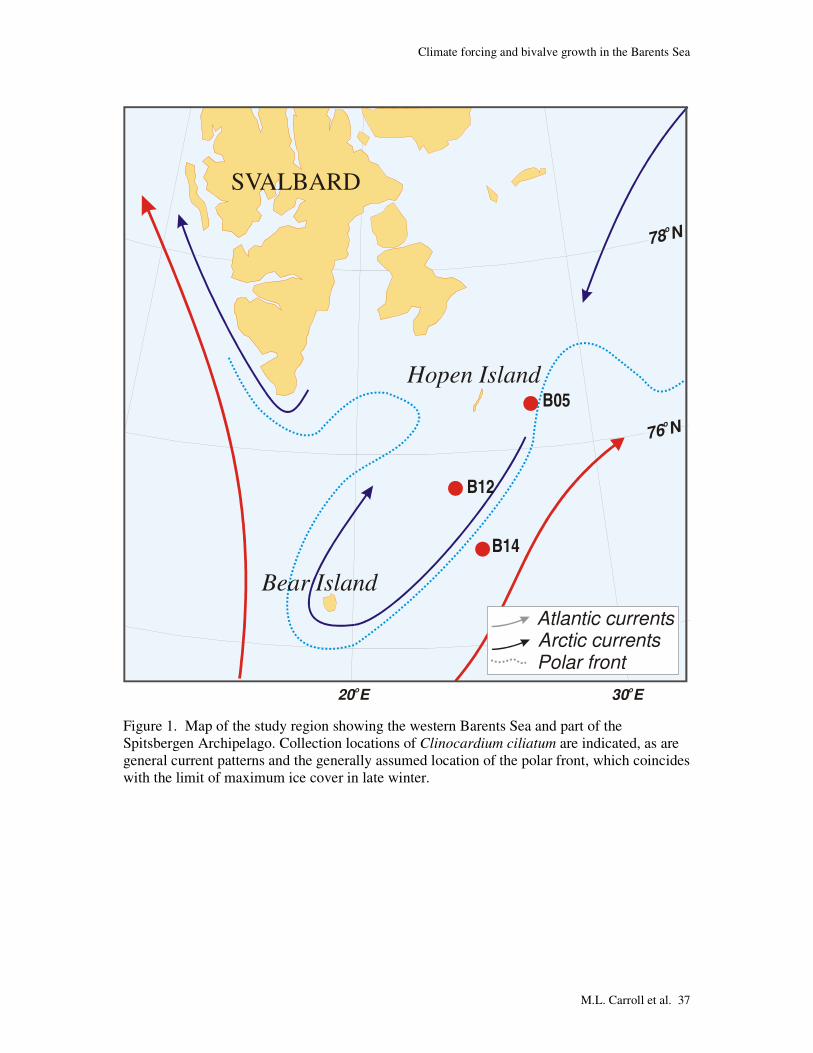
Figure 1. Map of the study region showing the western Barents Sea and part of the Spitsbergen Archipelago. Collection locations of Clinocardium ciliatum are indicated, as are general current patterns and the generally assumed location of the polar front, which coincides with the limit of maximum ice cover in late winter.
Climate forcing and bivalve growth in the Barents Sea
M.L. Carroll et al. 38
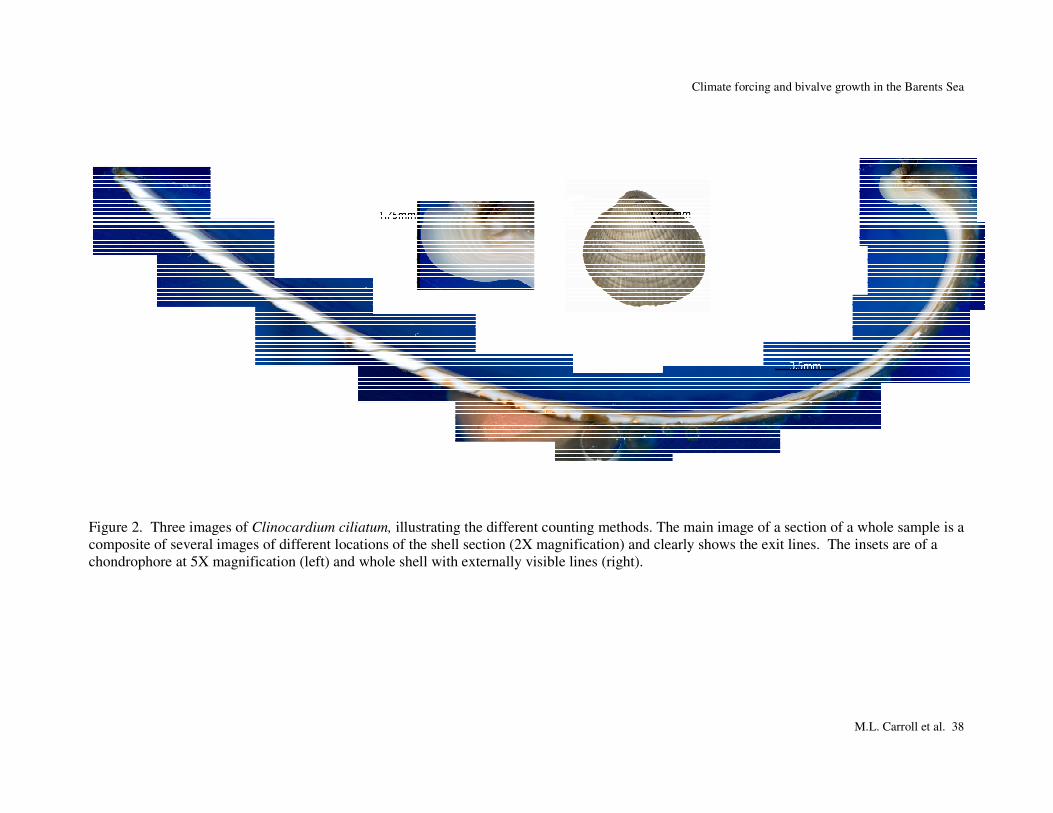
Figure 2. Three images of Clinocardium ciliatum, illustrating the different counting methods. The main image of a section of a whole sample is a composite of several images of different locations of the shell section (2X magnification) and clearly shows the exit lines. The insets are of a chondrophore at 5X magnification (left) and whole shell with externally visible lines (right).

Climate forcing and bivalve growth in the Barents Sea
M.L. Carroll et al. 39
Age (years)
0 5 10 15 20 25 30
Siz
e (
mm
)
0
10
20
30
40
B5
B12
B14
Figure 3. Mean size at age for populations at each sampling site. See Table 1 for sample sizes. Error bars excluded for graphical clarity.

Climate forcing and bivalve growth in the Barents Sea
M.L. Carroll et al. 40
1980 1990 2000
0.5
1.0
1.5
2.0 B5
1980 1990 2000
Sta
nd
ard
Gro
wth
In
de
x (
SG
I)
0.5
1.0
1.5
2.0
1980 1990 2000
0.5
1.0
1.5
2.0
1980 1990 2000
0.5
1.0
1.5
2.0
B12
B14 B5,12,14
Calendar Year
Figure 4. Mean Standard Growth Index (SGI), ± standard error, of Clinocardium ciliatum from 3 sites in the Barents Sea collected live in 2007. Growth increments were calculated by measuring both internal and external lines, and von Bertalanffy growth curves were used to remove the ontogenetic trend and standardize populations for comparison. An SGI greater than 1 is considered a relatively good growth year while less then 1 is a relatively poor growth year.
Climate forcing and bivalve growth in the Barents Sea
M.L. Carroll et al. 41
-2 -1 0 1 2
0.5
1.0
1.5B5
1980 1990 2000
-2
-1
0
1
2
0.5
1.0
1.5
R2 = 0.41
-2 -1 0 1 2
0.5
1.0
1.5B12
1980 1990 2000
AC
RI
(ru
nnin
g m
ea
n)
-2
-1
0
1
2
SG
I (r
un
nin
g m
ea
n)
0.5
1.0
1.5
R2 = 0.46
ACRI (running mean)
-2 -1 0 1 2
0.5
1.0
1.5B14
1980 1990 2000
-2
-1
0
1
2
0.5
1.0
1.5
R2 = 0.48
Year
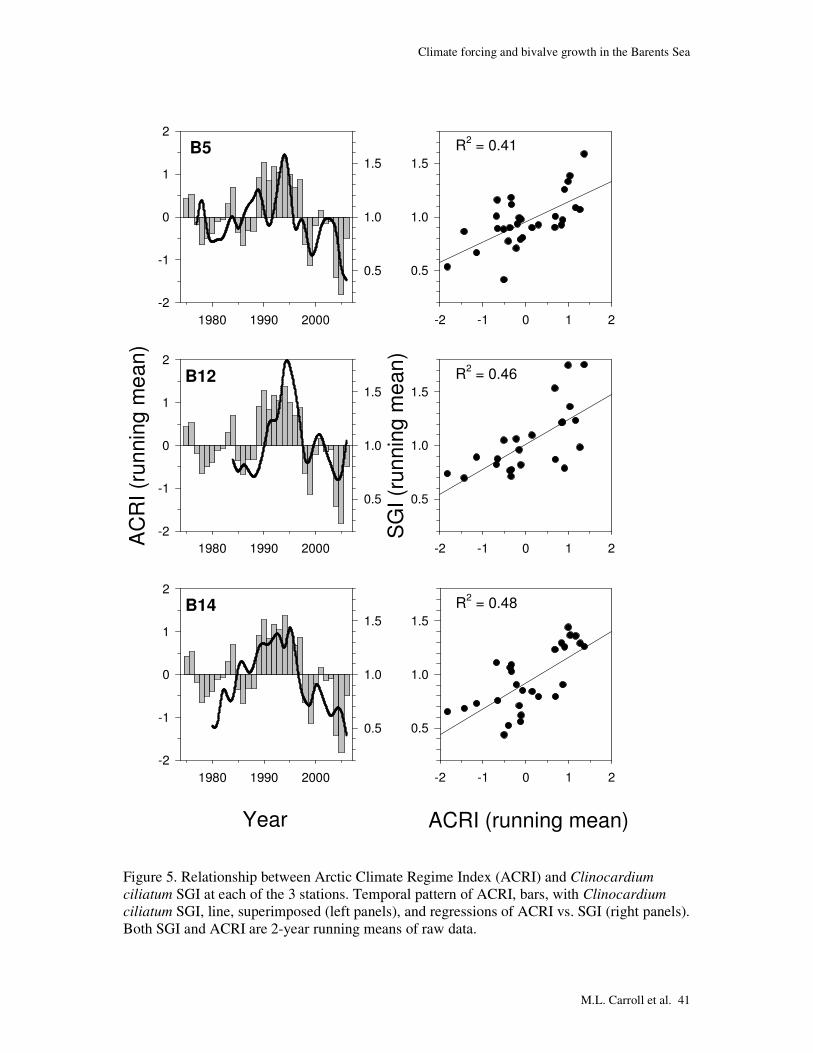
Figure 5. Relationship between Arctic Climate Regime Index (ACRI) and Clinocardium
ciliatum SGI at each of the 3 stations. Temporal pattern of ACRI, bars, with Clinocardium
ciliatum SGI, line, superimposed (left panels), and regressions of ACRI vs. SGI (right panels). Both SGI and ACRI are 2-year running means of raw data.

Climate forcing and bivalve growth in the Barents Sea
M.L. Carroll et al. 42
B-5
-4 -2 0 2 4
PC1 (41.2%)
-2
0
2
4
PC
2 (2
0%
)
SGIACRI
Kola Temp.
Hopen Precip.
Max Ice
NAO Winter
Ice Free da.
B-12
-4 -2 0 2 4
PC1 (39.8%)
-2
0
2
4
PC
2 (
22
.4%
)
SGI
ACRI
Kola Temp.
Hopen Precip.
Max Ice
NAO Winter
Ice Free da.
B-14
-4 -2 0 2 4
PC1 (38.8%)
-2
0
2
4
PC
2
(21
.0%
)
SGI
ACRI
Kola Temp.
Hopen Precip.
Max Ice
NAO Winter
Ice Free da.
Figure 6. Results of Principle Component Analysis (PCA), relating environmental variables to Clinocardium ciliatum growth (SGI) for the each site. Only environmental variables with significant correlations are included in the analysis.

Climate forcing and bivalve growth in the Barents Sea
M.L. Carroll et al. 43
0.0 0.5 1.0 1.5 2.0
SG
I (O
bse
rved
)
0.0
0.5
1.0
1.5
2.0
SGI (Modelled)
0.0 0.5 1.0 1.5 2.0 0.0 0.5 1.0 1.5 2.0
B5 B12 B14
Figure 7. Scatterplot of observed vs. modeled SGI from each site (1977-2006). The model is the result of a multiple regression at each site, and line in each plot represents a perfect prediction by the model of actual growth rates of the Clinocardium ciliatum population.
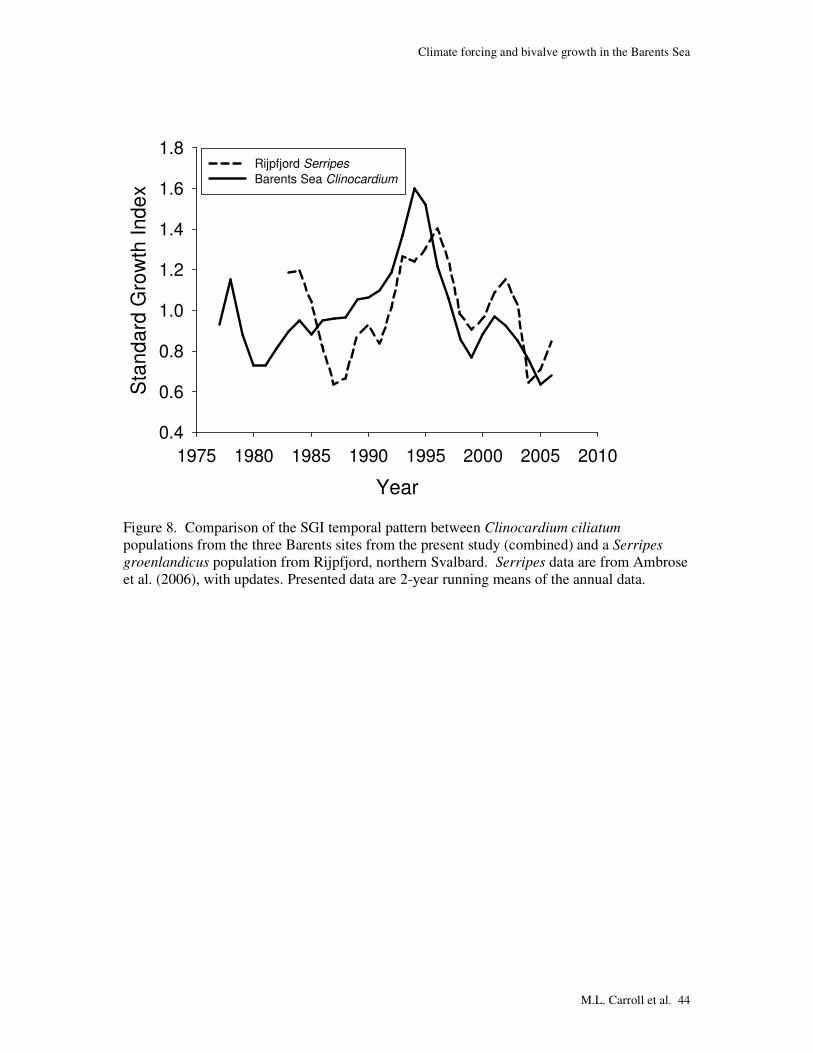
Climate forcing and bivalve growth in the Barents Sea
M.L. Carroll et al. 44
Year
1975 1980 1985 1990 1995 2000 2005 2010
Sta
nd
ard
Gro
wth
In
de
x
0.4
0.6
0.8
1.0
1.2
1.4
1.6
1.8Rijpfjord Serripes
Barents Sea Clinocardium
Figure 8. Comparison of the SGI temporal pattern between Clinocardium ciliatum populations from the three Barents sites from the present study (combined) and a Serripes
groenlandicus population from Rijpfjord, northern Svalbard. Serripes data are from Ambrose et al. (2006), with updates. Presented data are 2-year running means of the annual data.